hemogram responses in goats toward challenged … of hemogram profile in goats due to inoc-ulation...
TRANSCRIPT
Veterinary World, EISSN: 2231-0916 655
Veterinary World, EISSN: 2231-0916Available at www.veterinaryworld.org/Vol.10/June-2017/14.pdf
RESEARCH ARTICLEOpen Access
Hemogram responses in goats toward challenged with Corynebacterium pseudotuberculosis and its immunogen mycolic acids
Mohammed Naji Odhah1,2, Faez Firdaus Jesse Abdullah1,3, Abd Wahid Haron1, Mohd. Azmi Mohd. Lila4, Mohd. Zamri-Saad4, Zaid Khuder1, Idris Umar Hambali1,5, Muhammed Umar1,6, Wessam Monther Saleh1,7
1. Department of Veterinary Clinical Studies, Faculty of Veterinary Medicine, Universiti Putra Malaysia, 43400 Serdang, Selangor, Malaysia; 2. Department of Veterinary Medicine, Faculty of Agriculture and Veterinary Medicine, Thamar University, Dhamar, Yemen; 3. Department of Veterinary Clinical Studies, Research Center for Ruminant Disease,
Universiti Putra Malaysia 43400 Serdang Selangor, Malaysia; 4. Department of Veterinary Pathology and Microbiology, Faculty of Veterinary Medicine, Universiti Putra Malaysia, 43400 Serdang, Selangor, Malaysia; 5. Department of Veterinary
Public Health and Preventive Medicine, University of Maiduguri, Nigeria; 6. Department of Animal Reproduction, Faculty of Verterinary and Animal Sciences, University of Agriculture, Water and Marine Sciences, Uthal, Baluchistan, Pakistan;
7. Department of Internal and Preventive Medicine, Faculty of Veterinary Medicine, University of Basra, Basra, Iraq.Corresponding author: Faez Firdaus Jesse Abdullah, e-mail: [email protected]
Co-authors: MNO: [email protected], AWH: [email protected], MAML: [email protected], MZS: [email protected], ZK: [email protected], IUH: [email protected],
MU: [email protected], WMS: [email protected]: 25-11-2016, Accepted: 21-03-2017, Published online: 17-06-2017
doi: 10.14202/vetworld.2017.655-661 How to cite this article: Odhah MN, Abdullah FFJ, Haron AW, Mohd. Lila MA, Zamri-Saad M, Khuder Z, Hambali IU, Umar M, Saleh WM (2017) Hemogram responses in goats toward challenged with Corynebacterium pseudotuberculosis and its immunogen mycolic acids, Veterinary World, 10(6): 655-661.
AbstractAim: This study was conducted to analyze the changes in blood profile of goats inoculated with Corynebacterium pseudotuberculosis and its immunogen mycolic acid (MA) extract.
Materials and Methods: A total of 12 clinically healthy crossbred Boer female goats were divided into three groups; A, B and C (4 goats each per group). Group A was inoculated with 2 ml sterile phosphate buffered saline via intradermal route as the negative control group whilst Group B was inoculated with 2 ml of MA extract (1 g/ml) intradermally and Group C was then inoculated with 2 ml (1×10⁹) colony forming unit of active C. pseudotuberculosis intradermally. Blood sample was collected aseptically from the jugular vein periodically for complete blood count (CBC) analysis throughout the experimental period (3 months).
Result: A significant decrease (p<0.05) was observed in red blood cells, hemoglobin (Hb), packed cell volume, mean corpuscular volume and mean corpuscular Hb concentration in Groups B and C as compared to the control while WBCs, neutrophil, lymphocyte and basophil showed a significant increase (p<0.05) as compared to the control.
Conclusion: The inoculation of C. pseudotuberculosis and MA resulted in a significant change in the CBC, thereby, indicating that MA has a role in caseous lymphadenitis pathogenesis.
Keywords: complete blood count, Corynebacterium pseudotuberculosis, goat, hematology, mycolic acid.
Introduction
The alteration in blood during infectious dis-eases is discovered earlier in a hemogram and other blood biochemistry parameters which give an idea of the pathological conditions associated with the alter-ations. These alterations are as a result of the patho-gen’s interaction with the immune components of the host [1,2]. The host immune components respond variably to different pathogens, pathogenesis, and inflammatory reactions. Acute bacterial infections are characterized by increased neutrophilic activity, while the chronic bacterial infections are characterized by lymphocytosis and monocytosis [3,4].
The incubation period of caseous lymphadeni-tis (CLA) ranges between 3 and 20 weeks, however, shorter incubation periods were reportedly associ-ated [5,6] where few animals may likely develop clini-cal signs such as fever, changes in heart and respiratory rates, in appetence and decreased food consumption. CLA was reported not to have any significant changes on hemogram in goats that were challenged with Corynebacterium pseudotuberculosis bacterin, but a remarkable difference reflected significantly on the leukogram between the challenged groups at various sampling time [7-9]. Gameel and Tartour reported that sheep experimentally challenged with C. pseudotu-berculosis bacteria showed alterations in the plasma proteins and the hemogram [10].
A report in 2016 indicated that serum amyloid A (SAA) had no response in relation to C. pseudo-tuberculosis and phospholipase D (PLD); how-ever, haptoglobin did record a significant response to C. pseudotuberculosis and PLD [10]. The above report clearly infers that there is inverse relationship
Copyright: Odhah, et al. Open Access. This article is distributed under the terms of the Creative Commons Attribution 4.0 International License (http://creativecommons.org/licenses/by/4.0/), which permits unrestricted use, distribution, and reproduction in any medium, provided you give appropriate credit to the original author(s) and the source, provide a link to the Creative Commons license, and indicate if changes were made. The Creative Commons Public Domain Dedication waiver (http://creativecommons.org/publicdomain/zero/1.0/) applies to the data made available in this article, unless otherwise stated.
Veterinary World, EISSN: 2231-0916 656
Available at www.veterinaryworld.org/Vol.10/June-2017/14.pdf
between C. pseudotuberculosis, PLD and acute phase protein concentration in goats. Therefore, future study on the effects of C. pseudotuberculosis and PLD on SAA will provide the gap of information [10].
In 2015, Mahmood et al. reported that C. pseudo-tuberculosis inoculations sequel into an appreciable response leading to changes in blood biochemistry, leukogram and hemogram [11]. The endotoxin (PLD) when inoculated also indicated a positive response in CLA pathogenesis; this further provides a window to better understanding of CLA pathogenesis and the major role PLD plays in the disease occurrence in goat with the various effects noticed in the blood biochem-istry, hemogram and leukogram [12].
The cell walls of Corynebacterium spp. have a complex structure and are mostly considered a vir-ulence factor in the occurrence of C. pseudotuber-culosis [13,14]. The cell wall lipids signatures are 2-branched 3-hydroxy fatty acid which is usually named mycolic acid (MA) [15]. These buildings units in C. pseudotuberculosis expressed above are the main virulence factor found on the cell wall, and they contribute to its survival ability as a facultative intracellular parasite [16]. The most interesting aspect is that MA found in these bacteria exerts cytotoxic effects [17]. In several studies, it was shown that MA can be purified from C. pseudotuberculosis and inoc-ulated in mice [18], the effects of which induces clin-ical signs such as congestion, hemorrhagic necrosis, and local edema [18]. In-vitro studies indicated that the phagocytic activity of WBC degenerated signifi-cantly during C. pseudotuberculosis infection [19] and that C. pseudotuberculosis bacterin resists cellular digestion by phagocytes [20], due to the subsequent development of abscesses. Many research have stated that the virulence factor of C. pseudotuberculosis is associated with the lipid contents of cell wall [21]. The information of hemogram profile in goats due to inoc-ulation with MA extracted from C. pseudotuberculosis is scare. Therefore, the study aims to investigate and profile the hemogram responses in goats challenged with C. pseudotuberculosis and its immunogen MA.Materials and MethodsEthical approval
The experimental procedure was approved to be conducted under the Animal Care and Use Ethics Committee (IACUC No. R046/2015), Universiti Putra Malaysia (UPM) as required by the Animal Welfare Act (2015) in Malaysia.Bacteria and MA extraction
The C. pseudotuberculosis strain used in this study was originally isolated from chronic clinical case of CLA at TPU UPM goat farm [22]. The iso-lates were then sent to the Veterinary Laboratory Service Unit, Department of Veterinary Pathology and Microbiology at UPM for identification and con-firmation. MA was extracted following the method described by Daffe and Etienne [23].
Animals and experimental inoculations protocolA total of 12 adult healthy crossbred Boer female
goats aged between 16 and 20 months, and average weight of 20±5 kg were screened twice in the space of 3 months for CLA using the agar gel immune diffu-sion test before the onset of the actual experiment. The goats were housed in a facility isolated from the main faculty building. The house was fumigated and rested for 2 weeks before commencement of the experi-ments. The goats were randomly subdivided into three different groups consisting of four goats in each group similar to the procedure of Junior et al. [7] where the first group was inoculated with phosphate-buffered solution intradermally as the negative control (2 ml). The second group of goats was inoculated with 2 ml of MAs (1 mg/ml) intradermally, and third group goats were inoculated with (2 ml) C. pseudotuberculosis 1 × 10⁹ colony forming unit intradermally [11]. Blood collections were done via jugular vein at the first 24 h; thereafter, it continued for every 24 h post-inoculation for the first 7 days of the experiment. Subsequently, the blood collection was done twice a week up to 12 weeks post-inoculation. During the experimental procedure, feces and other waste products generated were regularly removed and disposed.Complete blood count (CBC)
Blood samples were analyzed using Animal Blood Counter (ABC™). The examined parameters were red blood cell (RBC), packed cell volume (PCV), hemoglobin (Hb), mean corpuscular volume (MCV), mean corpuscular Hb concentration (MCHC), neutro-phils, lymphocytes, monocytes, basophils, eosinophil and total protein.Statistical analysis
Data obtained were analyzed using a statistical software JMP (version 9.0.1 SAS Institute Inc., Cary, NC, USA). Repeated measures ANOVA compar-ing values of treated groups and the control groups were conducted. All values obtained were reported as a mean±standard error and considered significant at p<0.05.ResultsCBC
The result for the complete blood count is as pre-sented below.
RBCs countThere was significant decreased (p<0.05) in
RBCs count in weeks 10 and 12 in Group 3 as com-pared to the Group A. While MA inoculated Group B showed no changes in the RBCs count (Table-1).
Concentration of HbThe concentration of Hb indicated a significant
decreased (p<0.05) in weeks 2, 3 and 12 in the Group C as compared to the control group and a significant decreased (p<0.05) in week 4 in Kindly provide text part Group B as compared with the control (Table-2).
Veterinary World, EISSN: 2231-0916 657
Available at www.veterinaryworld.org/Vol.10/June-2017/14.pdf
PCVGroup C indicated a significant increased
(p<0.05) in weeks 3, 4 and 10 as compared with the control, while Group B showed a significant (p<0.05) increased in week 2 as compared with the control (Table-3).
MCVGroup C showed a significant increased
(p<0.05) in weeks 2, 3 and 6 and a significant decreased (p<0.05) in weeks 10 and 12 compared to the control. Group B showed a significant increased (p<0.05) in weeks 4 and 12 compared to the control (Table-4).
MCHCMCHC concentration was significantly
decreased (p<0.05) in weeks 6, 10 and 12 in Group C as compared to the control, while Group B indicated a significant decreased (p<0.05) in week 8 as compared to the control group (Table-5).
White blood cell count (WBC)There was a significant increase in WBC count
(p<0.05) in weeks 2, 3, 4 and 6 in Group C as com-pared to the control, and also a significant increased (p<0.05) in weeks 2 and 3 in Group B as compared to the control group (Table-6).
Neutrophil countThe neutrophil count showed a significant
increased (p<0.05) in weeks 2, 3 and 4 in Group C as compared to the control, and a significant increased (p<0.05) in week 4 for Group B as compared to the control group (Table-7).
Lymphocyte countGroup C showed a significant increased (p<0.05)
in lymphocyte count for weeks 3, 4, 10 and 12 as com-pared to the control group, while Group B showed a significant increased (p<0.05) in weeks 2 and 3 as compared to the control group (Table-8).
Table-1: RBCs response in female goat’s after inoculation with C. pseudotuberculosis and MA (mean±SE).
Week RBC count×1012/L
Group A Group B Group C
0 13.10±0.04a 13.07±0.04a 12.95±0.19b
1 12.80±0.16b 12.27±0.42b 11.70±0.27bc
2 13.15±0.15a 12.37±0.46b 11.90±1.17bc
3 12.17±0.70b 12.62±0.29b 11.72±0.95bc
4 12.92±0.04b 12.60±0.24b 13.05±0.06a
6 12.87±0.08b 12.50±0.41b 13.02±0.11a
8 13.07±0.04a 12.65±0.34b 12.27±0.16b
10 12.87±0.10b 12.75±0.22b 10.90±0.23c
12 12.17±0.70a 12.57±0.20b 10.72±1.36c
abcValues in different superscripts within row are significantly different at p<0.05, Group A: Buffered peptone saline, Group B: MA and Group C: C. pseudotuberculosis. C. pseudotuberculosis=Corynebacterium pseudotuberculosis, RBC=Red blood cell, MA=Mycolic acid, SE=Standard error
Table-2: Hb concentration in female goat’s postinoculation with C. pseudotuberculosis and MA.
Weeks Hb concentration g/L (Mean±SE)
Group A Group B Group C
0 93.6±3.95a 99.42±4.34a 99.55±2.16a
1 98.12±4.42a 93.47±1.12ab 91.50±2.06bc
2 95.07±3.31ab 91.90±1.57bc 72.27±10.39c
3 92.80±2.65ab 79.67±3.07c 73.27±9.82c
4 96.37±1.46a 74.10±4.50c 89.82±1.18bc
6 87.47±1.28bc 93.90±3.08ab 92.85±3.29ab
8 99.42±4.34a 91.10±4.36bc 83.00±2.58bc
10 93.60±3.95ab 93.10±3.29ab 82.75±2.71bc
12 92.80±2.65ab 94.97±3.75ab 73.95±9.40c
abcValues in different superscripts within row are significantly different at p<0.05. Group A: Buffered peptone saline, Group B: MA and Group C: C. pseudotuberculosis. C. pseudotuberculosis=Corynebacterium pseudotuberculosis, MA=Mycolic acid, SE=Standard error, Hb=Hemoglobin
Table-3: PCV in female goat’s postinoculation with C. pseudotuberculosis and MA.
Weeks PCV L/L (Mean±SE)
Group A Group B Group C
0 0.20±0.00b 0.21±0.00b 0.21±0.00b
1 0.20±0.02b 0.21±0.00b 0.20±0.02b
2 0.21±0.00b 0.27±0.01a 0.21±0.01b
3 0.20±0.02b 0.20±0.02b 0.28±0.02a
4 0.22±0.01b 0.20±0.00b 0.27±0.01a
6 0.20±0.00b 0.22±0.02b 0.20±0.02b
8 0.21±0.03b 0.22±0.02b 0.21±0.01b
10 0.20±0.00b 0.20±0.00b 0.26±0.01a
12 0.22±0.02b 0.19±0.02b 0.20±0.01b
abValues in different superscripts within row are significantly different at p<0.05. Group A: Buffered peptone saline, Group B: MA and Group C: C. pseudotuberculosis. C. pseudotuberculosis=Corynebacterium pseudotuberculosis, MA=Mycolic acid, SE=Standard error, PCV=Packed cell volume
Table-4: MCV in female goat’s postinoculation with C. pseudotuberculosis and MA.
Weeks MCV fL (mean±SE)
Group A Group B Group C
0 21.25±0.62ab 20.50±0.62b 21.25±0.62ab
1 22.50±1.55ab 20.75±0.85b 22.25±0.47ab
2 20.50±0.86b 22.00±0.70ab 23.50±1.32a
3 20.25±0.62b 21.00±0.70ab 24.25±1.43a
4 19.75±0.47bc 23.00±2.04a 20.75±0.47b
6 21.00±0.40ab 22.75±1.81ab 23.00±0.40a
8 22.50±1.55ab 21.25±0.62ab 19.25±1.70bc
10 21.25±0.62ab 22.00±0.81ab 16.00±0.40c
12 22.25±1.03ab 23.00±0.91a 16.25±0.62c
abcValues in different superscripts within row are significantly different at p<0.05. Group A: Buffered peptone saline, Group B: MA and Group C: C. pseudotuberculosis. C. pseudotuberculosis=Corynebacterium pseudotuberculosis, MA=Mycolic acid, SE=Standard error, MCV=Mean corpuscular volume
Veterinary World, EISSN: 2231-0916 658
Available at www.veterinaryworld.org/Vol.10/June-2017/14.pdf
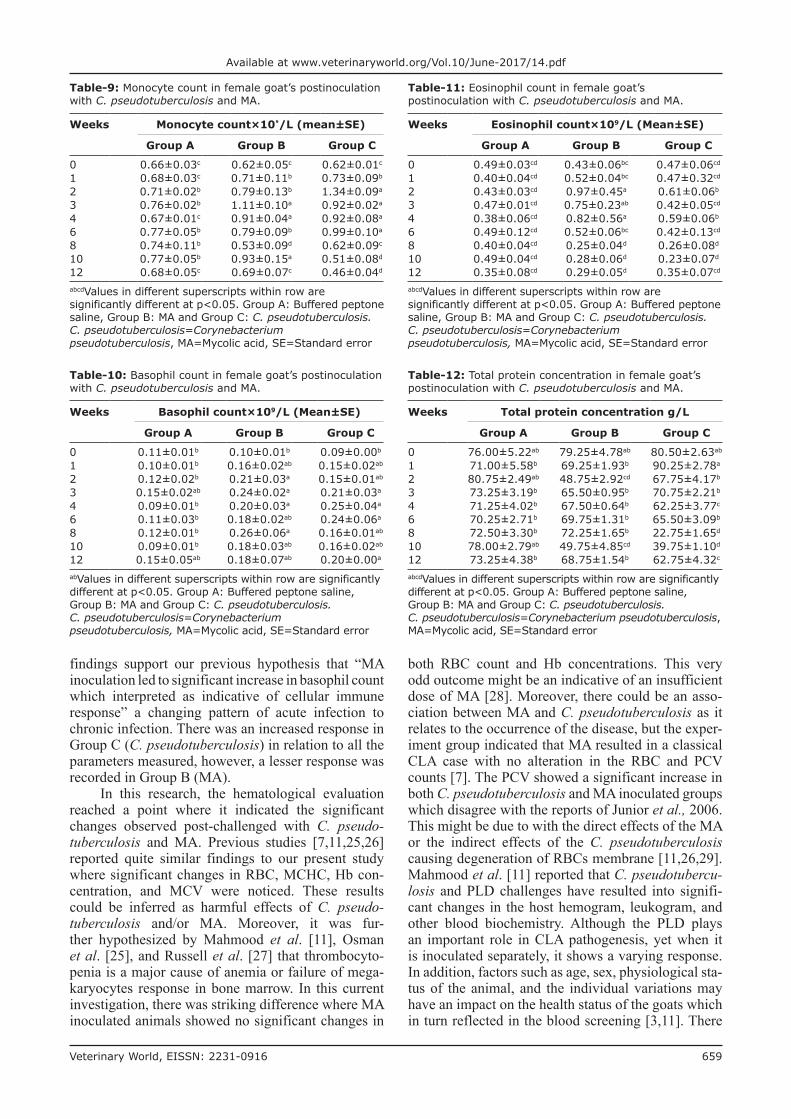
Monocyte countGroup C showed a significant increased (p<0.05)
in weeks 2, 3, 4 and 6 as compared with the control, whereas monocyte count in Group B was significantly increased (p<0.05) at weeks 3, 4 and 10 as compared with the control and significantly decreased (p<0.05) in weeks 8, 10 and 12 for Group C and Group B in week 8 only as, respectively, compared with the con-trol group (Table-9).
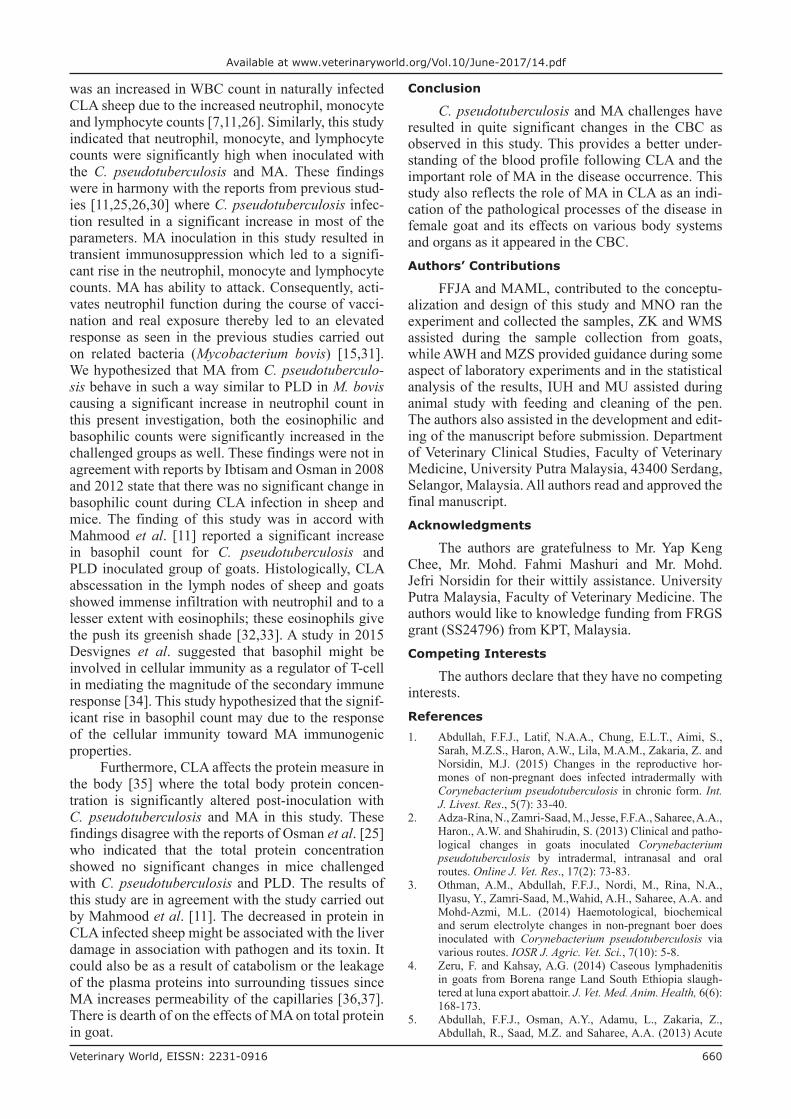
Basophil countGroup C showed a significant increased (p<0.05)
of basophil count in weeks 3, 4, 6, 10 and 12 as com-pared to the control group, whereas Group B showed a significant increased (p<0.05) in weeks 2, 3, 4 and 8 as compared with the control group (Table-10).
Eosinophil countGroup C showed a significant increased
(p<0.05) in eosinophilic count in weeks 2 and 4 with a significant decreased (p<0.05) in weeks 8 and 10 as compared with the control. Group B showed a signif-icant increased (p<0.05) in weeks 2, 3 and 4 with a
significant decreased (p<0.05) in weeks 8, 10 and 12 as compared to the control group (Table-11).Total protein concentration
The total concentration of protein showed a sig-nificant increased (p<0.05) for Group C in week 1 but with a significant decreased (p<0.05) in weeks 8 and 10 as compared with the control group. However, Group B revealed a significant decreased (p<0.05) in weeks 2 and 10 as compared with the control group (Table-12).Discussion
The analysis of changes in blood via hematology evaluation indicated that it is of a great value in val-idating the predictive diagnosis of the disease. There is, however, a paucity of information on goat’s CBC analysis through the stages of C. pseudotuberculosis and MA. This study investigated the response of CBC to C. pseudotuberculosis and MA in goats after an experimental challenge.
This study reported and compared a wide range of hematological changes in the induced of CLA in goats and MA challenged goats. Kaplanski et al. [24]
Table-5: MCHC in female goat’s postinoculation with C. pseudotuberculosis and MA.
Weeks MCHC fL (Mean±SE)
Group A Group B Group C
0 395.75±3.09ab 379.50±13.59ab 384.00±7.49ab
1 408.50±5.69a 379.75±13.88ab 375.75±10.22ab
2 416.75±14.48a 325.67±4.35b 348.50±23.25b
3 397.00±20.82ab 334.73±18.73b 368.25±14.00b
4 435.50±12.01a 337.22±8.55db 368.25±5.57b
6 378.75±12.57ab 334.87±5.56b 293.25±7.98c
8 381.50±10.71ab 297.85±2.38c 354.75±6.82b
10 419.00±16.33a 390.50±14.41ab 294.50±7.77c
12 386.75±11.19ab 377.50±8.76ab 292.50±14.70c
abcValues in different superscripts within row are significantly different at p<0.05. Group A: Buffered peptone saline, Group B: MA and Group C: C. pseudotuberculosis. C. pseudotuberculosis=Corynebacterium pseudotuberculosis, MA=Mycolic acid, SE=Standard error, MCHC=Mean corpuscular hemoglobin concentration
Table-6: WBC count in female goat’s postinoculation with C. pseudotuberculosis and MA.
Weeks WBC count×109/L (Mean±SE)
Group A Group B Group C
0 13.32±0.34c 13.97±0.95c 13.32±0.29c
1 12.52±0.43cd 14.97±1.54c 15.15±1.99bc
2 13.30±0.66c 18.30±1.98ab 19.82±0.57ab
3 11.22±1.96d 19.00±3.29ab 21.10±1.54a
4 11.57±0.73d 16.82±1.72bc 18.00±0.72ab
6 8.15±1.40d 15.57±0.68bc 18.60±0.97ab
8 12.07±0.27cd 16.30±2.20bc 14.42±1.80c
10 12.57±0.37cd 14.37±1.39c 15.37±1.88bc
12 11.22±0.92cd 12.27±1.84cd 15.42±0.95bc
abcdValues in different superscripts within row are significantly different at p<0.05. Group A: Buffered peptone saline, Group B: MA and Group C: C. pseudotuberculosis. WBC=White blood cell, C. pseudotuberculosis=Corynebacterium pseudotuberculosis, MA=Mycolic acid, SE=Standard error
Table-7: Neutrophil count response in female goat’s postinoculation with C. pseudotuberculosis and MA.
Weeks Neutrophil count×10⁹/L (Mean±SE)
Group A Group B Group C
0 6.55±0.69c 7.58±1.22bc 8.03±1.86ab
1 7.90±1.21bc 8.62±2.41ab 9.13±1.29ab
2 7.03±0.43bc 9.17±1.56ab 14.18±0.82a
3 4.39±0.59c 13.94±1.38a 15.21±0.96a
4 5.40±0.56c 13.64±0.30a 12.18±0.89a
6 7.78±0.50bc 9.22±1.96ab 8.71±1.43ab
8 7.90±1.21bc 7.95±1.87bc 8.38±0.95ab
10 6.55±0.69c 8.45±1.56ab 8.95±1.12ab
12 4.39±0.59c 8.64±1.63ab 8.74±1.43ab
abcValues in different superscripts within row are significantly different at p<0.05. Group A: Buffered peptone saline, Group B: MA and Group C: C. pseudotuberculosis. C. pseudotuberculosis=Corynebacterium pseudotuberculosis, MA=Mycolic acid, SE=Standard error
Table-8: Lymphocyte count in female goat’s postinoculation with C. pseudotuberculosis and MA.
Weeks Lymphocyte count×10⁹/L (Mean±SE)
Group A Group B Group C
0 3.59±0.27c 4.15±0.27bc 3.67±0.20c
1 5.12±0.99b 4.48±0.54bc 5.38±1.05b
2 4.75±0.79bc 8.04±0.69a 6.21±0.61ab
3 3.49±0.29c 8.31±1.13a 7.71±0.54a
4 4.60±0.72bc 6.70±0.92ab 7.84±0.81a
6 3.44±0.48c 6.97±0.80ab 6.71±0.89ab
8 3.62±0.66c 6.36±0.90ab 6.67±1.12ab
10 4.57±0.93bc 5.67±0.38b 7.23±0.92a
12 4.35±0.61bc 5.45±0.49b 7.12±0.21a
abcValues in different superscripts within row are significantly different at p<0.05. Group 1: Buffered peptone saline, Group 2: MA and Group 3: C. pseudotuberculosis. C. pseudotuberculosis=Corynebacterium pseudotuberculosis, MA=Mycolic acid, SE=Standard error
Veterinary World, EISSN: 2231-0916 659
Available at www.veterinaryworld.org/Vol.10/June-2017/14.pdf
findings support our previous hypothesis that “MA inoculation led to significant increase in basophil count which interpreted as indicative of cellular immune response” a changing pattern of acute infection to chronic infection. There was an increased response in Group C (C. pseudotuberculosis) in relation to all the parameters measured, however, a lesser response was recorded in Group B (MA).
In this research, the hematological evaluation reached a point where it indicated the significant changes observed post-challenged with C. pseudo-tuberculosis and MA. Previous studies [7,11,25,26] reported quite similar findings to our present study where significant changes in RBC, MCHC, Hb con-centration, and MCV were noticed. These results could be inferred as harmful effects of C. pseudo-tuberculosis and/or MA. Moreover, it was fur-ther hypothesized by Mahmood et al. [11], Osman et al. [25], and Russell et al. [27] that thrombocyto-penia is a major cause of anemia or failure of mega-karyocytes response in bone marrow. In this current investigation, there was striking difference where MA inoculated animals showed no significant changes in
both RBC count and Hb concentrations. This very odd outcome might be an indicative of an insufficient dose of MA [28]. Moreover, there could be an asso-ciation between MA and C. pseudotuberculosis as it relates to the occurrence of the disease, but the exper-iment group indicated that MA resulted in a classical CLA case with no alteration in the RBC and PCV counts [7]. The PCV showed a significant increase in both C. pseudotuberculosis and MA inoculated groups which disagree with the reports of Junior et al., 2006. This might be due to with the direct effects of the MA or the indirect effects of the C. pseudotuberculosis causing degeneration of RBCs membrane [11,26,29]. Mahmood et al. [11] reported that C. pseudotubercu-losis and PLD challenges have resulted into signifi-cant changes in the host hemogram, leukogram, and other blood biochemistry. Although the PLD plays an important role in CLA pathogenesis, yet when it is inoculated separately, it shows a varying response. In addition, factors such as age, sex, physiological sta-tus of the animal, and the individual variations may have an impact on the health status of the goats which in turn reflected in the blood screening [3,11]. There
Table-9: Monocyte count in female goat’s postinoculation with C. pseudotuberculosis and MA.
Weeks Monocyte count×10⁹/L (mean±SE)
Group A Group B Group C
0 0.66±0.03c 0.62±0.05c 0.62±0.01c
1 0.68±0.03c 0.71±0.11b 0.73±0.09b
2 0.71±0.02b 0.79±0.13b 1.34±0.09a
3 0.76±0.02b 1.11±0.10a 0.92±0.02a
4 0.67±0.01c 0.91±0.04a 0.92±0.08a
6 0.77±0.05b 0.79±0.09b 0.99±0.10a
8 0.74±0.11b 0.53±0.09d 0.62±0.09c
10 0.77±0.05b 0.93±0.15a 0.51±0.08d
12 0.68±0.05c 0.69±0.07c 0.46±0.04d
abcdValues in different superscripts within row are significantly different at p<0.05. Group A: Buffered peptone saline, Group B: MA and Group C: C. pseudotuberculosis. C. pseudotuberculosis=Corynebacterium pseudotuberculosis, MA=Mycolic acid, SE=Standard error
Table-10: Basophil count in female goat’s postinoculation with C. pseudotuberculosis and MA.
Weeks Basophil count×109/L (Mean±SE)
Group A Group B Group C
0 0.11±0.01b 0.10±0.01b 0.09±0.00b
1 0.10±0.01b 0.16±0.02ab 0.15±0.02ab
2 0.12±0.02b 0.21±0.03a 0.15±0.01ab
3 0.15±0.02ab 0.24±0.02a 0.21±0.03a
4 0.09±0.01b 0.20±0.03a 0.25±0.04a
6 0.11±0.03b 0.18±0.02ab 0.24±0.06a
8 0.12±0.01b 0.26±0.06a 0.16±0.01ab
10 0.09±0.01b 0.18±0.03ab 0.16±0.02ab
12 0.15±0.05ab 0.18±0.07ab 0.20±0.00a
abValues in different superscripts within row are significantly different at p<0.05. Group A: Buffered peptone saline, Group B: MA and Group C: C. pseudotuberculosis. C. pseudotuberculosis=Corynebacterium pseudotuberculosis, MA=Mycolic acid, SE=Standard error
Table-11: Eosinophil count in female goat’s postinoculation with C. pseudotuberculosis and MA.
Weeks Eosinophil count×109/L (Mean±SE)
Group A Group B Group C
0 0.49±0.03cd 0.43±0.06bc 0.47±0.06cd
1 0.40±0.04cd 0.52±0.04bc 0.47±0.32cd
2 0.43±0.03cd 0.97±0.45a 0.61±0.06b
3 0.47±0.01cd 0.75±0.23ab 0.42±0.05cd
4 0.38±0.06cd 0.82±0.56a 0.59±0.06b
6 0.49±0.12cd 0.52±0.06bc 0.42±0.13cd
8 0.40±0.04cd 0.25±0.04d 0.26±0.08d
10 0.49±0.04cd 0.28±0.06d 0.23±0.07d
12 0.35±0.08cd 0.29±0.05d 0.35±0.07cd
abcdValues in different superscripts within row are significantly different at p<0.05. Group A: Buffered peptone saline, Group B: MA and Group C: C. pseudotuberculosis. C. pseudotuberculosis=Corynebacterium pseudotuberculosis, MA=Mycolic acid, SE=Standard error
Table-12: Total protein concentration in female goat’s postinoculation with C. pseudotuberculosis and MA.
Weeks Total protein concentration g/L
Group A Group B Group C
0 76.00±5.22ab 79.25±4.78ab 80.50±2.63ab
1 71.00±5.58b 69.25±1.93b 90.25±2.78a
2 80.75±2.49ab 48.75±2.92cd 67.75±4.17b
3 73.25±3.19b 65.50±0.95b 70.75±2.21b
4 71.25±4.02b 67.50±0.64b 62.25±3.77c
6 70.25±2.71b 69.75±1.31b 65.50±3.09b
8 72.50±3.30b 72.25±1.65b 22.75±1.65d
10 78.00±2.79ab 49.75±4.85cd 39.75±1.10d
12 73.25±4.38b 68.75±1.54b 62.75±4.32c
abcdValues in different superscripts within row are significantly different at p<0.05. Group A: Buffered peptone saline, Group B: MA and Group C: C. pseudotuberculosis. C. pseudotuberculosis=Corynebacterium pseudotuberculosis, MA=Mycolic acid, SE=Standard error
Veterinary World, EISSN: 2231-0916 660
Available at www.veterinaryworld.org/Vol.10/June-2017/14.pdf
was an increased in WBC count in naturally infected CLA sheep due to the increased neutrophil, monocyte and lymphocyte counts [7,11,26]. Similarly, this study indicated that neutrophil, monocyte, and lymphocyte counts were significantly high when inoculated with the C. pseudotuberculosis and MA. These findings were in harmony with the reports from previous stud-ies [11,25,26,30] where C. pseudotuberculosis infec-tion resulted in a significant increase in most of the parameters. MA inoculation in this study resulted in transient immunosuppression which led to a signifi-cant rise in the neutrophil, monocyte and lymphocyte counts. MA has ability to attack. Consequently, acti-vates neutrophil function during the course of vacci-nation and real exposure thereby led to an elevated response as seen in the previous studies carried out on related bacteria (Mycobacterium bovis) [15,31]. We hypothesized that MA from C. pseudotuberculo-sis behave in such a way similar to PLD in M. bovis causing a significant increase in neutrophil count in this present investigation, both the eosinophilic and basophilic counts were significantly increased in the challenged groups as well. These findings were not in agreement with reports by Ibtisam and Osman in 2008 and 2012 state that there was no significant change in basophilic count during CLA infection in sheep and mice. The finding of this study was in accord with Mahmood et al. [11] reported a significant increase in basophil count for C. pseudotuberculosis and PLD inoculated group of goats. Histologically, CLA abscessation in the lymph nodes of sheep and goats showed immense infiltration with neutrophil and to a lesser extent with eosinophils; these eosinophils give the push its greenish shade [32,33]. A study in 2015 Desvignes et al. suggested that basophil might be involved in cellular immunity as a regulator of T-cell in mediating the magnitude of the secondary immune response [34]. This study hypothesized that the signif-icant rise in basophil count may due to the response of the cellular immunity toward MA immunogenic properties.
Furthermore, CLA affects the protein measure in the body [35] where the total body protein concen-tration is significantly altered post-inoculation with C. pseudotuberculosis and MA in this study. These findings disagree with the reports of Osman et al. [25] who indicated that the total protein concentration showed no significant changes in mice challenged with C. pseudotuberculosis and PLD. The results of this study are in agreement with the study carried out by Mahmood et al. [11]. The decreased in protein in CLA infected sheep might be associated with the liver damage in association with pathogen and its toxin. It could also be as a result of catabolism or the leakage of the plasma proteins into surrounding tissues since MA increases permeability of the capillaries [36,37]. There is dearth of on the effects of MA on total protein in goat.
Conclusion
C. pseudotuberculosis and MA challenges have resulted in quite significant changes in the CBC as observed in this study. This provides a better under-standing of the blood profile following CLA and the important role of MA in the disease occurrence. This study also reflects the role of MA in CLA as an indi-cation of the pathological processes of the disease in female goat and its effects on various body systems and organs as it appeared in the CBC.Authors’ Contributions
FFJA and MAML, contributed to the conceptu-alization and design of this study and MNO ran the experiment and collected the samples, ZK and WMS assisted during the sample collection from goats, while AWH and MZS provided guidance during some aspect of laboratory experiments and in the statistical analysis of the results, IUH and MU assisted during animal study with feeding and cleaning of the pen. The authors also assisted in the development and edit-ing of the manuscript before submission. Department of Veterinary Clinical Studies, Faculty of Veterinary Medicine, University Putra Malaysia, 43400 Serdang, Selangor, Malaysia. All authors read and approved the final manuscript.Acknowledgments
The authors are gratefulness to Mr. Yap Keng Chee, Mr. Mohd. Fahmi Mashuri and Mr. Mohd. Jefri Norsidin for their wittily assistance. University Putra Malaysia, Faculty of Veterinary Medicine. The authors would like to knowledge funding from FRGS grant (SS24796) from KPT, Malaysia.Competing Interests
The authors declare that they have no competing interests.References1. Abdullah, F.F.J., Latif, N.A.A., Chung, E.L.T., Aimi, S.,
Sarah, M.Z.S., Haron, A.W., Lila, M.A.M., Zakaria, Z. and Norsidin, M.J. (2015) Changes in the reproductive hor-mones of non-pregnant does infected intradermally with Corynebacterium pseudotuberculosis in chronic form. Int. J. Livest. Res., 5(7): 33-40.
2. Adza-Rina, N., Zamri-Saad, M., Jesse, F.F.A., Saharee, A.A., Haron., A.W. and Shahirudin, S. (2013) Clinical and patho-logical changes in goats inoculated Corynebacterium pseudotuberculosis by intradermal, intranasal and oral routes. Online J. Vet. Res., 17(2): 73-83.
3. Othman, A.M., Abdullah, F.F.J., Nordi, M., Rina, N.A., Ilyasu, Y., Zamri-Saad, M.,Wahid, A.H., Saharee, A.A. and Mohd-Azmi, M.L. (2014) Haemotological, biochemical and serum electrolyte changes in non-pregnant boer does inoculated with Corynebacterium pseudotuberculosis via various routes. IOSR J. Agric. Vet. Sci., 7(10): 5-8.
4. Zeru, F. and Kahsay, A.G. (2014) Caseous lymphadenitis in goats from Borena range Land South Ethiopia slaugh-tered at luna export abattoir. J. Vet. Med. Anim. Health, 6(6): 168-173.
5. Abdullah, F.F.J., Osman, A.Y., Adamu, L., Zakaria, Z., Abdullah, R., Saad, M.Z. and Saharee, A.A. (2013) Acute
Veterinary World, EISSN: 2231-0916 661
Available at www.veterinaryworld.org/Vol.10/June-2017/14.pdf
phase protein profiles in calves following infection with whole cell, lipopolysaccharides, and outer membrane pro-tein extracted from Pasteurella multocida Type B: 2. Asian J. Anim. Vet. Adv., 8(4): 655-662.
6. Ashfaq, M. and Campbell, S.A. (1979) Survey of caseous lymphadenitis and its etiology in goats in the United States. Vet. Med. Small Anim. Clin., 74(8): 1161.
7. Junior, J.P., Oliveira, A., Alves, F., Silva, L., Rabelo, S. and Mota, R. (2006) Corynebacterium pseudotuberculosis experimental infection of goats mamary gland. Arq. Inst. Biol. Sao Paulo, 73(4): 395-400.
8. Asano, S. (2012) Granulomatous lymphadenitis. J. Clin. Exp. Hematopathol., 52(1): 1-16.
9. Latif, N.A.A., Abdullah, F.F.J., Othman, A.M., Rina, A., Chung, E.L.T., Zamri-Saad, M., Saharee, A.A., Haron, A.W. and Lila, M.A.M. (2015) Isolation and detection of Corynebacterium pseudotuberculosis in the reproductive organs and associated lymph nodes of non-pregnant does experimentally inoculated through intradermal route in chronic form. Vet. World, 8(7): 924.
10. Jeber, Z., Mohdjin, Z., Jesse, F., Saharee, A., Sabri, J., Yusoff, R. and Wahid, H. (2016) Influence of Corynebacterium pseudotuberculosis infection on level of acute phase proteins in goats. BMC Vet. Res., 12(1): 1.
11. Mahmood, Z., Jesse, F., Saharee, A., Jasni, S., Yusoff, R. and Wahid, H. (2015) Assessment of blood changes post-challenge with Corynebacterium pseudotuberculosis and its exotoxin (phospholipase D): A comprehensive study in goat. Vet. World, 8(9): 1105.
12. Mahmood, Z.K., Jin, Z.A.M., Jesse, F.F., Saharee, A.A., Sabri, J., Yusoff, R. and Haron, A.W. (2016) Relationship between the Corynebacterium pseudotuberculosis, phos-pholipase D inoculation and the fertility characteristics of crossbred Boer bucks. Livest. Sci., 191: 12-21.
13. Butler, W., Ahearn, D. and Kilburn, J. (1986) High-performance liquid chromatography of mycolic acids as a tool in the identification of Corynebacterium, Nocardia, Rhodococcus, and Mycobacterium species. J. Clin. Microbiol., 23(1): 182-185.
14. Collins, M.D., Burton, R.A. and Jones, D. (1988) Corynebacterium amycolatum sp. Nov. A new mycolic acid-less Corynebacterium species from human skin. FEMS Microbiol. Lett., 49(3): 349-352.
15. Marrakchi, H., Lanéelle, M.A. and Daffé, M. (2014) Mycolic acids: Structures, biosynthesis, and beyond. Chem. Biol., 21(1): 67-85.
16. Vasco, A. (2012) Corynebacterium pseudotuberculosis: Immunological responses in animal models and zoonotic potential. J. Clin. Cell. Immunol., 1(S4): 5.
17. Hard, G.C. (1975) Comparative toxic effect of the surface lipid of Corynebacterium ovis on peritoneal macrophages. Infect. Immun., 12(6): 1439-1449.
18. Gotoh, K., Mitsuyama, M., Imaizumi, S., Kawamura, I. and Yano, I. (1991) Mycolic acid-containing glycolipid as a possible virulence factor of rhodococcus equi for mice. Microbiol. Immunol., 35(3): 175-185.
19. Ozkanlar, Y., Aktas, M., Kaynar, O., Ozkanlar, S. and Kireccl, E. (2012) Bovine respiratory disease in naturally infected calves: Clinical signs, blood gases and cytokine response. Rev. Med. Vet., 163: 123-130.
20. Pazatsen, R., Shun, S., Abdullah, F.F.J., Saad, M.Z. and Haron, A. (2012) Clinical Response and Pathological Changes Associated with Corynebacterium pseudotubercu-losis Infection in Mice. UPM Serdang, Malaysia.
21. Muckle, C.A. and Gyles, C. (1983) Relation of lipid content and exotoxin production to virulence of Corynebacterium pseudotuberculosis in mice. Am. J. Vet. Res., 44(6): 1149-1153.
22. Jesse, F., Azlan, C., Saharee, A., Murugaiyah, M., Noordin, M., Jasni, S., Ragavan, K., Hassan, M.D. and Haron, A.W. (2008) Control of caseous lymphadeni-tis (CLA) in goat at UPM farm. In: Proceedings of the 20th Veterinary Association Malaysia (VAM’08).
23. Daffe, M. and Etienne G. (1999) The capsule of Mycobacterium tuberculosis and its implications for patho-genicity. Tuber. Lung Dis., 79(3): 153-169.
24. Kaplanski, G., Marin, V., Montero-Julian, F., Mantovani, A. and Farnarier, C. (2003) IL-6: A regulator of the transition from neutrophil to monocyte recruitment during inflamma-tion. Trends Immunol., 24(1): 25-29.
25. Osman, A.Y., Abdullah, F.F.J., Saharee, A.A., Haron, A.W., Sabri, I. and Abdullah, R. (2012) Haematological and biochemical alterations in mice following experimental infection with whole cell and exotoxin (PLD) extracted from C. pseudotuberculosis. J. Anim. Vet. Adv., 11(24): 4660-4667.
26. Ibtisam, M.A. (2008) Some clinicopathological and patho-logical studies of C. ovis infection in sheep. Egypt. J. Comp. Pathol. Clin. Pathol., 21(1): 327-343.
27. Russell, D.G., VanderVen, B.C., Lee, W., Abramovitch, R.B., Kim, M.J., Homolka, S., Niemann, S. and Rohde, K.H. (2010) Mycobacterium tuberculosis wears what it eats. Cell Host Microbe, 8(1): 68-76.
28. Liu, J., Barry, C.E., Besra, G.S. and Nikaido, H. (1996) Mycolic acid structure determines the fluidity of the myco-bacterial cell wall. J. Biol. Chem., 271(47): 29545-29551.
29. Harvey, J. (2010) Erythrocyte biochemistry. Schalm’s Veterinary Hematology. 6th ed. Blackwell Publishing Ltd., Ames, USA. p131-135.
30. Soucek, A. and Souckova, A. (1973) Toxicity of bacte-rial sphingomyelinases D. J. Hyg. Epidemiol. Microbiol. Immunol., 18(3): 327-335.
31. Kemp, T.J., Ludwig, A.T., Earel, J.K., Moore, J.M., Vanoosten, R.L., Moses, B., Leidal, K., Nauseef, W.M. and Griffith, T.S. (2005) Neutrophil stimulation with Mycobacterium bovis bacillus Calmette-Guerin (BCG) results in the release of functional soluble TRAIL/Apo-2L. Blood, 106(10): 3474-3482.
32. Valli, V. and Parry, B. (1993) Caseous lymphadenitis. Pathol. Domest. Anim., 3: 238-240.
33. Wernery, U. (2012) Caseous lymphadenitis (Pseudotuberculosis) in camelids. J. Camel Pract. Res., 19(1): 21-27.
34. Desvignes, L., Weidinger, C., Shaw, P., Vaeth, M., Ribierre, T., Liu, M., Fergus, T., Kozhaya, L., McVoy, L., Unutmaz, D., Ernst, J.D. and Feske, S. (2015) STIM1 con-trols T cell-mediated immune regulation and inflammation in chronic infection. J. Clin. Invest., 125(6): 2347.
35. Kim, Y.J., Kim, H.J., Jeong, S.K., Lee, S.H., Kang, M.J., Yu, H.S., Jung, Y.H., Seo, J.H., Kim, B.J., Yu, J., Park, S.J., Lee, Y.C. and Hong, S.J. (2014) A novel synthetic mycolic acid inhibits bronchial hyperresponsiveness and allergic inflammation in a mouse model of asthma. Allergy Asthma Immunol. Res., 6(1): 83-88.
36. Dupont, C., Viljoen, A., Dubar, F., Blaise, M., Bernut, A., Pawlik, A., Bouchier, C., Brosch, R., Guérardel, Y., Lelièvre, J., Ballell, L., Herrmann, J.L., Biot, C. and Kremer, L. (2016) A new piperidinol derivative targeting mycolic acid transport in Mycobacterium abscessus. Mol. Microbiol., 101(3): 515-529.
37. Li, W., Obregón-Henao, A., Wallach, J.B., North, E.J., Lee, R.E., Gonzalez-Juarrero, M., Schnappinger, D. and Jackson, M. (2016) Therapeutic potential of the Mycobacterium tuberculosis mycolic acid transporter, MmpL3. Antimicrob. Agents Chem., 60(9): 5198-5207.
********