hematology performance verification manual · pdf filehematology performance verification...
TRANSCRIPT
Beckman Coulter, Inc
HEMATOLOGY PERFORMANCE
VERIFICATION MANUAL

HEMATOLOGY PERFORMANCE VERIFICATION MANUAL
PN 4277076AB ii of viii
WARNINGS AND PRECAUTIONS
READ ALL PRODUCT MANUALS AND CONSULT WITH BECKMAN COULTER-TRAINED PERSONNEL BEFORE ATTEMPTING TO OPERATE INSTRUMENT. DO NOT ATTEMPT TO PERFORM ANY PROCEDURE BEFORE CAREFULLY READING ALL INSTRUCTIONS. ALWAYS FOLLOW PRODUCT LABELING AND MANUFACTURER’S RECOMMENDATIONS. IF IN DOUBT AS TO HOW TO PROCEED IN ANY SITUATION, CONTACT YOUR BECKMAN COULTER REPRESENTATIVE. HAZARDS AND OPERATIONAL PRECAUTIONS AND LIMITATIONS WARNINGS, CAUTIONS and IMPORTANTS alert you as follows:
WARNING – Can cause injury. CAUTION – Can cause damage to the instrument. IMPORTANT – Can cause misleading results.
BECKMAN COULTER, INC. URGES ITS CUSTOMERS TO COMPLY WITH ALL NATIONAL HEALTH AND SAFETY STANDARDS SUCH AS THE USE OF BARRIER PROTECTION. THIS MAY INCLUDE, BUT IT IS NOT LIMITED TO, PROTECTIVE EYEWEAR, GLOVES AND SUITABLE LABORATORY ATTIRE WHEN OPERATING OR MAINTAINING THIS OR ANY OTHER AUTOMATED LABORATORY ANALYZER.
WARNING Risk of operator injury if:
• All doors, covers and panels are not closed and secured in place prior to and during instrument operation.
• The integrity of safety interlocks and sensors is compromised. • Instrument alarms and error messages are not acknowledged and acted upon. • You contact moving parts. • You mishandle broken parts. • Doors, covers and panels are not opened, closed, removed and/or replaced with care. • Improper tools are used for troubleshooting.
To avoid injury:
• Keep doors, covers and panels closed and secured in place while the instrument is in use. • Take full advantage of the safety features of the instrument. Do not defeat safety interlocks and
sensors.
• Acknowledge and act upon instrument alarms and error messages. • Keep away from moving parts. • Report any broken parts to your Beckman Coulter Representative.
• Open/remove and close/replace doors, covers and panels with care. • Use the proper tools for troubleshooting.
CAUTION
System integrity might be compromised and operational failures might occur if: • This equipment is used in a manner other than specified. Operate the instrument as instructed in the
Product Manuals. • You introduce software that is not authorized by Beckman Coulter into your computer. Only operate
your system’s computer with software authorized by Beckman Coulter. • You install software that is not an original copyrighted version. Only use software that is an original
copyrighted version to prevent virus contamination.
IMPORTANT
If you purchased this product from anyone other than Beckman Coulter or an authorized Beckman Coulter distributor, and, if it is not presently under a Beckman Coulter service maintenance agreement, Beckman Coulter cannot guarantee that the product is fitted with the most current mandatory engineering revisions or that you will receive the most current information bulletins concerning the product. If you purchased this product from a third party and would like further information concerning this topic, call your Beckman Coulter Representative.
Copyright © Beckman Coulter, Inc. 2011 All Rights Reserved
HEMATOLOGY PERFORMANCE VERIFICATION MANUAL
PN 4277076AB iii of viii
HEMATOLOGY CUSTOMER SUPPORT CONTACTS
SALES AND SERVICE OFFICES
FOR FIELD SERVICE OR TECHNICAL INFORMATION CUSTOMER TECHNICAL SUPPORT CENTER / SERVICE United States………………………………………800 526-7694
Canada……………………………………………..800 526-7694 ORDER ASSISTANCE
United States……………………………………...800 526-3821 BECKMAN COULTER Web Site…………………………………………...www.BeckmanCoulter.com Sales Office: 250 South Kraemer Boulevard Brea, CA. 92821
800 526-3821 Instrument Model __________________________________ Serial Number __________________________________ SID#/Instance#: __________________________________ IQAP Participant # __________________________________ Your Account#: _________________________________ Contacts: Instrument Implementation Coordinator: _____________________________ Applications Specialist: __________________________________ Field Service Engineer: __________________________________ Instrument Sales Representative: __________________________________

HEMATOLOGY PERFORMANCE VERIFICATION MANUAL
PN 4277076AB iv of viii

HEMATOLOGY PERFORMANCE VERIFICATION MANUAL
PN 4277076AB v of viii
REVISION STATUS Revision AA (Initial Issue August 2009) Revision AB (July 2011)

HEMATOLOGY PERFORMANCE VERIFICATION MANUAL
PN 4277076AB vi of viii

HEMATOLOGY PERFORMANCE VERIFICATION MANUAL
PN 4277076AB vii of viii
TABLE OF CONTENTS
1. INTRODUCTION
Performance Verification Studies Overview Verification Synopsis Performance Verification Flow chart Performance Verification Checklist
2. CALIBRATION AND QUALITY ASSESSMENT
3. CBC PARAMETER METHOD COMPARISON 4. DIFF PARAMETER METHOD COMPARISON 5. RETIC PARAMETER METHOD COMPARISON 6. TRUTH TABLE ANALYSIS
7. OTHER STUDIES
BODY FLUIDS COMPARISON MEASURING RANGE (LINEARITY) MODE TO MODE COMPARISON ESTABLISH QC LAB LIMTS REFERENCE INTERVAL STUDY (Normal Range) MIXING STUDIES
8. COMMENTARY Manual Differential versus Automated Differential
9. GLOSSARY
10. REFERENCES 11. GRAPHS
HEMATOLOGY PERFORMANCE VERIFICATION MANUAL
PN 4277076AB viii of viii
PN 4277076AB 1-1 of 10
INTRODUCTION 1
BECKMAN COULTER HEMATOLOGY ANALYZER Beckman Coulter, Inc. is pleased to present this Performance Verification Manual as a guide, designed to assist you in making a smooth transition integrating your new Hematology System into your laboratory. Please take the time to review this book thoroughly with your Beckman Coulter Applications Specialist.
Within this Performance Verification Manual you will find guidelines for evaluating your new analyzer. You will find procedures and worksheets to assist you with each stage of the verification process.
Please note that the procedures provided outline the general steps for characterizing the performance of your new system. Your current laboratory policies or your local regulatory agency may dictate more specific procedures for your laboratory to follow.
We hope you will find the information contained in this manual a useful tool for making a smooth transition to your new hematology system.

HEMATOLOGY PERFORMANCE VERIFICATION MANUAL
PN 4277076AB 1-2 of 10

HEMATOLOGY PERFORMANCE VERIFICATION MANUAL
PN 4277076AB 1-3 of 10

HEMATOLOGY PERFORMANCE VERIFICATION MANUAL
PN 4277076AB 1-4 of 10

HEMATOLOGY PERFORMANCE VERIFICATION MANUAL
PN 4277076AB 1-5 of 10
PERFORMANCE VERIFICATION STUDIES OVERVIEW
CLIA ‘88
Much has been said and written about the impact of the Clinical Laboratory Improvement Amendments of 1988 (CLIA’88) on the laboratory and method evaluation.1 It is often confusing to determine what is needed for accreditation and certification for the different types of testing categories. The Centers for Medicare & Medicaid Services (CMS) regulates all laboratory testing (except research) performed on humans in the U.S. through the Clinical Laboratory Improvement Amendments (CLIA).
The following procedures will assist you in the evaluation of a new instrument or clinical test. Not all of these procedures are required by CLIA; however, some of them may be required by the College of American Pathologists (CAP), the Joint Commission of Accreditation of Healthcare Organizations (known as JCAHO), and/or individual agencies. It is important to know local requirements as well as those of any other accrediting agencies that will impact your laboratory. The data generated from some of these procedures will help to establish the baseline characterization of your system.
Your laboratory must compile its own policies and procedures manual for method evaluation, in compliance with the appropriate accrediting agencies. You are empowered to make your own decisions as to what procedures are appropriate, and which performance limits or specifications are acceptable.

HEMATOLOGY PERFORMANCE VERIFICATION MANUAL
PN 4277076AB 1-6 of 10
VERIFICATION SYNOPSIS
Hardware Installation
The instrument installation will be performed by a local Beckman Coulter service representative, who will perform various system checks to ensure and document that the system meets specific Beckman Coulter performance specifications. This process should take between one and two days. You will be contacted to schedule this installation.
Instrument Implementation
For the applications and performance verification process of your new analyzer, a Beckman Coulter Applications Specialist will assist you in using this Performance Verification Manual. An Applications Specialist will contact you to schedule time with the assigned Trained Operator.
It is critical to the success of this implementation process that the Trained Operator provides the dedicated time, cooperation and coordination required to complete the tasks necessary for a successful characterization process.
Trained Operator Responsibilities:
• Provide setup information (such as reference intervals, reflex criteria, critical limits, workflow details and LIS settings)
• Coordinate gathering of samples for reference intervals, method comparisons and truth tables
• Communicate with IT contact to ensure interface is ready as soon as possible
• Mentor your own laboratory staff • Communicate with management to quickly address concerns and
questions during process • Complete required characterization studies • Submit data for data analysis
The following is a synopsis of performance characteristics that are most studied. For more details, please refer to any textbook on clinical laboratory practices or the available Clinical Laboratory Standards Institute (CLSI) guidelines.1
Some of the following procedures are completed one time at installation. Others will be required throughout the life of your instrument.

HEMATOLOGY PERFORMANCE VERIFICATION MANUAL
PN 4277076AB 1-7 of 10
Performed for Implementation and periodically (as per lab protocol and/or local regulatory agency)
Calibration using your instrument's commercially available calibrator Comparison studies against the previous analyzer or methods Manual differential comparisons Truth Tables for establishing and/or modifying laboratory flagging criteria Establishing Quality Control (QC) lab limits as per lab protocol or regulatory Verification of Adult Reference Intervals Verification of Body Fluid Analysis (if applicable) Verification of Retic results (if applicable) Verify accuracy and precision (Routine Quality Control procedures, including calibration verification) Verify Measuring Ranges (linearity) Verify comparison between automatic and manual modes (if applicable) Verify comparability between primary and back-up instrument
Assistance from your Applications Specialist
The characterization process helps to assure that your new instrument, when used in your laboratory by your testing personnel for your patient population, is performing as the manufacturer intended. Your Applications Specialist will assist and guide you through the characterization steps; he or she will not perform the studies for you.
While your Applications Specialist is onsite, he or she (with the assistance of the Trained Operator) will complete the following:
• Calibration • Setup of workstation for flagging limits and Decision Rules (if applicable)
based on your laboratory protocols for review. • Comparison study for CBC, automated differential and automated
reticulocyte (if applicable). This study will compare your new instrument(s) to a single reference instrument.
• Verify the Measuring Range (linearity) using commercially available material per your laboratory protocols or regulatory agency.

HEMATOLOGY PERFORMANCE VERIFICATION MANUAL
PN 4277076AB 1-8 of 10
All procedures will not be completed while your Applications Specialist is on- site. They may guide you in the following:
• Establishing Quality Control (QC) lab limits • Verification of Body Fluid Analysis (if applicable) • Verification of Retic results (if applicable) • Truth Table analysis for comparison to manual differentials (if applicable) • Verification of Adult Reference Interval • Verify comparison between automatic and manual modes (if applicable) • Verify comparability between primary and back-up instrument
In this Performance Verification Manual you will find discussions, procedures and worksheets to assist you with each stage of the characterization process. A Performance Verification Checklist is included to help you keep the process on track. Please note that the procedures provided outline the general steps for verifying the performance of your new system. Your current laboratory policies or your local regulatory agency may dictate more specific or additional rules for your laboratory to follow. We hope you find the information provided to be useful as you make the transition to your new hematology system.
Lastly, a reminder that reagents received for the new system need to be removed from the shipping carton immediately and stored according to the storage criteria stated on the package. Some reagents are refrigerated and some are stored at room temperature.
1 The Health Care Financing Administration (HCFA)’s State Operations Manual (Appendix C: survey Procedures and Interpretive Guidelines for Laboratories and Laboratory Services), published March 1993, details how to comply with the CLIA regulations. Internet: http://www.hcfa.gov/pubforms/pub07/pub%5F07.htm 2 CLSI 940 West Valley Road, Suite 1400 Wayne, PA 19087-1898 USA Phone: (610) 688-0100 Fax: (610) 688-0700 Internet: http://www.clsi.org/

HEMATOLOGY PERFORMANCE VERIFICATION MANUAL
PN 4277076AB 1-9 of 10
Instrument/SN __________________________ Date Completed or N/A* Tech
Hardware installation data verified
Precision verified
Accuracy verified
Carryover verified
Mode to Mode verified (if applicable)
Calibration
Set up DMS/Workstation/System Manager
Set up QC files
Enroll/Set up IQAP/eIQAP participant # for new instrument
Set up Interfacing to LIS (IT/LIS contact)
Setup Patient Flagging Limits and review criteria
Setup Decision Rules (if applicable)
Comparisons performed by laboratory staff
Samples run on new instrument and comparison method
CBC/Diff
Manual differentials for Truth Tables
Reticulocytes
Body Fluids
Comparison Data collated and submitted for Data Analysis
Verify Measuring Range (linearity)
Verify Reference Interval (Normal Ranges)
Establish QC lab limits (per lab protocol)
Verify Primary instrument to back up instrument (comparability)
Verify Specimen mixing study
Test Interfacing - Trained Operator and Lab IT Contact
Data analysis reports reviewed with appropriate Lab Staff
Pathology/Lab Director Sign off
*Some items non-applicable depending on Instrument, Test Menu, laboratory protocol and/or local regulatory agency
Performance Verification CHECKLIST HEMATOLOGY
COMPLETED DURING IMPLEMENTATION BY LABORATORY STAFF

HEMATOLOGY PERFORMANCE VERIFICATION MANUAL
PN 4277076AB 1-10 of 10

PN 4277076AB 2-1 of 4
CALIBRATION AND QUALITY ASSESSMENT 2
PRE-CALIBRATION ASSESSMENT
It is important that we remember that a Hematology calibrator can not, by nature of the product, be an “absolute” constant. The product does contain a standard or exact number of cells at its creation and they are preserved to ensure a certain amount of time in which the product can be used. However, as these are viable cells they can undergo changes due to handling that can alter the final values. The parameters most commonly affected are the RBC (cells may lyse if frozen or overheated), MCV, and Plt (may increase if there is stroma from RBC lysis). It is good practice to evaluate your current QC. If this is the first time calibrating a new instrument, you should review how the commercial control is performing. If you are calibrating to verify calibration evaluate your current QC and the last 1-2 months of IQAP information for the calibrated parameters. Are you starting to trend high or low for any parameter? If you are high/low, how do you also compare to your peers? If your entire peer group is trending along with you this indicates that there may have been a change in the QC product itself. If you are trending, but not your peers, then it is time to address a possible calibration drift.
* Refer to specific commercial calibrator insert or instrument documentation for parameter to be calibrated.
Review each parameter • indicate if it is running H/L • decide which way you expect the calibration factor to change (increase or decrease)
Note: the higher the calibration factor the higher the final result. If you are trending on the high side, you would want the new cal factor to be smaller than the old factor.
If the new calibration factor does NOT make a change in the direction that you are expecting, even though it is for a parameter that you have determined needs to be recalibrated, do not change the factor at this time. Question the acceptability of the product. (Call Customer Support to troubleshoot)
Remember that Calibration Verification is done using commercial control. This allows you to demonstrate that the expected/needed changes are actually occurring to the QC material. If your instrument allows for entering comments to the QC file, document the Calibration by adding a comment to the last QC run before the calibration.
W BC RBC Hgb HCT/MCV* Plt MPV Level 1 Level 2 Level 3 Cal Ref
Cal mean

HEMATOLOGY PERFORMANCE VERIFICATION MANUAL
PN 4277076AB 2-2 of 4
HEMATOLOGY PERFORMANCE VERIFICATION MANUAL
PN 4277076AB 2-3 of 4
CARRYOVER
Note: Carryover is verified by the installer on initial installation. A Carryover procedure may be a requirement of regulatory agency or part of laboratory protocol. This procedure may be used at any time to verify the performance of CBC, Diff and Retic parameters. Most Beckman Coulter hematology instruments have a high to low carryover test procedure that automates running samples and does the statistical calculations. Follow the procedure for your instrument. "Carryover is the discrete amount of analyte carried by the measuring system from one specimen reaction into subsequent specimen reactions, thereby erroneously affecting the apparent amounts in subsequent specimen." (NRSCL8-A 1998, Clinical Laboratory Standards Institute) Carryover is expressed conventionally as a percentage of the concentration of the analyte in the first specimen that is carried into the subsequent specimen.

HEMATOLOGY PERFORMANCE VERIFICATION MANUAL
PN 4277076AB 2-4 of 4

PN 4277076AB 3-1 of 2
CBC PARAMETER COMPARISON 3
RATIONALE Method Comparison is a regulatory requirement to show agreement between two methods. Most often, a new instrument will be compared to the lab's current method. The comparison must be completed before the new method is placed into use. Patient specimens for analysis are usually acquired from the lab's routine population. Some specimens should be specially chosen to test the complete measuring range.
Before beginning the process of method comparison, verify the performance and calibration of both the current (reference) instrument and the test instrument. Both instruments should meet the manufacturer’s specifications with regard to maintenance, background checks, reproducibility/repeatibility, carryover, calibration, and quality control. Refer to the product documentation.for specifications.
DATA COLLECTION GUIDELINES The specimens collected for method comparison should reflect the typical patient population of the laboratory and be indicative of the clinically meaningful range for making medical decisions. This includes normal and abnormal inpatients, outpatients, pediatric and specialty clinics existing in the laboratory population.
The quality of specimens collected is an important factor when collecting data. Poorly collected specimens contribute to poor data and lead to false conclusions. Properly collected and maintained specimens are:
• Collected in tubes containing a salt of EDTA and filled to the appropriate level to ensure the proper proportion of blood to anticoagulant.
• Collected according to the tube manufacturer’s instructions.
• Of sufficient quantity to be run on both the current instrument and the test instrument.
• Processed on both instruments within one or two hours of each other and within the same time frame as the laboratory routinely analyzes specimens.
• Thoroughly mixed before processing to establish cellular equilibration.
HEMATOLOGY PERFORMANCE VERIFICATION MANUAL
PN 4277076AB 3-2 of 2
GENERAL CONSIDERATIONS The number of specimens required for method comparison depends on the needs of the laboratory. CLSI (EP9)1 recommends that at least 40 samples be analyzed. Samples chosen should span the upper and lower end of the measuring range using the available patient population.
The actual number of samples analyzed varies by laboratory and should be determined by the laboratory, considering the average number of samples run per day as well as the size of the laboratory. (i.e. a lab running 10,000 samples per day would not need to include 10,000 samples in the study.)
• Printed results for all specimens analyzed on all instruments should be obtained and labeled appropriately. For each specimen, collect the following data:
Printout from the Evaluation instrument
Printout from the reference instrumen
Any confirmatory results
If instrument has archive/export feature, archive/export specimen results to appropriate external media, such as a CD, 3.5 inch diskette or a flash drive and include with the printed results
DATA ANALYSIS Upon completion of specimen collection and processing, compare results from the current and test instruments and review for acceptable comparison. Methods of data analysis include:
• Calculation of mean difference statistics.
• Determination of method comparison and linear regression.
• Graphing.
J. Westgard and M. Hunt state “Statistical tests do not provide the criteria for acceptability. Acceptability depends on whether the errors limit the clinical usefulness of the method. Statistical tests can provide specific estimates of errors upon which judgements can be made, but they are not a substitute for judgments.”2
IMPORTANT
The responsibility to determine acceptable performance of data lies with the evaluating laboratory.
Each laboratory is ultimately responsible for interpretation of comparison data and developing its own evaluation criteria for acceptability of results.

PN 4277076AB 4-1 of 6
DIFF PARAMETERS COMPARISON 4
RATIONALE Method Comparison is a regulatory requirement to show agreement between two methods. Most often a new instrument will be compared to the lab's current method. The comparison must be completed before the new method is placed into use. Patient specimens for analysis are usually acquired from the lab's routine population. Some specimens should be specifically chosen to test the complete measuring range.
Before beginning the process of method comparison, validate the performance of both the current (reference) instrument or manual differential and the test instrument. Both methodologies should meet the appropriate specifications for quality control. Refer to your appropriate laboratory protocols, or the respective product documentation.
AUTOMATED VS MANUAL DIFF DATA COLLECTION
When comparing the automated differential to the manual differential, ensure that the inherent variations of slide preparation are minimized by:
Making quality smears.
Staining with quality stain.
Using optically clean microscopes.
Having qualified technologists review the smear(s).
Specimens are identified by lab number on both printouts and microscopic slides for future reference.
CLSI (H20)3 recommends that two technologists each perform a 200 cell manual differential on two different slides (total of 400 cells analyzed by each technologist). More cells counted results in a more precise and accurate reference against which to judge the accuracy of the automated method. Automated differential systems analyze thousands of cells. The Rumke Binomial Distribution Table4, published by C.L. Rumke in 1978, illustrates that the statistical uncertainty of reference values is a direct function of the number of cells counted. The imprecision of the manual differential is especially pronounced with low numbers (e.g., monocyte, eosinophil and basophil percent).

HEMATOLOGY PERFORMANCE VERIFICATION MANUAL
PN 4277076AB 4-2 of 6
• Printed results for all specimens analyzed on all instruments should be obtained and labeled appropriately. For each specimen, collect the following data:
Printout from the Evaluation instrument
Printout from the reference instrument
Any confirmatory results
If instrument has archive/export feature, archive/export specimen results to appropriate external media, such as a CD, 3.5 inch diskette or a flash drive and include with the printed results
DATA ANALYSIS If a laboratory intends to compare a current automated differential to the new automated differential, then linear regression may be used. Keep the following in mind if you choose to do this:
• Compare similar technology (e.g. 5-part diff to 5-part diff or 3-part diff to 3-part diff).
• Use the same samples on each instrument.
• Run the samples within 2 hours on both analyzers.
• "Many white cell count parameters including basophils and eosinophils often have correlation coefficients in the range of 0.2 to 0.5. Slopes and intercepts for such parameters are virtually worthless. The only important statistic resulting from this analysis is the bias at the upper and lower limits of the normal range." (EP Evaluator Report Interpretation Guide 8.0.0.165, David G. Rhoads Associates, Inc.)
Linear regression may not be an adequate statistical tool for analysis of the differential parameters due to the variability of the manual differential. Commonly used methods for determining clinically acceptable method comparison between automated differential and manual differentials are:
• Mean Difference
• Binomial Envelope Distribution
Mean Difference
The mean difference shows how much higher or lower the test instrument is compared to the current, or reference instrument results.
IMPORTANT
The responsibility to determine acceptable performance of data lies with the evaluating laboratory.

HEMATOLOGY PERFORMANCE VERIFICATION MANUAL
PN 4277076AB 4-3 of 6
Binomial Envelope Distribution
Binomial envelope distribution takes into account the imprecision of the manual differential. On the following pages are examples of binomial envelope graphs based on the Rumke Binomial Distribution Table4.
To plot the binomial envelope graph:
1. Select the plot that represents the number of cells counted on the manual differential vs. the automated differential.
a. Use the 0-100 scale for neutrophils (granulocytes) and lymphocytes.
b. Use the 0-30 scale for monocytes (mononuclears), eosinophils and basophils.
2. Each differential parameter should be plotted separately using the appropriate scale.
3. Plot the X-axis using either the manual diff value or the reference instrument value for a parameter.
Plot the Y-axis using the new method’s value.
4. When the test method (new instrument differential) is compared to the reference method (manual differential or reference instrument), it may be considered accurate when approximately 95 % of the data is contained within the envelope area.
NOTE On the monocyte (mononuclear) parameter plot, some points may fall outside the upper limit. Several publications have documented that monocyte counts derived from flow cytometry systems will be somewhat higher and more accurate than the routine 100-cell visual differential. Monocytes are particularly prone to poor distribution on the typical wedge smear.7 Refer to the Commentary section of Manual versus Automated Differentials: Comments.
HEMATOLOGY PERFORMANCE VERIFICATION MANUAL
PN 4277076AB 4-4 of 6
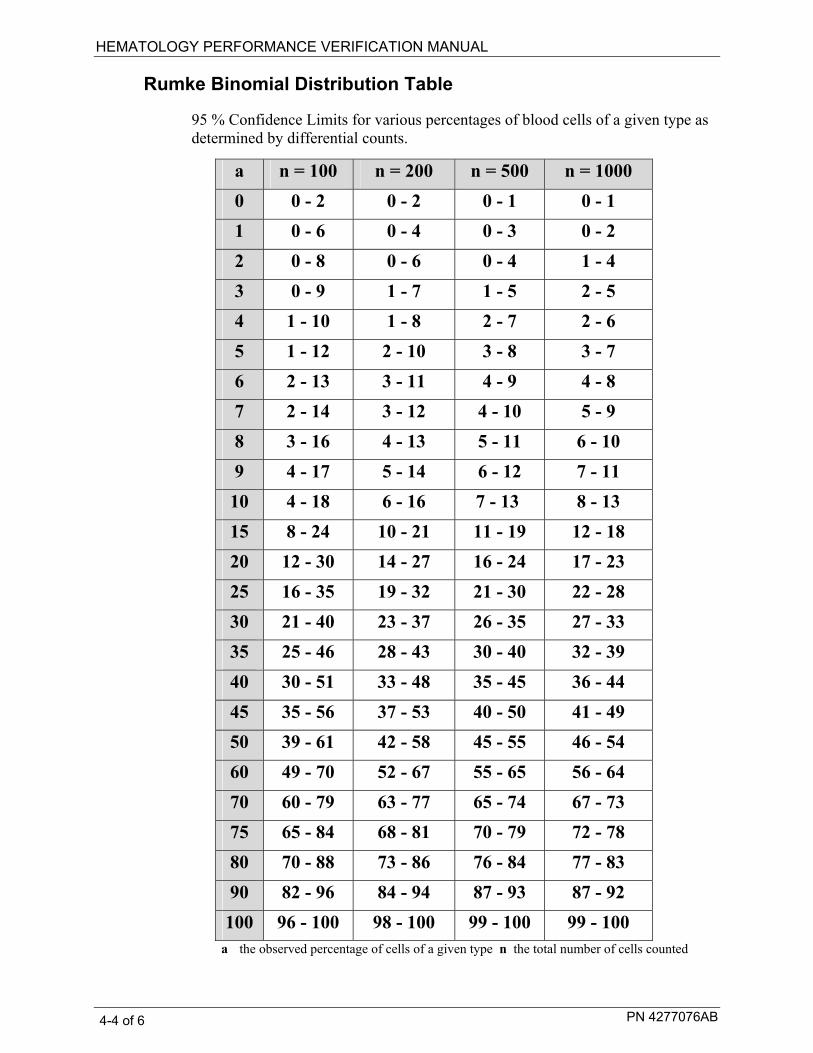
Rumke Binomial Distribution Table
95 % Confidence Limits for various percentages of blood cells of a given type as determined by differential counts.
a n = 100 n = 200 n = 500 n = 1000 0 0 - 2 0 - 2 0 - 1 0 - 1 1 0 - 6 0 - 4 0 - 3 0 - 2 2 0 - 8 0 - 6 0 - 4 1 - 4 3 0 - 9 1 - 7 1 - 5 2 - 5 4 1 - 10 1 - 8 2 - 7 2 - 6 5 1 - 12 2 - 10 3 - 8 3 - 7 6 2 - 13 3 - 11 4 - 9 4 - 8 7 2 - 14 3 - 12 4 - 10 5 - 9 8 3 - 16 4 - 13 5 - 11 6 - 10 9 4 - 17 5 - 14 6 - 12 7 - 11 10 4 - 18 6 - 16 7 - 13 8 - 13 15 8 - 24 10 - 21 11 - 19 12 - 18 20 12 - 30 14 - 27 16 - 24 17 - 23 25 16 - 35 19 - 32 21 - 30 22 - 28 30 21 - 40 23 - 37 26 - 35 27 - 33 35 25 - 46 28 - 43 30 - 40 32 - 39 40 30 - 51 33 - 48 35 - 45 36 - 44 45 35 - 56 37 - 53 40 - 50 41 - 49 50 39 - 61 42 - 58 45 - 55 46 - 54 60 49 - 70 52 - 67 55 - 65 56 - 64 70 60 - 79 63 - 77 65 - 74 67 - 73 75 65 - 84 68 - 81 70 - 79 72 - 78 80 70 - 88 73 - 86 76 - 84 77 - 83 90 82 - 96 84 - 94 87 - 93 87 - 92
100 96 - 100 98 - 100 99 - 100 99 - 100 a the observed percentage of cells of a given type n the total number of cells counted

HEMATOLOGY PERFORMANCE VERIFICATION MANUAL
PN 4277076AB 4-5 of 6
DIFFERENTIAL BINOMIAL GRAPHS - Examples
These are examples of typical graphs that are used to display and analyze your differential data. The graphs show the binomial envelopes used when comparing an automated differential to the manual differential or automated differential to automated differential. Use the appropriate envelope based on number of cells counted manually. When correlating an automated differential to an automated differential linear regression may be used.
Neutrophil Binomial Envelope
0102030405060708090
100
0 20 40 60 80 100Manual
Test
Inst
rum
ent
Use this scale graph to plot Neutrophils (granulocytes) or Lymphocytes..
Basophil Binomial Envelope
0
5
10
15
20
25
30
0 5 10 15 20 25 30LH750
Test
Inst
rum
ent
Use this scale graph to plot Monocytes or Mononuclears, Eosinophils, Basophils or NRBCs.
HEMATOLOGY PERFORMANCE VERIFICATION MANUAL
PN 4277076AB 4-6 of 6
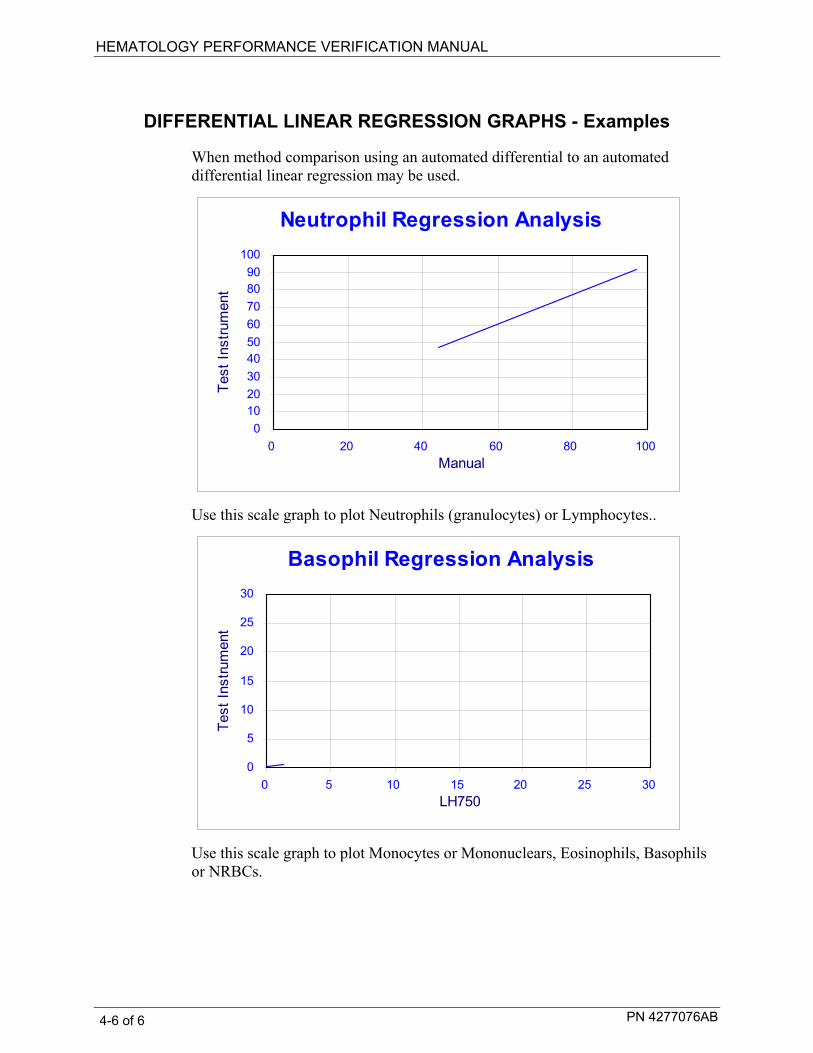
DIFFERENTIAL LINEAR REGRESSION GRAPHS - Examples
When method comparison using an automated differential to an automated differential linear regression may be used.
Neutrophil Regression Analysis
0102030405060708090
100
0 20 40 60 80 100Manual
Test
Inst
rum
ent
Use this scale graph to plot Neutrophils (granulocytes) or Lymphocytes..
Basophil Regression Analysis
0
5
10
15
20
25
30
0 5 10 15 20 25 30LH750
Test
Inst
rum
ent
Use this scale graph to plot Monocytes or Mononuclears, Eosinophils, Basophils or NRBCs.

PN 4277076AB 5-1 of 4
RETIC PARAMETERS COMPARISION 5
RATIONALE Method Comparison is a regulatory requirement to show agreement between two methods. Most often a new instrument will be compared to the lab's current method. The comparison must be completed before the new method is placed into use. Patient specimens for analysis are usually acquired from the lab's routine population. Some specimens should be specifically chosen to test the complete measuring range.
Before beginning the process of method comparison, verify the performance of both the current (reference) instrument or manual reticulocyte and the test instrument. Both methodologies should meet the appropriate specifications for quality control. Refer to your appropriate laboratory protocols or the respective product documentation for these procedures.
RETICULOCYTE DATA COLLECTION Collection of data should ensure that a typical distribution of normal patients and various abnormalities are included in the study. Obtain specimens with as wide a range of values as possible, over the reportable range of the method. Refer to your specific instrument documentation for ranges. Approximately one half of the specimens analyzed should be beyond the laboratory normal range if possible.28 The specimens should be:
• Collected according to the tube manufacturer’s instructions.
• Analyzed on the automated system and prepared for reference counts within 2 hours of each other or as close in time to each other as possible. Analysis should occur within the same time frame as the laboratory routinely analyzes specimens.
• Stored according to instrument documentation for temperature and stability.
If using a reference manual reticulocyte count for comparison, ensure that the inherent variations of the method are minimized. These variations include but are not limited to:
Preparation of stain
Sample/stain mixture incubation
Differences in slide preparation
Area of review
Technologist bias
HEMATOLOGY PERFORMANCE VERIFICATION MANUAL
PN 4277076AB 5-2 of 4
CLSI (H44)28 recommends two technologists each count 2000 RBCs using two different slides (total of 4000 RBCs counted). Data from each Beckman Coulter automated reticulocyte analysis are based on over 32,000 cells. More cells counted result in a more precise and accurate reference against which to judge the accuracy of the automated method. Statistical uncertainty of reference values is a direct function of the number of cells counted. The imprecision of the manual reticulocyte count is especially pronounced due to the low frequency of reticulocytes in the peripheral blood.
Two counts should agree within the laboratory’s acceptance limits. If the two counts do not agree, a third or “referee” count should be performed
Reticulocyte Considerations
• It is recommended that the determination is done promptly after collection of the blood specimen or alternatively, that the specimen be stored in such a way that it remains stable until the reticulocyte count is performed. With some reticulocyte dyes, there is an apparent in vitro maturation and subsequent disappearance of some of the reticulocytes, which is both time and temperature-dependent. For optimum performance, all specimens should be analyzed within time limits recommended by the manufacturer(s). The same specimen should be analyzed within 2 hours on all instruments for accurate comparison.
• If a manual retic count is performed, results of other test procedures, i.e. RBC morphology, should also be noted. Note: Poor statistics could be obtained because of the imprecision of the manual reticulocyte count. This will be especially pronounced in cell populations with lower numbers.
• Specimens should be selected to test the clinical sensitivity of the instruments and to represent the typical distribution of normal and abnormal.
50 % of specimens representative of normal range specimens
50 % of specimens representative of abnormal specimens (25% decreased and 25 % increased reticulocyte counts)
Results should span as much of the clinical range of the instrument as possible.
• If flow cell clogs, incomplete computation, partial aspirations or results with System Messages are observed for any specimen, repeat the analysis of that specimen on the evaluation instrument. Submit both original and repeat print outs.

HEMATOLOGY PERFORMANCE VERIFICATION MANUAL
PN 4277076AB 5-3 of 4
• Printed results for all specimens analyzed on all instruments should be obtained and labeled appropriately. For each specimen, collect the following data:
Printout from the Evaluation instrument
Printout from the reference instrument
Manual reticulocyte results (if applicable)
Any confirmatory results
If instrument has archive/export feature, archive/export specimen results to appropriate external media, such as a CD, 3.5 inch diskette or a flash drive and include with the printed results
DATA ANALYSIS Upon completion of specimen collection and processing, compare results from the test instrument and current instrument or methodology and review for acceptable method comparison.
IMPORTANT
Each laboratory is ultimately responsible for interpretation of method comparison data and develops its own evaluation criteria for acceptability of results.
Possible methods of data analysis include:
• Patient comparison, including:
Descriptive statistics (Mean, SD, CV)
Mean difference analysis (bias, accuracy)
Graphing
Linear regression, a commonly used statistical tool for laboratories, is not generally considered the best way to analyze Reticulocyte parameters where the manual reticulocyte count is used as reference. This is due to the high imprecision of the manual method and the low frequency of Reticulocytes in the peripheral blood. A more appropriate method of comparison is Mean difference analysis. Each individual laboratory must decide which method is appropriate for its own needs.

HEMATOLOGY PERFORMANCE VERIFICATION MANUAL
PN 4277076AB 5-4 of 4

PN 4277076AB 6-1 of 12
TRUTH TABLE ANALYSIS 6
INTRODUCTION One of the most important tasks to accomplish during the Implementation of any automated differential analyzer is to establish/verify an effective flagging protocol. The purpose of the flagging protocol is to identify those samples which require a slide review so that significant morphology detail can be added to the automated report. The extent to which an analyzer can effectively screen "normal" vs "abnormal" is defined as the instrument's clinical sensitivity. The Truth Table is an effective tool for evaluation of the instruments's clinical sensitivity.
The first step in establishing an effective flagging protocol is to clearly define those findings that are considered clinically significant. A significant finding would be considered some detail that could add value to the report and ultimately affect/improve patient care.
The next step is to identify ways to flag for these findings. Some flags and codes are already built into the analyzer and are generated when the analyzer detects an unusual or unexpected distribution of particles. Additional flags can be set up by the operator to reflect the laboratory's review requirements and to support the screening process.
Specimens determined to be abnormal by the automated system should be evaluated according to the laboratory’s protocols. Specimens determined to be normal by the automated system could be released without further review (autovalidation). The evaluation of the instrument's clinical sensitivity is critical because over-flagging may lead to unnecessary differential review, while under-flagging may miss abnormal samples.
The manual differential is used as a reference method to assess whether the instrument's flagging is appropriate. The lab determines the flagging limits which separate normal results from abnormal results, classifying each sample as a True Negative, True Positive, False Negative or False Positive. Reviewing and possibly adjusting the operator definable flags may further improve the efficiency of the automated differential system.
HEMATOLOGY PERFORMANCE VERIFICATION MANUAL
PN 4277076AB 6-2 of 12
IMPORTANT NOTE Beckman Coulter, Inc. does not claim to identify every abnormality in all samples. Beckman Coulter, Inc. suggests using all available flagging options to optimize the sensitivity of instrument results based on your patient population. All flagging options include reference ranges (H/L), action and critical limits, definitive flags, suspect flags, parameter codes, delta checks, decision rules and system alarms. Beckman Coulter, Inc. recommends avoiding the use of single messages or outputs to summarize specimen results or patient conditions All Truth Tables and associated recommendations reflect the extent to which your workflow may be managed efficiently but are limited to the sample data submitted for evaluation. Accepting any of the suggested recommended changes to the current review criteria would require appropriate changes to action limits and/or lab protocol that were in place at the time of this evaluation. Finally, all observations are recommendations and subject to your review and discretion in the formation of your Laboratory’s review and flagging protocols."
AUTOMATED VS MANUAL DIFF DATA COLLECTION When comparing the automated differential to the manual differential, ensure that the inherent variations of slide preparation are minimized by:
Making quality smears.
Staining with quality stain.
Using optically clean microscopes.
Having qualified technologists review the smear(s).
Specimens are identified by lab number on both printouts and microscopic slides for future reference.
CLSI (H20)3 recommends that two technologists each perform a 200 cell manual differential on two different slides (total of 400 cells analyzed). More cells counted results in a more precise and accurate reference against which to judge the accuracy of the automated method. Automated differential systems analyze thousands of cells. The following Rumke Binomial Distribution Table4, published by C.L. Rumke in 1978, illustrates that the statistical uncertainty of reference values is a direct function of the number of cells counted. The imprecision of the manual differential is especially pronounced with low numbers (e.g., monocyte, eosinophil and basophil percent).
HEMATOLOGY PERFORMANCE VERIFICATION MANUAL
PN 4277076AB 6-3 of 12
TRUTH TABLE DATA COLLECTION • The ideal truth table would include a minimum of 100 samples with 50%
having an abnormal slide review. Specimens should be collected into K2 or K3 EDTA. For optimum performance, all specimens should be analyzed within time limits recommended by the manufacturer(s). Analyze the same specimen within 2 hour on all instruments for accurate comparison. Refer to CLSI Standard for Reference Leukocyte (WBC) Differential Count (Proportional) and Evaluation of Instrumental Methods; H20-A2 or current revision.
• In addition, a complete manual differential should be performed. A complete manual differential includes WBC differential, RBC and Plt morphology and WBC and Plt estimate. Results of other test procedures, i.e. manual Plt count, should be also noted.
• Poor statistics could be obtained because of the imprecision of the manual differential. This will be especially pronounced in cell populations with lower numbers.
• The statistical error of the manual differential can be reduced by performing several 200-cell differentials. Differential counts by several technologists are preferred. The CLSI protocol (H20) recommends two (2) technologists each doing a 200-cell differential for each sample. If you choose to have multiple technologists perform manual differentials, average them and submit the average differential counts.
• Ensure a random sampling of the population. Specimens analyzed should therefore represent your a general hospital population. Results should span as much of the clinical range of the instrument as possible. Check your instrument specifications.
• Random sampling should include:
specimens with normal values.
abnormal specimens representing various types of leukocyte (WBC) disorders including but not limited to:
leukemias lymphocytosis lymphopenia
granulopenia granulocytosis
eosinophilia basophilia
abnormal specimens representing various types of erythrocyte (RBC) disorders including but not limited to:
hemoglobinopathy
polycythemia
microcytic anemias macrocytic anemias
HEMATOLOGY PERFORMANCE VERIFICATION MANUAL
PN 4277076AB 6-4 of 12
abnormal specimens representing various types of platelet (Plt) disorders, including but not limited to:
thrombocytosis thrombocytopenia
morphological platelet disorders
• If vote-outs, incomplete computation, partial aspirations or results with System Messages are observed for any specimen, repeat the analysis of that specimen on the evaluation instrument. Submit both the original and repeated values.
• Printed results for all specimens analyzed on all instruments should be obtained and labeled appropriately. For each specimen, collect the following data:
Printout from the Evaluation instrument(s)
Printout from the reference instrument
Manual differential results, note the total number of cells counted
Any confirmatory results
If instrument has archive feature, archive specimen results to appropriate external media, such as a floppy disk a CD, 3.5 inch diskette or a flash drive and include with the printed results

HEMATOLOGY PERFORMANCE VERIFICATION MANUAL
PN 4277076AB 6-5 of 12
DEFINE REVIEW LIMITS AND REVIEW PROTOCOL To evaluate current or proposed review limits for your laboratory’s patient population and specific needs:
1. Define and record a Test instrument review protocol on the Differential Review Limit Protocol Worksheet provided.
a. Record the instrument-generated flags that require further action.
b. Define the high and low limits your laboratory uses to take slide review action on an automated differential result.
c. Be specific, define less than and greater than with "or equal to" if applicable; e.g. if >10 % is your limit for Eosinophils, then 10 % is normal or negative and 11 % is abnormal or positive. Depending upon your protocol, results falling outside these abnormal limits require either a smear scan or a full manual differential.
HEMATOLOGY PERFORMANCE VERIFICATION MANUAL
PN 4277076AB 6-6 of 12
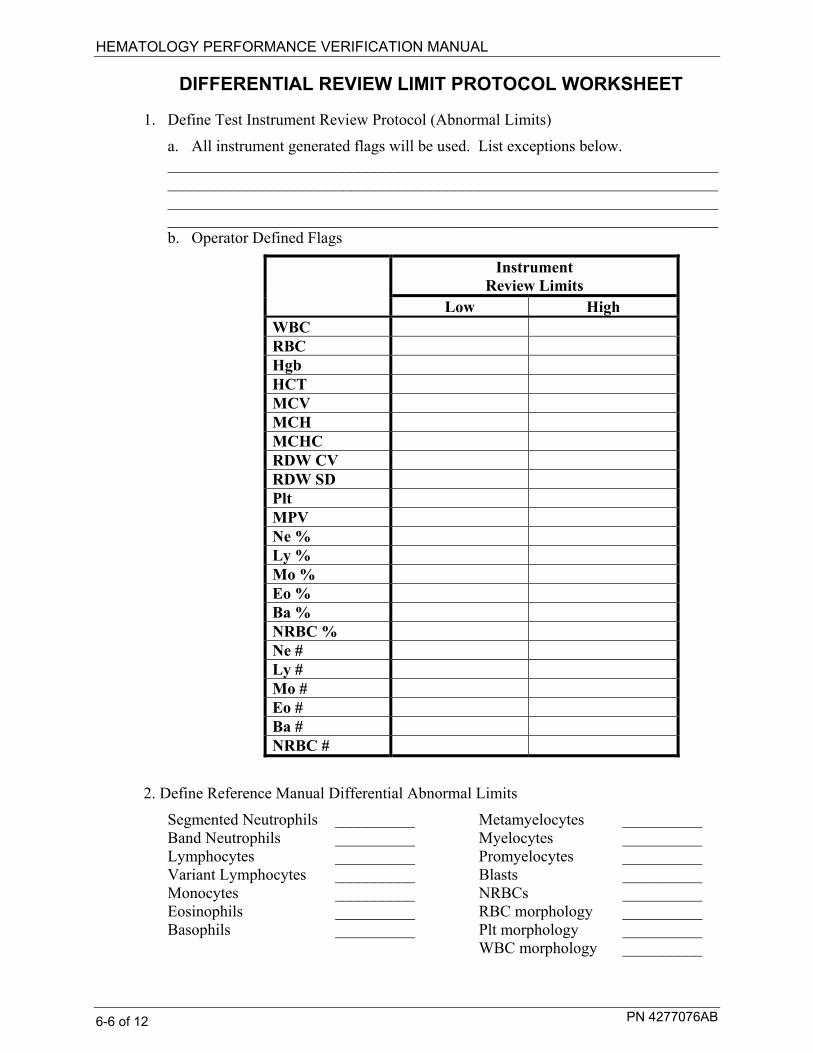
DIFFERENTIAL REVIEW LIMIT PROTOCOL WORKSHEET
1. Define Test Instrument Review Protocol (Abnormal Limits)
a. All instrument generated flags will be used. List exceptions below. __________________________________________________________________________________________________________________________________________ _____________________________________________________________________ _____________________________________________________________________ b. Operator Defined Flags
Instrument Review Limits
Low High WBC RBC Hgb HCT MCV MCH MCHC RDW CV RDW SD Plt MPV Ne % Ly % Mo % Eo % Ba % NRBC % Ne # Ly # Mo # Eo # Ba # NRBC #
2. Define Reference Manual Differential Abnormal Limits
Segmented Neutrophils __________ Metamyelocytes __________ Band Neutrophils __________ Myelocytes __________ Lymphocytes __________ Promyelocytes __________ Variant Lymphocytes __________ Blasts __________ Monocytes __________ NRBCs __________ Eosinophils __________ RBC morphology __________ Basophils __________ Plt morphology __________ WBC morphology __________

HEMATOLOGY PERFORMANCE VERIFICATION MANUAL
PN 4277076AB 6-7 of 12
HOW TO ESTABLISH A TRUTH TABLE The automated differential’s sensitivity, specificity and efficiency in distinguishing normal and abnormal specimens are determined using Truth Table analysis. The manual differential is used as a reference to assess whether the instrument has correctly classified the specimen as normal (released without further review-autovalidation) or abnormal (requiring review).
To perform a Truth Table Analysis:
1. For each specimen analyzed on the Beckman Coulter Analyzer:
a. Classify the instrument results as Normal (“negative”) if no flags or messages are present.
b. Classify the instrument results as Abnormal (“positive”) if flags or messages are present.
2. Perform a manual differential on all samples evaluated in Step 1.
a. Classify as Abnormal (“positive”) any morphological or distributional abnormality observed.
b. Classify as Normal (“negative”) any manual differential count in which all cell types are normal and within your established limits.
3. Categorize each specimen as one of the following four categories and record the results on the differential Truth Table Worksheet:
True Negative (TN): Normal (negative) by both test (new instrument) and reference (manual diff) methods.
True Positive (TP): Abnormal (positive) by both test (new instrument) and reference (manual diff) methods.
False Negative (FN): Normal (negative) by test method (new instrument) and abnormal (positive) by reference (manual diff) method.
False Positive (FP): Abnormal (positive) by test method (new instrument) and normal (negative) by reference method (manual diff).
4. Calculate and record on the Differential Truth Table Worksheet the following5:
a. True Negative: the percentage of specimens considered normal (negative) by both the test method (new instrument) and the reference method (manual diff).
% TN = (# True Negatives / total number of specimens) x 100 b. True Positive: the percentage of specimens considered abnormal
(positive) by both the test method (new instrument) and the reference method (manual diff).
% TP = (# True Positives / total number of specimens) x 100

HEMATOLOGY PERFORMANCE VERIFICATION MANUAL
PN 4277076AB 6-8 of 12
c. False Negative: the percentage of specimens considered normal by the
test method (new instrument) and abnormal by the reference method (manual diff).
Galen/Gambino5
% FN = (# False Negatives / total number of specimens) x 100
CLSI
%FN= (True Negative/(True Positive + False Negative)) x 100 d. False Positive: the percentage of specimens considered abnormal by the
test method (new instrument) and normal by the reference method (manual diff).
Galen/Gambino5
% FP = (# False Positives / total number of specimens) x 100
CLSI
% FP = (False Positive/(False Positive+TN)) X 100 e. Specificity: the percentage of manual differential normals that were also
normal on the instrument.
Specificity = # True Negatives ÷ # (True Negative+False Positives) x 100 f. Sensitivity: the percentage of manual differential abnormals that were also
abnormal on the instrument.
Sensitivity = # True Positives ÷ # (True Positives+False Negatives) x 100
g. Predictive Value of a Negative Test (PVN): the percentage of specimens that were normal on both the instrument and the manual differential.
PVN = # True Negatives ÷ # (True Negatives + False Negatives) x 100 h. Predictive Value of a Positive Test (PVP): the percentage of specimens
that were abnormal on both the instrument and the manual differential.
PVP = # True Positives ÷ # (True Positives + False Positives) x 100 i. Agreement: the percentage of specimens correctly categorized by the
automated differential.
[# (True Positives + True Negatives) ÷ total number of specimens] x 100
HEMATOLOGY PERFORMANCE VERIFICATION MANUAL
PN 4277076AB 6-9 of 12
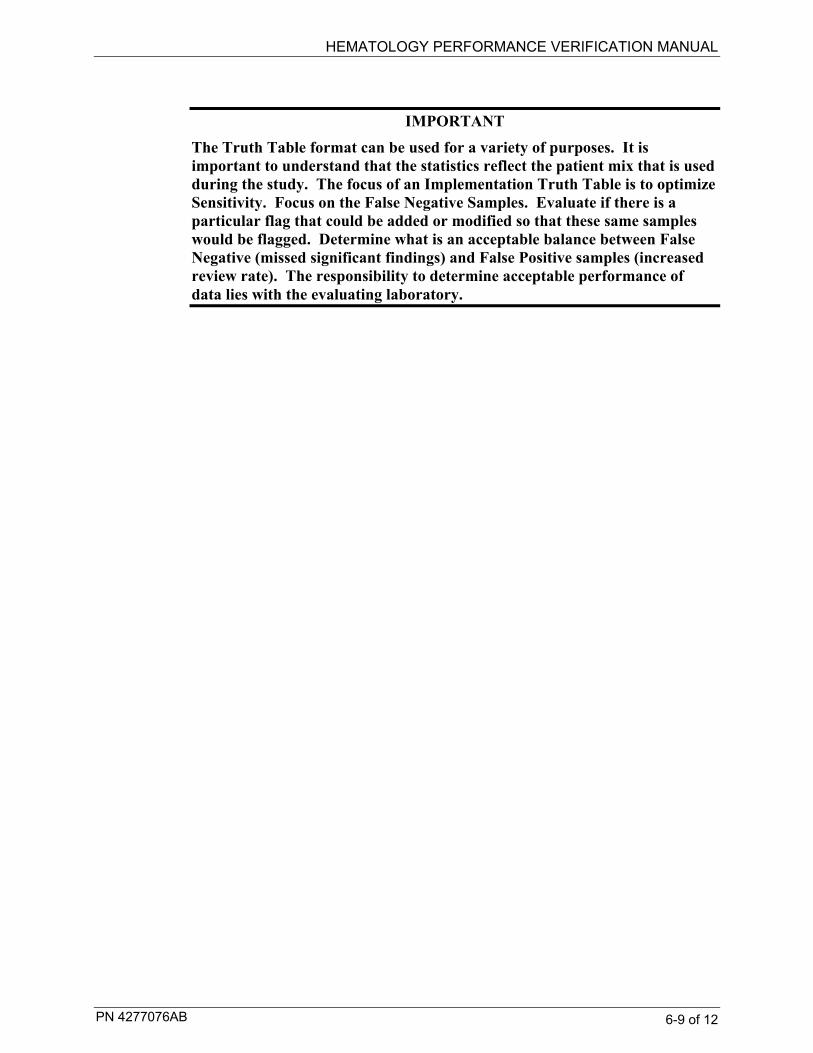
IMPORTANT
The Truth Table format can be used for a variety of purposes. It is important to understand that the statistics reflect the patient mix that is used during the study. The focus of an Implementation Truth Table is to optimize Sensitivity. Focus on the False Negative Samples. Evaluate if there is a particular flag that could be added or modified so that these same samples would be flagged. Determine what is an acceptable balance between False Negative (missed significant findings) and False Positive samples (increased review rate). The responsibility to determine acceptable performance of data lies with the evaluating laboratory.

HEMATOLOGY PERFORMANCE VERIFICATION MANUAL
PN 4277076AB 6-10 of 12
DIFFERENTIAL TRUTH TABLE WORKSHEET
1. Classify differentials into one of four categories and total each column.
Reference (Manual Differential)
Normal (Negative)
Abnormal (Positive)
Total
Normal (Negative)
(TN) (FN)
Abnormal (Positive)
(FP) (TP)
Test (New Instrument)
Total
2. Calculate the following parameters.
PARAMETER CALCULATION RESULT (%)
% TN Number of TN/Total
% TP Number of TP/Total
% FN Number of FN/Total
% FP Number of FP/Total
Specificity [# TN/ # (TN + FP)] x 100
Sensitivity [# TP/ # (TP + FN)] x 100
Predictive Value of a Negative Test [# TN/ # (TN + FN)] x 100
Predictive Value of a Positive Test [# TP/ # (TP + FP)] x 100
Agreement [# TP + # TN/Total] x 100
3. Reviewed by ___________________________________ Date ____________
HEMATOLOGY PERFORMANCE VERIFICATION MANUAL
PN 4277076AB 6-11 of 12
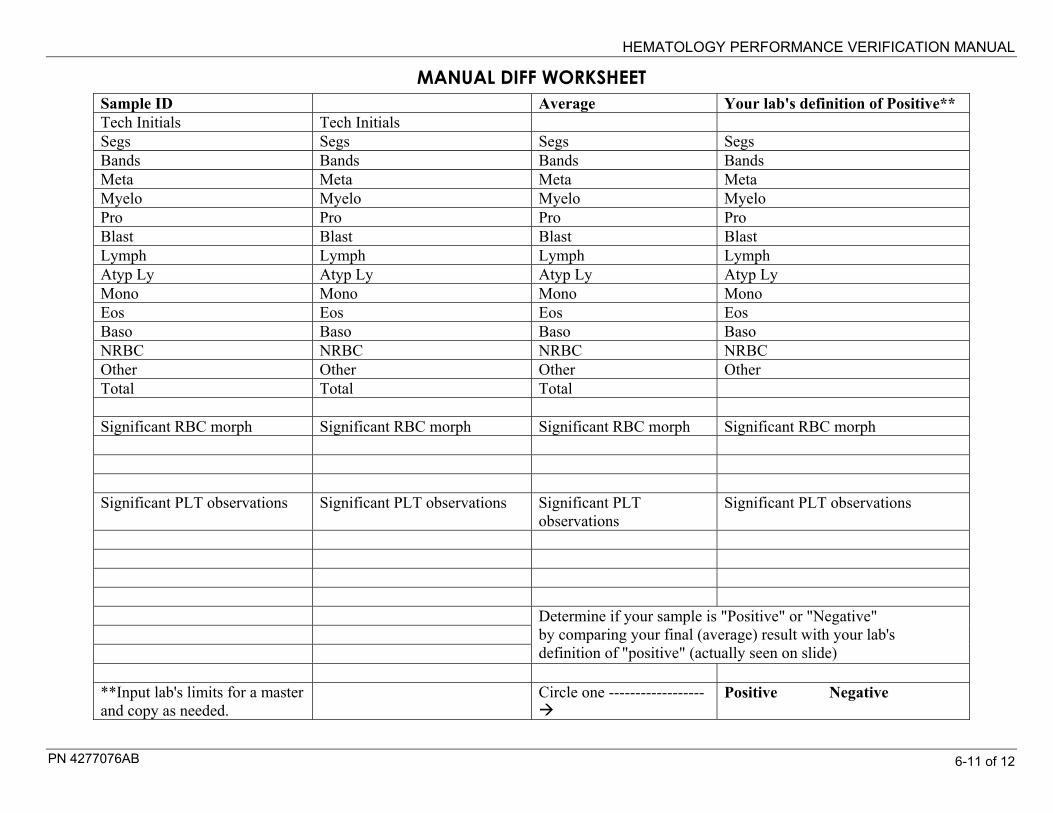
MANUAL DIFF WORKSHEET
Sample ID Average Your lab's definition of Positive** Tech Initials Tech Initials Segs Segs Segs Segs Bands Bands Bands Bands Meta Meta Meta Meta Myelo Myelo Myelo Myelo Pro Pro Pro Pro Blast Blast Blast Blast Lymph Lymph Lymph Lymph Atyp Ly Atyp Ly Atyp Ly Atyp Ly Mono Mono Mono Mono Eos Eos Eos Eos Baso Baso Baso Baso NRBC NRBC NRBC NRBC Other Other Other Other Total Total Total Significant RBC morph Significant RBC morph Significant RBC morph Significant RBC morph Significant PLT observations Significant PLT observations Significant PLT
observations Significant PLT observations
Determine if your sample is "Positive" or "Negative" by comparing your final (average) result with your lab's definition of "positive" (actually seen on slide)
**Input lab's limits for a master and copy as needed.
Circle one ------------------
Positive Negative

HEMATOLOGY PERFORMANCE VERIFICATION MANUAL
PN 4277076AB 6-12 of 12

PN 4277076AB 7-1 of 24
OTHER STUDIES 7
This section contains guidelines and examples. Each lab must establish their own protocols for instrument implementation and use. The following studies may be required by your current laboratory policies or your local regulatory agency.
Body Fluids Comparison
Measuring Range (Linearity)
Mode to Mode (if instrument has separate aspiration pathways)
Establish QC Lab Limits
Reference Interval (Normal Range)
Specimen Mixing Study
The following procedures will assist you in the evaluation a new instrument or clinical test. Not all of these procedures are required by CLIA; however, some of them may be required by the College of American Pathologists (CAP), the Joint Commission of Accreditation of Healthcare Organizations (known as JCAHO), and/or individual agencies. It is important to know local requirements as well as those of any other accrediting agencies that will impact your laboratory.

HEMATOLOGY PERFORMANCE VERIFICATION MANUAL
PN 4277076AB 7-2 of 24
HEMATOLOGY PERFORMANCE VERIFICATION MANUAL
PN 4277076AB 7-3 of 24
BODY FLUID COMPARISON
RATIONALE
Method Comparison is a regulatory requirement to show agreement between two methods. Most often a new instrument will be compared to the lab's current method. The comparison must be completed before the new method is placed into use. Patient specimens for analysis are usually acquired from the lab's routine population. Some specimens should be specifically chosen to test the complete measuring range.
A corrected RBC (RBC minus WBC) is often necessary in order to achieve acceptable method comparison. The RBC count will include all particles counted that are greater than 36 fL. When the WBC is elevated to a point of statistical relevance correct the RBC for the WBC count.
Beginning the process of method comparison, verify the performance of both the current (reference) instrument or manual cell count and the test instrument. Both methodologies should meet the appropriate specifications for quality control. Refer to your appropriate laboratory protocols or the respective product documentation for these procedures.
DATA ANALYSIS
Upon completion of specimen collection and processing, compare results from the current and test instrument or methodology and review for acceptable method comparison.
IMPORTANT
Each laboratory is ultimately responsible for interpretation of method comparison data and develops its own evaluation criteria for acceptability of results.
Possible methods of data analysis include:
• Patient comparison, including:
Descriptive statistics (Mean, SD, CV)
Mean difference analysis (bias, accuracy)
Graphing
Linear regression, a commonly used statistical tool for laboratories, is not generally considered the best way to analyze parameters where the manual count is used as reference. This is due to the high imprecision of the manual method and the low frequency of cells in some fluids.

HEMATOLOGY PERFORMANCE VERIFICATION MANUAL
PN 4277076AB 7-4 of 24

HEMATOLOGY PERFORMANCE VERIFICATION MANUAL
PN 4277076AB 7-5 of 24
Body Fluid Data Collection Manual Automated count Background
# Sample ID Fluid Type WBC RBC TNC RBC corrected RBC TNC RBC 1 2 3 4 5 6 7 8 9 10 11 12 13 14 15 16 17 18 19 20 21 22 23 24 25 26 27 28 29 30

HEMATOLOGY PERFORMANCE VERIFICATION MANUAL
PN 4277076AB 7-6 of 24
HEMATOLOGY PERFORMANCE VERIFICATION MANUAL
PN 4277076AB 7-7 of 24
MEASURING RANGE (LINEARITY) Verification of linearity may be required by your regulatory agency or your own laboratory protocol. You may purchase a commercial product. Follow the product insert for it's use. Verify instrument specific intended use. If you do not purchase a commerical product you may use this alternate method using whole blood, making serial dilutions of selected samples.
Whole blood linearity testing involves analysis of diluted specimens to measure performance of WBC, RBC, HGB, and PLT throughout the linear range. The specimens required will be instrument specific based on the manufacturer .
Check your instrument documentation for specifications to verify its linearity limits. The following steps are a general procedure that may be used to verify linearity:
1) For each parameter, select an appropriate specimen at/near the high end of the linear range. Ensure that sufficient specimen is collected for dilution preparation and aspiration.
2) A concentrated specimen can be used. Specimens should not have a Hct > 60-65 %.
3) Label five clean tubes 80 %, 60 %, 40 %, 20 % and 0.
4) Use isotonic diluent or blood bank saline to make dilutions. Samples should be run as soon as possible after preparation.
5) Prepare dilutions using the original specimen as 100 %.
6) Ensure the 100 % sample and the dilutions remain well mixed throughout the preparation process.
Prepare the samples as follows:
Dilution Specimen Diluent 100 % 10 parts 0 parts
80 % 8 parts 2 parts
60 % 6 parts 4 parts
40 % 4 parts 6 parts
20 % 2 parts 8 parts
10 % 1 part 9 parts
0 % 0 parts 10 parts
7) Analyze each of the dilutions in triplicate.
8) Record the results and plot on XY graph.
Visually examine the XY plot. The data should appear linear with no outlying points.
HEMATOLOGY PERFORMANCE VERIFICATION MANUAL
PN 4277076AB 7-8 of 24
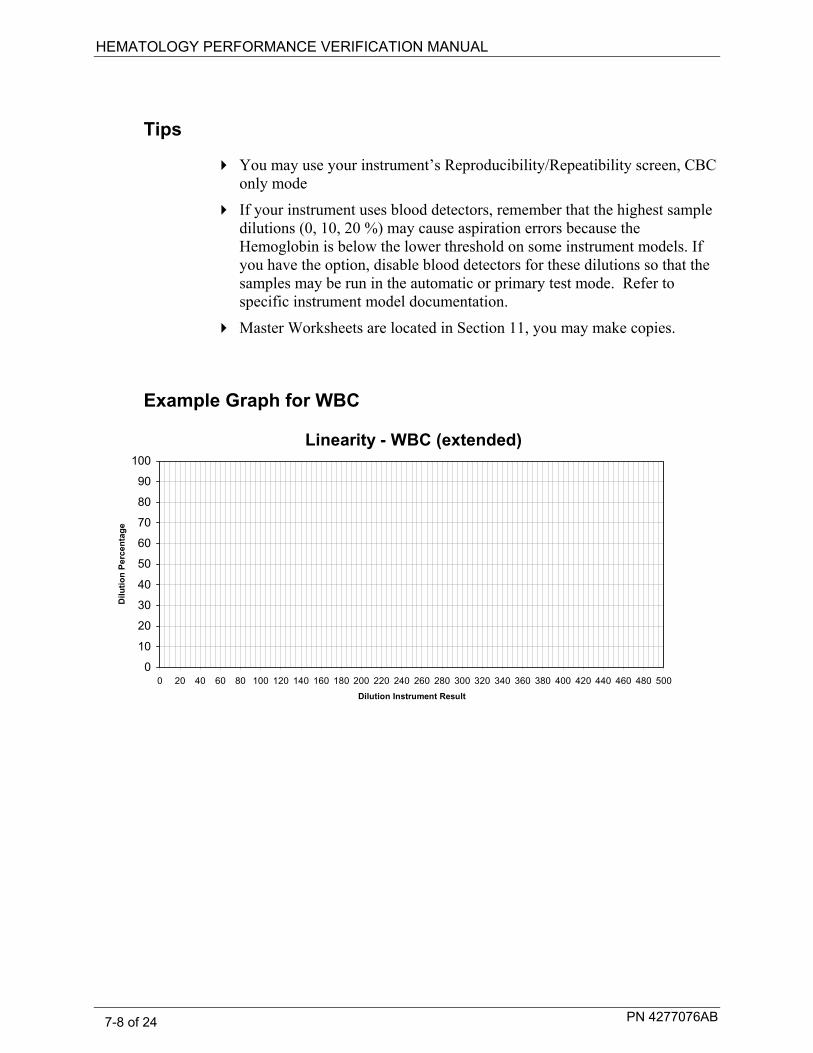
Tips
You may use your instrument’s Reproducibility/Repeatibility screen, CBC only mode
If your instrument uses blood detectors, remember that the highest sample dilutions (0, 10, 20 %) may cause aspiration errors because the Hemoglobin is below the lower threshold on some instrument models. If you have the option, disable blood detectors for these dilutions so that the samples may be run in the automatic or primary test mode. Refer to specific instrument model documentation.
Master Worksheets are located in Section 11, you may make copies.
Example Graph for WBC
Linearity - WBC (extended)
0
10
20
30
40
50
60
70
80
90
100
0 20 40 60 80 100 120 140 160 180 200 220 240 260 280 300 320 340 360 380 400 420 440 460 480 500Dilution Instrument Result
Dilu
tion
Perc
enta
ge

HEMATOLOGY PERFORMANCE VERIFICATION MANUAL
PN 4277076AB 7-9 of 24
MODE TO MODE COMPARISION
MANUAL MODE TO AUTOMATIC MODE VERIFICATION
Beckman Coulter recommends that Quality Control checks be performed using patient or commercial controls in both automatic (primary) and manual (secondary) modes at intervals established by your lab. Refer to your own laboratory protocol or your local regulatory agency. When using commercial control, refer to the package insert to determine which mode to use.
Purpose of Mode to Mode
This procedure is used on instruments that have different aspiration pathways. The procedure is used to verify that there are no significant differences between the manual and automatic aspiration modes, ensuring the WBC, RBC, Plt, and Hgb results for a specimen are the same regardless of the mode selected.
Tools/Supplies Needed
10 Fresh normal blood specimens.
Collecting the Data
Collect the necessary data in a Reproducibility mode if available on your instrument; run samples in the manual mode and again in the automatic mode. If using a Reproducibility mode ensure you print the runs before deleting for the second run set. 1. Select your instruments CBC mode. 2. Cycle the samples, aspirating each sample once.
3. After analyzing all the samples, obtain the mean values in both aspiration
modes. If running in Reproducibility the means will be calculated. 4. Calculate the absolute and percent difference using these formulas:
Absolute Difference = Automatic Mode Mean minus Manual Mode Mean Percent Difference = (Absolute Difference / Automatic Mode Mean) x 100
5. Compare the results to the specifications in your product documentation.
If the % and absolute difference (whichever is greater) results are within tolerance, you have verified the current mode to mode calibration is correct. If results do not meet your instrument specifications contact Customer Support.

HEMATOLOGY PERFORMANCE VERIFICATION MANUAL
PN 4277076AB 7-10 of 24
MODE TO MODE CONSIDERATIONS
The mode to mode specifications stated in your instrument documentation state a range for absolute difference and percent difference (use whichever is greater). By using the procedure stated and running only 10 samples each, you are either verifying that no differences exist, or identifying the need for further investigation. If required, the actual calibration procedures require 50 samples run in both modes or 10 samples run in triplicate. It is important you have clarity from your regulatory agency. Ask for written guidelines, for example:
CAP Hematology - Coagulation Checklist: 09/27/2007 HEM. 30070 Phase I YES NO
Are there data that periodically compare all results obtained for patient specimens analyzed in the multiple sampling modes of the CBC analyzer (e.g., "open" and "closed" modes) to ensure that they are in agreement? NOTE: Different modes may involve dilution or a different sample path before analysis. When samples are analyzed in more than one mode, it is important to ensure that all modes function properly. Re-analysis of a previously analyzed sample should be performed in the alternate mode(s), and results should agree with the initial mode within the tolerance limits established for agreement by the hematology laboratory's quality control program, and any recommendations by the instrument manufacturer.
Q.C. For Hematology Analyzers With Two Sample Modes
http://www.jointcommission.org/AccreditationPrograms/LaboratoryServices/Standards/09_FAQ Updated | November 24, 2008 Q.C. For Hematology Analyzers With Two Sample Modes Q: What is required for daily QC in hematology for an analyzer with two sample modes? A: Since there are two distinct sample pathways, QC is required for each sample mode according to the parameters established in the hematology standards.
HEMATOLOGY PERFORMANCE VERIFICATION MANUAL
PN 4277076AB 7-11 of 24
Specifically, the hematology standards require: 1. Performance of at least one control every eight hours of patient testing 2. Performance of at least two levels of commercial controls every 24-hours of patient testing 3. The controls used in the 24-hour period test the entire range of reported results As noted in the standards manual, patient controls may be used to supplement the commercial controls if an acceptable level of precision has been defined. For a single or primary mode, a 24-hour laboratory with three 8-hour shifts could perform one level of commercial control for two shifts (a different level on each shift) and a patient control for the third shift and be minimally compliant with the standards. In addition, the combination of controls must span the reportable patient range. Many laboratories still choose to perform three levels of commercial controls, with at least one level run on each 8-hour shift. In lieu of using commercial controls for QC of the secondary mode, laboratories may instead use patient controls whose values have been established in the primary mode when commercial controls were within acceptable ranges. For satisfactory compliance, patient controls should test the reportable range and have acceptable levels of precision defined in policy. The responsibility to determine acceptable performance of data lies with the laboratory.

HEMATOLOGY PERFORMANCE VERIFICATION MANUAL
PN 4277076AB 7-12 of 24
Mode to Mode Comparison Log
Instrument: _______________________ Serial Number:________________ Acceptable Limits** WBC ____ RBC ____ HBG ____ MCV ____ PLT _____ **Lab can define their own acceptable lab limits. Reference the mode to mode specifications in your instrument documentation for manufacturer claims.
Date: Aspiration Mode WBC RBC HGB MCV PLT Automatic Manual difference
Automatic Manual difference
Automatic Manual difference
Automatic Manual difference
Automatic Manual difference
Automatic Manual difference
Automatic Manual difference
Automatic Manual difference
Automatic Manual difference

HEMATOLOGY PERFORMANCE VERIFICATION MANUAL
PN 4277076AB 7-13 of 24
ESTABLISH LABORATORY LIMITS FOR QC
Purpose of Establishing Laboratory QC Limits
As noted by Westgard, 24 "Means, standard deviations, ranges and other data from outside your laboratory does not reflect the individual, particular conditions of your lab. The use of data supplied from outside the laboratory to provide means, standard deviations and control ranges is meant to be a temporary workaround." Thus each laboratory must establish its own commercial control means and ranges, using a cumulative approach to calculations. It is important you have clarity from your regulatory agency. Ask for written guidelines. The following procedure is suggested by JCAHO. 1. Obtain your last ten IQAP reports or your cumulative control statistics for the past 10-12 months printed from your instrument. 2. Document your CV% for each directly measured parameter for each level of control. (Your IQAP report lists CV% for directly measured parameters only. Other parameters are considered “calculated” parameters). See example below:
Caution! CV% from IQAP reports or cumulative statistics printouts may be erroneously low if your lab routinely deletes out-of-range controls.
______________________________________________________________________ EXAMPLE
Month # Abnormal II Hgb CV%
Abnormal I Hgb CV%
Normal Hgb CV%
1 1.29 0.80 0.41 2 1.17 0.69 0.52 3 1.23 0.71 0.49 4 1.25 0.66 0.70 5 0.98 0.59 0.65 6 1.32 0.48 0.71 7 1.27 0.62 0.51 8 1.38 0.74 0.79 9 1.30 0.68 0.48 10 1.15 0.79 0.62
Average 1.234 0.676 0.588
3. Compute the average CV%
4. From the control package insert, locate the Assigned Value for each parameter.
5. Multiply the average CV% obtained in step 3 above by the Assigned Value
then divide by 100. This is 1 SD. The formula is: (CV% x Assigned Value) / 100 = 1 SD.
HEMATOLOGY PERFORMANCE VERIFICATION MANUAL
PN 4277076AB 7-14 of 24
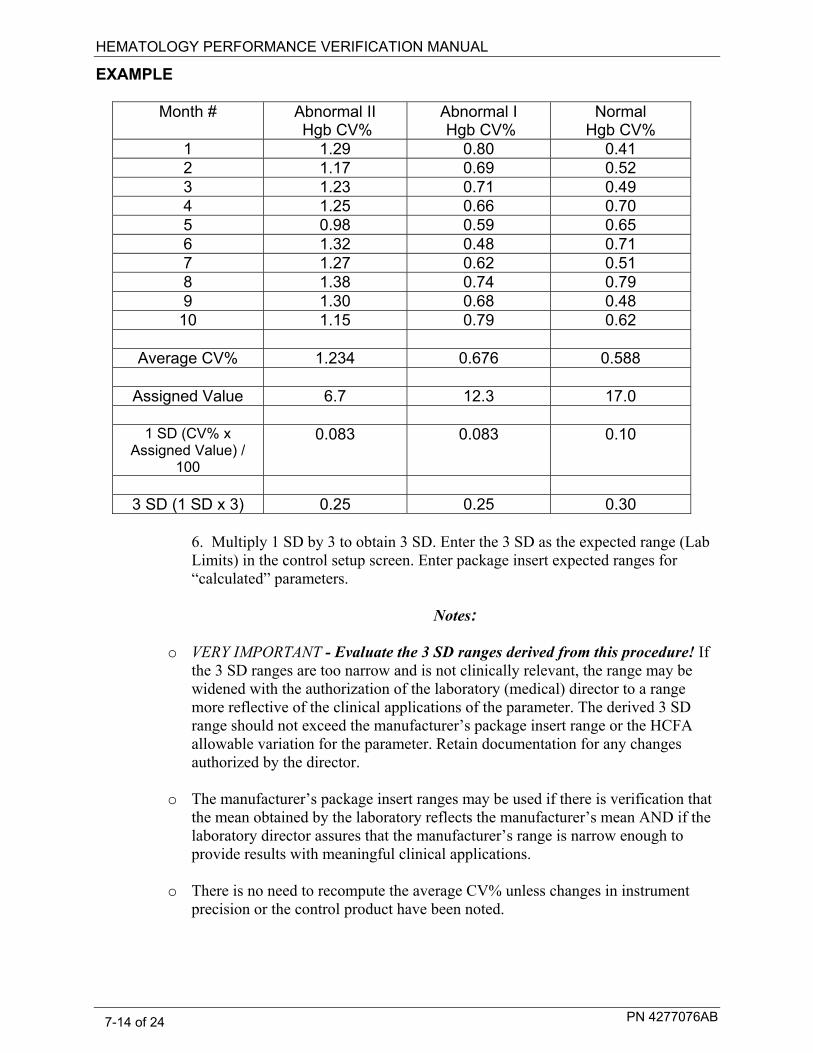
EXAMPLE
Month # Abnormal II Hgb CV%
Abnormal I Hgb CV%
Normal Hgb CV%
1 1.29 0.80 0.41 2 1.17 0.69 0.52 3 1.23 0.71 0.49 4 1.25 0.66 0.70 5 0.98 0.59 0.65 6 1.32 0.48 0.71 7 1.27 0.62 0.51 8 1.38 0.74 0.79 9 1.30 0.68 0.48 10 1.15 0.79 0.62
Average CV% 1.234 0.676 0.588
Assigned Value 6.7 12.3 17.0
1 SD (CV% x
Assigned Value) / 100
0.083 0.083 0.10
3 SD (1 SD x 3) 0.25 0.25 0.30
6. Multiply 1 SD by 3 to obtain 3 SD. Enter the 3 SD as the expected range (Lab Limits) in the control setup screen. Enter package insert expected ranges for “calculated” parameters.
Notes:
o VERY IMPORTANT - Evaluate the 3 SD ranges derived from this procedure! If the 3 SD ranges are too narrow and is not clinically relevant, the range may be widened with the authorization of the laboratory (medical) director to a range more reflective of the clinical applications of the parameter. The derived 3 SD range should not exceed the manufacturer’s package insert range or the HCFA allowable variation for the parameter. Retain documentation for any changes authorized by the director.
o The manufacturer’s package insert ranges may be used if there is verification that the mean obtained by the laboratory reflects the manufacturer’s mean AND if the laboratory director assures that the manufacturer’s range is narrow enough to provide results with meaningful clinical applications.
o There is no need to recompute the average CV% unless changes in instrument precision or the control product have been noted.
HEMATOLOGY PERFORMANCE VERIFICATION MANUAL
PN 4277076AB 7-15 of 24
ESTABLISHING LAB LIMITS CONSIDERATIONS
The Joint Commission Use of Manufacturer Quality Control Ranges
http://www.jointcommission.org/AccreditationPrograms/LaboratoryServices/Standards/FAQ Updated November 24, 2008 Q; Can the manufacturer’s stated ranges be used as the laboratory’s quality control ranges? A: The standards require each laboratory to establish their own control ranges through repetitive testing. However, there is an allowance to use manufacturer ranges when the following conditions are met: 1. The stated values correspond to the method and instrument used by the
laboratory, and 2. The mean obtained by the laboratory reflects the manufacturer’s stated mean,
and 3. The Laboratory Medical Director assures the range is narrow enough to detect
clinically significant error. Manufacturer ranges may also be implemented if a test is used so infrequently that calculation of valid statistics is not possible. In settings where there is a high reproducibility (precise instrumentation, limited testing personnel), the laboratory’s own calculated standard deviation (SD) may be small. When compared with the manufacturer ranges, a laboratory may find that the range spans more than the commonly used + / - 2 SD. Using the laboratory’s calculated + / - 2 SD may produce unnecessarily narrow ranges, causing the testing personnel to frequently repeat QC and investigate when the controls performs outside laboratory’s range, but within the manufacturer’s range. Alternately, the full manufacturer range may be too broad to promote the detection of clinically significant error. Selection of the appropriate range is a balance between these two ends of the spectrum.
It is at the determination of the Laboratory Medical Director to approve quality control ranges after giving consideration to the clinically significant variance as compared to the statistically derived SD.
HEMATOLOGY PERFORMANCE VERIFICATION MANUAL
PN 4277076AB 7-16 of 24
CAP Requirements: Hematology - Coagulation Checklist: 09/27/2007
HEM.20035 Phase II Are tolerance limits (numeric and/or non-numeric) fully defined and documented for all hematology and coagulation control procedures? NOTE: The goal is to have scientifically valid, logical "action limits" for quality control procedures that promptly alert the technologist of the need for immediate evaluation of the particular assay, including initiation of corrective action, before release of patient results. HEM.25870 Phase II If commercially ASSAYED controls are used for CBC instruments, do control values correspond to the methodology and have target values (mean and QC ranges) been verified or established by the laboratory? NOTE: Most commercial controls have expected recovery ranges for each parameter, provided by the manufacturer. The mean of such ranges may not be the exact target value in a given laboratory. Each laboratory should assign its own initial target value, based on initial analysis of the material; this target value should fall within the recovery range supplied by the manufacturer, but need not exactly match the package insert mean. The laboratory should establish specific recovery ranges that accommodate known changes in product attributes, assuming that calibration status has not changed. Other references; the CLSI Document C24 Internal Quality controls Testing: Principles and Definitions for establishing each laboratory's individual mean target values and ranges32, and CLIA Title 42 part 493 subpart K, Quality Control Test for Moderate and High Complexity, Section 493.1256, Standard Control Procedures.

HEMATOLOGY PERFORMANCE VERIFICATION MANUAL
PN 4277076AB 7-17 of 24
REFERENCE INTERVALS (NORMAL RANGES)
The CLIA Quality System Regulations became effective on April 24, 2003. Now the laboratory is required to check (verify) the manufacturer’s performance specifications provided in the package insert – for accuracy, precision, reportable range, and reference range.
In order to establish a reference interval/range, Clinical and Laboratory Standards Institute (CLSI) recommends labs collect a sufficient number of qualified reference donors to produce a minimum of 120 samples. This can be a difficult task. Therefore, CLSI strongly encourages laboratories to verify reference values established by the manufacturer or established by another laboratory.28
To verify a reference interval/range: 1. If a lab has previously established a reference interval (using 120 samples) for
it's population, it may verify that reference interval by transference. a. You may use transference if the original study was conducted
using the same analytical system/reagents and the original study was conducted with similar subject population as your lab.
b. Perform a method comparison between your new method and the
method used in the original study. You may use samples that exceed the reference interval. Evaluate the relationship between the two methods. If the new method provides values that are acceptably comparable, then the reference interval/range can be transferred.
2. Or, a lab may verify a reference interval/range established elsewhere or by the
manufacturer by collecting a minimum of 20 samples from qualified, healthy reference donors. Your 20 donors must fairly represent your population and the population in the original study.
The original study's reference interval/range may be considered valid if no more than two of the 20 donors' values (or 10% of the results) fall outside of the original study's limits.
In general, specimens should be handled in a manner similar to the patient samples.
HEMATOLOGY PERFORMANCE VERIFICATION MANUAL
PN 4277076AB 7-18 of 24
TIP: You may use Control Folders to assist in gathering and computing reference range data. Verify the number of runs that a control folder will hold on your instrument. You may verify all adult normals or each sex individually. Set up a control folder for “Male” and another control file for “Female” or one folder called “Adult” for both sexes. It is not necessary to enter Assigned Values or Expected Ranges. Your instrument may have a "Studies" mode to use instead of Control Folders. Carefully choose your samples to be included in the Reference Interval Study. If you have set up control folders on your instrument run them into the appropriate control folders. If you are using "Studies", you will also need to set to batch. Ensure the samples are batched properly or run into correct control folders for male, female or adult.
Once you have 20 samples in the control folder(s), archive or export the control folders into a spreadsheet. Apply 95% confidence limits to the data. Example of formulas if you are using an Excel spreadsheet: Lower 95% confidence limits: =PERCENTILE(A2:A41,0.025) Upper 95% confidence limits: =PERCENTILE(A2:A41,0.975) Note: A@ and A41 are examples of a range of data cells in the spreadsheet. Your actual range of data cells may be different.
It is up to your laboratory to evaluate the Reference Range data
and determine the acceptability and utility of the data.
References 1. Clinical and Laboratory Standards Institute. Defining, Establishing and Verifying Reference Intervals in the Clinical Laboratory; Approved Guideline. CLSI document C28-A3, 2008 2. Clinical and Laboratory Standards Institute. Method Comparison and Bias Estimation Using Patient Samples; Approved Guideline. EP9.

HEMATOLOGY PERFORMANCE VERIFICATION MANUAL
PN 4277076AB 7-19 of 24
Introduction The accuracy of whole blood cell counting by any method is based on the assumption
that the specimen being analyzed is homogeneous. It is therefore, imperative that one ensures that a specimen is properly mixed prior to analysis. Each laboratory should have defined protocols for all pre-analytical (specimen collection, storage and mixing) and analytical (instrument) processes. These protocols should take into account the manufacturer’s instructions for use for both the blood collection device and the analytical instrument.
Background
When an anti-coagulated whole blood specimen tube is placed in a vertical position, the cellular components tend to fall to the bottom of the container. The erythrocytes (RBCs) concentrate at the bottom of the tube with leukocytes (WBCs) and platelets (PLTs) layered on the top of the cellular component. The WBC and PLT layer is commonly called the buffy coat. Plasma and cellular factors can affect the rate of settling. Elevated levels of fibrinogen, globulins and cholesterol have been reported to accelerate the rate of sedimentation. Anemia (low number of RBCs) also increases the rate of sedimentation of a sample. Specimens with high concentration of RBCs will settle slowly. The longer that the specimen has been allowed to settle, the longer the required time to resuspend the cells thoroughly.
If a settled specimen is not adequately mixed, results will be compromised. The pattern
of results is dependent on how long the tube has settled and where the sample is taken from inside the tube. If the aspiration device is inserted through the buffy coat towards the bottom of the tube, there is a typical pattern of parameter results, which show elevated RBC/HGB and decreased WBC/PLT. See the following examples.
Example 1 WBC RBC HGB HCT MCV MCH MCHC RDW PLT MPV
Run 1 Unmixed Specimen
7.0 5.88 16.6 50.9 86.5 28.3 32.7 20.5 171 7.4
Run 2 Actual results A
10.1 2.33 6.8 20.4 87.8 B 29.3 33.4 21.0 453 8.3 C
Relationship of Run 1 to Run 2
⇩ ⇧ ⇧ ⇧ ⇔ ⇔ ⇔ ⇔ ⇩ ⇔
A: Specimen in both runs remixed, 16 hours later ⇩ Decreased, ⇧ Increased, ⇔ No change [mixed and unmixed results essentially equal] B: Slight increase due to age of specimen C: Slight increase due to age of specimen
Specimen Mixing
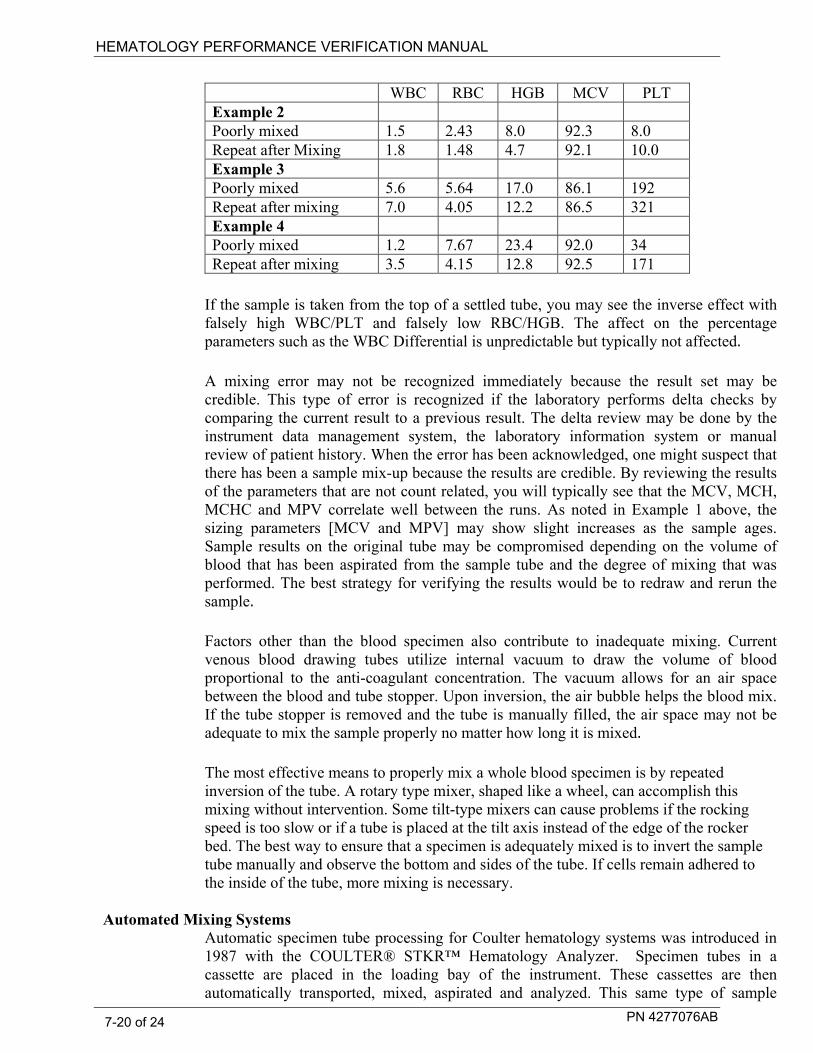
HEMATOLOGY PERFORMANCE VERIFICATION MANUAL
PN 4277076AB 7-20 of 24
WBC RBC HGB MCV PLT Example 2 Poorly mixed 1.5 2.43 8.0 92.3 8.0 Repeat after Mixing 1.8 1.48 4.7 92.1 10.0 Example 3 Poorly mixed 5.6 5.64 17.0 86.1 192 Repeat after mixing 7.0 4.05 12.2 86.5 321 Example 4 Poorly mixed 1.2 7.67 23.4 92.0 34 Repeat after mixing 3.5 4.15 12.8 92.5 171
If the sample is taken from the top of a settled tube, you may see the inverse effect with
falsely high WBC/PLT and falsely low RBC/HGB. The affect on the percentage parameters such as the WBC Differential is unpredictable but typically not affected.
A mixing error may not be recognized immediately because the result set may be credible. This type of error is recognized if the laboratory performs delta checks by comparing the current result to a previous result. The delta review may be done by the instrument data management system, the laboratory information system or manual review of patient history. When the error has been acknowledged, one might suspect that there has been a sample mix-up because the results are credible. By reviewing the results of the parameters that are not count related, you will typically see that the MCV, MCH, MCHC and MPV correlate well between the runs. As noted in Example 1 above, the sizing parameters [MCV and MPV] may show slight increases as the sample ages. Sample results on the original tube may be compromised depending on the volume of blood that has been aspirated from the sample tube and the degree of mixing that was performed. The best strategy for verifying the results would be to redraw and rerun the sample.
Factors other than the blood specimen also contribute to inadequate mixing. Current venous blood drawing tubes utilize internal vacuum to draw the volume of blood proportional to the anti-coagulant concentration. The vacuum allows for an air space between the blood and tube stopper. Upon inversion, the air bubble helps the blood mix. If the tube stopper is removed and the tube is manually filled, the air space may not be adequate to mix the sample properly no matter how long it is mixed.
The most effective means to properly mix a whole blood specimen is by repeated
inversion of the tube. A rotary type mixer, shaped like a wheel, can accomplish this mixing without intervention. Some tilt-type mixers can cause problems if the rocking speed is too slow or if a tube is placed at the tilt axis instead of the edge of the rocker bed. The best way to ensure that a specimen is adequately mixed is to invert the sample tube manually and observe the bottom and sides of the tube. If cells remain adhered to the inside of the tube, more mixing is necessary.
Automated Mixing Systems
Automatic specimen tube processing for Coulter hematology systems was introduced in 1987 with the COULTER® STKR™ Hematology Analyzer. Specimen tubes in a cassette are placed in the loading bay of the instrument. These cassettes are then automatically transported, mixed, aspirated and analyzed. This same type of sample

HEMATOLOGY PERFORMANCE VERIFICATION MANUAL
PN 4277076AB 7-21 of 24
transport has been implemented on other Coulter analyzers such as the COULTER STKS™, ONYX™ Autoloader, MAXM™ Autoloader, GEN•S™, HMX Autoloader, and LH Series.
As part of each new Beckman Coulter product validation, extensive studies are done internally to verify that the mixing of the specimen on the Coulter Hematology analyzer is sufficient to ensure that samples are homogeneous at the time of sample aspiration. Studies may include the following types of challenges: • Centrifuging specimens to simulate exaggerated settling times • Concentrating specimens to simulate high RBC counts by removing plasma from the
tube • Various tube sizes and shapes (surface area to volume ratios) • Different cap shapes and materials (standard latex, Hemogard type) • Different anti-coagulants [K2, K3 and NA2EDTA] and concentrations • Varying the volume of blood within a sample tube (over and under anticoagulation) • Different vendor sample tubes • Plastic versus glass • Different storage temperatures
The efficacy of mixing is tested against the mode to mode specification for WBC, RBC,
HGB and PLT and the accuracy specification for MCV, RDW and MPV. The test case results are compared to specimens mixed 5-10 minutes on a Clay Adams Nutator mixer prior to analysis on the hematology analyzer.
All cassettes in these studies were introduced at the loading bay and completed the entire premixing done on the rocker bed. Even if properly processed, some tubes exhibit mixing problems. If additional pre-mixing is necessary for a particular tube type, it is stated in the Tube List in the Operators Guide. If samples are introduced directly to the rocker bed, sample mixing may be inadequate to ensure quality results.
Method Verification No matter how comprehensive, internal testing cannot mimic all possible laboratory
workflows. For that reason, a laboratory should perform a study with its own typical pre-analysis conditions. When setting up a study, considerations should include but may not be limited to: • Specimen collection tubes types • Tube size and material (glass versus plastic) • Mode of collection (venous, syringe fill, micro-collection) • Volume of blood collected within the sample tube • Time between draw and analysis • Storage temperature • Transport mode to laboratory • Mode of introduction of cassette to analyzer
Laboratory accreditation agencies look for quality assurance documentation for blood collection from point of patient identification to reporting results. Specimen mixing is just one of the pre-analytical steps in the process that needs to be documented as part of a complete quality assurance program. The CAP Accreditation Program Checklist4,

HEMATOLOGY PERFORMANCE VERIFICATION MANUAL
PN 4277076AB 7-22 of 24
Question: Heme:22000 [Phase II] asks:
Are all blood specimens collected in anticoagulant for hematology testing mixed thoroughly immediately before analysis?
They also include the following commentary. COMMENTARY:
Specimens collected in anticoagulants for hematology studies must be mixed thoroughly immediately before analysis. There must be documentation that specimen mixing by rotary mixer, rocker, automated sampler, or manual inversions is sufficient to ensure reproducibility of CBC results. Some rocking platforms may be adequate to maintain even cellular distribution of previously well-mixed specimens, but are incapable of fully mixing a settled specimen. For instruments with automated samplers, the laboratory must ensure that the automated mixing time is sufficient to homogeneously disperse the cells in a settled specimen.
Conclusion Adequate sample mixing is a critical part of an accurate cell counting method. A
laboratory is best served to define their typical pre-analytical workflow and to verify that procedures are in place to ensure that samples received for cell counting are adequately mixed prior to analysis.
References
1. Clinical Laboratory Standards Institute. Procedures for the collection of diagnostic blood specimens by venipuncture - third edition; approved standard H3-A3. Wayne, PA: CLSI, 1991:
2. Clinical Laboratory Standards Institute. Procedures for the collection of diagnostic blood specimens by skin puncture - third edition; approved standard H4-A3. Wayne, PA: CLSI, 1991.
3. Clinical Diagnosis and Management by Laboratory Methods, 18th edition, J.B Henry, M.D, 1991, W.B.Saunders, pp. 599 - 601.
4. Inspection Checklists and Commentary for Laboratory Accreditation, College of American Pathologists, October 2006, http://www.cap.org.
Note: As of 2005, the name of the National Committee for Clinical Laboratory has changed to Clinical and Laboratory Standards Institute (CLSI).

HEMATOLOGY PERFORMANCE VERIFICATION MANUAL
PN 4277076AB 7-23 of 24
VERIFY ADEQUATE MIXING The following is a suggested method for testing adequate mixing. Obtain 10 fresh normal blood samples. Make sure the tubes are filled properly. Do not use underfilled sample tubes. Premix the blood samples on a laboratory rocker for at least 5 minutes. Immediately load all 10 samples into a cassette(s) starting with position 1 and analyze. Record results for WBC, RBC, HGB and PLT on the log sheet. Remove the sample tubes from the cassette(s) and place the tubes upright into a laboratory test-tube rack. Allow the sample tubes to sit UNDISTURBED for 4 hours. After 4 hours, place a single tube into position 1 of a cassette and load onto the instrument WITH NO PREMIXING. Allow the analyzer to perform all mixing. Record the results for this analysis on a log sheet. Repeat with the remaining 9 sample tubes – run each sample tube individually in position 1 of a cassette with no premixing and record the results. Wait until the previous sample’s cassette has unloaded before loading the next sample’s cassette. Compute the absolute difference, percent difference for each sample and the mean absolute difference and mean percent difference. Absolute Difference = Premixed result minus Analyzer mixed result Percent Difference = (Absolute Difference / Premixed result) x 100
IMPORTANT
The responsibility to determine acceptable performance of data lies with the evaluating laboratory.

HEMATOLOGY PERFORMANCE VERIFICATION MANUAL
PN 4277076AB 7-24 of 24
Verify Adequate Mixing Logsheet Instrument: ________________________________ Date: _____________________________________ Tech: _____________________________________
Number Sample ID Premixed WBC
Analyzer mixed WBC
Absolute Difference
% Difference
Premixed RBC
Analyzer mixed RBC
Absolute Difference
% Difference
1 2 3 4 5 6 7 8 9 10
Average
Number Sample ID Premixed HGB
Analyzer mixed HGB
Absolute Difference
% Difference
Premixed PLT
Analyzer mixed PLT
Absolute Difference
% Difference
1 2 3 4 5 6 7 8 9 10
Average

PN 4277076AB 8-1 of 8
COMMENTARY 8
COMMENTARY
Manual Differential versus Automated Differential
In the process of correlating an automated differential system with the traditional manual differential, questions or concerns may be raised by laboratory staff, pathologists, or physicians regarding the effectiveness of these methods. The following is a collection of excerpts, from various articles which may answer any questions or concerns.
I. Manual Diff (General)
Discussion of factors which affect the precision of the manual differential.
Comment 1. Dutcher TF7 states: Prior to judging the worth of a routine 100 or 200 cell differential as a screening test, an admission test, or a repeated follow-up test, a number of factors deserve consideration, including the following:
• Technically imperfect smears
• Non-random distribution of cells in smears and non-random search patterns by technologists
• Lack of consensus of definition of cell types particularly bands, polys, monocytes, and atypical lymphocytes
• Intra and inter-observer inconsistencies of cell identification, particularly with bands, polys, monocytes and atypical lymphocytes
• Statistical effect of counting only 100 to 200 cells, including the probability of finding small populations
• Correlation with disease
• Physiology variability of cell classification
It is widely accepted that the distribution of cells in the usual wedge smear is not random. Monocytes tend to congregate at the edge of the smear, lymphocytes in the central area, and neutrophils in the feathered edge. Further, technologists usually begin the differential search in the center of the smear and move toward the edge, but seldom get there because the morphology of the cells becomes less crisp.
Koepke9 concluded that except for patients with a hematological disease, more than 75 percent of the total variance in neutrophils, lymphocytes, monocytes, and basophils was due to analytical and sampling variability and physiologic changes; the variance was not due to disease. Considering all of the analytic variables involved, it should be apparent that the traditional leukocyte differential is one of the worst procedures offered by the hematology laboratory.

HEMATOLOGY PERFORMANCE VERIFICATION MANUAL
PN 4277076AB 8-2 of 8
General diff Comment 2. Rumke CL4 states: A blood contains 10% monocytes. A large number of survey smears are prepared. In each smear n=100 cells are differentiated…the limits of the 95% prediction interval are 5% and 16%. That is, about 95% of the survey results will lie between 5% and 16%.
General Diff Comment 3. Keopke JA9 states: The performance of [routine, 100-cell] differential leukocyte counting by 73 technologists and technicians working in five different laboratories in a large medical center [Duke University Medical Center, Durham, NC] was evaluated…
Good correlation with the reference method CLSI H203 : 200 cell differentials performed by each of four referees on four peripheral blood smears, combined for a total 800-cell count] was found for neutrophils [r = 0.87, comparing 100-cell diff with reference diff], normal lymphocytes [r = 0.73 ], and eosinophils [ r= 0.83 ].
More variability was noted in the estimation of stab neutrophils [ r= 0.67 ], variant lymphocytes [ r= 0.30 ], and monocytes [ r= 0.41].
In the Clinical Sensitivity analysis of the data, there was a 20% False normal rate for ‘monocytosis’ i.e. 20% of the specimens determined the 800-cell reference differential to exhibit ‘monocytosis’ (defined as greater tha 12% monocytes) were classified as ‘normal’ by the routine 100-cell differential.
It is widely appreciated that the 100-cell differential count suffers from relatively poor precision as well as the subjectivity inherent in cell classification.
General Diff Comment 4. Bessman JD10 states: The statistical variation… of a 10% eosinophil count is nearly 100% of the value… Band counts are similarly unreliable.
Detection of increase bands adds little to diagnosis of infection of inflammation in subjects with neutrophilia and is of uncertain value in subjects with normal white blood cell counts. Increased bands may precede neutrophilia as a sign of infection. However, the quantitation of bands is so variable that several groups have suggested the band elevation adds little to patient management.3, 12, 14, 15

HEMATOLOGY PERFORMANCE VERIFICATION MANUAL
PN 4277076AB 8-3 of 8
II. Manual Diff (Bands)
Comments on the clinical utility of the ‘band count’.
Band comment 1. Clarke G., MD on behalf of the Hematology working group for CCQLM (Canadian Coalition for Quality in Laboratory Medicine). 27 Toward Abandoning The Band - A practice recommendation of the CCQLM:
Conclusions and Recommendations: Given the widespread availability of automated differential cell counts and the poor analytic and clinical reliability of band neutrophil counts, band neutrophils should no longer be reported as part of the routine manual WBC differential cell count. The laboratory has a responsibility to convey accurate and clinically useful laboratory test results to the clinical community. Band neutrophil counts are not analytically robust or clinically relevant discriminators and should be abandoned.
Where clinical management protocols require assessment for immature neutrophils, qualitative reporting of a left shift based on the presence of circulating myeloid precursors may provide useful information without conveying potentially misleading numeric information.
Band neutrophils should be counted with segmented neutrophils and the two values together reported as a single absolute neutrophil count. Protocols for reporting a neutrophilic left shift as a qualitative result together with red cell morphologic features may be developed by laboratories when a particular clinical need for such information is identified,
Band comment 2. Novak R, responded to the following questions in CAP Today15: Q: How valid is the I/T [immature/total neutrophil] ratio?
A: Monroe, et al16 stated that the abnormal values in I/T ratios were found in 51 percent of neonates with confirmed bacterial disease [not: therefore 49% had normal I/T ratio}…but the I/T ratios also were abnormal in 77 percent…of neonates where there was maternal fever but no neonatal disease.17 Therefore, the I/T ratio does not seem particularly useful. Some authors…have found the I/T ratio to be helpful, but not much more useful than the abnormal total neutrophil count, which, when generated by a hematology analyzer, is much more rapid and accurate. Given the inherent weaknesses that are present in the 100 cell manual differential, I think the absolute neutrophil count, when automated, is a much more precise determination.
Band Comment 3. Dutcher TF stated in CAP Today17: An acute demand on bone marrow to release neutrophils in response to an infection or inflammation theoretically should cause a rapid depletion of the mature neutrophil reserves, and bands should be released in increasing proportions, producing more immature neutrophils and a ‘left shift’. In practice, the variability inherent in differentiating only 100 or 200 cells can obscure the shift or, contrarily, produce a ‘left shift’ where none exists.
According to the generally accepted calculations of Rumke, at least 100 cells must be classified to get a reasonably accurate differential. This conclusion is
HEMATOLOGY PERFORMANCE VERIFICATION MANUAL
PN 4277076AB 8-4 of 8
based on the inescapable statistical variability in the counting of cells in a blood smear and is independent of technical factors relative to the quality of the smear or the microscopist’s identification of cells.
Rumke’s calculations demonstrated that when a perfect technologist examines a perfect smear in a random search pattern of 100 cells and reports 10 percent bands, the patient-care physician can have 95 percent confidence that the true band count is a number somewhere between two percent and 21 percent…Assuming that a ‘normal’ band count is from zero to 10 percent, many false-positive counts occur with observed bands between approximately 11 percent and 20 percent, whereas many false negatives occur with observed counts from about five percent to 10 percent. The true band count cannot be assumed to be greater than 10 percent until the observed percentage is greater than approximately 25 percent.
It is important for laboratory employees to educate patient-care personnel about the inaccuracies of the differential so that important clinical decisions will not be made on the basis of trivial changes in the differential. Fortunately, patient care physicians must integrate a number of data items before making a clinical decision. They can use the band count if it fits or discard it if it doesn’t fit.
Band comment 4. Savage RA stated in CAP Today17: My initial plan called for this question [regarding the significance of the ‘band count’ as it relates to the blood differential count] to be answered in a ‘point-counter-point’ format. Dr Dutcher ably presented the ‘con-bands’ side of the argument. I also asked two authors of recent publications touting the value of band counts… to present their points of view…Neither of the ‘pro-band’ authors consented to participate in this debate. Thus…I elected to publish Dr. Dutcher’s study with a few comments of my own.
Many of the ‘pro-band’ studies in the literature are seriously flawed by inadequate data or analysis. For example, one study [Baron MA, Fink HD. Bacteremia in Private Pedriatic Practice. Pedriatics, 1980; 66:171-175]18 presented data indicating that the combination of four parameters [WBC, neutrophil, band, and poly (seg and band) numbers] predicted…sepsis…in babies three to 24 months old. I recalculated Bayesian statistics using the data in this paper and determined that…the band criterion alone is almost useless, and deletion of the band criterion seems to have little effect on the predicative value of the remaining parameters in detecting bacteremic pedriatic patients.
Emergency physician G.P. Young, MD [CBC or not CBC? That is the question. Ann Emerg Med, 1986; 15:367-371]19 summarized the literature well: “To ‘rule in’ bacterial infection, most physicians believe that leukocytosis (total WBC>10x103/ cu mm) accompanied by an increase in immature band forms is both specific and sensitive. A review of the WBC literature does not support this conclusion.

HEMATOLOGY PERFORMANCE VERIFICATION MANUAL
PN 4277076AB 8-5 of 8
Band Comment 5. Cornbleet PJ and Novak RW stated in CAP today20: Statistical considerations clearly suggest that a 100-cell manual differential yields a value for bands that is not precise. Relatively few cases of infections or inflammatory disorders are seen in which elevation of bands is not accompanied by either neutrophilia or leukocytosis, parameters that are more precisely measured by automated hematology instruments.
Classifications of bands shows poor reproducibility, because it requires establishing discrete borders in what is essentially a continuous process. Criteria for separating band form segmented neutrophils varies among laboratorians… Obviously, the normal range is markedly influenced by the definition.
Band Comment 6. Wenz B, Gennis P, Canova C, and Burns ER stated21:
Leukocyte differentials from 468 emergency room patients were assessed for clinical value. …in the absence of leukocytes , an elevated band count was instrumental in suggesting admission for only one patient…It is concluded that most leukocyte differentials performed for emergency room patients provide information that is no more clinically significant than that obtained from the medical history, physical examination, and absolute leukocyte count.
Band Comment 7. Ardron MG, Westengard JC and Dutcher TF stated22:
Hospital patients with a documented infection and total leukocyte counts in the reference range were selected for study…Five hundred cell differentials were performed to reduce sampling error. Only one investigator performed all differentials to reduce observer variability.
Applying a threshold value of 15% for bands…, the sensitivity [% true positives] was 51.1%, specificity [ % true negative ] was 70.0 % and the efficiency [% patients with infection correctly identified by the band count] was 60.3%…These are unsatisfactory low statistical values, despite the great care taken to consistently and correctly identified bands. We believe that it is necessary to turn from manual band counts to other more reliable measure for predicting an infections process…Other parameters such as the total leukocyte count, absolute neutrophil count, and temperature have been proven repeatedly to be much better predictors of infection.

HEMATOLOGY PERFORMANCE VERIFICATION MANUAL
PN 4277076AB 8-6 of 8
III Manual Diff (Monocytes)
Evaluators speak of the improved accuracy and precision of the monocyte count using an automated differential system.
Monocyte Comment 1. Gossens W, Van Hove L and Verwilghen RN Stated23: The visual monocyte count has low precision, mainly due to the small number of cells (usually not more than 100-200 leukocytes) identified routinely in this procedure. When 800 leukocytes are counted [according to the CLSI standard H203] on a blood sample containing 5-10 % monocytes, a satisfactory precision is reached. Higher Precision should be reached with methods counting a much larger number of events. [ i.e., automated systems]
It is clear that problems exist in the evaluation of different instruments for counting monocytes. An accurate and reliable reference method is a prerequisite to evaluate this aspect of cell counts. As the visual method is too cumbersome, a different reference method would be useful. Based on the results to this study, it is suggested that the technique using fluorescence-labeled monoclonal antibodies should be regarded as an acceptable alternative. [This recommendation has been submitted to the International Council for Standardization in Haematology (ICSH) for consideration]
Monocyte comment 2. VCS Technology: Monocyte Counting on the Coulter STKS and MAXM.25 As part of the ongoing evolution of VCS Technology, recent improvements for the WBC differential of STKS and MAXM instruments have further increased the accuracy of population discrimination. The greatest impact will be seen in the monocyte parameter, primarily because the 2-3% [average] change is more evident in a cell type which typically exhibits a low frequency.
To assess the impact of the changes on the monocyte percentage count, two separate studies [using flow analysis of MO2/KC56 (CD45/CD14) monoclonal antibodies] were performed. The improvements for the differential provide excellent agreement on monocyte counts. Monocyte counts were also compared to the manual method [800-cell differential, according to CLSI standard H20-A]…at each of two sites. Both sites demonstrate closer agreement with manual monocyte counts[compared to earlier instrument software]
The normal ranges [for monocytes] that appear in the texts…vary considerably. It is likely that some physicians may question the monocyte values from the automated analyzer. This makes it all the more important to reestablish or verify the reference ranges for normality in current use, and to communicate the meaning of the ‘range’ to those physicians.

HEMATOLOGY PERFORMANCE VERIFICATION MANUAL
PN 4277076AB 8-7 of 8
Monocyte Comment 3. Seaberg R and Cuomo J stated6:
Correlation values of the two methods [Coulter STKS and Beckman FACScan flow cytometer] Vs the 800-cell manual count indicated monocyte counts by the STKS and FACScan to be consistently greater than the manual differential results by 2 to 4 percentage points. Possible explanations for this are in the well-known drawbacks of the manual methods: staining quality varies, distributional errors are present on the slide, and observer bias occurs since the morphological classification of some cells is equivocal. Furthermore, the number of cells in a relatively rare population poses statistical problems. These difficulties are reduced in the FACScan and STKS systems. The STKS [VCS] method is fast, efficient, and cost-effective.

HEMATOLOGY PERFORMANCE VERIFICATION MANUAL
PN 4277076AB 8-8 of 8
PN 4277076AB 9-1 of 2
GLOSSARY 9
GLOSSARY Accuracy of a test is the closeness of the test result to the true value.
Binomial Envelope binomial distributions refer to alternative possibilities and their probabilities. The standard error of the binomial distribution is useful in studies where two methods of greatly differing variance are compared, such as manual vs. automated differential.
Binomial Distribution is used to generate binomial envelopes applied to the XY scatterplot of data. Usually, results exceeding the envelope are considered inaccurate within a given level of confidence. In our case, we use Dr. Rumke’s 95% confidence limits.
95% Confidence Intervals describes the range within which the statistic is expected to fall in 95% of the cases were the experiment to be repeated on an identical one expects that 1.0 and zero will fall between the lower and upper limits for the slope and intercept respectively.
Carryover The amount in percent of sample remaining in the system and picked up by the next sample cycled. Low-to-high carryover is the amount of sample with low cell concentrations carried over to sample with high cell concentration, such as diluent to blood. High-to-low carryover is the amount of sample with high cell concentrations carried over to sample with low cell concentrations such as blood to diluent.
Coefficient of Variation (CV%) is the standard deviation expressed in terms of the percentage of the mean.
Correlation Coefficient ( r ) is a way to measure the linear relationship between two groups. A value of 1.000 is a one to one relationship.
Correlation Coefficient Squared ( r2 ) is a coefficient of determination: how much variability is associated with changes in “X”.
Deming regression: A linear regression approach invented by the famous QA guru, W. Edwards Deming. Since this calculation assumes that error exists in the data plotted on the X axis, it is a better statistical description of clinical laboratory data than Regualr Regression.
Efficiency is the percentage of specimens correctly categorized by the automated differential.. (#TP + #TN/Total) x 100
False Negative is the percentage of specimens considered normal by the test method (new instrument) and abnormal by the reference method (manual diff).
False Positive is the percentage of specimens considered abnormal by the test method (new instrument) and normal by the reference method (manual diff).
Linear regression is a statistical technique to find the line that best predicts Y from X.

HEMATOLOGY PERFORMANCE VERIFICATION MANUAL
PN 4277076AB 9-2 of 2
Mean is the center of distribution. It is used to describe or summarize a collection of data be defining an average.
Mean Difference is the unknown minus the known.
Measuring range (linearity) is a set of values of measurands for which the error of a measuring instrument is intended to lie within specificed limits.
Outlier is a result outside of the established range.
Pass Rate is the percentage of specimens that do not cause a review
Precision is the closeness of results of repeated analysis performed on the same material. Precision is often expressed quantitatively as standard deviations, or coefficients of variation. (also known as repeatability or reproducibility)
Predictive Value of a Negative Test is the percentage of specimens that were normal on both the instrument and the manual differential.
Predictive Value of a Positive Test is the percentage of specimens that were abnormal on both the instrument and the manual differential.
Review Rate is the percentage of specimens that cause a review.
Patient Population is the group of individual values about which a generalization is derived.
Reference interval is the interval between, and including the lower reference limit to the upper reference limit of the reference population (e.g., 95% of persons presumed to be healthy or normal.
Repeatability is the closeness of results of repeated analysis performed on the same material. Precision is often expressed quantitatively as standard deviations, or coefficients of variation. (also known as precision or reproducibility)
Reproducibility is the closeness of results of repeated analysis performed on the same material. Precision is often expressed quantitatively as standard deviations, or coefficients of variation. (also known as repeatability or precision)
Sensitivity is the percentage of manual differential abnormals that were also abnormal on the instrument.
Specificity is the percentage of manual differential normals that were also normal on the instrument.
Standard Deviation (SD) is a measure of the dispersion or variation in the results about the mean.
True Negative is the percentage of specimens considered normal (negative) by both the test method (new instrument) and the reference method (manual diff).
True Positive is the percentage of specimens considered abnormal (positive) by both the test method (new instrument) and the reference method (manual diff).
Truth Table is a technique for evaluation of method sensitivity, specificity, and efficiency.
PN 4277076AB 10-1 of 4
REFERENCES 10
1. CLSI document EP9 User Comparison of Quantitative Clinical Laboratory Methods Using Patient Samples
2. Westgard J and Hunt M. Use and Interpretation of Common Statistical Tests in Method-comparison Studies. Clinical Chemistry, 1973; 19(1): 49-57.
3. CLSI document H20 Reference Leukocyte (WBC) Differential Count (Proportional) and Evaluation of Instrument Methods.
4. Rumke, CL. The Statistically Expected Variability In Differential Leukocyte Counting. College of American Pathologists CAP Conference, Aspen, CO, 1977; 39-45.
5. Galen RS and Gambino SR. Beyond Normality: The Predictive Value And Efficiency Of Medical Diagnosis. John Wiley and Sons, New York, NY, 1975.
6. Seaberg C and Cuomo. Assessment Of Monocyte Counts Derived From Automated Instrumentation. Lab Med, 1993; 24 (4): 222-224.
7. Dutcher TF: Leukocyte Differentials: Are they worth it? Paper presented at Symposium on Controversies in the Laboratory, Royal Oak, MI, 1984; March (4): 71-87.
8. Bull and Korpman: Characterization of the WBC Differential Count. Blood, 1980; 6:411-419.
9. Koepke JA et al. A critical evaluation of the manual/visual differential leukocyte counting method. Blood Cells, 1985; 11: 173-186.
10. Bessman JD et al. The ‘Diff-If’. American Journal of Clinical Pathology, 1988; 90 (2): 763-768.
11. Duncan KL and Gottfried EL. Utility Of The Three-Part Differential Count. American Journal of Clinical Pathology, 1987; 88:308-313.
12. Mathy KA and Keoke JA. The Clinical Usefulness Of Segment Vs. Stab Neutrophil Criteria For Differential Leukocyte Counts. American Journal of Clinical Pathology, 1974, 958.
13. Rainey P. Utility Of The Leukocyte Differential In The Diagnosis Of Bacterial Infection. Pathologists, 1985; 15:11-24.
14. Rich EC, Crowson TW and Connelly DP. Effectiveness Of The Differential Leukocyte Count In Case Finding In The Ambulatory Care Setting. Journal of the American Medical Association, 1983; 240:633-636.
15. Novak R. Classifying Bands And Segmented Neutrophils. CAP Today, 1995; 1:66.
16. Monroe BL et al. Neonatal Blood In Health And Disease. Journal of Pediatrics, 1979; 95:89-98.

HEMATOLOGY PERFORMANCE VERIFICATION MANUAL
PN 4277076AB 10-2 of 4
17. Dutcher TF (author) and Savage RA (ed) Questions and Answers. CAP Today, 1992; 4:65-66.
18. Baron MA, Fink HD. Bacteremia in Private Pedriatic Practice. Pedriatics, 1980; 66:171-175.
19. Young GP. CBC or not CBC? That is the Question. Annals of Emergency Medicine, 1986; 15:367-371.
20. Cornbleet PJ and Novak RW. Classifying Segmented and Band Neutrophils. CAP Today. 1994; 5: 37-41.
21. Wenz B, Gennis P, Canova C, and Burns ER. The Clinical Utility Of The Leukocyte Differential In Emergency Medicine. American Journal of Clinical Pathology, 1983: 298-303.
22. Ardron MJ, Westgard JC and Dutcher TF. Band Neutrophil Counts Are Necessary For The Diagnosis Of Infection In Patients With Normal Total Leukocyte Counts. American Journal of Clinical Pathology, 1994; 11:646-649.
23. Gossens W, VanHove L and Verwilghen RL. Monocyte Counting: Discrepancies In Results Obtained With Different Automated Instruments. Journal of Clinical Pathology, 1991; 44:224-227.
24. Westgard, JO. "But is it really out?" Doing the wrong QC wrong. Essay 115. September 2007.
25. VCS Technology: Monocyte Counting on Coulter STKS and MAXM. Coulter Corporation. October, 1991.
26. Burns, ER. Et al. Evaluation of a Reticulocyte Analysis Method Using a Conventional Automated Blood Cell Differential Instrument. Blood 1982: 10:93a Abstract #358.
27. Clarke, G, MD. Toward Abandoning the Band - A practice recommendation of the CCQLM. May 2006.
28. CLSI Approved Guideline H44, Reticulocyte Analysis Using Supravital Stains and Flow Cytometry.
29. COULTER CORPORATION. STKS Analyzer with Reticulocyte Analysis Reference Manual. March 1995.
30. Bourke GJ and NcGilvray J. Interpretation and Uses of Medical Statistics. Blackwell Scientific Publications, Osney Mead, Oxford, UK, 1975.
31. CLSI document C28 Defining, Establishing and Verifying Reference Intervals in the Clinical Laboratory.
32. CLSI document C24 Statistical Quality Control for Quantitative Measurement Procedures: Principles and definitions; approved guideline.
HEMATOLOGY PERFORMANCE VERIFICATION MANUAL
PN 4277076AB 10-3 of 4
CLINICAL LABORATORY STANDARDS INSTITUTE (CLSI)
GUIDELINES Standards and Guidelines: H01 - A5 Tubes and Additives for Venous Blood Specimen Collection - Fifth Edition; Approved Standard (2003) H03 - A6 Procedure for the Collection of Diagnostic Blood Specimens by Venipuncture; Sixth Edition, Approved Standard (2007) H04 - A6 Procedure and Devices for the Collection of Diagnostic Capillary Blood Specimens; Sixth Edition, Approved Standard (2008) H18 - A2 Procedures for the Handling and Processing of Blood Specimens; Third Edition, Approved Standard (2004) H20 - A Reference Leukocyte Differential Count (proportional) and Evaluation of Instrumental Methods; Approved Standard (1992) H56 - A Body Fluid Analysis for Cellular Composition, Approved Standard (2006) H26 - A Performance Goals for the Internal Quality Control of Multichannel Hematology Analyzer; Approved Standard (1996) H38 - P Calibration and Quality Control of Automated Hematology Analyzers; Proposed Standard (1999) H44 - A2 Methods for Reticulocyte Counting (Automated Blood Cell Counters, Flow Cytometry and Supravital Dyes); Approved Guideline (2004) EP 9 A2 Method Comparison and Bias Estimation Using Patient Samples EP 10 A3 Preliminary Evaluation of Quantitative Clinical Laboratory Measurement Procedures EP 15 A2 User Verification of Performance for Precision and Trueness H20 A2 Reference Leukocyte (WBC) Differential Count (Proportional) and Evaluation of Instrumental Methods Order by Phone Toll-free (877) 447-1888 Order by Fax (610) 688-0700 Website www.clsi.org E-mail [email protected]

HEMATOLOGY PERFORMANCE VERIFICATION MANUAL
PN 4277076AB 10-4 of 4
WEBSITES FOR LABORTORY REFERENCE Beckman Coulter Inc. www.beckmancoulter.com Clinical Laboratory Standards Institute (CLSI) www.clsi.org Collage of American Pathologist (CAP) www.cap.org Joint Commission (JCAHO) www.jointcommission.org Centers for Medicare and Medicaid Services (CMS) www.cms.hhs.gov Clinical Laboratory Improvements Amendments www.cms.hhs.gov/clia Proficiency Testing Providers www.cms.hhs.gov/CLIA/14_Proficiency_Testing_Providers.asp Media Lab, Inc. (Online Compliance and Continuing Education for Clinical Laboratories www.medialabinc.net Westgard QC (Tools, Technologies and Training for Healthcare Laboratories) www.westgard.com Lab Tests Online www.labtestsonline.org

PN 4277076AB 11-1 of 38
GRAPHS 11
This section contains master copies of graphs referred to in this manual. Use these masters to make as many copies as you require for your needs.

HEMATOLOGY PERFORMANCE VERIFICATION MANUAL
PN 4277076AB 11-2 of 38
HEMATOLOGY PERFORMANCE VERIFICATION MANUAL
PN 4277076AB 11-3 of 38
WBC Linear Regression
0
10
20
30
40
50
60
70
80
90
100
0 10 20 30 40 50 60 70 80 90 100Reference
Test
HEMATOLOGY PERFORMANCE VERIFICATION MANUAL
PN 4277076AB 11-4 of 38

HEMATOLOGY PERFORMANCE VERIFICATION MANUAL
PN 4277076AB 11-5 of 38
RBC Linear Regression
0
1
2
3
4
5
6
7
8
0 1 2 3 4 5 6 7 8Reference
Test

HEMATOLOGY PERFORMANCE VERIFICATION MANUAL
PN 4277076AB 11-6 of 38
HEMATOLOGY PERFORMANCE VERIFICATION MANUAL
PN 4277076AB 11-7 of 38
Hgb Linear Regression
4
6
8
10
12
14
16
18
20
22
24
4 6 8 10 12 14 16 18 20 22 24Reference
Test

HEMATOLOGY PERFORMANCE VERIFICATION MANUAL
PN 4277076AB 11-8 of 38
HEMATOLOGY PERFORMANCE VERIFICATION MANUAL
PN 4277076AB 11-9 of 38
MCV Linear Regression
50556065707580859095
100105110115120
50 55 60 65 70 75 80 85 90 95 100 105 110 115 120Reference
Test

HEMATOLOGY PERFORMANCE VERIFICATION MANUAL
PN 4277076AB 11-10 of 38

HEMATOLOGY PERFORMANCE VERIFICATION MANUAL
PN 4277076AB 11-11 of 38
Plt Linear Regression
050
100150200250300350400450500550600650700750800
0 50 100 150 200 250 300 350 400 450 500 550 600 650 700 750 800Reference
Test
HEMATOLOGY PERFORMANCE VERIFICATION MANUAL
PN 4277076AB 11-12 of 38
HEMATOLOGY PERFORMANCE VERIFICATION MANUAL
PN 4277076AB 11-13 of 38
MPV Linear Regression
56789
1011121314151617181920
5 6 7 8 9 10 11 12 13 14 15 16 17 18 19 20Reference
Test

HEMATOLOGY PERFORMANCE VERIFICATION MANUAL
PN 4277076AB 11-14 of 38
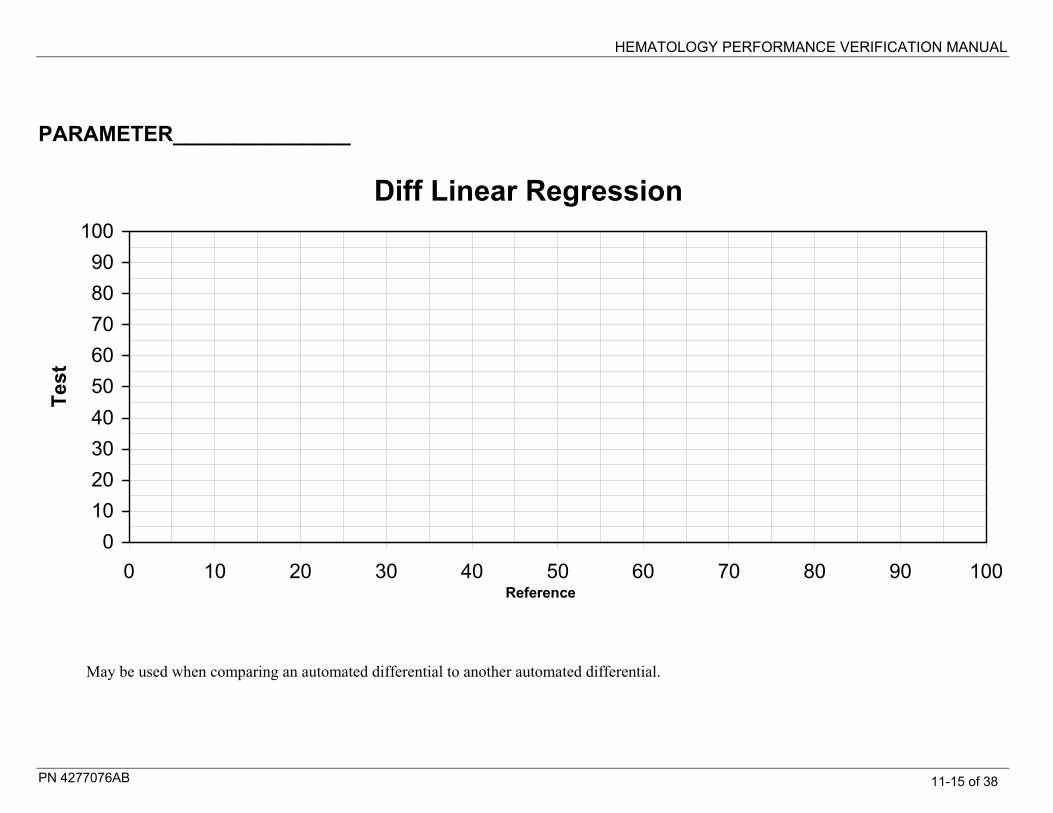
HEMATOLOGY PERFORMANCE VERIFICATION MANUAL
PN 4277076AB 11-15 of 38
PARAMETER_______________
May be used when comparing an automated differential to another automated differential.
Diff Linear Regression
0102030405060708090
100
0 10 20 30 40 50 60 70 80 90 100Reference
Test

HEMATOLOGY PERFORMANCE VERIFICATION MANUAL
PN 4277076AB 11-16 of 38
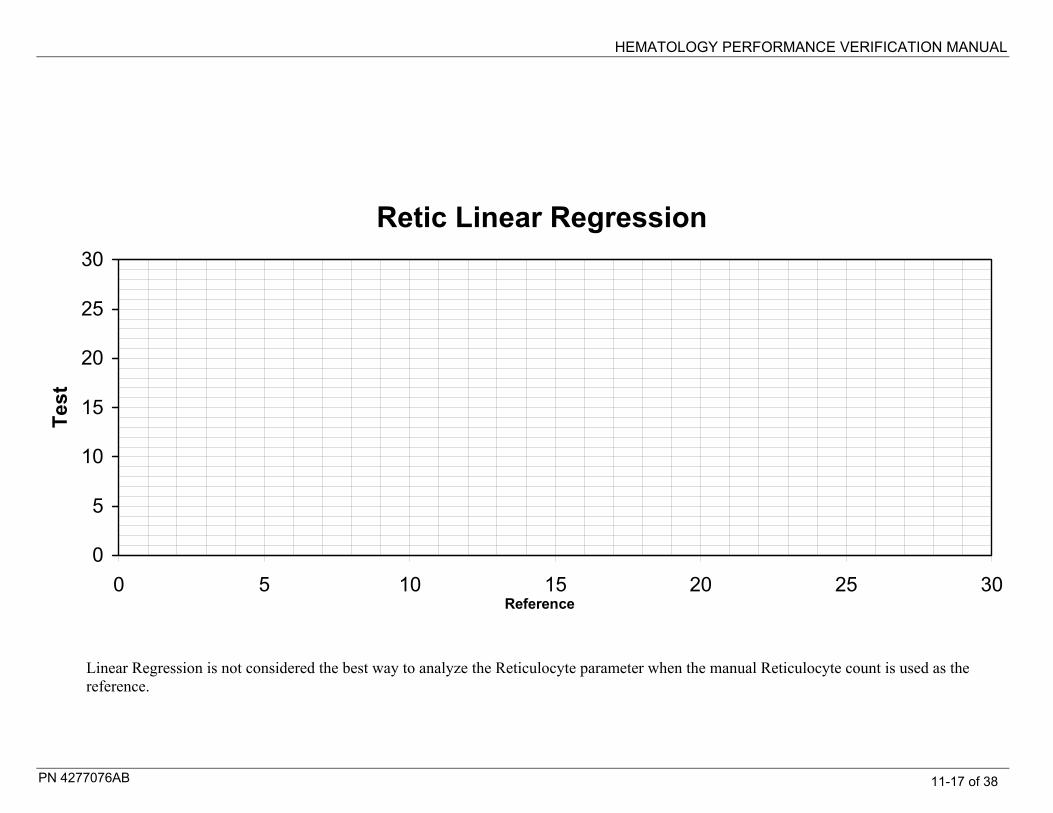
HEMATOLOGY PERFORMANCE VERIFICATION MANUAL
PN 4277076AB 11-17 of 38
Linear Regression is not considered the best way to analyze the Reticulocyte parameter when the manual Reticulocyte count is used as the reference.
Retic Linear Regression
0
5
10
15
20
25
30
0 5 10 15 20 25 30Reference
Test

HEMATOLOGY PERFORMANCE VERIFICATION MANUAL
PN 4277076AB 11-18 of 38

HEMATOLOGY PERFORMANCE VERIFICATION MANUAL
PN 4277076AB 11-19 of 38
PARAMETER______________
Used for Neutrophils or Lymphocytes compared to a manual differential.
Binomial Envelope - 100 Cells
0
10
20
30
40
50
60
70
80
90
100
0 10 20 30 40 50 60 70 80 90 100Test
Ref
eren
ce

HEMATOLOGY PERFORMANCE VERIFICATION MANUAL
PN 4277076AB 11-20 of 38
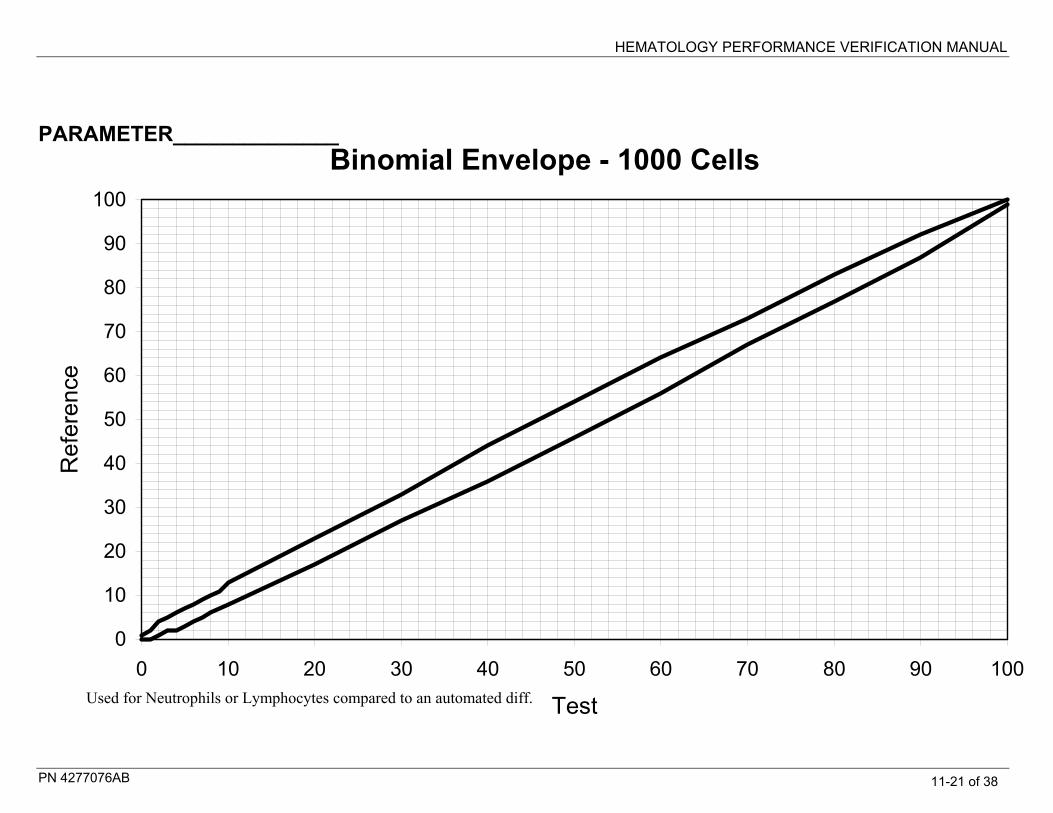
HEMATOLOGY PERFORMANCE VERIFICATION MANUAL
PN 4277076AB 11-21 of 38
PARAMETER______________
Used for Neutrophils or Lymphocytes compared to an automated diff.
Binomial Envelope - 1000 Cells
0
10
20
30
40
50
60
70
80
90
100
0 10 20 30 40 50 60 70 80 90 100
Test
Ref
eren
ce

HEMATOLOGY PERFORMANCE VERIFICATION MANUAL
PN 4277076AB 11-22 of 38

HEMATOLOGY PERFORMANCE VERIFICATION MANUAL
PN 4277076AB 11-23 of 38
PARAMETER______________
Used for Monos, Eos, Basos, NRBCs compared to a manual diff.
Binomial Envelope - 100 Cells
0
5
10
15
20
25
30
0 5 10 15 20 25 30Reference
Test

HEMATOLOGY PERFORMANCE VERIFICATION MANUAL
PN 4277076AB 11-24 of 38
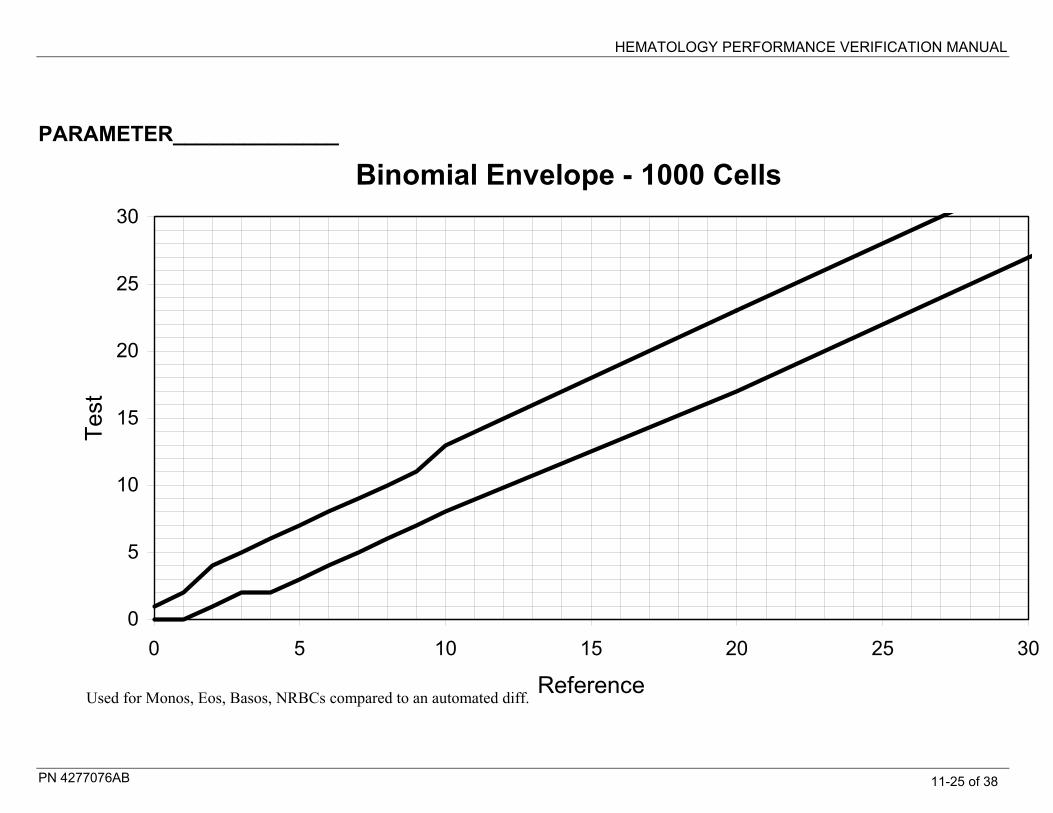
HEMATOLOGY PERFORMANCE VERIFICATION MANUAL
PN 4277076AB 11-25 of 38
PARAMETER______________
Used for Monos, Eos, Basos, NRBCs compared to an automated diff.
Binomial Envelope - 1000 Cells
0
5
10
15
20
25
30
0 5 10 15 20 25 30
Reference
Test

HEMATOLOGY PERFORMANCE VERIFICATION MANUAL
PN 4277076AB 11-26 of 38
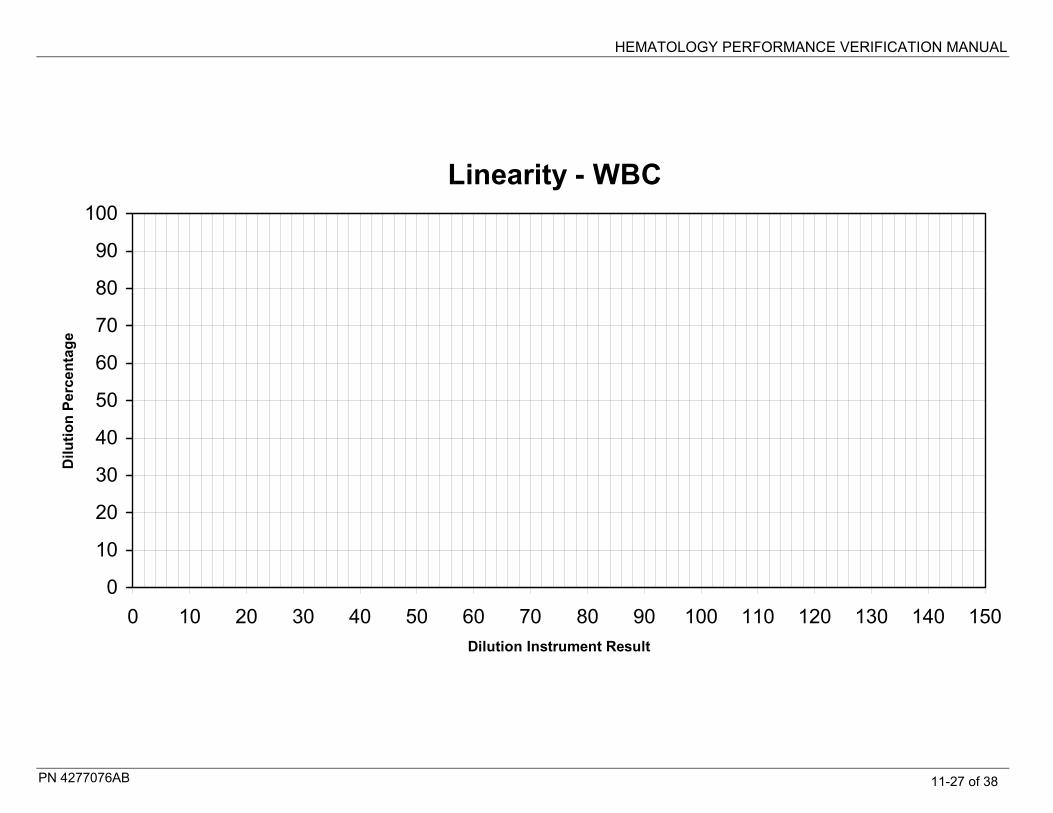
HEMATOLOGY PERFORMANCE VERIFICATION MANUAL
PN 4277076AB 11-27 of 38
Linearity - WBC
0
10
20
30
40
50
60
70
80
90
100
0 10 20 30 40 50 60 70 80 90 100 110 120 130 140 150Dilution Instrument Result
Dilu
tion
Perc
enta
ge

HEMATOLOGY PERFORMANCE VERIFICATION MANUAL
PN 4277076AB 11-28 of 38
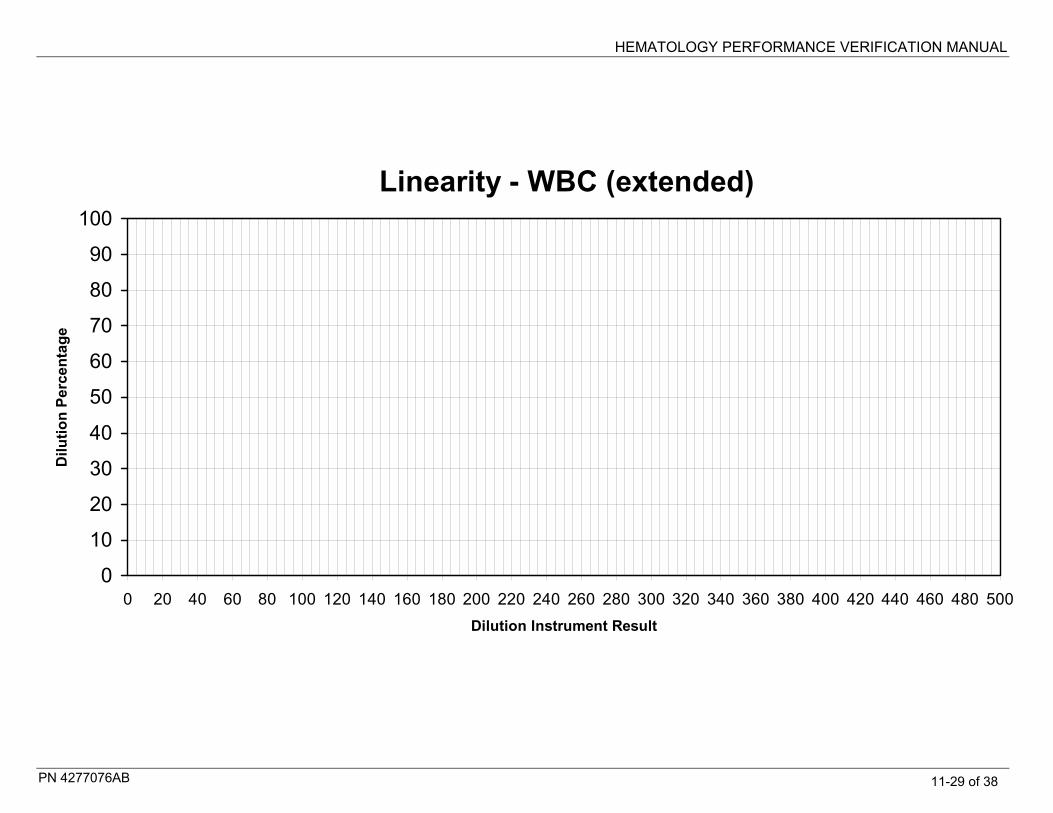
HEMATOLOGY PERFORMANCE VERIFICATION MANUAL
PN 4277076AB 11-29 of 38
Linearity - WBC (extended)
0
10
20
30
40
50
60
70
80
90
100
0 20 40 60 80 100 120 140 160 180 200 220 240 260 280 300 320 340 360 380 400 420 440 460 480 500Dilution Instrument Result
Dilu
tion
Perc
enta
ge

HEMATOLOGY PERFORMANCE VERIFICATION MANUAL
PN 4277076AB 11-30 of 38

HEMATOLOGY PERFORMANCE VERIFICATION MANUAL
PN 4277076AB 11-31 of 38
Linearity - RBC
0
10
20
30
40
50
60
70
80
90
100
0 1 2 3 4 5 6 7 8 9 10Dilution Instrument Result
Dilu
tion
Perc
enta
ge

HEMATOLOGY PERFORMANCE VERIFICATION MANUAL
PN 4277076AB 11-32 of 38

HEMATOLOGY PERFORMANCE VERIFICATION MANUAL
PN 4277076AB 11-33 of 38
Linearity - Hgb
0
10
20
30
40
50
60
70
80
90
100
0 2 4 6 8 10 12 14 16 18 20 22 24Dilution Instrument Result
Dilu
tion
Perc
enta
ge

HEMATOLOGY PERFORMANCE VERIFICATION MANUAL
PN 4277076AB 11-34 of 38

HEMATOLOGY PERFORMANCE VERIFICATION MANUAL
PN 4277076AB 11-35 of 38
Linearity - Plt
0102030405060708090
100
0 100 200 300 400 500 600 700 800 900 1000 1100 1200 1300 1400 1500Dilution Instrument Result
Dilu
tion
Perc
enta
ge
HEMATOLOGY PERFORMANCE VERIFICATION MANUAL
PN 4277076AB 11-36 of 38
HEMATOLOGY PERFORMANCE VERIFICATION MANUAL
PN 4277076AB 11-37 of 38
Linearity - Plt (extended)
0102030405060708090
100
0 100
200
300
400
500
600
700
800
900
1000
1100
1200
1300
1400
1500
1600
1700
1800
1900
2000
2100
2200
2300
2400
2500
2600
2700
2800
2900
3000
Dilution Instrument Result
Dilu
tion
Perc
enta
ge

HEMATOLOGY PERFORMANCE VERIFICATION MANUAL
PN 4277076AB 11-38 of 38