heat exchanger network retrofit using individual stream ... · temperature vs enthalpy plot ......
TRANSCRIPT
CHEMICAL ENGINEERING TRANSACTIONS
VOL. 61, 2017
A publication of
The Italian Association of Chemical Engineering Online at www.aidic.it/cet
Guest Editors: Petar S Varbanov, Rongxin Su, Hon Loong Lam, Xia Liu, Jiří J Klemeš Copyright © 2017, AIDIC Servizi S.r.l.
ISBN 978-88-95608-51-8; ISSN 2283-9216
Heat Exchanger Network Retrofit Using Individual Stream
Temperature vs Enthalpy Plot
Yee Qing Laia,b, Zainuddin A. Manana,b,*, Sharifah R. Wan Alwia,b
aProcess Systems Engineering Centre (PROSPECT), Universiti Teknologi Malaysia, 81310 Johor Bahru, Johor, Malaysia bFaculty of Chemical and Energy Engineering, Universiti Teknologi Malaysia, 81310 Johor Bahru, Johor, Malaysia
dr.zain@ utm.my
This paper presents a new graphical approach for Heat Exchanger Network (HEN) retrofit that is based on the
individual stream temperature versus enthalpy plot (STEP). STEP maintains the individual stream
characteristics and enables users to graphically map hot and cold streams and retrofit HEN without the need to
perform enthalpy calculations, or to check for minimum temperature approach violations. Application of the
STEP method to a well-established HEN retrofit case study from the literature shows that it only requires one
visualisation tool to simultaneously diagnose and retrofit an existing HEN. On top of that, the STEP method
yields up to 5 % higher heat recovery as compared to the results obtained using conventional retrofit methods.
1. Introduction
Numerous HEN retrofit methods that have been proposed after Pinch Technology was introduced for grassroots
design in the early 1970s. Later, mathematical programming and hybrid methods have also been introduced.
Graphical and mathematical HEN retrofit approaches are the two main types of HEN retrofit methods, both
having pros and cons of their own. The focus of this paper is on HEN retrofit methods that are based on
visualisation tools that can provide insights and interactively guide users during the course of retrofitting HEN.
An insight-based Pinch Analysis methodology that involves setting conservative retrofit investment targets was
first introduced by (Tjoe and Linnhoff, 1986). Lakshmanan and Bañares-Alcántara (1996) proposed the Retrofit
Thermodynamic Diagram (RTD) to provide a concise graphical description of both the loads and the driving
forces in an existing HEN. Nordman and Berntsson (2001) proposed eight different curves that help users to
identify and evaluate the complexity of changes in heating and cooling, and determine the investment cost.
Osman et al. (2009) proposed a HEN retrofit technique based on the path analysis approach with the aim to
provide alternatives for solving the HEN retrofit problems. The solutions enable users to add heat transfer area
without any HEN structural changes of the existing network.
Wan Alwi and Abd Manan (2010) introduced the stream temperature versus enthalpy plot (STEP) which
represents the profile of individual (as opposed to composite) hot and cold streams being mapped together on
a temperature versus enthalpy diagram. STEP shows the Pinch Points, energy targets and maximum heat
allocation simultaneously can be used to produce optimal HEN design. Li and Chang (2010) proposed a simple
Pinch-based approach that eliminates every Cross-Pinch match and divides both the heat loads on the hot and
cold streams into two based on the Pinch Temperatures. Piacentino (2011) proposed a retrofit procedure based
on an integrated use of several existing and innovative techniques, which include using the “Minimum Energy
Requirement” configuration and a modified exergy analysis for diagnosis, and an innovative spider-type diagram
that contains information such as the exergy destruction, the number of shells and heat transfer area to assist
in choosing the preferred relaxation paths. Abbood et al. (2012) introduced the Grid Diagram Table (GDT) which
is based on the fundamental of the Composite Curves geometry and is represented by using the stream interval
temperature can identify Pinch points, energy targets and provide the visualisation of Pinch rules violation. The
Shifted Retrofit Thermodynamic Grid Diagram (SRTGD) is an extended version of the Shifted Retrofit
Thermodynamic Diagram (SRTD) (Yong et al., 2014) that can give the users clear insights on the existing HEN
arrangements and key parameter such as heat capacity flow rates, temperatures and temperature differences
and simultaneously provide information about the thermodynamics, stream capacities and the topology of the
DOI: 10.3303/CET1761273
Please cite this article as: Lai Y.Q., Manan Z.A., Wan Alwi S.R., 2017, Heat exchanger network retrofit using individual stream temperature vs enthalpy plot, Chemical Engineering Transactions, 61, 1651-1656 DOI:10.3303/CET1761273
1651
existing HEN (Yong et al., 2015a). It can be used as a decision-making tool in solving HEN retrofit problems
and provide support for screening feasible and infeasible retrofit options. Besides, the HEN Steam Matrix
(HENSM) which is a numerical representation of the conventional Grid Diagram is introduced by Yong et al.
(2015b). In HENSM, the HEN is represented in the form of a matrix. The heat exchangers which are arranged
in orderly fashion make it easier for the engineer designers during both synthesis and retrofit process. Gadalla
(2015) represented the existing HEN in a temperature of process hot streams versus temperature of process
cold streams graph. The graph can identify exchangers across the Pinch, Network Pinch, Pinching matches,
improper placement of fuel consumption and generate promising modifications of the HEN. Kang et al. (2016)
proposed the T-Q diagram method to overcome the difficulties in stream splitting and stream matching for the
synthesis of HEN.
State-of-the-art study of the literature on HEN retrofit shows that there are a few key limitations associated with
the existing graphical HEN retrofit methods. Some of the methods require lengthy steps and calculations to
solve retrofit problems because of the need to use multiple visualisation tools or diagrams. Most of the
visualisation tools can only be used for targeting or diagnosis process only. The Composite Curves which are
normally used in the graphical methods represents the temperature intervals of composite instead of individual
streams. Direct matching of the individual streams using the Composite Curves is not possible, and, as a result,
Grid Diagram was introduced. As the Grid Diagram is not plotted to the temperature scale, users need to spend
time to iteratively calculate the enthalpy and check for temperature feasibility. A HEN retrofit graphical method
that can solve the retrofit problem based on individual stream concept is therefore needed to overcome the
mentioned limitations. This study aims to improve the existing HEN retrofit technique by implementing the
individual stream concept to simplify the retrofit process by using only one visualisation tool.
2. Heat Exchanger Network Retrofit Method Using Individual Stream Temperature vs
Enthalpy Plot
The stream temperature versus enthalpy curve (STEP) which has been used for simultaneous HEN targeting
and design HEN (Wan Alwi and Abd Manan, 2010), is now extended to HEN retrofit. STEP diagram which
maintains the individual characteristics of the streams enables the user to do stream matching directly on the
diagram, overcoming the limitation of the conventional Composite Curves. This visualisation tool enables the
users to use the simple graph geometry for retrofit process, which includes identifying cross-Pinch heat
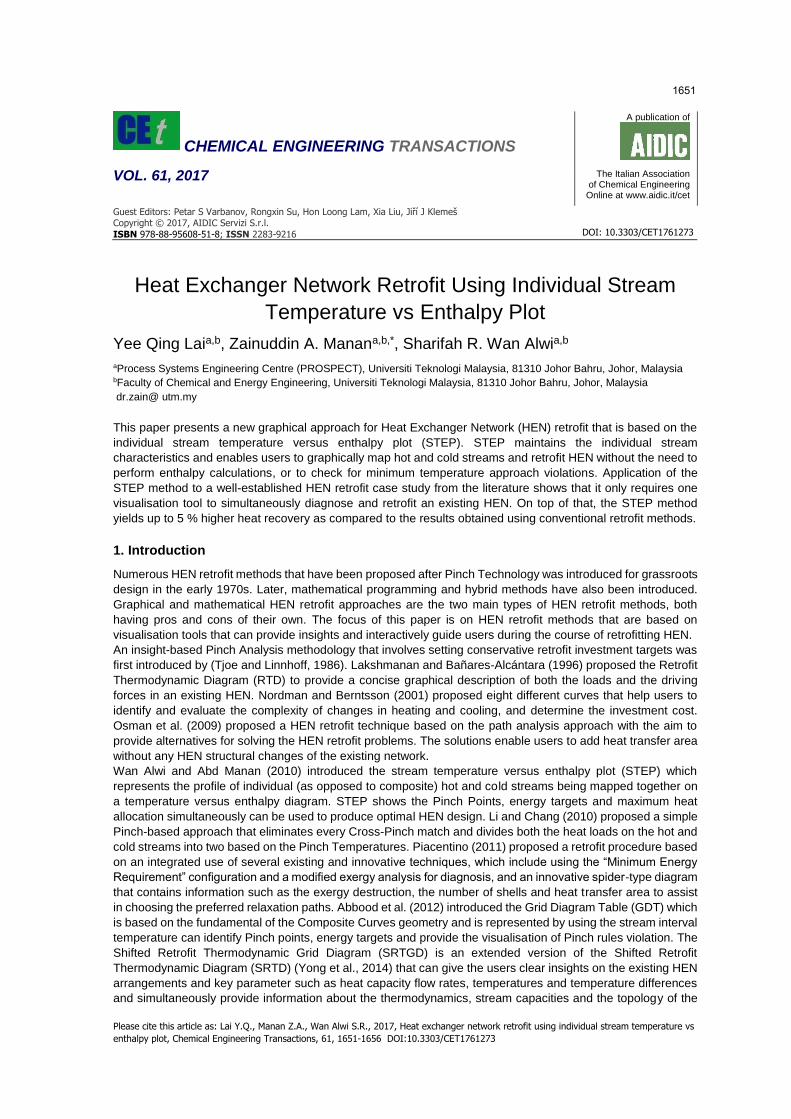
exchangers and observing temperature feasibility and constraints during stream matching. Figure 1 shows an
example of a STEP diagram.
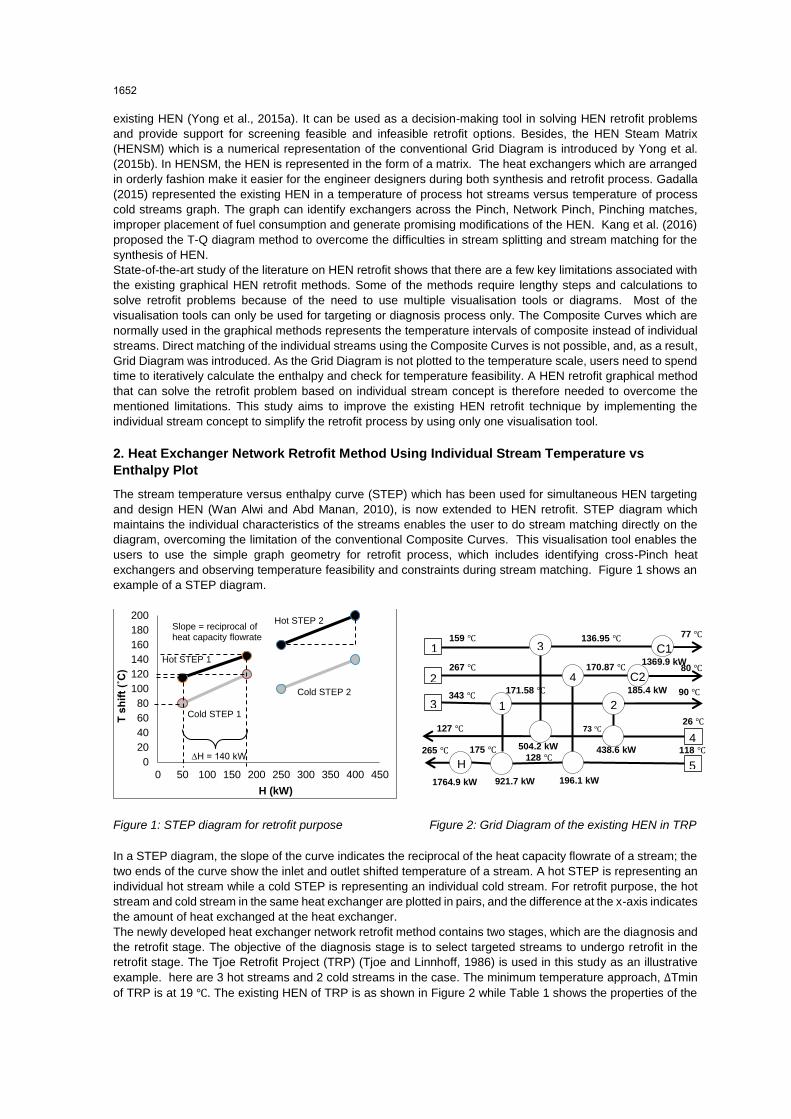
Figure 1: STEP diagram for retrofit purpose Figure 2: Grid Diagram of the existing HEN in TRP
In a STEP diagram, the slope of the curve indicates the reciprocal of the heat capacity flowrate of a stream; the
two ends of the curve show the inlet and outlet shifted temperature of a stream. A hot STEP is representing an
individual hot stream while a cold STEP is representing an individual cold stream. For retrofit purpose, the hot
stream and cold stream in the same heat exchanger are plotted in pairs, and the difference at the x-axis indicates
the amount of heat exchanged at the heat exchanger.
The newly developed heat exchanger network retrofit method contains two stages, which are the diagnosis and
the retrofit stage. The objective of the diagnosis stage is to select targeted streams to undergo retrofit in the
retrofit stage. The Tjoe Retrofit Project (TRP) (Tjoe and Linnhoff, 1986) is used in this study as an illustrative
example. here are 3 hot streams and 2 cold streams in the case. The minimum temperature approach, ∆Tmin
of TRP is at 19 ℃. The existing HEN of TRP is as shown in Figure 2 while Table 1 shows the properties of the
0
20
40
60
80
100
120
140
160
180
200
0 50 100 150 200 250 300 350 400 450
T s
hif
t (˚
C)
H (kW)
Cold STEP 1
Hot STEP 1
Cold STEP 2
Hot STEP 2
∆H = 140 kW
Slope = reciprocal of heat capacity flowrate
343 ℃
171.58 ℃ 90 ℃
159 ℃ 136.95 ℃ 77 ℃
267 ℃ 170.87 ℃ 80 ℃ 1369.9 kW
185.4 kW
127 ℃ 73 ℃ 26 ℃
118 ℃ 128 ℃
175 ℃ 265 ℃
196.1 kW 921.7 kW
438.6 kW
1764.9 kW
504.2 kW
1
5
4
3
2
1
3
4
2
H
C2
C1
1652
streams involved in the case. FCp is the heat capacity flow rate of the stream, Ts shows the supply temperature
while Tt shows the target temperature.
Table 1: Properties of the streams in TRP
2.1 Diagnosis Stage The diagnosis stage involves translation of the existing HEN into STEP diagram, followed by determination of
the potential streams and selection of targeted streams. The steps involved are described as follow.
Step 1: Draw the existing HEN in STEP diagram by maintaining the individual stream characteristic.
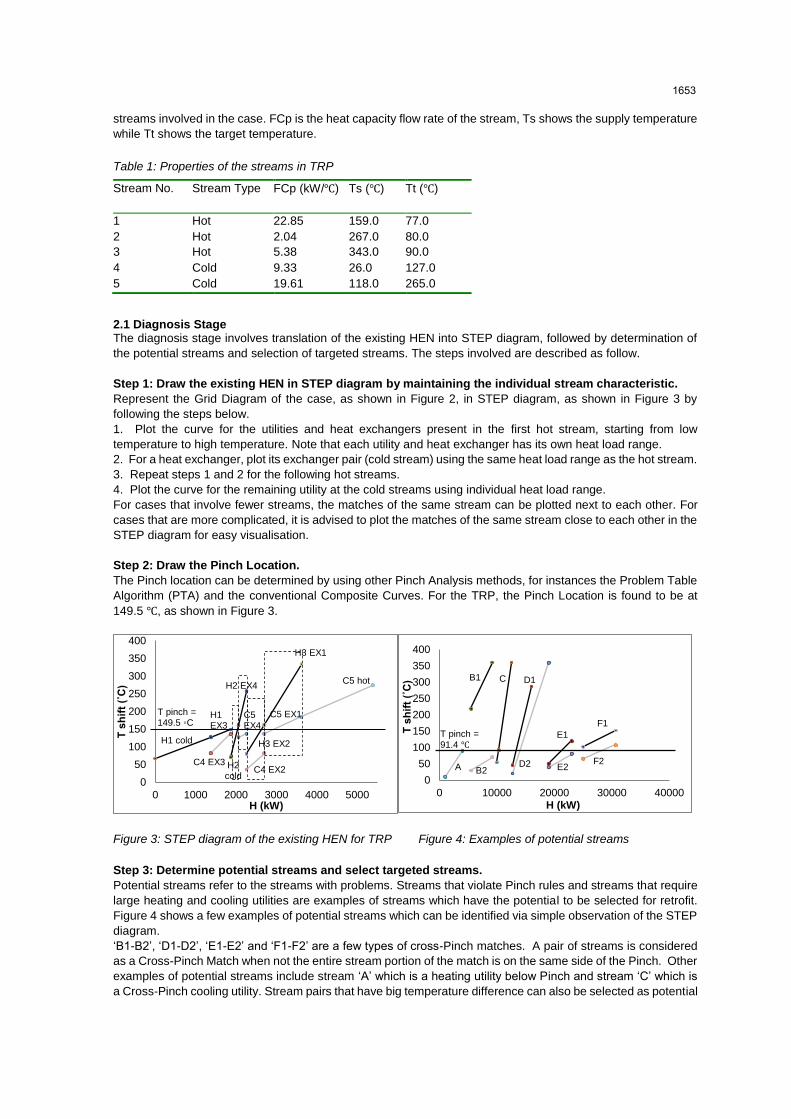
Represent the Grid Diagram of the case, as shown in Figure 2, in STEP diagram, as shown in Figure 3 by
following the steps below.
1. Plot the curve for the utilities and heat exchangers present in the first hot stream, starting from low
temperature to high temperature. Note that each utility and heat exchanger has its own heat load range.
2. For a heat exchanger, plot its exchanger pair (cold stream) using the same heat load range as the hot stream.
3. Repeat steps 1 and 2 for the following hot streams.
4. Plot the curve for the remaining utility at the cold streams using individual heat load range.
For cases that involve fewer streams, the matches of the same stream can be plotted next to each other. For
cases that are more complicated, it is advised to plot the matches of the same stream close to each other in the
STEP diagram for easy visualisation.
Step 2: Draw the Pinch Location.
The Pinch location can be determined by using other Pinch Analysis methods, for instances the Problem Table
Algorithm (PTA) and the conventional Composite Curves. For the TRP, the Pinch Location is found to be at
149.5 ℃, as shown in Figure 3.
Figure 3: STEP diagram of the existing HEN for TRP Figure 4: Examples of potential streams
Step 3: Determine potential streams and select targeted streams.
Potential streams refer to the streams with problems. Streams that violate Pinch rules and streams that require
large heating and cooling utilities are examples of streams which have the potential to be selected for retrofit.
Figure 4 shows a few examples of potential streams which can be identified via simple observation of the STEP
diagram.
‘B1-B2’, ‘D1-D2’, ‘E1-E2’ and ‘F1-F2’ are a few types of cross-Pinch matches. A pair of streams is considered
as a Cross-Pinch Match when not the entire stream portion of the match is on the same side of the Pinch. Other
examples of potential streams include stream ‘A’ which is a heating utility below Pinch and stream ‘C’ which is
a Cross-Pinch cooling utility. Stream pairs that have big temperature difference can also be selected as potential
0
50
100
150
200
250
300
350
400
0 1000 2000 3000 4000 5000
T s
hif
t (˚
C)
H (kW)
C4 EX2
H3 EX2
H3 EX1
C5 hot
H1 EX3
C4 EX3
H1 cold
H2 cold
C5 EX1
H2 EX4
C5 EX4
T pinch = 149.5 ◦C
0
50
100
150
200
250
300
350
400
0 10000 20000 30000 40000
T s
hif
t (˚
C)
H (kW)
T pinch = 91.4 ℃
A
B1
B2
C D1
D2
E1
E2
F1
F2
Stream No. Stream Type FCp (kW/℃) Ts (℃) Tt (℃)
1 Hot 22.85 159.0 77.0
2 Hot 2.04 267.0 80.0
3 Hot 5.38 343.0 90.0
4 Cold 9.33 26.0 127.0
5 Cold 19.61 118.0 265.0
1653
streams to be retrofitted. Users may as well include the streams that they wish to retrofit as the potential streams,
although the streams are not violating the Pinch rules.
Not all of the potential streams are worth to be retrofitted as this will end up with high retrofit cost. Among the
potential streams, the users are advised to select only the potential streams with large heat load to be listed as
the targeted streams which will later be retrofitted. This is to maximise the heat recovery while maintaining the
retrofit cost at an acceptable range.
In this case study, the Cross-Pinch heat matches are the streams pairs involving Exchanger 1, Exchanger 2,
Exchanger 4 and the cold utility at stream ‘H2’, as shown by the boxes in Figure 3. All streams are selected as
targeted streams as not many streams are involved. In cases that involve large number of streams, streams
that are not selected and not located along the affected streams path can be removed from the STEP diagram
to simplify the problem. After the diagnosis stage, the targeted streams will undergo retrofit in the next stage.
2.2 Retrofit Stage Step 4: Relocate new Pinch.
After stream selection, determine the new Pinch location using Pinch Analysis method, such as Problem Table
Algorithm. In this case, the original Pinch location is maintained at 149.5℃ as no selection of streams involved.
Step 5: Remove Cross-Pinch matches and utilities.
Remove Cross-Pinch matches and utilities by dividing their heat loads on the process streams into two parts
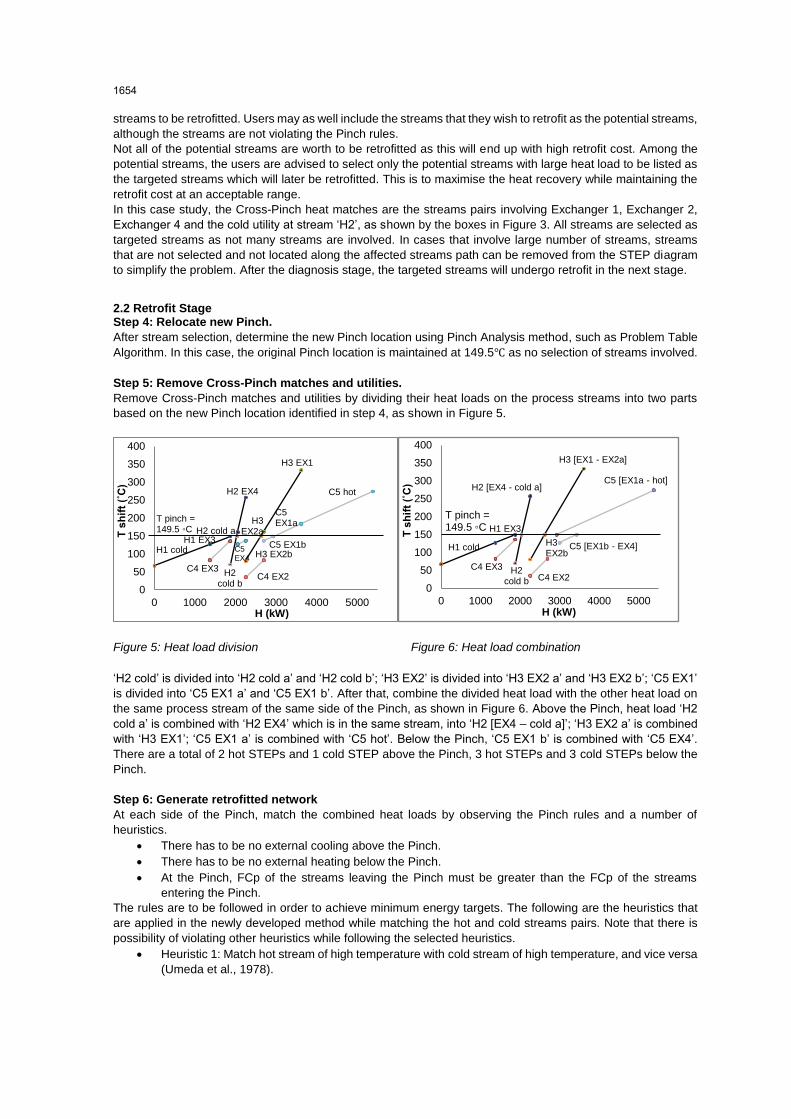
based on the new Pinch location identified in step 4, as shown in Figure 5.
Figure 5: Heat load division Figure 6: Heat load combination
‘H2 cold’ is divided into ‘H2 cold a’ and ‘H2 cold b’; ‘H3 EX2’ is divided into ‘H3 EX2 a’ and ‘H3 EX2 b’; ‘C5 EX1’
is divided into ‘C5 EX1 a’ and ‘C5 EX1 b’. After that, combine the divided heat load with the other heat load on
the same process stream of the same side of the Pinch, as shown in Figure 6. Above the Pinch, heat load ‘H2
cold a’ is combined with ‘H2 EX4’ which is in the same stream, into ‘H2 [EX4 – cold a]’; ‘H3 EX2 a’ is combined
with ‘H3 EX1’; ‘C5 EX1 a’ is combined with ‘C5 hot’. Below the Pinch, ‘C5 EX1 b’ is combined with ‘C5 EX4’.
There are a total of 2 hot STEPs and 1 cold STEP above the Pinch, 3 hot STEPs and 3 cold STEPs below the
Pinch.
Step 6: Generate retrofitted network
At each side of the Pinch, match the combined heat loads by observing the Pinch rules and a number of
heuristics.
• There has to be no external cooling above the Pinch.
• There has to be no external heating below the Pinch.
• At the Pinch, FCp of the streams leaving the Pinch must be greater than the FCp of the streams
entering the Pinch.
The rules are to be followed in order to achieve minimum energy targets. The following are the heuristics that
are applied in the newly developed method while matching the hot and cold streams pairs. Note that there is
possibility of violating other heuristics while following the selected heuristics.
• Heuristic 1: Match hot stream of high temperature with cold stream of high temperature, and vice versa
(Umeda et al., 1978).
0
50
100
150
200
250
300
350
400
0 1000 2000 3000 4000 5000
T s
hif
t (˚
C)
H (kW)
H3 EX2a
C5 EX1b
H2 cold a
H2 EX4
H3 EX1
C5 hot
H1 cold
C4 EX3 H2 cold b
C5 EX4 H3 EX2b
C4 EX2
H1 EX3
T pinch = 149.5 ◦C
C5 EX1a
0
50
100
150
200
250
300
350
400
0 1000 2000 3000 4000 5000
T s
hif
t (˚
C)
H (kW)
C5 [EX1b - EX4]
C4 EX2H2
cold b
C4 EX3
H1 coldH3 EX2b
H1 EX3
H2 [EX4 - cold a]
H3 [EX1 - EX2a]
C5 [EX1a - hot]
T pinch = 149.5 ◦C
1654
• Heuristic 2: Match hot stream with cold stream that has similar FCp. If there is a big difference between
the FCp of the two streams, consider splitting the stream with the larger flow heat capacity (Sama et
al., 1989).
• Heuristic 3: Match hot stream with cold stream that has the same or close amount of heat load.
• Heuristic 4: Serial arrangement of heat exchanger is preferred as compared to parallel arrangement.
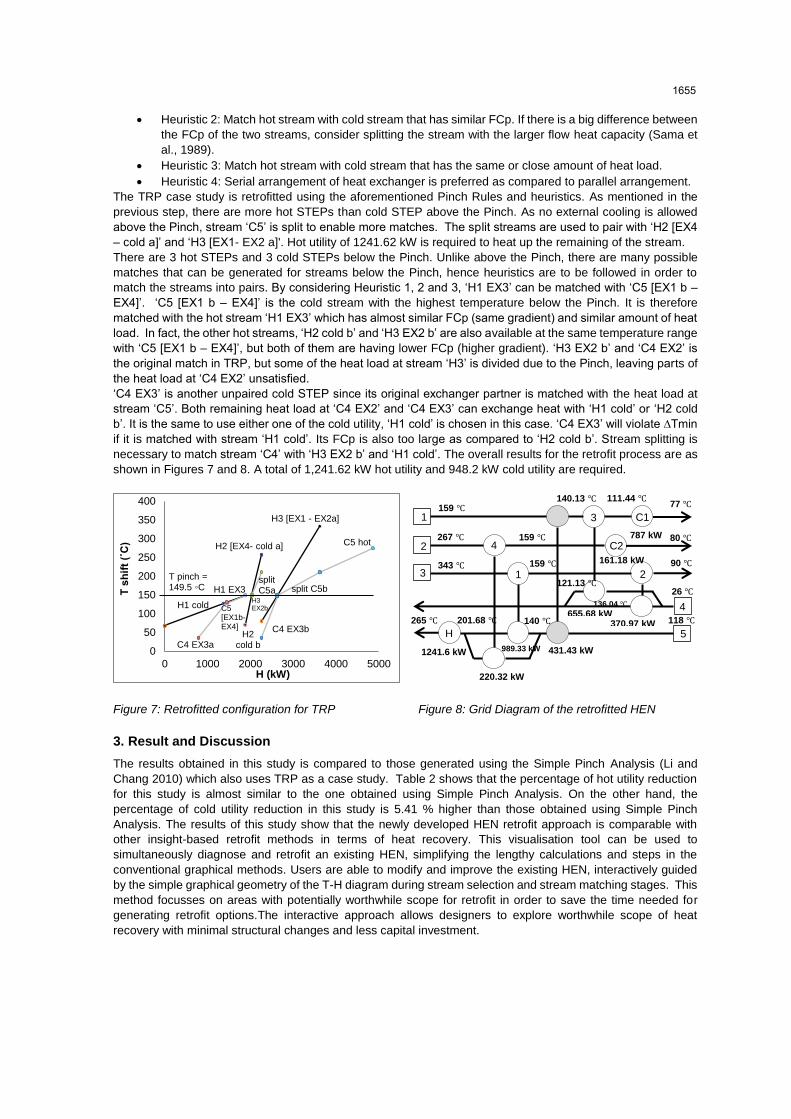
The TRP case study is retrofitted using the aforementioned Pinch Rules and heuristics. As mentioned in the
previous step, there are more hot STEPs than cold STEP above the Pinch. As no external cooling is allowed
above the Pinch, stream ‘C5’ is split to enable more matches. The split streams are used to pair with ‘H2 [EX4
– cold a]’ and ‘H3 [EX1- EX2 a]'. Hot utility of 1241.62 kW is required to heat up the remaining of the stream.
There are 3 hot STEPs and 3 cold STEPs below the Pinch. Unlike above the Pinch, there are many possible
matches that can be generated for streams below the Pinch, hence heuristics are to be followed in order to
match the streams into pairs. By considering Heuristic 1, 2 and 3, ‘H1 EX3’ can be matched with ‘C5 [EX1 b –
EX4]’. ‘C5 [EX1 b – EX4]’ is the cold stream with the highest temperature below the Pinch. It is therefore
matched with the hot stream ‘H1 EX3’ which has almost similar FCp (same gradient) and similar amount of heat
load. In fact, the other hot streams, ‘H2 cold b’ and ‘H3 EX2 b’ are also available at the same temperature range
with ‘C5 [EX1 b – EX4]’, but both of them are having lower FCp (higher gradient). ‘H3 EX2 b’ and ‘C4 EX2’ is
the original match in TRP, but some of the heat load at stream ‘H3’ is divided due to the Pinch, leaving parts of
the heat load at ‘C4 EX2’ unsatisfied.
‘C4 EX3’ is another unpaired cold STEP since its original exchanger partner is matched with the heat load at
stream ‘C5’. Both remaining heat load at ‘C4 EX2’ and ‘C4 EX3’ can exchange heat with ‘H1 cold’ or ‘H2 cold
b’. It is the same to use either one of the cold utility, ‘H1 cold’ is chosen in this case. ‘C4 EX3’ will violate ∆Tmin
if it is matched with stream ‘H1 cold’. Its FCp is also too large as compared to ‘H2 cold b’. Stream splitting is
necessary to match stream ‘C4’ with ‘H3 EX2 b’ and ‘H1 cold’. The overall results for the retrofit process are as
shown in Figures 7 and 8. A total of 1,241.62 kW hot utility and 948.2 kW cold utility are required.
Figure 7: Retrofitted configuration for TRP Figure 8: Grid Diagram of the retrofitted HEN
3. Result and Discussion
The results obtained in this study is compared to those generated using the Simple Pinch Analysis (Li and
Chang 2010) which also uses TRP as a case study. Table 2 shows that the percentage of hot utility reduction
for this study is almost similar to the one obtained using Simple Pinch Analysis. On the other hand, the
percentage of cold utility reduction in this study is 5.41 % higher than those obtained using Simple Pinch
Analysis. The results of this study show that the newly developed HEN retrofit approach is comparable with
other insight-based retrofit methods in terms of heat recovery. This visualisation tool can be used to
simultaneously diagnose and retrofit an existing HEN, simplifying the lengthy calculations and steps in the
conventional graphical methods. Users are able to modify and improve the existing HEN, interactively guided
by the simple graphical geometry of the T-H diagram during stream selection and stream matching stages. This
method focusses on areas with potentially worthwhile scope for retrofit in order to save the time needed for
generating retrofit options.The interactive approach allows designers to explore worthwhile scope of heat
recovery with minimal structural changes and less capital investment.
0
50
100
150
200
250
300
350
400
0 1000 2000 3000 4000 5000
T s
hif
t (˚
C)
H (kW)
C5 [EX1b-EX4]
split C5b
C4 EX3b
C4 EX3a
H1 cold
H2 cold b
C5 hot
H3 [EX1 - EX2a]
H2 [EX4- cold a]
split C5a
T pinch = 149.5 ◦C
H3 EX2b
H1 EX3
989.33 kW
343 ℃ 159 ℃ 90 ℃
159 ℃
140.13 ℃ 111.44 ℃ 77 ℃
267 ℃ 159 ℃ 80 ℃ 787 kW
161.18 kW
121.13 ℃
136.04 ℃
26 ℃
118 ℃ 140 ℃ 201.68 ℃ 265 ℃
431.43 kW
655.68 kW
220.32 kW
370.97 kW
1241.6 kW
1
2
3
4
5
1
4
H
3 C1
C2
2
1655
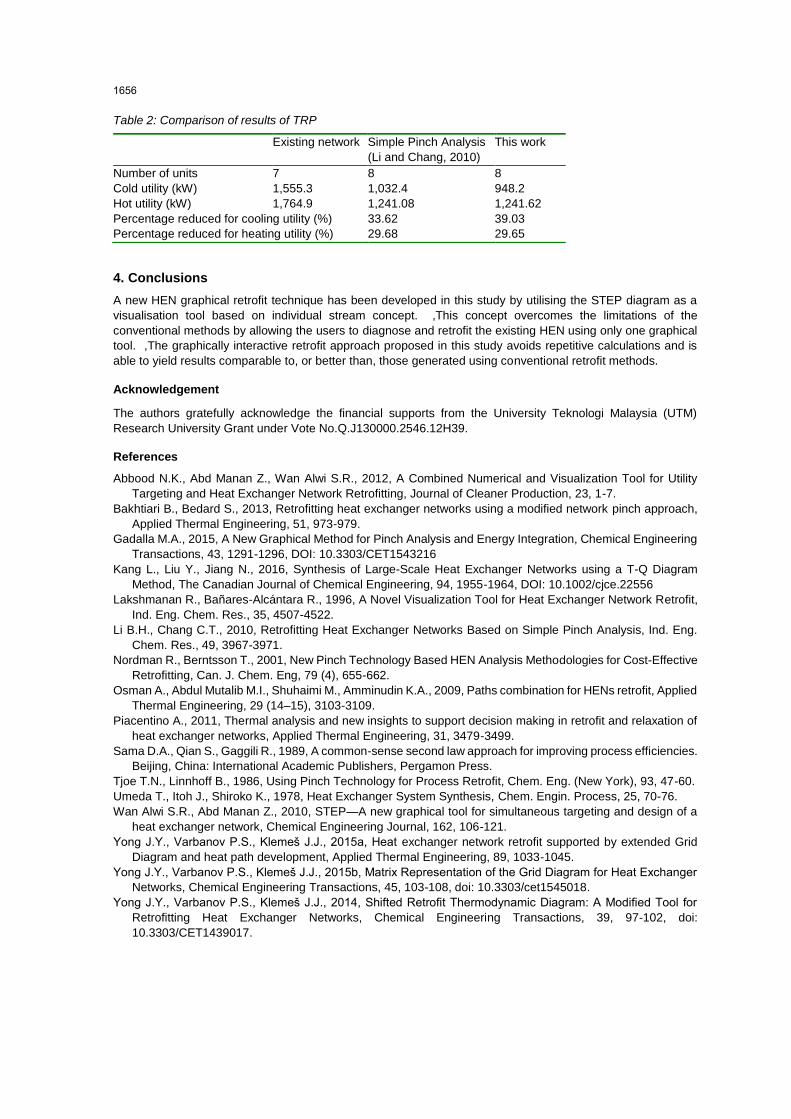
Table 2: Comparison of results of TRP
4. Conclusions
A new HEN graphical retrofit technique has been developed in this study by utilising the STEP diagram as a
visualisation tool based on individual stream concept. ,This concept overcomes the limitations of the
conventional methods by allowing the users to diagnose and retrofit the existing HEN using only one graphical
tool. ,The graphically interactive retrofit approach proposed in this study avoids repetitive calculations and is
able to yield results comparable to, or better than, those generated using conventional retrofit methods.
Acknowledgement
The authors gratefully acknowledge the financial supports from the University Teknologi Malaysia (UTM)
Research University Grant under Vote No.Q.J130000.2546.12H39.
References
Abbood N.K., Abd Manan Z., Wan Alwi S.R., 2012, A Combined Numerical and Visualization Tool for Utility
Targeting and Heat Exchanger Network Retrofitting, Journal of Cleaner Production, 23, 1-7.
Bakhtiari B., Bedard S., 2013, Retrofitting heat exchanger networks using a modified network pinch approach,
Applied Thermal Engineering, 51, 973-979.
Gadalla M.A., 2015, A New Graphical Method for Pinch Analysis and Energy Integration, Chemical Engineering
Transactions, 43, 1291-1296, DOI: 10.3303/CET1543216
Kang L., Liu Y., Jiang N., 2016, Synthesis of Large-Scale Heat Exchanger Networks using a T-Q Diagram
Method, The Canadian Journal of Chemical Engineering, 94, 1955-1964, DOI: 10.1002/cjce.22556
Lakshmanan R., Bañares-Alcántara R., 1996, A Novel Visualization Tool for Heat Exchanger Network Retrofit,
Ind. Eng. Chem. Res., 35, 4507-4522.
Li B.H., Chang C.T., 2010, Retrofitting Heat Exchanger Networks Based on Simple Pinch Analysis, Ind. Eng.
Chem. Res., 49, 3967-3971.
Nordman R., Berntsson T., 2001, New Pinch Technology Based HEN Analysis Methodologies for Cost-Effective
Retrofitting, Can. J. Chem. Eng, 79 (4), 655-662.
Osman A., Abdul Mutalib M.I., Shuhaimi M., Amminudin K.A., 2009, Paths combination for HENs retrofit, Applied
Thermal Engineering, 29 (14–15), 3103-3109.
Piacentino A., 2011, Thermal analysis and new insights to support decision making in retrofit and relaxation of
heat exchanger networks, Applied Thermal Engineering, 31, 3479-3499.
Sama D.A., Qian S., Gaggili R., 1989, A common-sense second law approach for improving process efficiencies.
Beijing, China: International Academic Publishers, Pergamon Press.
Tjoe T.N., Linnhoff B., 1986, Using Pinch Technology for Process Retrofit, Chem. Eng. (New York), 93, 47-60.
Umeda T., Itoh J., Shiroko K., 1978, Heat Exchanger System Synthesis, Chem. Engin. Process, 25, 70-76.
Wan Alwi S.R., Abd Manan Z., 2010, STEP—A new graphical tool for simultaneous targeting and design of a
heat exchanger network, Chemical Engineering Journal, 162, 106-121.
Yong J.Y., Varbanov P.S., Klemeš J.J., 2015a, Heat exchanger network retrofit supported by extended Grid
Diagram and heat path development, Applied Thermal Engineering, 89, 1033-1045.
Yong J.Y., Varbanov P.S., Klemeš J.J., 2015b, Matrix Representation of the Grid Diagram for Heat Exchanger
Networks, Chemical Engineering Transactions, 45, 103-108, doi: 10.3303/cet1545018.
Yong J.Y., Varbanov P.S., Klemeš J.J., 2014, Shifted Retrofit Thermodynamic Diagram: A Modified Tool for
Retrofitting Heat Exchanger Networks, Chemical Engineering Transactions, 39, 97-102, doi:
10.3303/CET1439017.
Existing network Simple Pinch Analysis
(Li and Chang, 2010)
This work
Number of units 7 8 8
Cold utility (kW) 1,555.3 1,032.4 948.2
Hot utility (kW) 1,764.9 1,241.08 1,241.62
Percentage reduced for cooling utility (%) 33.62 39.03
Percentage reduced for heating utility (%) 29.68 29.65
1656