healthcare analytics using hadoop
DESCRIPTION
In today's modern world, healthcare also needs to be modernized. It means that the healthcare data should be properly analyzed so that we can categorize it into groups of Gender, Disease, City, Symptoms and treatment. The gigantic size of analytics will need large computation which can be done with the help of distributed processing HADOOP. The frameworks use will provide multipurpose beneficial outputs which includes getting the healthcare data analysis into various forms. BIGDATA is used to predict epidemics, cure disease, improve quality of life and avoid preventable deaths. With the increasing population of the world, and everyone living longer, models of treatment delivery are rapidly changing and many of the decision behind those changes are being driven by data. The drive now is to understand as much as a patient as possible, as early in their life as possible, hopefully picking up warning signs of serious illness at early enough stage that treatment is far simpler and less expeTRANSCRIPT
HEALTHCARE�ANALYTICS�USING�HADOOP
1 1 1 1Priyanka Bhalerao | Sayali Ekbote Kalyani Jainak | Nikita Vaidya1 Department of Computer Engineering, AISSMS Institute of Information Technology, Kennedy Road, Pune-411001.
ABSTRACT
In today's modern world, healthcare also needs to be modernized. It means that the healthcare data should be properly analyzed so that we can categorize it into groups of Gender, Disease, City, Symptoms and treatment. The gigantic size of analytics will need large computation which can be done with the help of distributed processing HADOOP. The frameworks use will provide multipurpose beneficial outputs which includes getting the healthcare data analysis into various forms. BIGDATA is used to predict epidemics, cure disease, improve quality of life and avoid preventable deaths. With the increasing population of the world, and everyone living longer, models of treatment delivery are rapidly changing and many of the decision behind those changes are being driven by data. The drive now is to understand as much as a patient as possible, as early in their life as possible, hopefully picking up warning signs of serious illness at early enough stage that treatment is far simpler and less expensive than if it had not been spotted until later. The proposed system will group together the disease and their symptoms data and analyze it to provide cumulative information. After the analysis, algorithm could be applied to the resultant and grouping can be made to show a clear picture of the analysis. The groups made by the system would be symptoms wise, age wise, gender wise, season wise, disease wise etc. As the system will display the data group wise, it would be helpful to get a clear idea about the disease and their rate of spreading, so that appropriate treatment could be given at proper time.
KEYWORDS: Big Data, NoSql, Temporal Event Analysis, Medical Record, MapReduce.
INTRODUCTION:
The healthcare industry historically has generated large amounts of data, driven by record keeping, compliance & regulatory requirements, and patient care. While most data is stored in hard copy form, the current trend is toward rapid digitization of these large amounts of data. Driven by mandatory requirements and the potential to improve the quality of healthcare delivery meanwhile reducing the costs, these massive quantities of data (known as 'big data') hold the promise of supporting a wide range of medical and healthcare functions, including among others clinical decision sup-port, disease surveillance, and population health management.
In this new era of big data, even health care needs to be modern-ized, this includes that the health care data should be properly ana-lyzed so that we can deduce that in which group or gender or region, diseases attack the most. This gigantic size of analytics will need large computation which can be done with help of distributed processing, Hadoop. MapReduce, a popular computing paradigm for large-scale data processing in cloud computing. However, the slot-base MapReduce system (e.g., Hadoop MRv1) due to its unoptimized resource allocation, can suffer from poor perfor-mance. To address it, the framework in this paper optimizes the resource allocation. Due to the static pre-configuration of distinct map slots and reduce slots which are not fungible, many a times slots can be severely under-utilized.
This is because map slots might be fully utilized while reduce slots may remain empty, and vice-versa. We propose an alternative tech-nique called Dynamic Hadoop Slot Allocation by keeping the slot-based allocation model. It relaxes the slot allocation constraint and allows slots to be reallocated to either map or reduce tasks depending on their needs. The framework's use will provide multi-purpose beneficial outputs which include: getting the health care analysis in various forms. Thus this concept of analytics should be implemented with a view of future use.
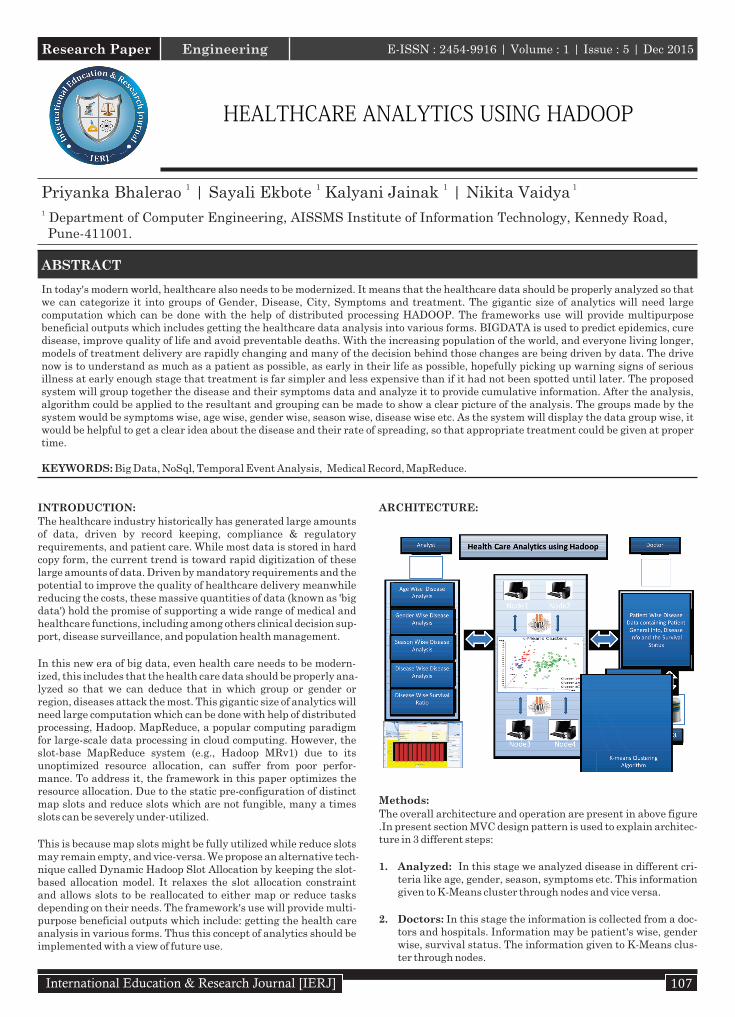
ARCHITECTURE:
Methods:
The overall architecture and operation are present in above figure .In present section MVC design pattern is used to explain architec-ture in 3 different steps:
1. Analyzed: In this stage we analyzed disease in different cri-teria like age, gender, season, symptoms etc. This information given to K-Means cluster through nodes and vice versa.
2. Doctors: In this stage the information is collected from a doc-tors and hospitals. Information may be patient's wise, gender wise, survival status. The information given to K-Means clus-ter through nodes.
Research Paper Engineering E-ISSN : 2454-9916 | Volume : 1 | Issue : 5 | Dec 2015
107International Education & Research Journal [IERJ]
3. Health care analysis using HADOOP : In this stage the infor-mation is collected from doctors and analyst. The Given infor-mation is represented in the form of K-Means cluster maps in which we can differentiate the disease.
Disease and their possible symptoms data is grouped together and analyzed to provide cumulative information. After the analysis done, algorithm can be applied to the resultant and the grouping can be done to show clearer picture of the analy-sis. Following are some grouping categories based on which grouping can be done.
1. Symptom Wise Disease PredicationDisease and their possible symptoms data is grouped together and analyzed to provide cumulative information. By this user can pro-vide symptom, System will predict the disease accordingly. So patient can prevent it by taking certain precautions.
2. Disease Wise Treatment DeterminationAccording to the disease predicated by symptom, a suitable treat-ment cab be given to the patient.
3. Disease Wise Survival RatioSystem can show the disease wise survival ratio, so that it would be possible to take decision for the patient and his family about the treatment. Now a day's many patients goes get admitted in hospi-tal at last stage. This would help to easily understand the disease states.
4. Gender Wise Disease StatisticsMany diseases affect both women and men alike but some diseases occur in women at a higher frequency. For example, about 18% of women compared to 6% of men in the U.S. suffer migraine head-aches. So, certain precautions can be suggested for the particular gender people.
5. Region Wise Disease CountSome diseases may get spread very fast and the whole region gets influenced by that disease. So these statistics would help to take precautions for the people leaving in a particular region to avoid the spread of that disease and reduce death ratio.
6. Identifying and Developing the Next Generation of Health Care Treatments.This can really be the next generation of the Health Care Treat-ments, as by studying the different statistics, diseases can be pre-vented by taking certain precautions wither for a particular age group or a specific gender people or for a particular region people.
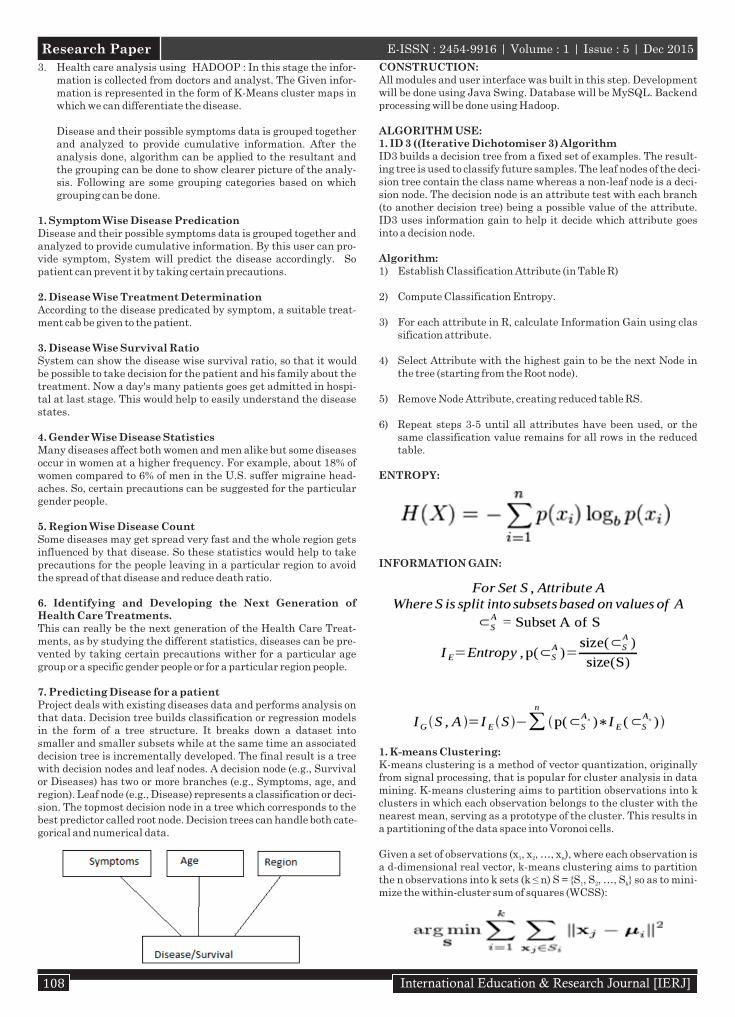
7. Predicting Disease for a patientProject deals with existing diseases data and performs analysis on that data. Decision tree builds classification or regression models in the form of a tree structure. It breaks down a dataset into smaller and smaller subsets while at the same time an associated decision tree is incrementally developed. The final result is a tree with decision nodes and leaf nodes. A decision node (e.g., Survival or Diseases) has two or more branches (e.g., Symptoms, age, and region). Leaf node (e.g., Disease) represents a classification or deci-sion. The topmost decision node in a tree which corresponds to the best predictor called root node. Decision trees can handle both cate-gorical and numerical data.
CONSTRUCTION:All modules and user interface was built in this step. Development will be done using Java Swing. Database will be MySQL. Backend processing will be done using Hadoop.
ALGORITHM USE:1. ID 3 ((Iterative Dichotomiser 3) Algorithm ID3 builds a decision tree from a fixed set of examples. The result-ing tree is used to classify future samples. The leaf nodes of the deci-sion tree contain the class name whereas a non-leaf node is a deci-sion node. The decision node is an attribute test with each branch (to another decision tree) being a possible value of the attribute. ID3 uses information gain to help it decide which attribute goes into a decision node.
Algorithm:1) Establish Classification Attribute (in Table R)
2) Compute Classification Entropy.
3) For each attribute in R, calculate Information Gain using clas sification attribute.
4) Select Attribute with the highest gain to be the next Node in the tree (starting from the Root node).
5) Remove Node Attribute, creating reduced table RS.
6) Repeat steps 3-5 until all attributes have been used, or the same classification value remains for all rows in the reduced table.
ENTROPY:
INFORMATION GAIN:
1. K-means Clustering:K-means clustering is a method of vector quantization, originally from signal processing, that is popular for cluster analysis in data mining. K-means clustering aims to partition observations into k clusters in which each observation belongs to the cluster with the nearest mean, serving as a prototype of the cluster. This results in a partitioning of the data space into Voronoi cells.
Given a set of observations (x , x , …, x ), where each observation is 1 2 n
a d-dimensional real vector, k-means clustering aims to partition the n observations into k sets (k ≤ n) S = {S , S , …, S } so as to mini-1 2 k
mize the within-cluster sum of squares (WCSS):
Research Paper E-ISSN : 2454-9916 | Volume : 1 | Issue : 5 | Dec 2015
108 International Education & Research Journal [IERJ]
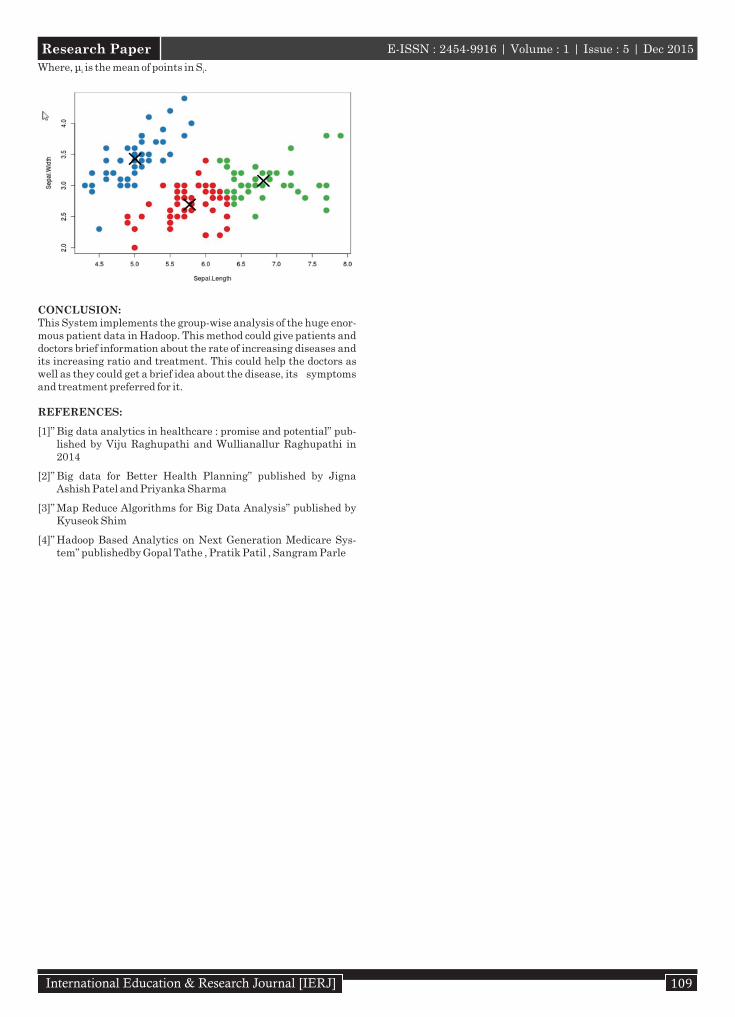
Where, μ is the mean of points in S .i i
CONCLUSION:This System implements the group-wise analysis of the huge enor-mous patient data in Hadoop. This method could give patients and doctors brief information about the rate of increasing diseases and its increasing ratio and treatment. This could help the doctors as well as they could get a brief idea about the disease, its symptoms and treatment preferred for it.
REFERENCES:
[1]” Big data analytics in healthcare : promise and potential” pub-lished by Viju Raghupathi and Wullianallur Raghupathi in 2014
[2]” Big data for Better Health Planning” published by Jigna Ashish Patel and Priyanka Sharma
[3]” Map Reduce Algorithms for Big Data Analysis” published by Kyuseok Shim
[4]” Hadoop Based Analytics on Next Generation Medicare Sys-tem” publishedby Gopal Tathe , Pratik Patil , Sangram Parle
Research Paper E-ISSN : 2454-9916 | Volume : 1 | Issue : 5 | Dec 2015
109International Education & Research Journal [IERJ]