health & wellness: redefining healthy living
TRANSCRIPT
03
04
05
08
15
19
21
Executive Summary
Introduction
Background
Trends
Growth Opportunities
Conclusions
Resources
November 2009 Health & Wellness: Redefining Healthy Living
Thom BlischokPresident, Shopper Marketing and Innovation
Seeking the New Normal
Americans continue to have a love-hate relationship with building and maintaining healthy eating and living habits. The Centers for Disease Control reports that U.S. life expectancy has increased three years in just the past decade, but that over the past 30 years, the prevalence of obesity has tripled. Despite nearly continuous news articles on the benefits of exercise, only about one-third of Americans exercise on most days, and among those concerned about chronic disease, the rate is even lower.
How do CPG manufacturers and retailers possibly develop and market products against this seemingly endless set of contradictions? Both must take a new look at product development, marketing and merchandising to increase the penetration of better-for-you food and beauty care products into households of all incomes and other demographics.
Leveraging the brand strength of existing national and private brand products, manufacturers and retailers should consider introducing brand extensions that feature healthier and/or organic ingredients. Kellogg’s has instituted this approach with its Pop-Tarts brand, which now includes whole grains. Hostess has taken a slightly different approach, reducing portion sizes on several of its snack cakes.
Innovative marketing efforts will also increase interest in better-for-you products and living habits. For example, to combat the significant number of consumers that find current nutrition labels “exhausting,” “difficult to understand” and/or “not helpful,” Guiding Stars, an independent organization, has developed a simplified rating system based on the nutritional density of food products per 100 calories. Foods are evaluated on a point system, ranging from 0 stars (does not meet nutritional requirements to receive any star) to 3 (best nutritional value). The goal is to simplify and increase information about healthy products, and do a better job of “telling the story” about these products and their nutritional benefits.
Savvy CPG manufacturers and retailers are also exploring merchandising opportunities. Setting up discrete displays or kiosks where better-for-you products are displayed, cross-selling healthier products on packages of “traditional” products and selectively reducing prices are examples of three successful strategies.
Behind any strategy should be a current and thorough understanding of the shopper, especially in today’s economy characterized by pockets of recovery and recession. How has the shopper changed? How have their behaviors evolved? How have their perceptions of value been affected? How do they define affordability today? As IRI has reported over the last 18 months, the recession has dramatically changed the answers to these core questions. IRI will continue to report on the economic recovery and the impact on shopper behaviors for the future, with a particular focus on the question of whether shoppers will continue their frugal habits going forward, revert to past behaviors or pursue an entirely new set of strategies.
We always appreciate receiving feedback on our surveys, Points of View and Times & Trends, please keep your remarks coming!
© Copyright 2009 Information Resources, Inc. All rights reserved. 3
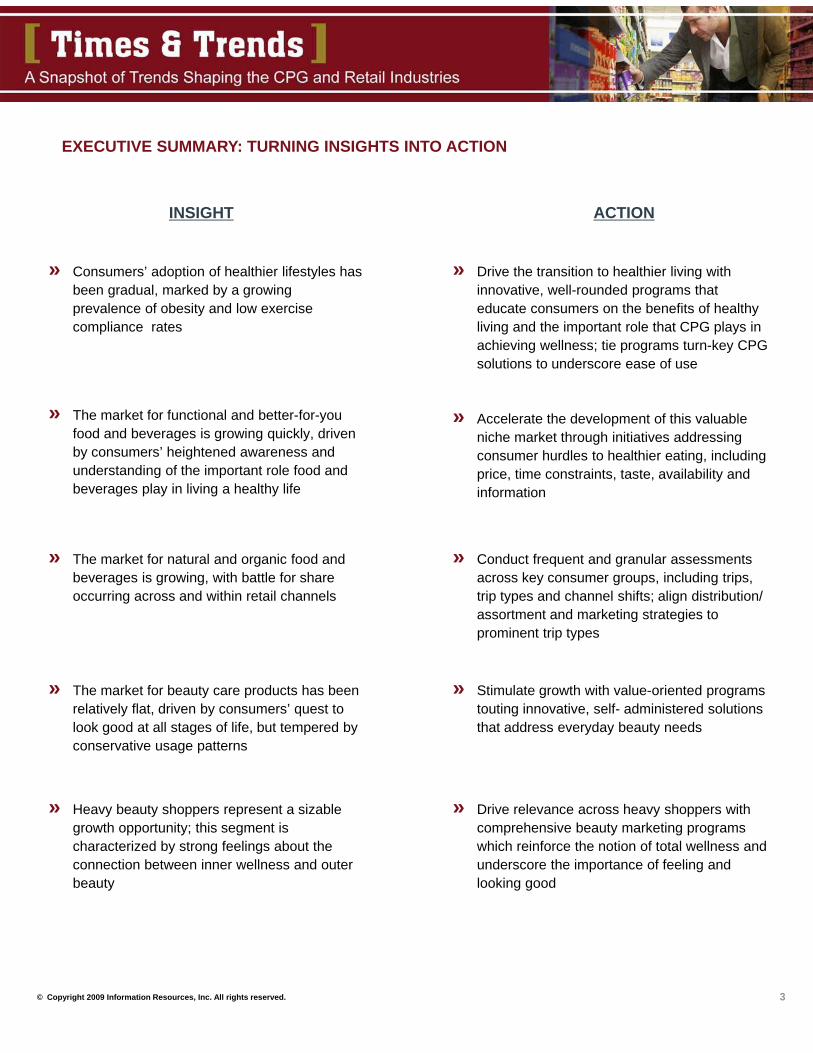
» Consumers’ adoption of healthier lifestyles has been gradual, marked by a growing prevalence of obesity and low exercise compliance rates
EXECUTIVE SUMMARY: TURNING INSIGHTS INTO ACTION
INSIGHT ACTION
» Drive the transition to healthier living with innovative, well-rounded programs that educate consumers on the benefits of healthy living and the important role that CPG plays in achieving wellness; tie programs turn-key CPG solutions to underscore ease of use
» Conduct frequent and granular assessments across key consumer groups, including trips, trip types and channel shifts; align distribution/ assortment and marketing strategies to prominent trip types
» The market for beauty care products has been relatively flat, driven by consumers’ quest to look good at all stages of life, but tempered by conservative usage patterns
» The market for functional and better-for-you food and beverages is growing quickly, driven by consumers’ heightened awareness and understanding of the important role food and beverages play in living a healthy life
» The market for natural and organic food and beverages is growing, with battle for share occurring across and within retail channels
» Stimulate growth with value-oriented programs touting innovative, self- administered solutions that address everyday beauty needs
» Heavy beauty shoppers represent a sizable growth opportunity; this segment is characterized by strong feelings about the connection between inner wellness and outer beauty
» Drive relevance across heavy shoppers with comprehensive beauty marketing programs which reinforce the notion of total wellness and underscore the importance of feeling and looking good
» Accelerate the development of this valuable niche market through initiatives addressing consumer hurdles to healthier eating, including price, time constraints, taste, availability and information
© Copyright 2009 Information Resources, Inc. All rights reserved. 4
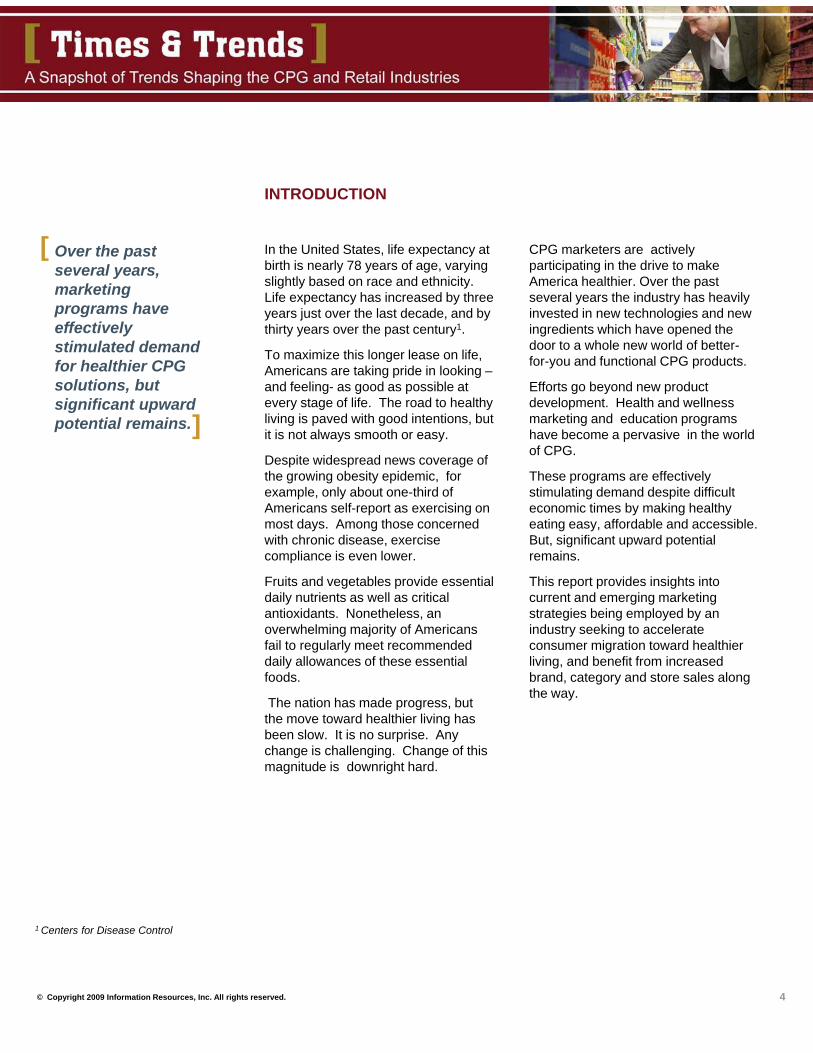
In the United States, life expectancy at birth is nearly 78 years of age, varying slightly based on race and ethnicity. Life expectancy has increased by three years just over the last decade, and by thirty years over the past century1.
To maximize this longer lease on life, Americans are taking pride in looking –and feeling- as good as possible at every stage of life. The road to healthy living is paved with good intentions, but it is not always smooth or easy.
Despite widespread news coverage of the growing obesity epidemic, for example, only about one-third of Americans self-report as exercising on most days. Among those concerned with chronic disease, exercise compliance is even lower.
Fruits and vegetables provide essential daily nutrients as well as critical antioxidants. Nonetheless, an overwhelming majority of Americans fail to regularly meet recommended daily allowances of these essential foods.
The nation has made progress, but the move toward healthier living has been slow. It is no surprise. Any change is challenging. Change of this magnitude is downright hard.
INTRODUCTION
Over the past several years, marketing programs have effectively stimulated demand for healthier CPG solutions, but significant upward potential remains.
CPG marketers are actively participating in the drive to make America healthier. Over the past several years the industry has heavily invested in new technologies and new ingredients which have opened the door to a whole new world of better-for-you and functional CPG products.
Efforts go beyond new product development. Health and wellness marketing and education programs have become a pervasive in the world of CPG.
These programs are effectively stimulating demand despite difficult economic times by making healthy eating easy, affordable and accessible. But, significant upward potential remains.
This report provides insights into current and emerging marketing strategies being employed by an industry seeking to accelerate consumer migration toward healthier living, and benefit from increased brand, category and store sales along the way.
]
[
1 Centers for Disease Control
© Copyright 2009 Information Resources, Inc. All rights reserved. 5
Obesity has reached epidemic proportions in the United States; government agencies and health advocates are working to reverse this dangerous trend.
[ The government, in partnership with a range of health and wellness experts, is working diligently to reverse the trend.
As part of the effort, the Center for Nutrition Policy and Promotion, part of the U.S. Department of Agriculture, was established in 1994. The goal of the organization is to improve the nutrition and well-being of Americans. The group recently launched a major effort in MyPyramid.gov, a food guidance system. The site contains a wide array of tools and educational materials to assist U.S. consumers in their efforts to eat for wellness.
CPG marketers are also playing a vital role in creating a healthier America. The remainder of this report provides detailed insights into CPG trends and strategies that are shaping the health of tomorrow’s shopper.
]
Source: Centers for Disease Control; Behavioral Risk Factor Surveillance System
HEALTHY LIVINGBACKGROUND
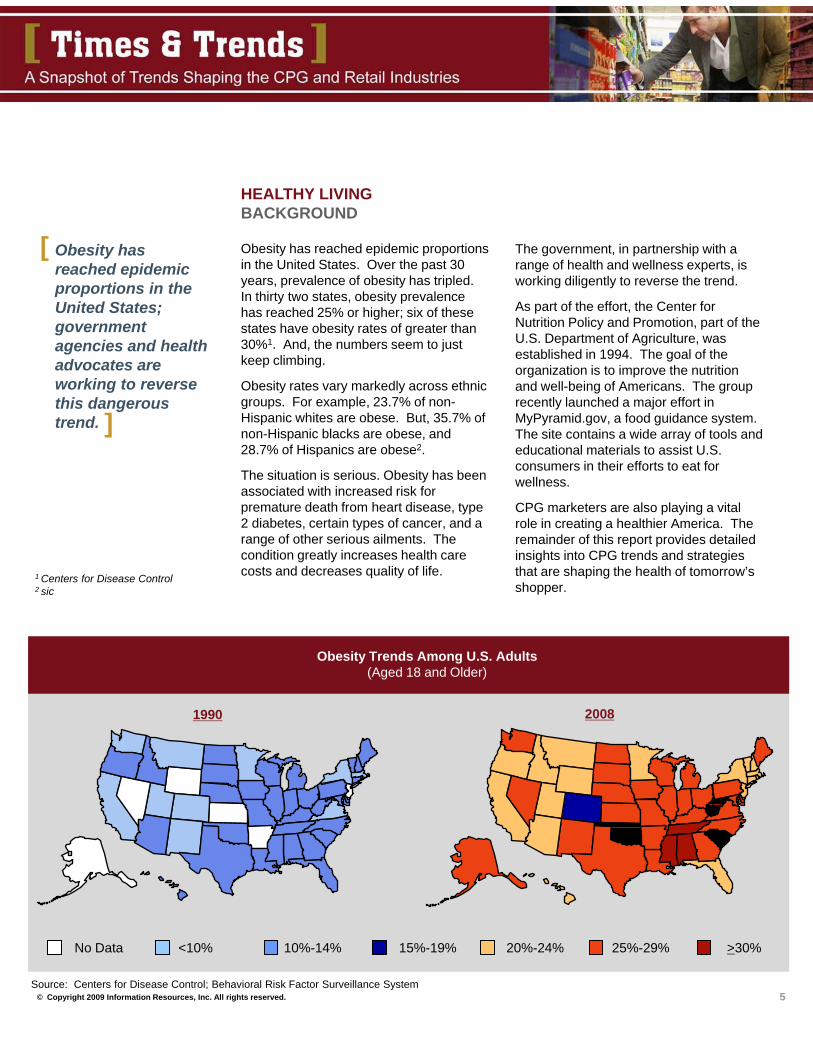
Obesity has reached epidemic proportions in the United States. Over the past 30 years, prevalence of obesity has tripled. In thirty two states, obesity prevalence has reached 25% or higher; six of these states have obesity rates of greater than 30%1. And, the numbers seem to just keep climbing.
Obesity rates vary markedly across ethnic groups. For example, 23.7% of non-Hispanic whites are obese. But, 35.7% of non-Hispanic blacks are obese, and 28.7% of Hispanics are obese2.
The situation is serious. Obesity has been associated with increased risk for premature death from heart disease, type 2 diabetes, certain types of cancer, and a range of other serious ailments. The condition greatly increases health care costs and decreases quality of life.
No Data <10% 10%-14% 15%-19% 20%-24% 25%-29% >30%
Obesity Trends Among U.S. Adults(Aged 18 and Older)
1990 2008
1 Centers for Disease Control2 sic
© Copyright 2009 Information Resources, Inc. All rights reserved. 6
Exercise compliance continues to be a stumbling block to effective lifestyle management.
[ These statistics remain largely unchanged over a several year period.
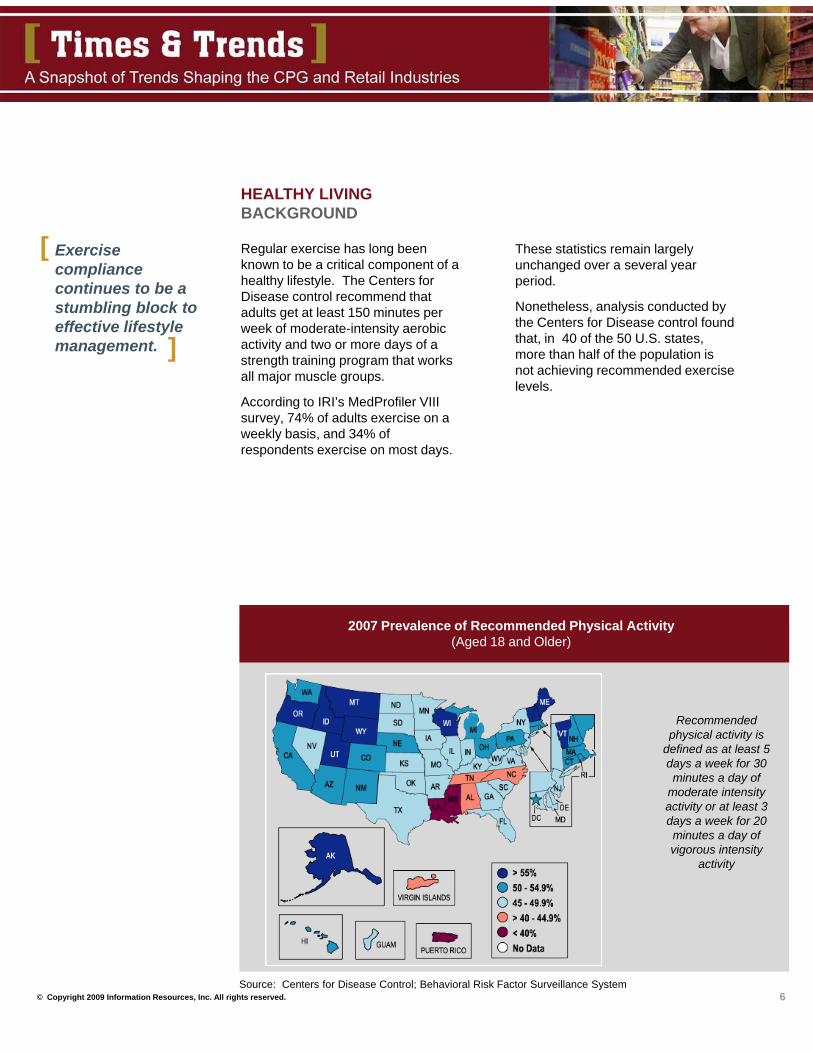
Nonetheless, analysis conducted by the Centers for Disease control found that, in 40 of the 50 U.S. states, more than half of the population is not achieving recommended exercise levels.
]
Source: Centers for Disease Control; Behavioral Risk Factor Surveillance System
Regular exercise has long been known to be a critical component of a healthy lifestyle. The Centers for Disease control recommend that adults get at least 150 minutes per week of moderate-intensity aerobic activity and two or more days of a strength training program that works all major muscle groups.
According to IRI’s MedProfiler VIII survey, 74% of adults exercise on a weekly basis, and 34% of respondents exercise on most days.
2007 Prevalence of Recommended Physical Activity(Aged 18 and Older)
Recommended physical activity is
defined as at least 5 days a week for 30 minutes a day of
moderate intensity activity or at least 3 days a week for 20 minutes a day of vigorous intensity
activity
HEALTHY LIVINGBACKGROUND
© Copyright 2009 Information Resources, Inc. All rights reserved. 7
Among those with specific health concerns, the need for programs highlighting exercise as a component if a healthy lifestyle is significant.
[
]
Source: IRI MedProfiler™ VIII
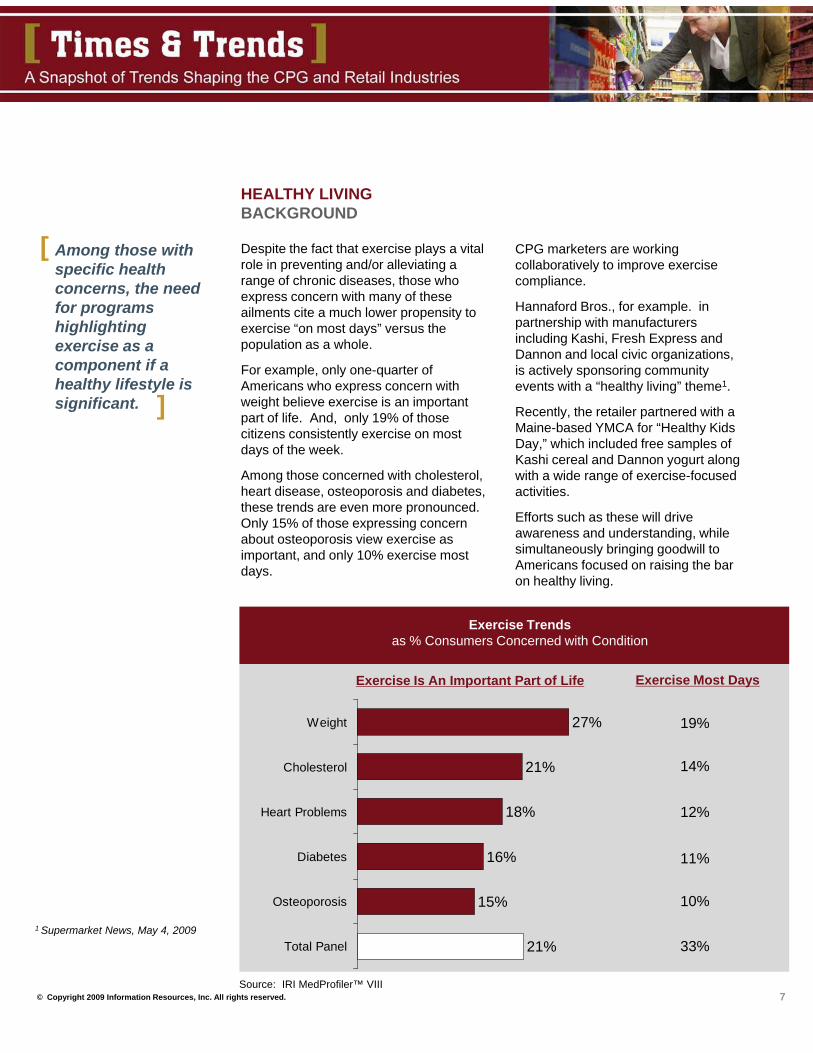
Despite the fact that exercise plays a vital role in preventing and/or alleviating a range of chronic diseases, those who express concern with many of these ailments cite a much lower propensity to exercise “on most days” versus the population as a whole.
For example, only one-quarter of Americans who express concern with weight believe exercise is an important part of life. And, only 19% of those citizens consistently exercise on most days of the week.
Among those concerned with cholesterol, heart disease, osteoporosis and diabetes, these trends are even more pronounced. Only 15% of those expressing concern about osteoporosis view exercise as important, and only 10% exercise most days.
Exercise Trendsas % Consumers Concerned with Condition
21%
15%
16%
18%
21%
27%
Total Panel
Osteoporosis
Diabetes
Heart Problems
Cholesterol
Weight
Exercise Most DaysExercise Is An Important Part of Life
19%
14%
12%
11%
33%
CPG marketers are working collaboratively to improve exercise compliance.
Hannaford Bros., for example. in partnership with manufacturers including Kashi, Fresh Express and Dannon and local civic organizations, is actively sponsoring community events with a “healthy living” theme1.
Recently, the retailer partnered with a Maine-based YMCA for “Healthy Kids Day,” which included free samples of Kashi cereal and Dannon yogurt along with a wide range of exercise-focused activities.
Efforts such as these will drive awareness and understanding, while simultaneously bringing goodwill to Americans focused on raising the bar on healthy living.
HEALTHY LIVINGBACKGROUND
1 Supermarket News, May 4, 2009
10%
© Copyright 2009 Information Resources, Inc. All rights reserved.
Source: PricewaterhouseCoopers- Leveraging Growth in the Emerging Functional Foods Industry, August 2009
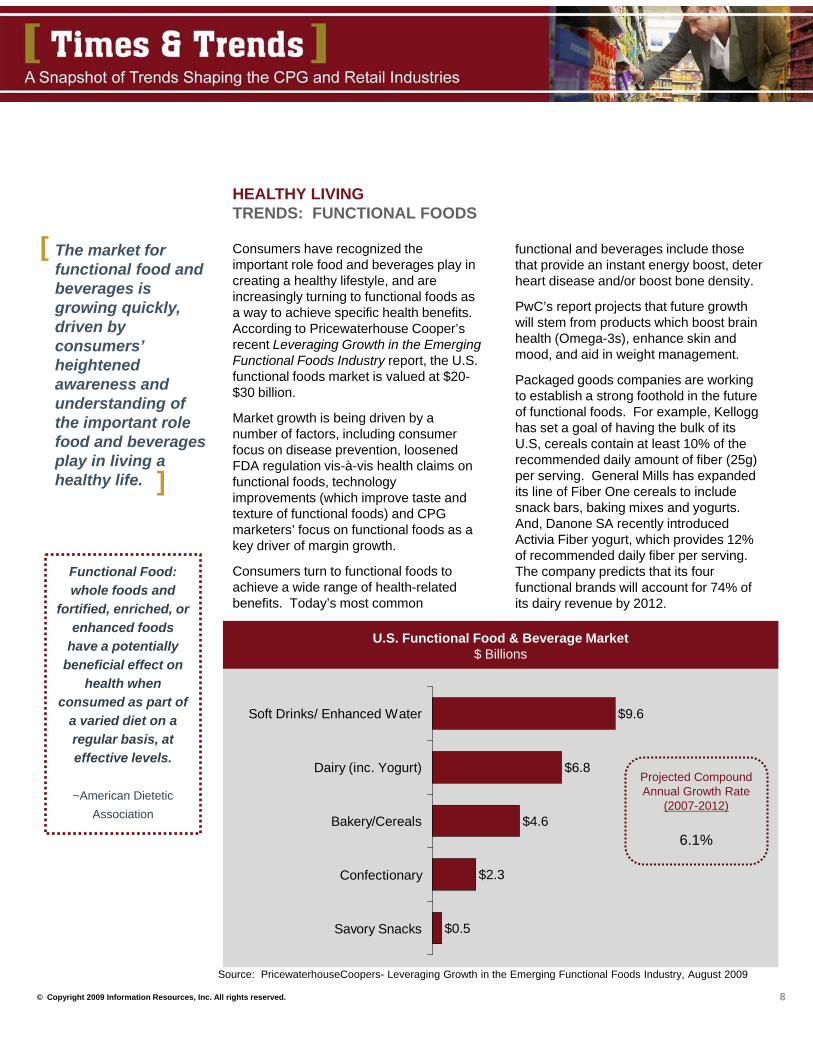
U.S. Functional Food & Beverage Market$ Billions
$0.5
$2.3
$4.6
$6.8
$9.6
Savory Snacks
Confectionary
Bakery/Cereals
Dairy (inc. Yogurt)
Soft Drinks/ Enhanced Water
Projected Compound Annual Growth Rate
(2007-2012)
6.1%
functional and beverages include those that provide an instant energy boost, deter heart disease and/or boost bone density.
PwC’s report projects that future growth will stem from products which boost brain health (Omega-3s), enhance skin and mood, and aid in weight management.
Packaged goods companies are working to establish a strong foothold in the future of functional foods. For example, Kellogg has set a goal of having the bulk of its U.S, cereals contain at least 10% of the recommended daily amount of fiber (25g) per serving. General Mills has expanded its line of Fiber One cereals to include snack bars, baking mixes and yogurts. And, Danone SA recently introduced Activia Fiber yogurt, which provides 12% of recommended daily fiber per serving. The company predicts that its four functional brands will account for 74% of its dairy revenue by 2012.
Consumers have recognized the important role food and beverages play in creating a healthy lifestyle, and are increasingly turning to functional foods as a way to achieve specific health benefits. According to Pricewaterhouse Cooper’s recent Leveraging Growth in the Emerging Functional Foods Industry report, the U.S. functional foods market is valued at $20-$30 billion.
Market growth is being driven by a number of factors, including consumer focus on disease prevention, loosened FDA regulation vis-à-vis health claims on functional foods, technology improvements (which improve taste and texture of functional foods) and CPG marketers’ focus on functional foods as a key driver of margin growth.
Consumers turn to functional foods to achieve a wide range of health-related benefits. Today’s most common
HEALTHY LIVINGTRENDS: FUNCTIONAL FOODS
The market for functional food and beverages is growing quickly, driven by consumers’ heightened awareness and understanding of the important role food and beverages play in living a healthy life.
[
]
Functional Food: whole foods and
fortified, enriched, or enhanced foods
have a potentially beneficial effect on
health when consumed as part of
a varied diet on a regular basis, at effective levels.
~American Dietetic Association
8
© Copyright 2009 Information Resources, Inc. All rights reserved. 9
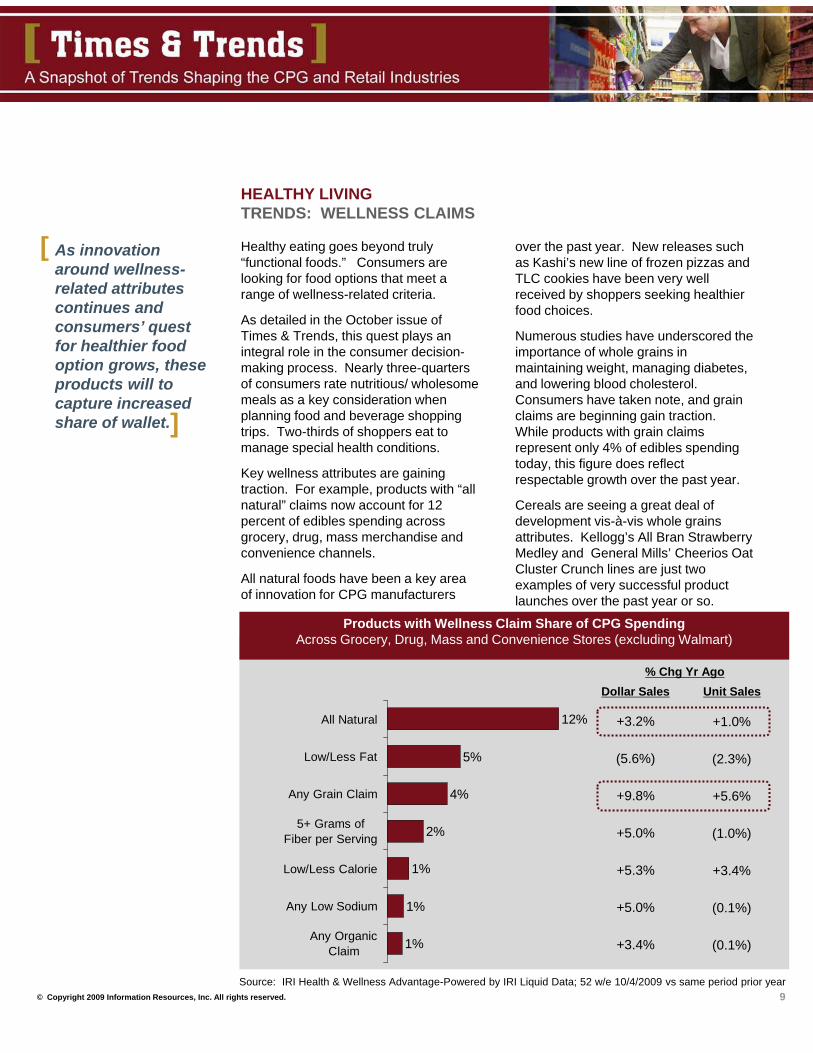
As innovation around wellness-related attributes continues and consumers’ quest for healthier food option grows, these products will to capture increased share of wallet.
[
]
HEALTHY LIVINGTRENDS: WELLNESS CLAIMS
Source: IRI Health & Wellness Advantage-Powered by IRI Liquid Data; 52 w/e 10/4/2009 vs same period prior year
Products with Wellness Claim Share of CPG SpendingAcross Grocery, Drug, Mass and Convenience Stores (excluding Walmart)
1%
1%
1%
2%
4%
5%
12%
Any OrganicClaim
Any Low Sodium
Low/Less Calorie
5+ Grams ofFiber per Serving
Any Grain Claim
Low/Less Fat
All Natural
% Chg Yr Ago
+3.2%
(5.6%)
+9.8%
+5.0%
+5.3%
+5.0%
+3.4%
Healthy eating goes beyond truly “functional foods.” Consumers are looking for food options that meet a range of wellness-related criteria.
As detailed in the October issue of Times & Trends, this quest plays an integral role in the consumer decision-making process. Nearly three-quarters of consumers rate nutritious/ wholesome meals as a key consideration when planning food and beverage shopping trips. Two-thirds of shoppers eat to manage special health conditions.
Key wellness attributes are gaining traction. For example, products with “all natural” claims now account for 12 percent of edibles spending across grocery, drug, mass merchandise and convenience channels.
All natural foods have been a key area of innovation for CPG manufacturers
over the past year. New releases such as Kashi’s new line of frozen pizzas and TLC cookies have been very well received by shoppers seeking healthier food choices.
Numerous studies have underscored the importance of whole grains in maintaining weight, managing diabetes, and lowering blood cholesterol. Consumers have taken note, and grain claims are beginning gain traction. While products with grain claims represent only 4% of edibles spending today, this figure does reflect respectable growth over the past year.
Cereals are seeing a great deal of development vis-à-vis whole grains attributes. Kellogg’s All Bran Strawberry Medley and General Mills’ Cheerios Oat Cluster Crunch lines are just two examples of very successful product launches over the past year or so.
Unit SalesDollar Sales
+1.0%
(2.3%)
+5.6%
(1.0%)
+3.4%
(0.1%)
(0.1%)
© Copyright 2009 Information Resources, Inc. All rights reserved.
6%
8%
8%
11%
20%
30%
49%
4%
6%
11%
23%
54%
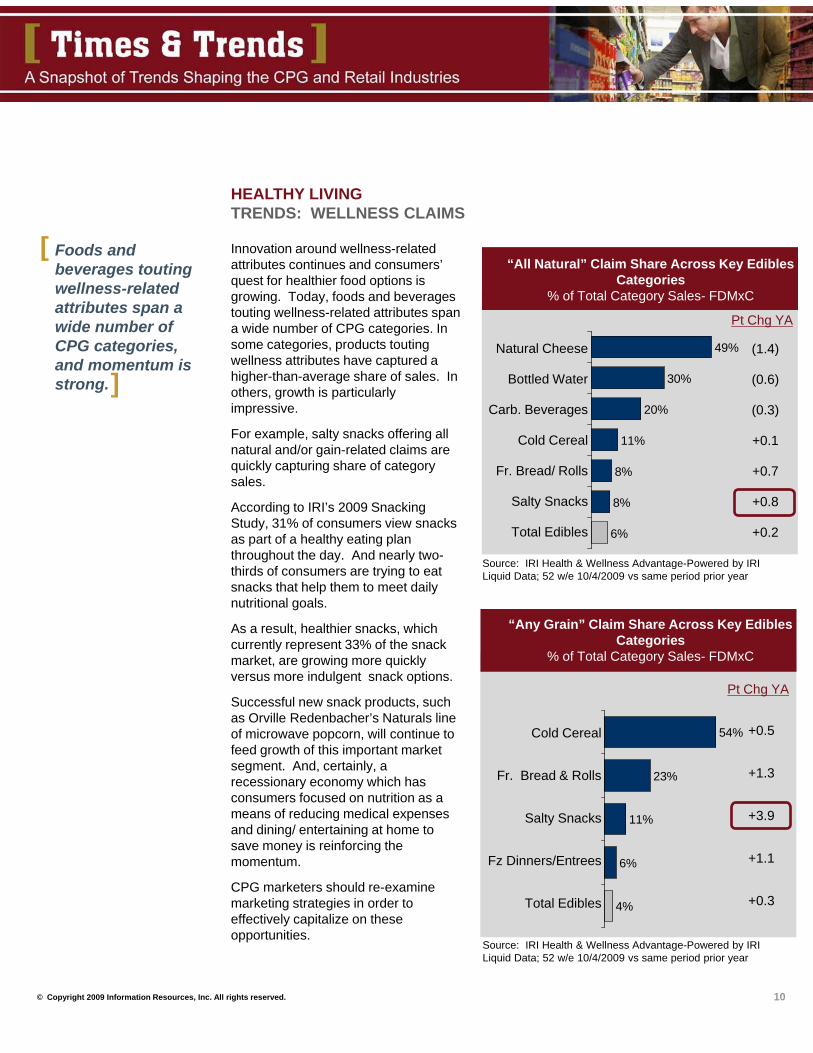
“Any Grain” Claim Share Across Key Edibles Categories
% of Total Category Sales- FDMxC
Natural Cheese
Bottled Water
Carb. Beverages
Cold Cereal
Fr. Bread/ Rolls
Salty Snacks
Total Edibles
“All Natural” Claim Share Across Key Edibles Categories
% of Total Category Sales- FDMxC
10
Innovation around wellness-related attributes continues and consumers’ quest for healthier food options is growing. Today, foods and beverages touting wellness-related attributes span a wide number of CPG categories. In some categories, products touting wellness attributes have captured a higher-than-average share of sales. In others, growth is particularly impressive.
For example, salty snacks offering all natural and/or gain-related claims are quickly capturing share of category sales.
According to IRI’s 2009 Snacking Study, 31% of consumers view snacks as part of a healthy eating plan throughout the day. And nearly two-thirds of consumers are trying to eat snacks that help them to meet daily nutritional goals.
As a result, healthier snacks, which currently represent 33% of the snack market, are growing more quickly versus more indulgent snack options.
Successful new snack products, such as Orville Redenbacher’s Naturals line of microwave popcorn, will continue to feed growth of this important market segment. And, certainly, a recessionary economy which has consumers focused on nutrition as a means of reducing medical expenses and dining/ entertaining at home to save money is reinforcing the momentum.
CPG marketers should re-examine marketing strategies in order to effectively capitalize on these opportunities.
Foods and beverages touting wellness-related attributes span a wide number of CPG categories, and momentum is strong.]
[
Cold Cereal
Fr. Bread & Rolls
Salty Snacks
Fz Dinners/Entrees
Total Edibles
(1.4)
(0.6)
(0.3)
+0.1
+0.7
+0.8
+0.2
Pt Chg YA
+0.5
+1.3
+3.9
+1.1
+0.3
Pt Chg YA
HEALTHY LIVINGTRENDS: WELLNESS CLAIMS
Source: IRI Health & Wellness Advantage-Powered by IRI Liquid Data; 52 w/e 10/4/2009 vs same period prior year
Source: IRI Health & Wellness Advantage-Powered by IRI Liquid Data; 52 w/e 10/4/2009 vs same period prior year
© Copyright 2009 Information Resources, Inc. All rights reserved.
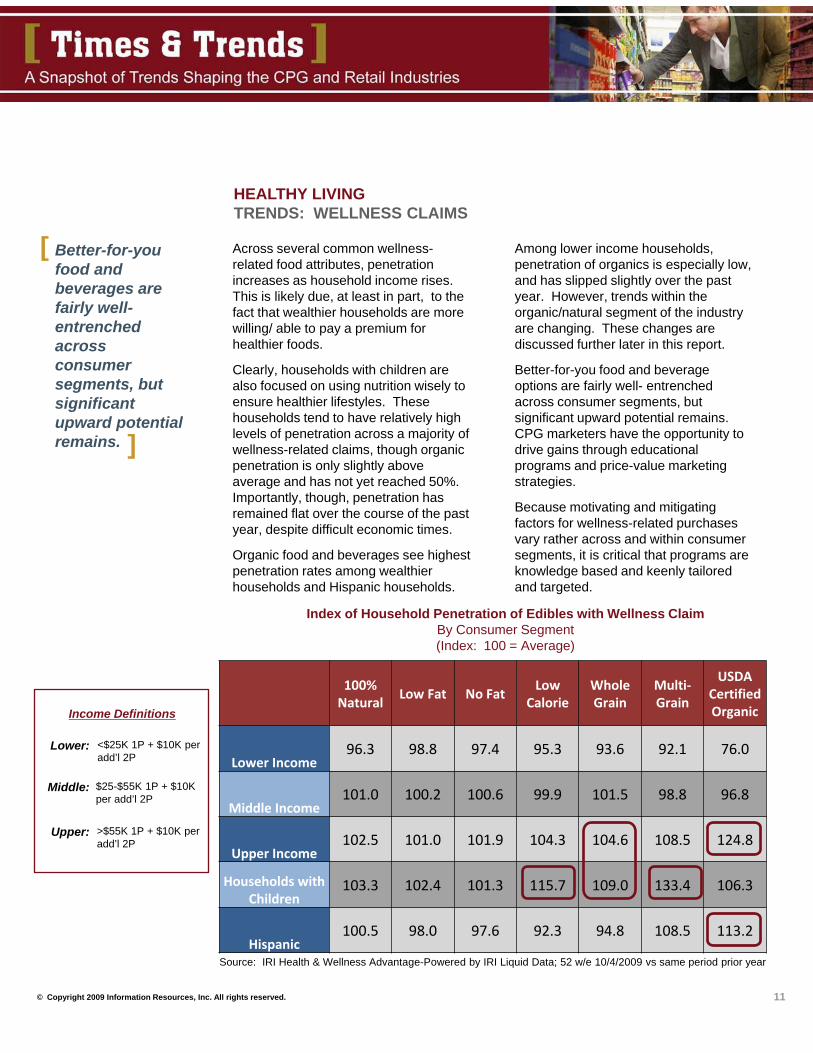
100% Natural
Low Fat No FatLow
CalorieWhole Grain
Multi-Grain
USDA Certified Organic
Lower Income96.3 98.8 97.4 95.3 93.6 92.1 76.0
Middle Income101.0 100.2 100.6 99.9 101.5 98.8 96.8
Upper Income102.5 101.0 101.9 104.3 104.6 108.5 124.8
Households with Children
103.3 102.4 101.3 115.7 109.0 133.4 106.3
Hispanic100.5 98.0 97.6 92.3 94.8 108.5 113.2
11
Across several common wellness-related food attributes, penetration increases as household income rises. This is likely due, at least in part, to the fact that wealthier households are more willing/ able to pay a premium for healthier foods.
Clearly, households with children are also focused on using nutrition wisely to ensure healthier lifestyles. These households tend to have relatively high levels of penetration across a majority of wellness-related claims, though organic penetration is only slightly above average and has not yet reached 50%. Importantly, though, penetration has remained flat over the course of the past year, despite difficult economic times.
Organic food and beverages see highest penetration rates among wealthier households and Hispanic households.
Better-for-you food and beverages are fairly well-entrenched across consumer segments, but significant upward potential remains. ]
[
Index of Household Penetration of Edibles with Wellness ClaimBy Consumer Segment(Index: 100 = Average)
Income Definitions
Lower: <$25K 1P + $10K per add’l 2P
Middle:
Upper:
$25-$55K 1P + $10K per add’l 2P
>$55K 1P + $10K per add’l 2P
Among lower income households, penetration of organics is especially low, and has slipped slightly over the past year. However, trends within the organic/natural segment of the industry are changing. These changes are discussed further later in this report.
Better-for-you food and beverage options are fairly well- entrenched across consumer segments, but significant upward potential remains. CPG marketers have the opportunity to drive gains through educational programs and price-value marketing strategies.
Because motivating and mitigating factors for wellness-related purchases vary rather across and within consumer segments, it is critical that programs are knowledge based and keenly tailored and targeted.
HEALTHY LIVINGTRENDS: WELLNESS CLAIMS
Source: IRI Health & Wellness Advantage-Powered by IRI Liquid Data; 52 w/e 10/4/2009 vs same period prior year
© Copyright 2009 Information Resources, Inc. All rights reserved.
One-third of
survey
respondents eat
organic foods on
a weekly basis.
~IRI MedProfiler VIII
12
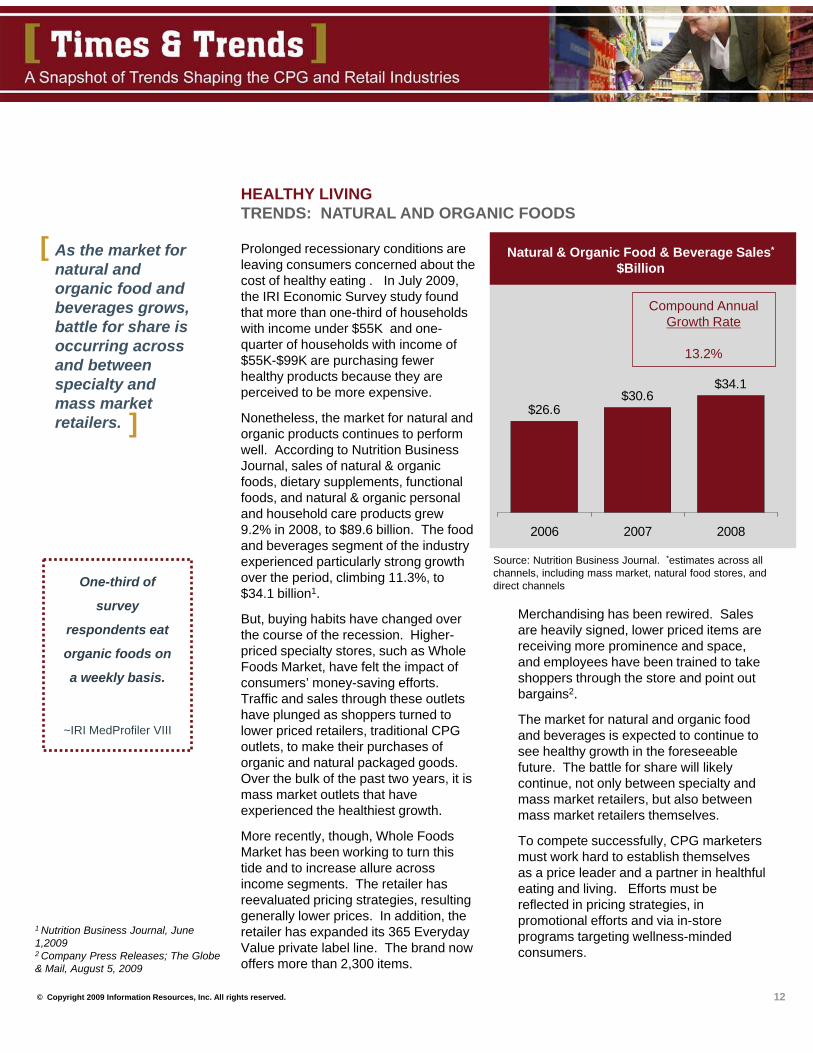
As the market for natural and organic food and beverages grows, battle for share is occurring across and between specialty and mass market retailers.
[
]
Prolonged recessionary conditions are leaving consumers concerned about the cost of healthy eating . In July 2009, the IRI Economic Survey study found that more than one-third of households with income under $55K and one-quarter of households with income of $55K-$99K are purchasing fewer healthy products because they are perceived to be more expensive.
Nonetheless, the market for natural and organic products continues to perform well. According to Nutrition Business Journal, sales of natural & organic foods, dietary supplements, functional foods, and natural & organic personal and household care products grew 9.2% in 2008, to $89.6 billion. The food and beverages segment of the industry experienced particularly strong growth over the period, climbing 11.3%, to $34.1 billion1.
But, buying habits have changed over the course of the recession. Higher-priced specialty stores, such as Whole Foods Market, have felt the impact of consumers’ money-saving efforts. Traffic and sales through these outlets have plunged as shoppers turned to lower priced retailers, traditional CPG outlets, to make their purchases of organic and natural packaged goods. Over the bulk of the past two years, it is mass market outlets that have experienced the healthiest growth.
More recently, though, Whole Foods Market has been working to turn this tide and to increase allure across income segments. The retailer has reevaluated pricing strategies, resulting generally lower prices. In addition, the retailer has expanded its 365 Everyday Value private label line. The brand now offers more than 2,300 items.
$26.6$30.6
$34.1
2006 2007 2008
Source: Nutrition Business Journal. *estimates across all channels, including mass market, natural food stores, and direct channels
Natural & Organic Food & Beverage Sales*
$Billion
Compound Annual Growth Rate
13.2%
HEALTHY LIVINGTRENDS: NATURAL AND ORGANIC FOODS
1 Nutrition Business Journal, June 1,20092 Company Press Releases; The Globe & Mail, August 5, 2009
Merchandising has been rewired. Sales are heavily signed, lower priced items are receiving more prominence and space, and employees have been trained to take shoppers through the store and point out bargains2.
The market for natural and organic food and beverages is expected to continue to see healthy growth in the foreseeable future. The battle for share will likely continue, not only between specialty and mass market retailers, but also between mass market retailers themselves.
To compete successfully, CPG marketers must work hard to establish themselves as a price leader and a partner in healthful eating and living. Efforts must be reflected in pricing strategies, in promotional efforts and via in-store programs targeting wellness-minded consumers.

© Copyright 2009 Information Resources, Inc. All rights reserved.
• One member households, income up to $19.9K
• Two or more member households, income up to $34.9K
• One member households, income $35K+
• Two or more member households, income $55K+
Income Segment Definitions
• One member households, income $20K - $34.9K
• Two or more member households, income $35K -$54.9K
Doing Well
Living Comfortably
13
For wealthier shoppers, vitamins are playing an important role in strategies developed to save money through disease prevention.
[ declines in multi-vitamins were offset by sizable gains in liquid vitamins/minerals and 1 & 2 letter vitamins.
While spending money on 1 & 2 letter vitamins is fairly consistent across income segments, much of the activity in liquid vitamins/ minerals stems from wealthier shoppers. This is one example of the correlation between income and the propensity to purchase vitamins, and it is likely driven by the “trading down” effect. Lower earning households may have eliminated or reduced vitamin purchases in effort to save money, while wealthier shoppers are more heavily purchasing vitamins as a part of their prevention strategies.
]
HEALTHY LIVINGTRENDS: VITAMINS
As detailed in the January issue of Times & Trends, consumers are reprioritizing their CPG spending. While spending on food, beauty products and health care products cannot be eliminated, it has been reduced. On the whole, CPG unit sales slipped 2.1% in 2008, with declined cutting across departments.
Declines across the healthcare department were less drastic than those seen in other departments, down 1.9% versus prior year. But, in fact, vitamins have shown strong performance over the course of the recession, bolstered by consumers’ increased focus on self-care as a means of saving money.
Unit sales of vitamins increased two percent over the past year. Slight
Vitamin TrendsCategory Growth and Purchase Propensity
3.6%
2.0%
8.6%
20.3%
1.6%
4.8%
2.0%
6.7%
-3.3%
6.2%
2.4%
6.0%
200920082007
Source: IRI Consumer Network™; 52 weeks ending 10/11/2009 and same period prior year
% Growth vs YAPurchase Propensity by Income; Index (Avg= 100)
Getting By Living Comfortably Doing WellUnit Sales
87
104
94
70
97
100
100
101
108
98
103
116Liquid Vitamins/ Minerals
Mineral Supplements
1 & 2 Letter Vitamins
Multi-Vitamins
Getting By
© Copyright 2009 Information Resources, Inc. All rights reserved. 14
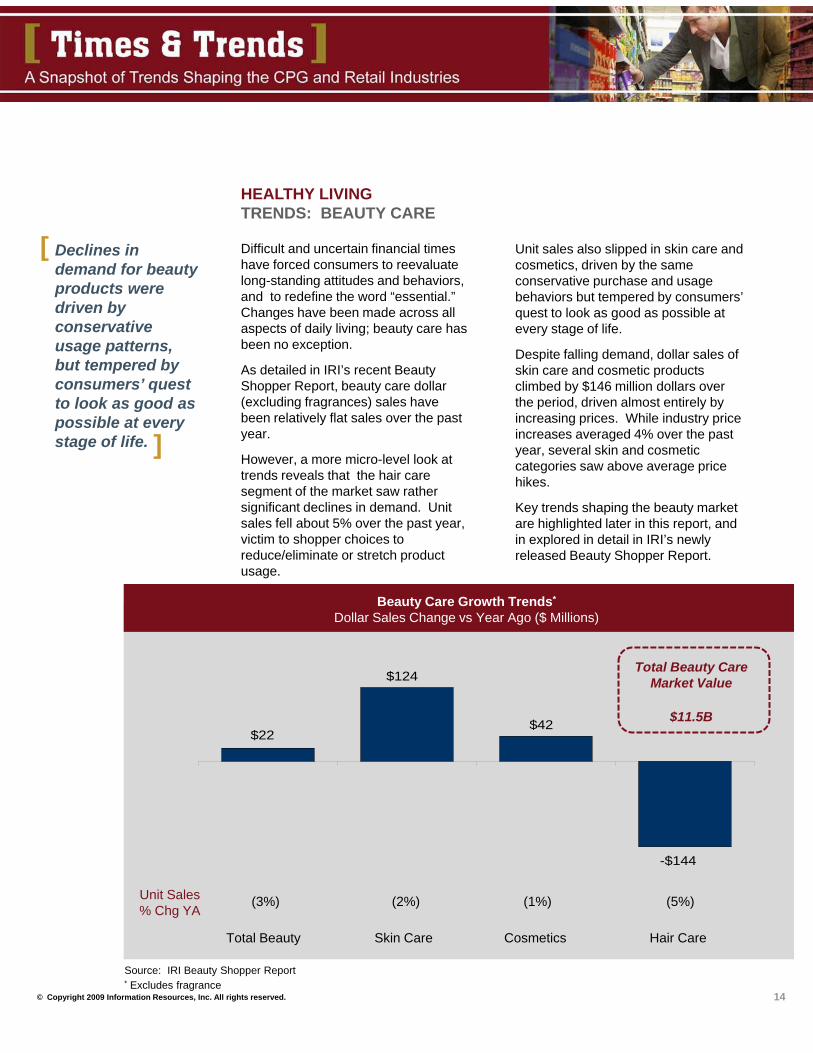
Declines in demand for beauty products were driven by conservative usage patterns, but tempered by consumers’ quest to look as good as possible at every stage of life.
[ Unit sales also slipped in skin care and cosmetics, driven by the same conservative purchase and usage behaviors but tempered by consumers’ quest to look as good as possible at every stage of life.
Despite falling demand, dollar sales of skin care and cosmetic products climbed by $146 million dollars over the period, driven almost entirely by increasing prices. While industry price increases averaged 4% over the past year, several skin and cosmetic categories saw above average price hikes.
Key trends shaping the beauty market are highlighted later in this report, and in explored in detail in IRI’s newly released Beauty Shopper Report.
]
HEALTHY LIVINGTRENDS: BEAUTY CARE
Difficult and uncertain financial times have forced consumers to reevaluate long-standing attitudes and behaviors, and to redefine the word “essential.” Changes have been made across all aspects of daily living; beauty care has been no exception.
As detailed in IRI’s recent Beauty Shopper Report, beauty care dollar (excluding fragrances) sales have been relatively flat sales over the past year.
However, a more micro-level look at trends reveals that the hair care segment of the market saw rather significant declines in demand. Unit sales fell about 5% over the past year, victim to shopper choices to reduce/eliminate or stretch product usage.
Beauty Care Growth Trends*
Dollar Sales Change vs Year Ago ($ Millions)
Source: IRI Beauty Shopper Report
$22
$124
$42
-$144
Total Beauty Skin Care Cosmetics Hair Care
Total Beauty Care Market Value
$11.5B
* Excludes fragrance
Unit Sales% Chg YA
(3%) (2%) (1%) (5%)
© Copyright 2009 Information Resources, Inc. All rights reserved.
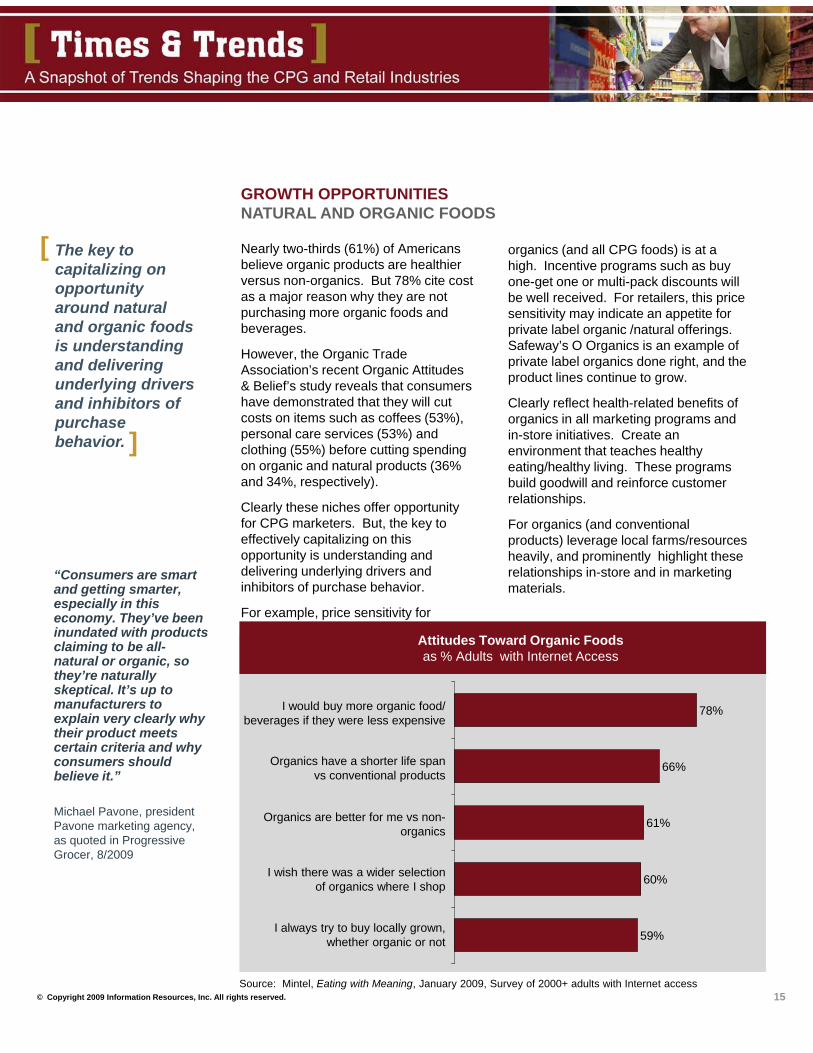
GROWTH OPPORTUNITIESNATURAL AND ORGANIC FOODS
Source: Mintel, Eating with Meaning, January 2009, Survey of 2000+ adults with Internet access
Attitudes Toward Organic Foodsas % Adults with Internet Access
59%
60%
61%
66%
78%I would buy more organic food/ beverages if they were less expensive
Organics have a shorter life span vs conventional products
Organics are better for me vs non-organics
I wish there was a wider selection of organics where I shop
I always try to buy locally grown, whether organic or not
Nearly two-thirds (61%) of Americans believe organic products are healthier versus non-organics. But 78% cite cost as a major reason why they are not purchasing more organic foods and beverages.
However, the Organic Trade Association’s recent Organic Attitudes & Belief’s study reveals that consumers have demonstrated that they will cut costs on items such as coffees (53%), personal care services (53%) and clothing (55%) before cutting spending on organic and natural products (36% and 34%, respectively).
Clearly these niches offer opportunity for CPG marketers. But, the key to effectively capitalizing on this opportunity is understanding and delivering underlying drivers and inhibitors of purchase behavior.
For example, price sensitivity for
organics (and all CPG foods) is at a high. Incentive programs such as buy one-get one or multi-pack discounts will be well received. For retailers, this price sensitivity may indicate an appetite for private label organic /natural offerings. Safeway’s O Organics is an example of private label organics done right, and the product lines continue to grow.
Clearly reflect health-related benefits of organics in all marketing programs and in-store initiatives. Create an environment that teaches healthy eating/healthy living. These programs build goodwill and reinforce customer relationships.
For organics (and conventional products) leverage local farms/resources heavily, and prominently highlight these relationships in-store and in marketing materials.
“Consumers are smart and getting smarter, especially in this economy. They’ve been inundated with products claiming to be all-natural or organic, so they’re naturally skeptical. It’s up to manufacturers to explain very clearly why their product meets certain criteria and why consumers should believe it.”
Michael Pavone, president Pavone marketing agency, as quoted in Progressive Grocer, 8/2009
15
The key to capitalizing on opportunity around natural and organic foods is understanding and delivering underlying drivers and inhibitors of purchase behavior.
[
]
© Copyright 2009 Information Resources, Inc. All rights reserved. 16
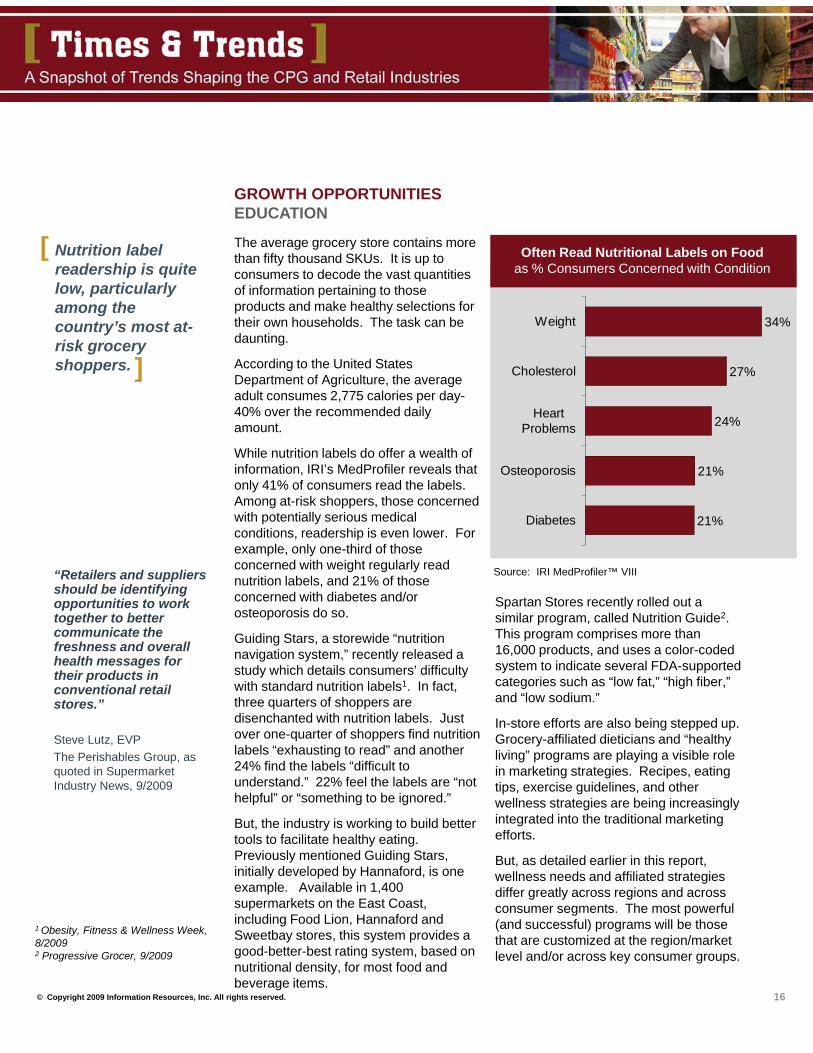
Nutrition label readership is quite low, particularly among the country’s most at-risk grocery shoppers.
[
]
GROWTH OPPORTUNITIESEDUCATION
The average grocery store contains more than fifty thousand SKUs. It is up to consumers to decode the vast quantities of information pertaining to those products and make healthy selections for their own households. The task can be daunting.
According to the United States Department of Agriculture, the average adult consumes 2,775 calories per day-40% over the recommended daily amount.
While nutrition labels do offer a wealth of information, IRI’s MedProfiler reveals that only 41% of consumers read the labels. Among at-risk shoppers, those concerned with potentially serious medical conditions, readership is even lower. For example, only one-third of those concerned with weight regularly read nutrition labels, and 21% of those concerned with diabetes and/or osteoporosis do so.
Guiding Stars, a storewide “nutrition navigation system,” recently released a study which details consumers’ difficulty with standard nutrition labels1. In fact, three quarters of shoppers are disenchanted with nutrition labels. Just over one-quarter of shoppers find nutrition labels “exhausting to read” and another 24% find the labels “difficult to understand.” 22% feel the labels are “not helpful” or “something to be ignored.”
But, the industry is working to build better tools to facilitate healthy eating. Previously mentioned Guiding Stars, initially developed by Hannaford, is one example. Available in 1,400 supermarkets on the East Coast, including Food Lion, Hannaford and Sweetbay stores, this system provides a good-better-best rating system, based on nutritional density, for most food and beverage items.
Source: IRI MedProfiler™ VIII
Often Read Nutritional Labels on Foodas % Consumers Concerned with Condition
21%
21%
24%
27%
34%
Diabetes
Osteoporosis
HeartProblems
Cholesterol
Weight
“Retailers and suppliers should be identifying opportunities to work together to better communicate the freshness and overall health messages for their products in conventional retail stores.”
Steve Lutz, EVPThe Perishables Group, as quoted in Supermarket Industry News, 9/2009
1 Obesity, Fitness & Wellness Week, 8/20092 Progressive Grocer, 9/2009
Spartan Stores recently rolled out a similar program, called Nutrition Guide2. This program comprises more than 16,000 products, and uses a color-coded system to indicate several FDA-supported categories such as “low fat,” “high fiber,” and “low sodium.”
In-store efforts are also being stepped up. Grocery-affiliated dieticians and “healthy living” programs are playing a visible role in marketing strategies. Recipes, eating tips, exercise guidelines, and other wellness strategies are being increasingly integrated into the traditional marketing efforts.
But, as detailed earlier in this report, wellness needs and affiliated strategies differ greatly across regions and across consumer segments. The most powerful (and successful) programs will be those that are customized at the region/market level and/or across key consumer groups.
© Copyright 2009 Information Resources, Inc. All rights reserved. 17
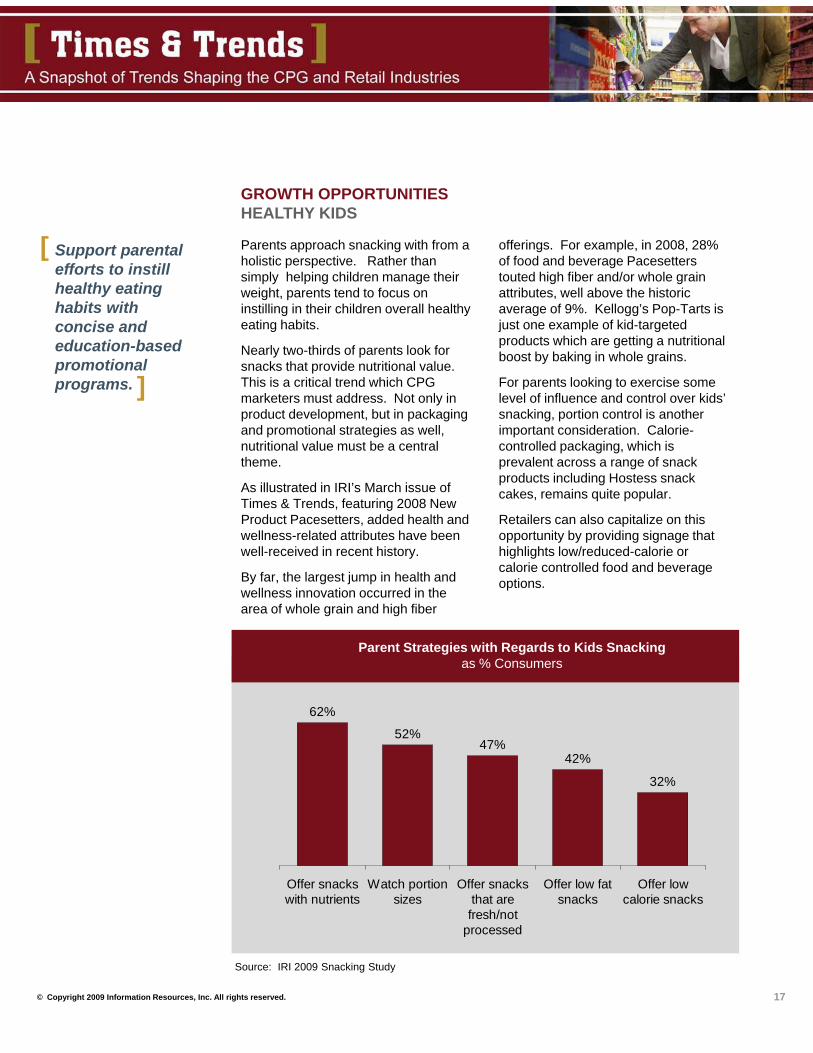
Support parental efforts to instill healthy eating habits with concise and education-based promotional programs.
[
]
GROWTH OPPORTUNITIESHEALTHY KIDS
Parents approach snacking with from a holistic perspective. Rather than simply helping children manage their weight, parents tend to focus on instilling in their children overall healthy eating habits.
Nearly two-thirds of parents look for snacks that provide nutritional value. This is a critical trend which CPG marketers must address. Not only in product development, but in packaging and promotional strategies as well, nutritional value must be a central theme.
As illustrated in IRI’s March issue of Times & Trends, featuring 2008 New Product Pacesetters, added health and wellness-related attributes have been well-received in recent history.
By far, the largest jump in health and wellness innovation occurred in the area of whole grain and high fiber
Source: IRI 2009 Snacking Study
Parent Strategies with Regards to Kids Snackingas % Consumers
62%
52%47%
42%
32%
Offer snackswith nutrients
Watch portionsizes
Offer snacksthat arefresh/not
processed
Offer low fatsnacks
Offer lowcalorie snacks
offerings. For example, in 2008, 28% of food and beverage Pacesetters touted high fiber and/or whole grain attributes, well above the historic average of 9%. Kellogg’s Pop-Tarts is just one example of kid-targeted products which are getting a nutritional boost by baking in whole grains.
For parents looking to exercise some level of influence and control over kids’ snacking, portion control is another important consideration. Calorie-controlled packaging, which is prevalent across a range of snack products including Hostess snack cakes, remains quite popular.
Retailers can also capitalize on this opportunity by providing signage that highlights low/reduced-calorie or calorie controlled food and beverage options.
© Copyright 2009 Information Resources, Inc. All rights reserved. 18
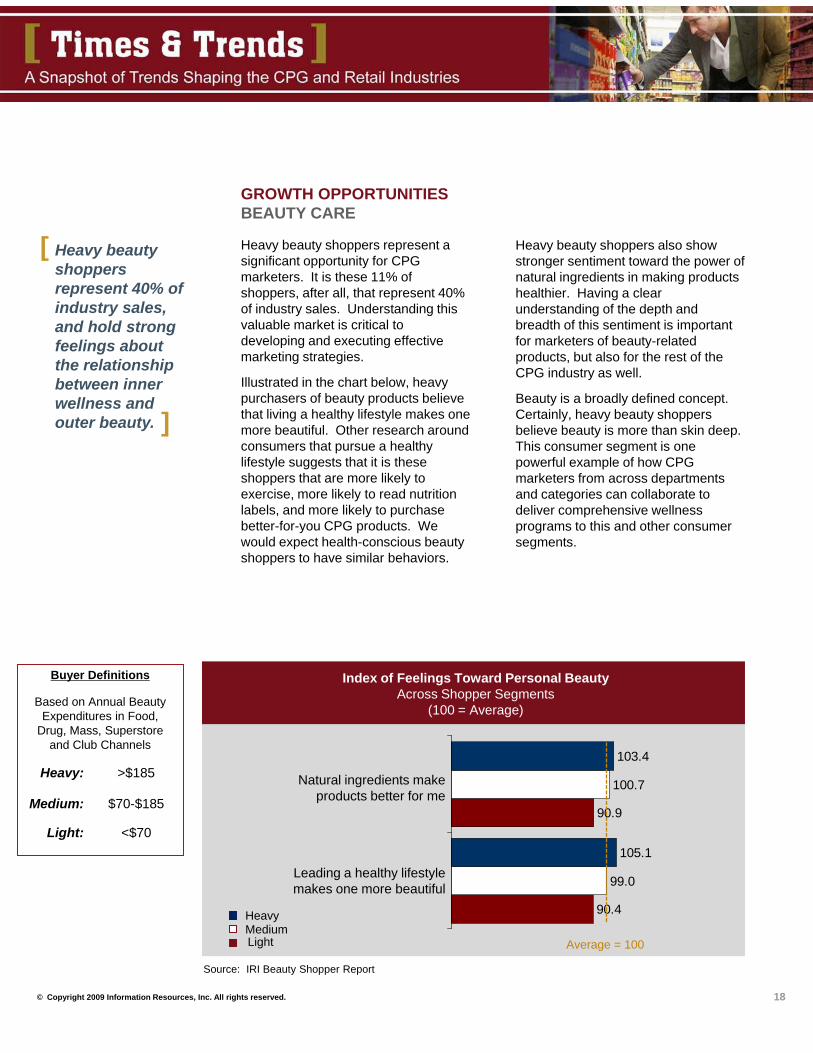
Heavy beauty shoppers represent 40% of industry sales, and hold strong feelings about the relationship between inner wellness and outer beauty.
[
]
GROWTH OPPORTUNITIESBEAUTY CARE
Heavy beauty shoppers represent a significant opportunity for CPG marketers. It is these 11% of shoppers, after all, that represent 40% of industry sales. Understanding this valuable market is critical to developing and executing effective marketing strategies.
Illustrated in the chart below, heavy purchasers of beauty products believe that living a healthy lifestyle makes one more beautiful. Other research around consumers that pursue a healthy lifestyle suggests that it is these shoppers that are more likely to exercise, more likely to read nutrition labels, and more likely to purchase better-for-you CPG products. We would expect health-conscious beauty shoppers to have similar behaviors.
90.4
90.9
99.0
100.7
105.1
103.4
Natural ingredients make products better for me
Index of Feelings Toward Personal BeautyAcross Shopper Segments
(100 = Average)
Source: IRI Beauty Shopper Report
Leading a healthy lifestyle makes one more beautiful
Heavy:
Medium:
Light:
>$185
$70-$185
<$70
Buyer Definitions
Based on Annual Beauty Expenditures in Food,
Drug, Mass, Superstore and Club Channels
HeavyMediumLight Average = 100
Heavy beauty shoppers also show stronger sentiment toward the power of natural ingredients in making products healthier. Having a clear understanding of the depth and breadth of this sentiment is important for marketers of beauty-related products, but also for the rest of the CPG industry as well.
Beauty is a broadly defined concept. Certainly, heavy beauty shoppers believe beauty is more than skin deep. This consumer segment is one powerful example of how CPG marketers from across departments and categories can collaborate to deliver comprehensive wellness programs to this and other consumer segments.
© Copyright 2009 Information Resources, Inc. All rights reserved. 19
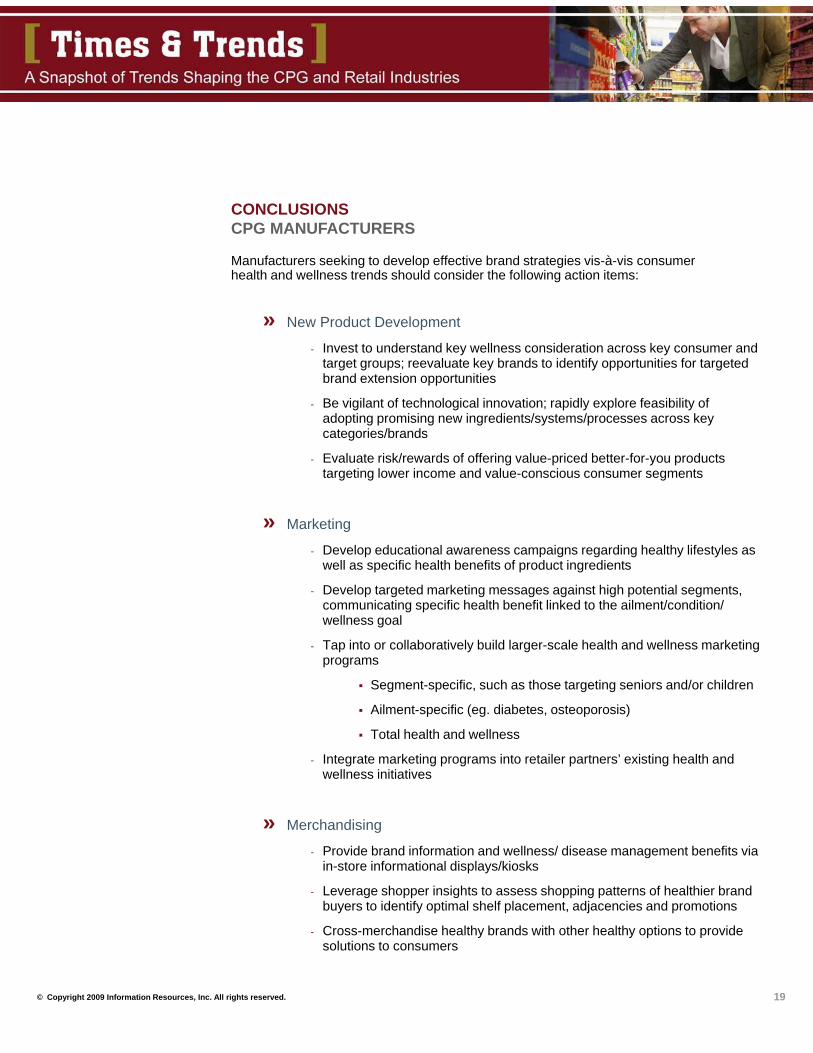
» New Product Development
- Invest to understand key wellness consideration across key consumer and target groups; reevaluate key brands to identify opportunities for targeted brand extension opportunities
- Be vigilant of technological innovation; rapidly explore feasibility of adopting promising new ingredients/systems/processes across key categories/brands
- Evaluate risk/rewards of offering value-priced better-for-you products targeting lower income and value-conscious consumer segments
» Marketing
- Develop educational awareness campaigns regarding healthy lifestyles as well as specific health benefits of product ingredients
- Develop targeted marketing messages against high potential segments, communicating specific health benefit linked to the ailment/condition/ wellness goal
- Tap into or collaboratively build larger-scale health and wellness marketing programs
Segment-specific, such as those targeting seniors and/or children
Ailment-specific (eg. diabetes, osteoporosis)
Total health and wellness
- Integrate marketing programs into retailer partners’ existing health and wellness initiatives
» Merchandising
- Provide brand information and wellness/ disease management benefits via in-store informational displays/kiosks
- Leverage shopper insights to assess shopping patterns of healthier brand buyers to identify optimal shelf placement, adjacencies and promotions
- Cross-merchandise healthy brands with other healthy options to provide solutions to consumers
CONCLUSIONS CPG MANUFACTURERS
Manufacturers seeking to develop effective brand strategies vis-à-vis consumer health and wellness trends should consider the following action items:
© Copyright 2009 Information Resources, Inc. All rights reserved. 20
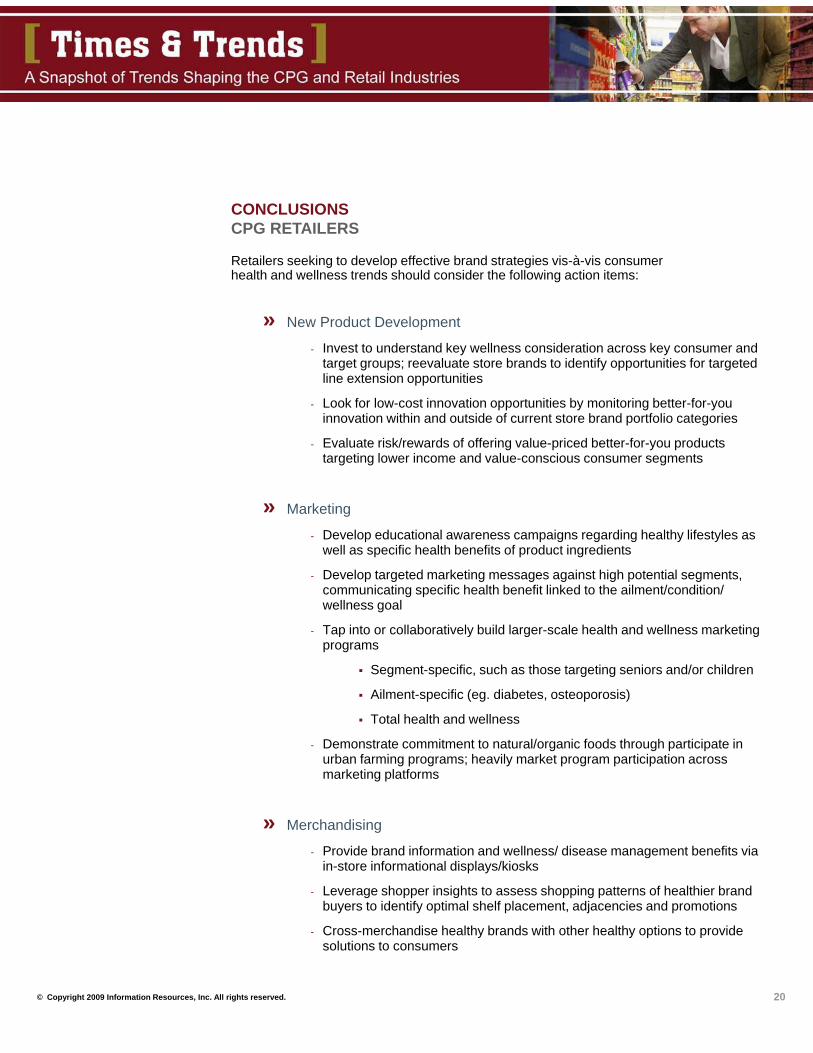
» New Product Development
- Invest to understand key wellness consideration across key consumer and target groups; reevaluate store brands to identify opportunities for targeted line extension opportunities
- Look for low-cost innovation opportunities by monitoring better-for-you innovation within and outside of current store brand portfolio categories
- Evaluate risk/rewards of offering value-priced better-for-you products targeting lower income and value-conscious consumer segments
» Marketing
- Develop educational awareness campaigns regarding healthy lifestyles as well as specific health benefits of product ingredients
- Develop targeted marketing messages against high potential segments, communicating specific health benefit linked to the ailment/condition/ wellness goal
- Tap into or collaboratively build larger-scale health and wellness marketing programs
Segment-specific, such as those targeting seniors and/or children
Ailment-specific (eg. diabetes, osteoporosis)
Total health and wellness
- Demonstrate commitment to natural/organic foods through participate in urban farming programs; heavily market program participation across marketing platforms
» Merchandising
- Provide brand information and wellness/ disease management benefits via in-store informational displays/kiosks
- Leverage shopper insights to assess shopping patterns of healthier brand buyers to identify optimal shelf placement, adjacencies and promotions
- Cross-merchandise healthy brands with other healthy options to provide solutions to consumers
CONCLUSIONS CPG RETAILERS
Retailers seeking to develop effective brand strategies vis-à-vis consumer health and wellness trends should consider the following action items:
© Copyright 2009 Information Resources, Inc. All rights reserved. 21
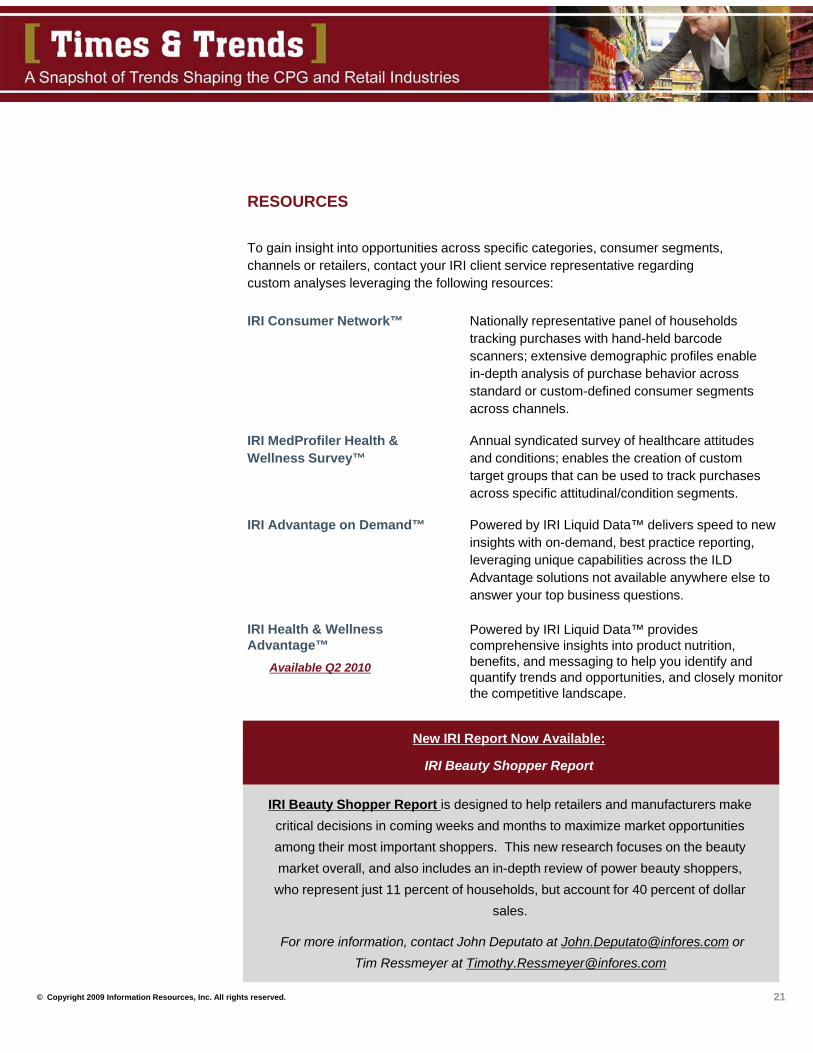
RESOURCES
To gain insight into opportunities across specific categories, consumer segments, channels or retailers, contact your IRI client service representative regarding custom analyses leveraging the following resources:
IRI Advantage on Demand™ Powered by IRI Liquid Data™ delivers speed to new insights with on-demand, best practice reporting, leveraging unique capabilities across the ILD Advantage solutions not available anywhere else to answer your top business questions.
IRI Health & Wellness Advantage™
Powered by IRI Liquid Data™ provides comprehensive insights into product nutrition, benefits, and messaging to help you identify and quantify trends and opportunities, and closely monitor the competitive landscape.
IRI Consumer Network™ Nationally representative panel of households tracking purchases with hand-held barcode scanners; extensive demographic profiles enable in-depth analysis of purchase behavior across standard or custom-defined consumer segments across channels.
IRI MedProfiler Health & Wellness Survey™
Annual syndicated survey of healthcare attitudes and conditions; enables the creation of custom target groups that can be used to track purchases across specific attitudinal/condition segments.
Available Q2 2010
New IRI Report Now Available:
IRI Beauty Shopper Report
IRI Beauty Shopper Report is designed to help retailers and manufacturers make critical decisions in coming weeks and months to maximize market opportunities among their most important shoppers. This new research focuses on the beauty market overall, and also includes an in-depth review of power beauty shoppers,
who represent just 11 percent of households, but account for 40 percent of dollar sales.
For more information, contact John Deputato at [email protected] or Tim Ressmeyer at [email protected]
© Copyright 2009 Information Resources, Inc. All rights reserved. 22
>>> MORE INFORMATIONPlease contact Susan Viamari at [email protected] with
questions or comments about this report.
About IRIIRI is the world’s leading provider of
consumer, shopper, and retail market intelligence and insights supporting 95
percent of the FORTUNE Global 500 consumer packaged goods (CPG), retail
and healthcare companies. Only IRI offers the unique combination of integrated market information, automated and
predictive analytics, innovative enabling technologies, and domain expertise. With
IRI, leading retailers and manufacturers are able to quickly discover breakthrough insights driving smarter decisions and
actions across the enterprise for breakthrough results. Companies around
the world depend on IRI for improved productivity, stronger brands, and dramatic revenue growth. For more information, visit
http://us.infores.com
CORPORATE HEADQUARTERS:150 NORTH CLINTON STREET
CHICAGO, IL 60661Telephone: +1 312 726 1221
WWW.INFORES.COM