health & quality of life in urban areas - ectp-ceu and quality of life... · health &...
TRANSCRIPT
HEALTH & QUALITY OF LIFE IN
URBAN AREAS
The research leading to these results has received funding from the
European Union's Seventh Framework Programme [FP7/2007-2013] under
grant agreement n 282679. This report forms project deliverable 3.1
WP3

URBAN-NEXUS WP3 Synthesis Report. Health and Quality of Life
Page 1 of 66
URBAN-NEXUS WP3 Synthesis Report. Health and Quality of Life
Page 2 of 66
Contents
1 ABOUT THIS REPORT .................................................................................................................. 4
1.1 Audience ................................................................................................................................................. 4
1.2 Purpose of the report .............................................................................................................................. 4
1.3 Report preparation .................................................................................................................................. 4
1.4 Use of terms ............................................................................................................................................ 5
1.5 Questions for the dialogue café ............................................................................................................... 5
1.6 Acknowledgments ................................................................................................................................... 5
2 KEY FINDINGS ................................................................................................................................ 6
3 AN OVERVIEW OF HEALTH AND QUALITY OF LIFE ........................................................... 8
3.1 The challenge of urban health and quality of life ..................................................................................... 8
3.2 Concept definitions: health, quality of life, urban areas ........................................................................ 11
3.3 H&QoL in the context of Urban Nexus ................................................................................................... 12
3.3.1 Competing for urban land ........................................................................................................................ 14
3.3.2 Urban climate resilience ........................................................................................................................... 16
4 EVIDENCE FROM RESEARCH AND PRACTICE INFLUENCING PEOPLE’S HEALTH . 19
4.1 Environmental stressors and alleviators ................................................................................................ 19
4.1.1 Urban place and environmental stressors ................................................................................................ 19
4.1.1.1 Air pollution ..................................................................................................................................... 22
4.1.1.2 Noise pollution ................................................................................................................................. 27
4.1.1.3 Combined effects of noise and air pollution in relation to health ................................................... 30
4.1.1.4 Electromagnetic pollution................................................................................................................ 31
4.1.1.5 Allergies ........................................................................................................................................... 32
4.1.2 Green infrastructures and utilization of public spaces ............................................................................. 32
4.1.2.1 Green infrastructures for a good urban environment ..................................................................... 32
4.1.2.2 The use of public spaces, including the green urban areas ............................................................. 37
4.2 Socio-economic and cultural stressors and alleviators ........................................................................... 38
4.2.1 Social equity, inequality, and vulnerable groups ...................................................................................... 38
4.2.2 Gender issues ........................................................................................................................................... 43
4.2.3 Biogeographic and cultural specificities ................................................................................................... 44
4.3 Urban structure and urban management types ..................................................................................... 45
4.3.1 Shaping cities for health and quality of life .............................................................................................. 45
4.3.2 Sustainable management and good governance ..................................................................................... 50
URBAN-NEXUS WP3 Synthesis Report. Health and Quality of Life
Page 3 of 66
4.3.3 Sustainable urban mobility and transport ................................................................................................ 52
4.3.4 Urban structure and built environment ................................................................................................... 56
5 ABOUT URBAN NEXUS .............................................................................................................. 59
6 REFERENCES ................................................................................................................................ 61

URBAN-NEXUS WP3 Synthesis Report. Health and Quality of Life
Page 4 of 66
1 About this report
1.1 Audience
This is the second in a series of Synthesis Reports (SR) produced by URBAN-NEXUS. These Reports are
intended mainly for municipalities, policy-makers and businesses engaged in urban issues, but may also
be of interest to organisations, institutions and networks involved - or needing to be involved - in
decision-making and developing partnerships to tackle problems encountered in urban sustainable
development and management. This includes public sector agencies, utilities, the private sector, civil
society organisations and community groups.
1.2 Purpose of the report
The SR will help inform debate and discussion as part of an ongoing “structured dialogue” across a
network of urban researchers, professionals and actors on developing integrated approaches to the
challenges and opportunities of sustainable urban development. The main forum for supporting a rich
exchange and learning environment will be a series of “dialogue cafés” held in different European cities
during the project duration. These will encourage participants to identify and prioritise common issues
and develop partnerships to help promote and deliver innovative, effective and integrated responses to
improving urban sustainability.
Each Synthesis Report (SR) of the Urban Nexus project will address a different theme; and this one is
highlighting the importance and urgency of integrating health and quality of life in urban areas.
Discussions on the outcomes presented in this report will be held at the second URBAN-NEXUS
Dialogue Café, to be held on the 17th and 18th October 2012 in Barcelona. The discussions will form a
follow-up report at the beginning of 2013, feeding into subsequent thematic synthesis reports on land-
use, urban governance, and data and monitoring. This will engender an evolving dialogue and foster
integrated approaches to urban sustainability that become intrinsic to decision-making processes and
partnership activity.
The SR on Urban Climate Resilience of the URBAN-NEXUS project was presented and discussed in
Glasgow, in May 2012, during the first dialogue café, and its outcomes and results can be consulted at
www.urban-nexus.eu/.
1.3 Report preparation
Health and quality of life in urban areas was identified as a priority research area by URBAN-NET (EU
predecessor research project of URBAN-NEXUS) within a strategic research framework for sustainable
urban development. The URBAN-NET study was based on partners’ collective knowledge and evidence
pooled from across Europe as part of a comparative assessment of national and regional research
programmes.
This report considers research, mainly European, background material from a variety of sources
including existing research evidence, case studies from cities and projects results undertaken at EU
level. The information was collected from the URBAN-NEXUS consortium, the strategic partners and a
wider network of contacts.
URBAN-NEXUS WP3 Synthesis Report. Health and Quality of Life
Page 5 of 66
This report should serve as basis to inform an evolving dialogue, fostering integrated approaches to
urban sustainability that become intrinsic to all decision-making processes and partnership activities
related to health and quality of life , and linking it with the other priority research areas being
addressed in the URBAN-NEXUS project. The Dialogue Café related to this research area will continue
this process and the outputs will be collected in a Follow-up Report.
1.4 Use of terms
For ease of reading, the terms “urban area” and “city” are used interchangeably throughout this report
and no specific distinction is drawn between either term with regard to distinct morphologies or
administrative boundaries. “Well-being” (the state of feeling healthy and happy) and “welfare”
(physical and mental health and happiness, especially of a person) are used as synonyms in this report.
Section 3.2 provides a detailed glossary for the main terms used in this report.
1.5 Questions for the dialogue café
In preparation for the URBAN-NEXUS Dialogue Café on ‘Health and Quality of life’, being held 17th and
18th October 2012 in Barcelona, we would like delegates to consider the following main questions
(Other more specific questions can be found at the beginning of each chapter);
‒ Which policies have influence on people’s health in urban areas?
‒ Are health and environmental aspects included in early stages of policy planning, with the
objective to reinforce and strengthen the collaboration at all levels?
‒ Which social aspects can be linked to urban planning, design and management of urban areas?
‒ What evidence shows the influence between environmental stressors, such as air quality or
noise pollution, and urban morphological aspects?
‒ To what extent does current urban planning includes health aspects? (E.g. how to integrate
health and strategic spatial planning, like transport infrastructure?)
‒ What are the spatial planning conditions of a determined neighbourhood that could determine
a healthy local environment?
‒ Is people’s quality of life influenced by urban patterns and flows?
‒ Are there tools to measure positive health effects of biodiversity and the natural environment
to promote healthy urban design (“Green cities”)?
‒ What kind of information is needed to evaluate an efficient management of urban areas
including health policy actions?
1.6 Acknowledgments
The authors would like to thank everyone who contributed case study material.
Núria Blanes, Miquel Sáinz , Roger Milego, Raquel Ubach (Researchers). Paul Sizeland and Jaume Fons
(Reviewers).
UAB - Universitat Autonoma de Barcelona, October 2012 (on behalf of URBAN-NEXUS).
URBAN-NEXUS WP3 Synthesis Report. Health and Quality of Life
Page 6 of 66
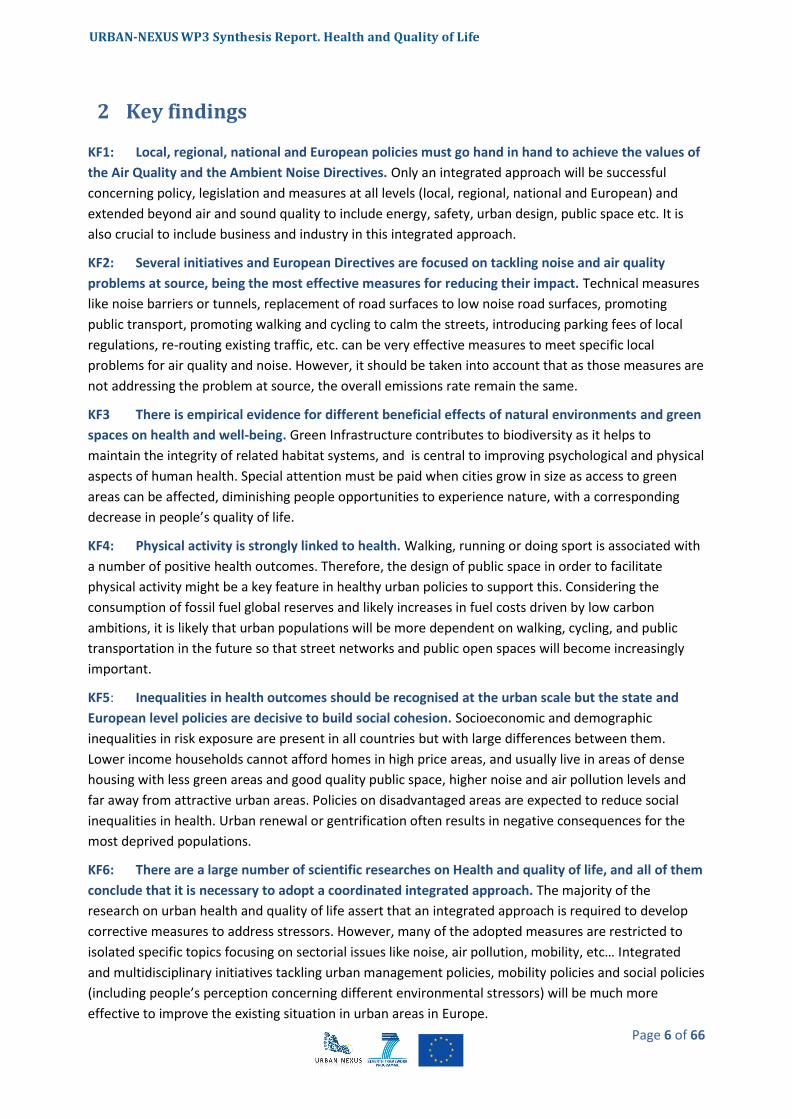
2 Key findings
KF1: Local, regional, national and European policies must go hand in hand to achieve the values of
the Air Quality and the Ambient Noise Directives. Only an integrated approach will be successful
concerning policy, legislation and measures at all levels (local, regional, national and European) and
extended beyond air and sound quality to include energy, safety, urban design, public space etc. It is
also crucial to include business and industry in this integrated approach.
KF2: Several initiatives and European Directives are focused on tackling noise and air quality
problems at source, being the most effective measures for reducing their impact. Technical measures
like noise barriers or tunnels, replacement of road surfaces to low noise road surfaces, promoting
public transport, promoting walking and cycling to calm the streets, introducing parking fees of local
regulations, re-routing existing traffic, etc. can be very effective measures to meet specific local
problems for air quality and noise. However, it should be taken into account that as those measures are
not addressing the problem at source, the overall emissions rate remain the same.
KF3 There is empirical evidence for different beneficial effects of natural environments and green
spaces on health and well-being. Green Infrastructure contributes to biodiversity as it helps to
maintain the integrity of related habitat systems, and is central to improving psychological and physical
aspects of human health. Special attention must be paid when cities grow in size as access to green
areas can be affected, diminishing people opportunities to experience nature, with a corresponding
decrease in people’s quality of life.
KF4: Physical activity is strongly linked to health. Walking, running or doing sport is associated with
a number of positive health outcomes. Therefore, the design of public space in order to facilitate
physical activity might be a key feature in healthy urban policies to support this. Considering the
consumption of fossil fuel global reserves and likely increases in fuel costs driven by low carbon
ambitions, it is likely that urban populations will be more dependent on walking, cycling, and public
transportation in the future so that street networks and public open spaces will become increasingly
important.
KF5: Inequalities in health outcomes should be recognised at the urban scale but the state and
European level policies are decisive to build social cohesion. Socioeconomic and demographic
inequalities in risk exposure are present in all countries but with large differences between them.
Lower income households cannot afford homes in high price areas, and usually live in areas of dense
housing with less green areas and good quality public space, higher noise and air pollution levels and
far away from attractive urban areas. Policies on disadvantaged areas are expected to reduce social
inequalities in health. Urban renewal or gentrification often results in negative consequences for the
most deprived populations.
KF6: There are a large number of scientific researches on Health and quality of life, and all of them
conclude that it is necessary to adopt a coordinated integrated approach. The majority of the
research on urban health and quality of life assert that an integrated approach is required to develop
corrective measures to address stressors. However, many of the adopted measures are restricted to
isolated specific topics focusing on sectorial issues like noise, air pollution, mobility, etc… Integrated
and multidisciplinary initiatives tackling urban management policies, mobility policies and social policies
(including people’s perception concerning different environmental stressors) will be much more
effective to improve the existing situation in urban areas in Europe.
URBAN-NEXUS WP3 Synthesis Report. Health and Quality of Life
Page 7 of 66
KF7: Urban structure and land use affects quality of life. The physical space where we live indirectly
affects our quality of life. The type of housing, neighbourhood and, to a lesser extent, city and
metropolitan areas are crucial aspects of well-being amongst citizens. There is a growing recognition
that compact cities with mixed land use provide better air quality compared to dispersed cities with
lower densities and segregated land use or networked cities equipped with intensive transport
infrastructure.

URBAN-NEXUS WP3 Synthesis Report. Health and Quality of Life
Page 8 of 66
3 An overview of health and quality of life
3.1 The challenge of urban health and quality of life
Quality of life is an emerging issue, as it has been observed that people’s perception, aspirations and
behaviour influence to a great extent many socio-economic dynamics and even certain developments
in the urban context.
Citizens’ well-being is the focus of quality of life, and health is a primary component of the well-being.
As shown in Figure 1, people and their social and cultural factors are the final receivers of decisions
taken at macro-economic level and people’s way of life are mainly influenced by political decisions and
global forces, as well as social factors and social networks. The figure helps to understand the
relationships between health and urban planning, one of the ultimate objectives of this Synthesis
Report
Figure 1. The determinants of health and well-being in our neighbourhoods (Source: Human ecology model of a settlement, Barton and Grant, 2006)
As has been highlighted in the Europe 2020 strategy1, success overcoming the current economic crisis
can only be achieved with sustainable, smart and integrative development. Therefore economic success
is not the only objective, nor can economic success be achieved without integrating distribution of
resources, sustainability, health, human rights and education. New measurements of well-being
beyond GDP are needed that consider alternative approaches to measuring progress. These include
valuing the services provided by ecosystems which are essential to human well-being, and those that
recognise the importance of breaking the link between environmental damage and economic growth to
1 http://ec.europa.eu/europe2020/index_en.htm
URBAN-NEXUS WP3 Synthesis Report. Health and Quality of Life
Page 9 of 66
achieve continued prosperity without destroying the natural systems that sustain society development
placing an equal measure on material progress, social inclusion, cultural life and living in harmony with
nature (“Happiness and Well-being: Defining a New Economic Paradigm”, 2nd of April 2012, New York,
meeting of the government of Bhutan at the UN headquarters).
The emergence of this new paradigm can be exemplified with the EU funded ERA-ENVHEALTH project
(started in 2008) which aims to achieve “coordination of national environment and health research
programs”. This project has been established to help increase the relevance and efficiency of
Environment & Health in Europe. As it is stated in the EU Environment and Health Strategy (2004), and
seconded by the ERA-ENVHEALTH network and other relevant stakeholders, around 20% of the burden
of disease in industrialized countries can be attributed to environmental factors. Europe’s citizens are
concerned about the potential impact of the environment on their health and expect policy makers to
act. In a survey carried out in 2002 (Flash Eurobarometer EB123), 89% stated that they were worried
about the potential impact of the environment on their health.
“It is important to secure both sustainable development and a sustained quality of life based on
political decisions, highlighting the fact that decisions taken to pursuit short-term quality of life could
have an impact at the expense of longer-term sustainable development” (EEA, 2009). It is therefore
vital to raise public awareness on this aspect and on the conflicts that could arise from achieving
individual or collective quality of life benefits. “The challenge for cities is therefore, to find acceptable
and smart solutions tackling environment and health problems together; finding a balance between all
policies and developments that should take place in an urban area and integrate them into the same
future urban planning, with the aim of achieving the maximum public support” (EEA, 2009).
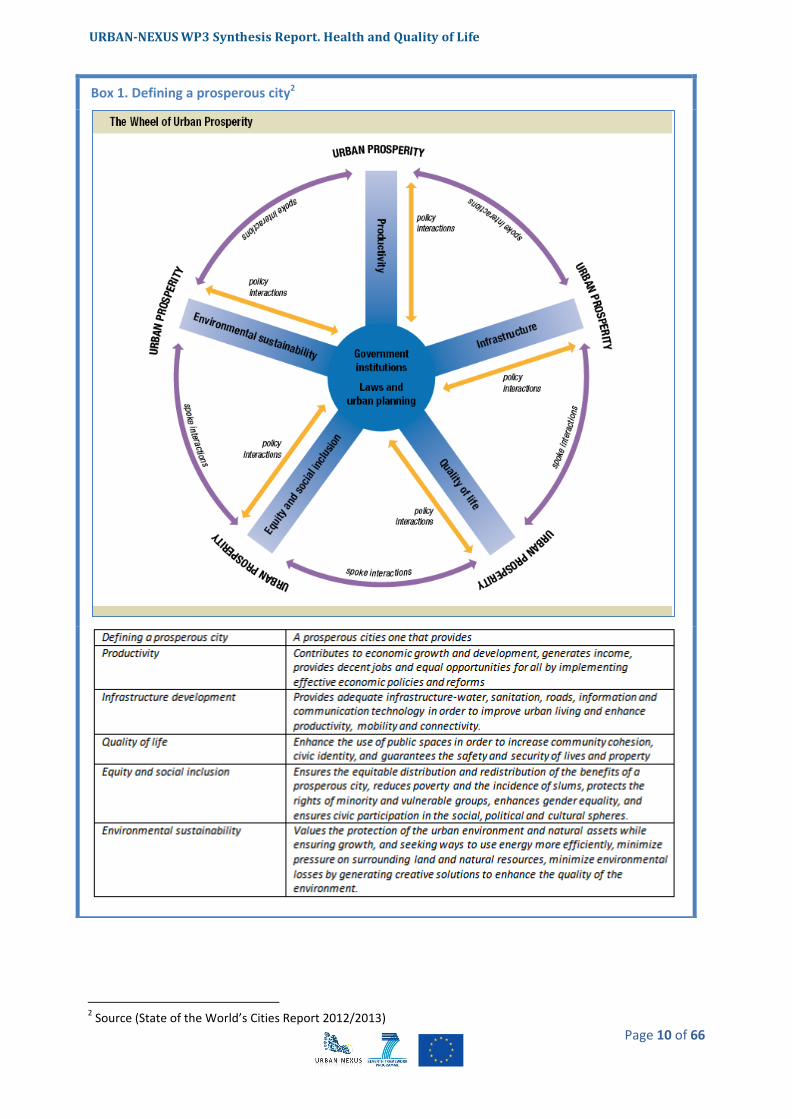
UN-Habitat in the State of the World’s Cities Report 2012/2013, proposes the “prosperity” approach in
order to measure present and future progress of cities. This report introduces a new tool - the City
Prosperity Index - and a conceptual matrix, the Wheel of Prosperity which suggests areas for policy
intervention (see box overleaf).
URBAN-NEXUS WP3 Synthesis Report. Health and Quality of Life
Page 10 of 66
2 Source (State of the World’s Cities Report 2012/2013)
Box 1. Defining a prosperous city2

URBAN-NEXUS WP3 Synthesis Report. Health and Quality of Life
Page 11 of 66
3.2 Concept definitions: health, quality of life, urban areas
In this section, key terms are defined as used throughout this document.
Health
The World Health Organization (WHO) defines Health in the following way: “Health is a state of
complete physical, mental and social well-being and not merely the absence of disease or infirmity.”
(World Health Organization 1948).
This definition encloses the fundamental elements intended to be addressed by a focus on health and
well-being in the urban environment.
Achieving a healthy and sustainable way of living by ensuring a good quality of life is the main tendency
that is being observed in western and European countries, replacing the previous concept on just
decreasing mortality indices. Based on that, concepts like the DALYs (Disability-Adjusted Life Year) were
adopted in several WHO reports and are becoming increasingly common in the field of public health
and health impact assessment. One DALY is equal to one year of healthy life lost, which include years of
life lost and years lived with disability: it extends the concept of potential years of life lost due to
premature death to include equivalent years of ‘healthy’ life lost by virtue of being in states of poor
health or disability.
Quality of life
Quality of life is a term broadly used both by the general public and amongst policy‑makers. Everyone
agrees on its importance, but a definitive meaning cannot be assigned to it — the term can mean many
things to many people.
The term quality of life (QoL) is used to evaluate the general well-being of individuals and societies,
focused on separate dimensions of collective well-being, such as income, wealth and employment, the
built environment, physical and mental health, education, social disorganization, social belonging, and
recreation and leisure (Gregory, D., 2009). Therefore, quality of life measures are based more on social
indicators than just material living standards that are related mainly to individual or national aggregate
levels of income
Other concepts, such as freedom (cf. human rights) and happiness are frequently related to measures
of the quality of life that individuals and societies experience, although much work on happiness shows
that – to the extent that it can be measured – does not increase above a certain income threshold:
people may be more content and live more comfortable lives with higher incomes, but they do not feel
any happier (Layard, 2005).
In the report issued by the EEA in 2009, Ensuring quality of life in European cities and towns, quality of
life is mainly defined by people as the availability of having public services, employment, shopping,
transport, green open space, culture and sport facilities as well as space to live, apart from income
(EEA. 2009). If the question asks which aspects could be improved in the city to achieve a better quality
of life, the majority of people would mention problems such as traffic, noise and air pollution, all of
them problems that people are facing daily. So, apart from promoting clean air and public health, local
and regional authorities have to pursue many other objectives that contribute to the well-being of their
citizens, such as economic prosperity, mobility, jobs and the preservation of the economic, social and
cultural functions of inner cities. Cities cannot simply shut down all transport activities and industries in
order to realise clean air and a better acoustic environment.
URBAN-NEXUS WP3 Synthesis Report. Health and Quality of Life
Page 12 of 66
Urban areas
Apart from population thresholds, urban areas can be defined according to different criteria (EEA
2009).
‒ Administrative area: constitutes the territorial expression of the political and technical
framework of governance, forming the focus for, and critical to the understanding of, the
development and implementation of policies to secure both quality of life and sustainable
development.
‒ Morphological area: constitutes, irrespective of administrative borders, the spatial dimension
and form of cities and towns in physical terms, comprising urban fabric with buildings, roads
and artificially surfaced area, industrial and commercial units, green urban areas within urban
fabric, and in addition port areas, airports, and sport and leisure facilities if included or
continuous to other urban land use.
‒ Functional urban area: constitutes the socio‑economic reality of towns and cities expressed in
terms of the territorial influence of the town or city across its hinterland, and identified in the
relevant structures of the built environment.
3.3 Health & Quality of Life in the context of Urban Nexus
Health and quality of life in urban areas was identified as a priority research area by URBAN-NET (an EU
– wide predecessor research project of URBAN-NEXUS) as part of a strategic research framework for
European sustainable urban development, developed under that project.
The other two priority research areas proposed to be studied by URBAN-NET have been:
- Climate change and urban resilience
- The use and competition for the land
These three thematic areas are being developed under the URBAN-NEXUS project, as well as the
interlinakges between them and their integration into two horizontal thematic areas: urban
management and integrated information. To show the links between health and quality of life with the
use and competition for land and with the urban climate resilience (including how these two areas also
influence citizens well-being, citizens health and citizens’ quality of life), two specific subsections have
been developed in the current report: section 3.3.1 and 3.3.2 respectively, and both of them are being
further developed in the corresponding Synthesis Report.
In order to analyse the state of the art on health and quality of life in urban areas, which is the focus of
this report, current research, projects and policies already being implemented related to different
types of urban structures, urban management practices and policy decisions, have been used as the
basis for the discourse being presented. The development of an urban area is clearly determined by
those factors, influencing urban patterns and resource / people flows. The resulting environmental
quality of the urban environment comes from the effect of all the policies applied that are assessed
through indicators such as the quality of the air or the use of green urban areas
To contextualize the research that is presented in URBAN-NEXUS, citizens are the focus of the analysis,
as they are the participants impacted by the improvements or deterioration of the quality of the urban
environment as a result of policies, structures and patterns that determine their quality of life. Very
often citizens have only been approached as either “receivers” or “users” which implies a passive role.
URBAN-NEXUS WP3 Synthesis Report. Health and Quality of Life
Page 13 of 66
In recent years, Smart Cities3 project has taken special relevance to ensure citizen participation through
technologies.
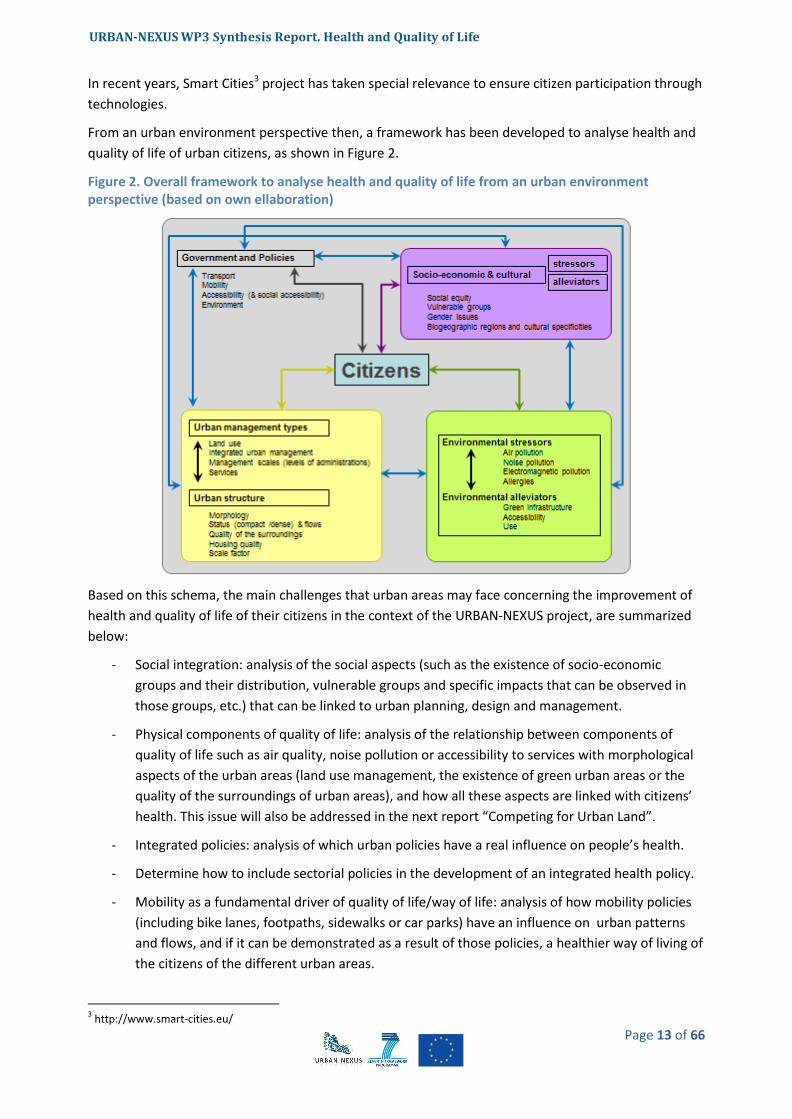
From an urban environment perspective then, a framework has been developed to analyse health and
quality of life of urban citizens, as shown in Figure 2.
Figure 2. Overall framework to analyse health and quality of life from an urban environment perspective (based on own ellaboration)
Based on this schema, the main challenges that urban areas may face concerning the improvement of
health and quality of life of their citizens in the context of the URBAN-NEXUS project, are summarized
below:
- Social integration: analysis of the social aspects (such as the existence of socio-economic
groups and their distribution, vulnerable groups and specific impacts that can be observed in
those groups, etc.) that can be linked to urban planning, design and management.
- Physical components of quality of life: analysis of the relationship between components of
quality of life such as air quality, noise pollution or accessibility to services with morphological
aspects of the urban areas (land use management, the existence of green urban areas or the
quality of the surroundings of urban areas), and how all these aspects are linked with citizens’
health. This issue will also be addressed in the next report “Competing for Urban Land”.
- Integrated policies: analysis of which urban policies have a real influence on people’s health.
- Determine how to include sectorial policies in the development of an integrated health policy.
- Mobility as a fundamental driver of quality of life/way of life: analysis of how mobility policies
(including bike lanes, footpaths, sidewalks or car parks) have an influence on urban patterns
and flows, and if it can be demonstrated as a result of those policies, a healthier way of living of
the citizens of the different urban areas.
3 http://www.smart-cities.eu/
URBAN-NEXUS WP3 Synthesis Report. Health and Quality of Life
Page 14 of 66
- Integrated policies - green infrastructure and health: analysis of the influence on greening
urban areas and infrastructure (blue and green urban environments) on people’s quality of life,
that would also provide a link with the analysis that will come from earlier URBAN-NEXUS work
related to climate change and subsequent work related to sustainable land use in urban
environments.
- Decision-making models: analysis of which models or decision-making applications would be
the best ones to be applied in an integrated urban management plan that should include
quality of life and health aspects as one of the criteria to be taken into account in urban
development (urban development models as well as planning instruments and policies need to
be reconsidered in order to integrate health aspects as fundamental aspects of urban
management).
These challenges have been addressed throughout the report as the basis to focus the literature review
undertaken to summarize the state of the art in terms of research policy and practice, and to highlight
the main achievements obtained by all the projects being analysed. The questions will be also discussed
in detail during the upcoming Dialogue Café that will be held in Barcelona in October 2012, and the
outcomes of the Dialogue Café will constitute the central part of the Follow-Up Report on Health and
Quality of life in urban areas.
Chapter 4 of this report contains the findings concerning the environmental stressors and alleviators,
the socio-economic and cultural stressors and alleviators, and the urban structure and urban
management types affecting health and quality of life of citizens in urban areas. All the items are highly
interlinked, and political and governmental decisions highly influence the characteristics of the urban
environment and determine the path to improve or worsen the situation focused on the quality of life.
In all the subsections, the main pieces and sources of evidence for each thematic area have been
identified in order to establish the state of the art of each of them. Several case studies as well as
current research projects have been analysed in order to exemplify some of the main aspects
highlighted in the analysis, which are presented in text boxes in each thematic section. Finally, this
synthesis report should serve as basis for the discussion to be held in a Dialogue Café, in order to
identify existing gaps for any of the thematic issues and to determine the possible strategic solutions to
be applied by long-term partnerships resulting from the URBAN-NEXUS project.
3.3.1 Competing for urban land
Urban land uses and their spatial distribution ultimately have an influence that affects health and
quality of life. In a similar way urban sprawl and the way it occurs might affect either in a positive or
negative way. For instance, the findings of several studies provide evidence that the shape of a city and
the land use distribution determine the location of emission sources and the pattern of urban traffic,
affecting urban air quality. It has been concluded by C. Borrego et al. (2006) that compact cities with
mixed land use provide better air quality compared to dispersed cities with lower densities and
segregated land use or networked cities equipped with intensive transport infrastructures. The
European Commission has already advanced a series of actions to promote a strategy for sustainable
urban development, and to improve the quality of life of the increasing population of European cities.
With regards to this, vegetation could help specifically to improve the quality of the urban
environment, not only because of its well-known aesthetic and recreational benefits, but also for its
capability to reduce air temperature and to remove air pollutants, that could help to match the air
URBAN-NEXUS WP3 Synthesis Report. Health and Quality of Life
Page 15 of 66
quality standards with the required reduction of primary and secondary pollutants. (McPherson E.G., et
al. 1998).
“Urban expansion is often perceived as a route to a better quality of life as it offers affordable, greener
places to live. But related transport infrastructure developments may lead to further deterioration and
fragmentation of natural areas and valuable landscapes, thus resulting in a less biodiversity and the
deterioration and loss of ecosystem services — flood prevention, water clean‑up, climate regulation
etc.” (EEA, 2006).
In contrast to the general lowering of urban densities, some cities experience growth in the inner city,
that results in areas of high population densities (the so-called compact cities). On the positive side, this
type of growth generates the potential to reduce transport demand and overall emissions, but on the
negative side there is a risk that more people are exposed to higher levels of air pollution and noise.
Some of the main challenges of these compact cities are the combination of different administrative
measures and urban design and spatial planning measures that demonstrate reduction of these
impacts to some extent. However, unfavorable living conditions in inner city areas associated with
excessively high population densities can also contribute to suburbanization and ex‑urbanisation and
thus reinforce the tendency to urban sprawl. (Pflieger, G.2009)
Moreover, regeneration of deprived areas can lead to a process of gentrification, which is the process
of renewal and rebuilding accompanied by the influx of middle-class or affluent people causing the
displacement of poorer residents. This socio-spatial polarization, that its geographic reshaping, will
continue in the future (FOCI, 2010).
Poorer residents are unable to pay increased rents or house prices and property taxes. Often old
industrial buildings are converted to residences and shops. In addition, new businesses, catering to a
more affluent base of consumers, move in, further increasing the appeal to more affluent migrants and
decreasing the accessibility to the poorer residents (R. Atkinson 2012), (L. Freeman 2012).
Nevertheless, city planners mostly agree that poor people need to be better located in cities to improve
their access to social amenities and economic opportunities. This competition for urban land has much
to do with social equity (see chapter 4.2.1).
Another problem is the lack of green areas in many highly urbanised regions (EEA 2009). Urban
expansion and higher building densities have often led to a growing separation of homes from
recreational areas and the reduction of parks and playing fields, limiting the possibilities for outdoor
recreation. Also, the deterioration of landscapes and natural areas surrounding the cities due to low
density urban expansion reduces the quality of the countryside with adverse impacts on social life,
physical activity and mental health.
As stated in an article from J. Corburn (2007), based on several studies undertaken in several USA cities,
land use data could be used to estimate environmental health hazards, especially for estimating
neighbourhood scale air toxines. Hazardous air pollutants (HAPs: aldehydes, benzene and other volatile
organic compounds along with diesel particulate matter) are known to have adverse health effects on
urban populations exposed at the micro or neighbourhood scale, exacerbating respiratory disease and
in the majority of cases being evaluated, disproportionally concentrated in low-income urban
neighbourhoods and communities of immigrants.
Competition for urban land has then, different consequences which should be analysed and taken into
account when it comes to urban planning.
URBAN-NEXUS WP3 Synthesis Report. Health and Quality of Life
Page 16 of 66
3.3.2 Urban climate resilience
A section dedicated to the health effects of climate change is contained in the Synthesis Report related
to “Urban Climate Resilience”. Section 5.3 of that document covers issues such as the effects of the
increasing temperatures, exposure to extreme heat events, river and coastal flooding, and drought
events.
It is known that “climate change will cause deaths during heat waves, increase health problems as a
result of additional particle emissions during droughts, exacerbate ozone and air quality related health
problems, and intensify the distribution and spread of infectious diseases. Climate change will also
affect the basic elements of life and hence, the economy” (EEA, 2009).
The configuration of towns and cities, their land use patterns, infrastructure layout, types of materials
used, development planing and management are all factors determining resilience. These components
are related to the capacity to deal with impacts such as the heat island effect on human health or
maintiaining interconnected transport networks in case of floods. Within urban areas, climate change
can also aggravate social inequalities and change consumption patterns and lifestyles related to
people’s quality of life.
The benefits of vegetation and its setting in the city in relation to air quality and city climate have been
widely studied. The urban climate, influenced by shading effects offered by vegetation, altered
radiation fluxes and increased evapotranspiration; apply especially to the levels of human thermal
comfort . Vegetation is an important factor altering the urban microclimate through the variation of
those influencing factors. Provided this situation, it has been demonstrated that that vegetation is a
very effective heat mitigator in dense urban environments mostly due to shadowing effects, especially
during summer time, when heat stress events usually occur (project developed in the Department of
Earth Science , Gothenburg University, by Lindberg, F. (2010)).
Environmental issues such as climate change and air quality require good policy coordination across
planning, transport and environmental health sectors to ensure that policies and actions to benefit one
area of concern do not adversely affect another; e.g. increased concentrations of air-borne fine
particulates and toxic residues is a potential health concern previously overlooked in the promotion of
biomass technologies as a means of reducing carbon emissions and mitigating climate change.
URBAN-NEXUS WP3 Synthesis Report. Health and Quality of Life
Page 17 of 66
The ecosystem services provided by urban green spaces are directly linked to the physical aspects of
these spaces (de Groot et al., 2002): environmental services that could be taken under consideration
would be climate amelioration, carbon storage and sequestration, pollution control, decreases of
rainwater runoff and protection against floods, but also aesthetical and recreational services (Ong,
2002). Some of these services will play a key role in the adaptation of urban areas to climate change,
which should be tackled at all governmental levels. Moreover, considering that cities tend to hold
greater concentrations of population and economic assets, and that there is a trend to increase these
concentrations in the future, urban areas present a high vulnerability to current climate variability and
future climate change (EEA, 2012a). More extreme weather events such as heat waves, floods and
droughts have been manifested in last years and are more visible throughout Europe (EEA, 2009). Heat
in cities is emphasized by the urban heat island effect; the action of heat is a major concern under heat
waves when especially affects human health stated by an increase of mortality rate. Many studies have
been undertaken to analyse the relation between vegetation and temperature, results show that the
cooling effect of vegetation is about 0.94ºC in parks (Bowler et al., 2012). However, there is a need to
standardise data collection and standardise the decision of which summary temperature parameters
should be appropriate for monitoring programmes, in order to allow comparability. Further research is
needed to investigate the size and distribution of greenspace to determine the optimal cooling effect
of green space. Another climate effect that cities can suffer is floods, which can cause public health,
material and economic impacts. Another factor to consider is soil sealing that increases the risk of
flooding.
Focusing on climate change impacts, there are different adaptation strategies that can be adopted;
maybe the most obvious one is the greening urban areas, founded on the enlargement of vegetation
cover and density (Bowler et al., 2012) and boosting green infrastructure (EEA, 2012a) by promoting
trees in streets, green walls and roofs, gardens and parks, wetlands and water bodies. It is also
important to maintain inward and outward flows for fresh air (for cooling) and water (to avoid floods).
Box 2. Urban Reduction of GHG Emissions in China and Europe (URGENCHE )
http://www.urgenche.eu/
This project develops and applies a methodological framework for the assessment of the
overall risks and benefits of alternative greenhouse gas (GHG) emission reduction policies for
health and well-being. Project focus on cities ranging in population from 50,000 to 10 million,
across various climatological conditions and differences in socio-economic background.
This framework considers GHG emission reductions of energy demand and supply and
transport scenarios in urban areas, the effect of these policies, and subsequently the impacts
on human health and well-being. The GIS-based approach takes into account the advances
made in integrated assessment in a large range of studies in Europe over recent years (many
with participation of the project partners). The impact on human health and well-being of GHG
policies may be the result of changes in exposure patterns of the urban population to
environmental contaminants such as ambient and indoor air pollution as well as changes in
housing, urban green spaces, workplaces, transport and lifestyles. Distribution of the impacts
across different socioeconomic groups will be addressed. Results will be demonstrated for the
year 2030 on a business-as-usual and two GHG emission reduction scenarios with emphasis on
transport and buildings.
URBAN-NEXUS WP3 Synthesis Report. Health and Quality of Life
Page 18 of 66
It is recommended to avoid or even remove impervious surfaces where possible, as well as to facilitate
the ‘renaturalisation’ of rivers and wetlands, recovering their ecosystem functions. Other measures at
the level of urban planning can involve an integration of building design, such as the establishment of a
minimum green quota to be included in new urbanisations, which could be based on a minimum extent
or a new approach as the proposed by Ong based on the green plot ratio (Ong, 2002). Urban planners
must also be aware that while cities grow in population and not in size they become more compact.
Consequently, available green space per capita drops. On the other hand, when cities grow in size
access to green areas can be affected diminishing people opportunities to experiment nature, and so
decreasing people’s quality of life (Fuller and Gaston, 2009).
URBAN-NEXUS WP3 Synthesis Report. Health and Quality of Life
Page 19 of 66
4 Evidence from research and practice influencing people’s
health
4.1 Environmental stressors and alleviators
Which are the environmental stressors causing damage in people’s health and affecting their quality of
life? Are there policies aiming to reduce harmful effects of exposure to those stressors? Are European
Member States applying the policies with a positive result for European citizens in urban areas? And
which have been the most common measures being implemented to alleviate those effects at local and
urban level?
Europe is a highly urbanized continent with more than two thirds of the total population living in urban
areas. Although emissions from motorized vehicles and large point sources have been reduced through
the use of cleaner fuels and technology, urban areas still show increasing signs of environmental stress:
loss of open space, traffic congestion, noise and air quality degradation (Fenger et al. 1998, cited in C.
Borrego et al. (2006)).
Several initiatives and European Directives are focused on tackling noise and air quality problems at
source, being the most effective measures for reducing their impact. In most cities, road transport is
clearly the main source of air pollution and noise, so several measures established at vehicles’ levels
would achieve presumably better results. In the case of air pollution, directives such as the Clean Air for
Europe programme (CAFE) programme, the National Emission Ceiling Directive (more details can be
found in section 4.1.1.1) and the Integrated pollution prevention and control Directive (IPPC), establish
limit values for air quality and determine reductions of emission standards for cars, ships, agricultural
farms and industrial emissions as well (EEA, 2009). In the case of noise, improved standards for
vehicles, cleaner vehicle technologies and improvements in tyres are some of the most effective
measures for noise abatement.
So, although air pollution and noise are recognised as major public concerns, sometimes is difficult to
introduce changes in the organisation and structure of urban areas to reduce both pollutants and
improve the quality of life for all citizens, combining individual interest with societal interest to achieve
a clean air and a quiet environment in urban areas. It is clear that persisting stresses show that solely
technological improvements are unlikely to provide the solution as the drivers behind this problem are
multiple and therefore, more than one sector should join efforts to improve the situation.
Local, regional, national and European policies must go hand in hand to achieve the values of the Air
Quality and the Ambient Noise Directives. Only an integrated approach will be successful concerning
policy, legislation and measures at all levels (local, regional, national and European) and extended
beyond air and sound quality to include energy, safety, urban design, public space etc. It is also crucial
to include business and industry in this integrated approach (EEA, 2009).
4.1.1 Urban place and environmental stressors
Many problems in cities are strongly related to issues concerning urban density and urban
containment. Lower residential densities often offer lower noise levels, less air pollution and better
URBAN-NEXUS WP3 Synthesis Report. Health and Quality of Life
Page 20 of 66
access to (private) green space (EEA, 2009) . On the other hand, low densities also result in greater
demands on the transport system, particularly road transport. Hence urban sprawl and transport
infrastructure have a reciprocal relationship and a positive feedback loop develops (ESPON, 2004, cited
in EEA, 2009) — more building requires more roads, which leads to more building.
Provided this situation, it has been observed that transport volumes have increased substantially
throughout Europe over the last decades driven by urban sprawl and a large number of other socio-
economic factors (Stead & Marshall, 2001, cited in EEA, 2009), with an increase of health risks and a
reduction of the quality of life in cities and in near surroundings.
URBAN-NEXUS WP3 Synthesis Report. Health and Quality of Life
Page 21 of 66
Noise and air pollution are mainly caused by road transport in most European cities, and both of them
are the major environmental stressors to take under consideration to improve citizens’ well-being.
Despite all measures and improvements already occurred, both stressors still show higher values above
the healthy established limits, leading to various types of diseases and reduction of life expectancy.
4 http://www.healthscotland.com/uploads/documents/5039-03686_NHSHIAGuideFinal1.pdf
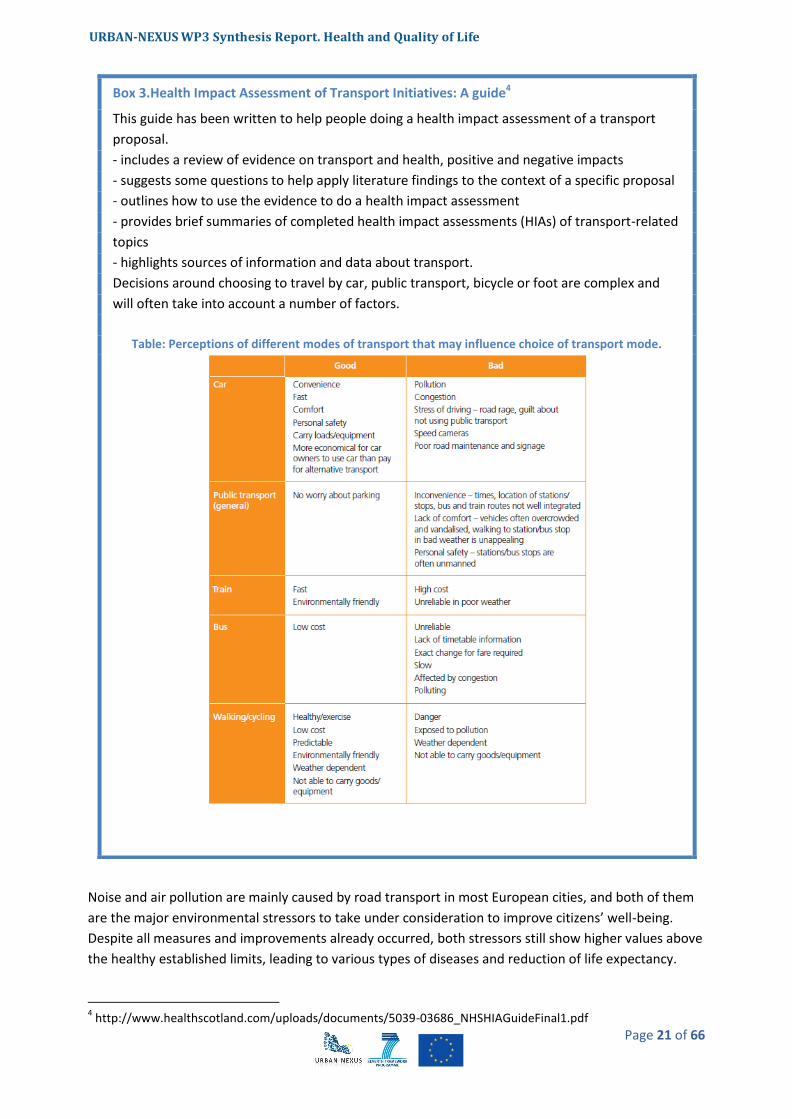
Box 3.Health Impact Assessment of Transport Initiatives: A guide4
This guide has been written to help people doing a health impact assessment of a transport
proposal.
- includes a review of evidence on transport and health, positive and negative impacts
- suggests some questions to help apply literature findings to the context of a specific proposal
- outlines how to use the evidence to do a health impact assessment
- provides brief summaries of completed health impact assessments (HIAs) of transport-related
topics
- highlights sources of information and data about transport.
Decisions around choosing to travel by car, public transport, bicycle or foot are complex and
will often take into account a number of factors.
Table: Perceptions of different modes of transport that may influence choice of transport mode.
URBAN-NEXUS WP3 Synthesis Report. Health and Quality of Life
Page 22 of 66
Those two stressors are not the only ones causing all the health effects that could be observed in
people living in urban areas; there are also the electromagnetic pollutants and the effects caused by
different allergies in people’s health.
Place shaping in cities has a significant role for local government in improving health: people need good
places to live in order to enjoy good health and well-being, which are characterised by good services,
availability of high-quality housing, access to employment and a sense of safety and community (WHO,
2012).
It is therefore necessary to evaluate the role that urban structure, urban form and green spaces are
playing in parallel in alleviating those adverse effects of urbanization on people’s health. A
methodology to assess the impacts and benefits of green spaces and settlement patterns based on
urban sprawl, traffic congestion, noise and air pollution, social stressors, etc. is being proposed and
tested in the BUGS (“Benefits of Urban Green Space”) project, among others. Its final objective is to
formulate recommendations regarding the use of these areas as a design tool for future urban planning
strategies to make cities a more attractive place to live concerning traffic flow and emissions, air
quality, microclimate, noise, accessibility, economic efficiency and social well-being.
As a conclusion, urban structure and policies being implemented in the urban area have a great
influence in limiting noise and air pollution locally. Technical measures like noise barriers or tunnels,
promoting public transport, promoting walking and cycling to calm the streets, introducing parking fees
of local regulations can be very effective measures to meet specific local problems for air quality and
noise, although it should be also taken into account that the overall emissions rate remain the same, as
those measures are not addressing the problem at source.
Local governments can demonstrate good practices to citizens to tackle those problems by establishing
green public and private areas, the procurement of clean vehicles in the public transport fleet, the
creation of environmentally certified buildings and applications, etc. (EEA, 2009).
4.1.1.1 Air pollution
According to WHO assessment of the burden of disease due to air pollution (WHO Air quality guidelines
– global update 2005), clean air is considered to be a basic requirement of human health and well-
being.
Air pollution is a major environmental risk to health: it is calculated that more than 2 million premature
deaths each year can be attributed to the effects of urban outdoor air pollution and indoor air pollution
(caused by the burning of solid fuels). Four common air pollutants are being evaluated in WHO’s report:
particulate matter (PM), ozone (O3), nitrogen dioxide (NO2) and sulphur dioxide (SO2). Guideline
values have been established and also interim targets related to outdoor air pollution have been
determined, to promote a gradual shift from high to lower concentrations. In
URBAN-NEXUS WP3 Synthesis Report. Health and Quality of Life
Page 23 of 66
Table 1, a summary of the health effects determined by each air pollutant evaluated as well as the
guidelines values that have been proposed by WHO have been summarized.
URBAN-NEXUS WP3 Synthesis Report. Health and Quality of Life
Page 24 of 66
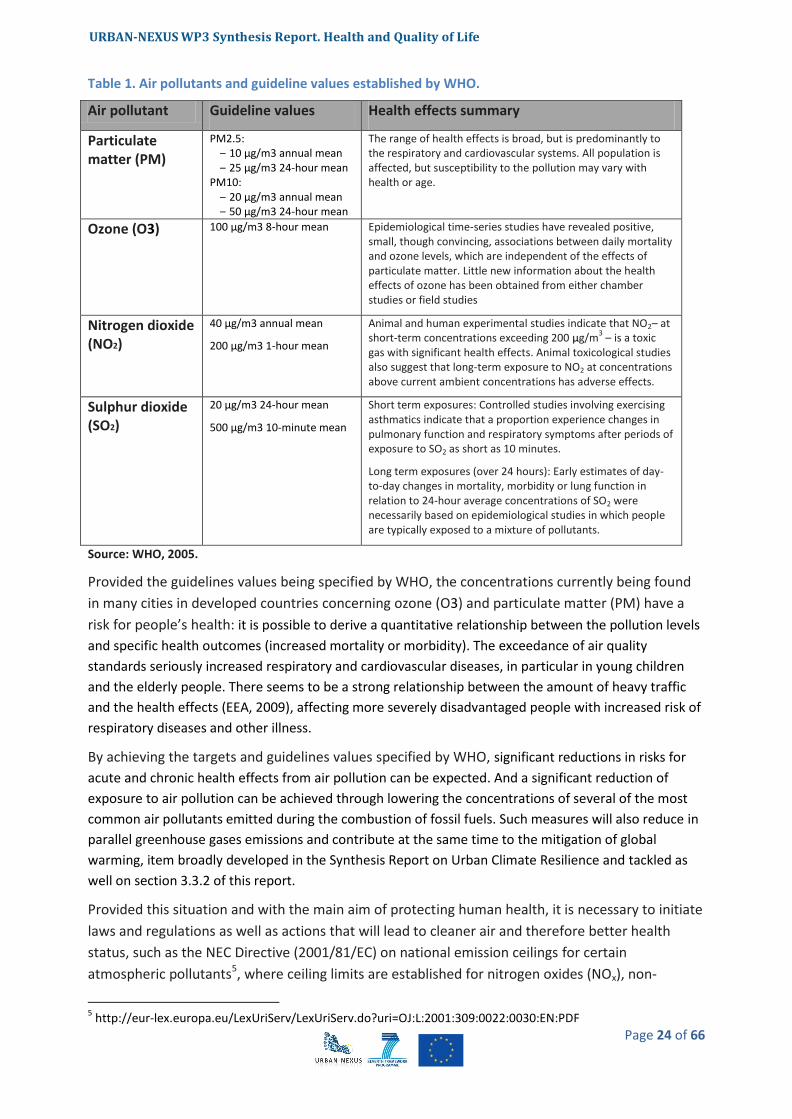
Table 1. Air pollutants and guideline values established by WHO.
Air pollutant Guideline values Health effects summary
Particulate matter (PM)
PM2.5: ‒ 10 μg/m3 annual mean ‒ 25 μg/m3 24-hour mean
PM10: ‒ 20 μg/m3 annual mean ‒ 50 μg/m3 24-hour mean
The range of health effects is broad, but is predominantly to the respiratory and cardiovascular systems. All population is affected, but susceptibility to the pollution may vary with health or age.
Ozone (O3) 100 μg/m3 8-hour mean Epidemiological time-series studies have revealed positive, small, though convincing, associations between daily mortality and ozone levels, which are independent of the effects of particulate matter. Little new information about the health effects of ozone has been obtained from either chamber studies or field studies
Nitrogen dioxide (NO2)
40 μg/m3 annual mean
200 μg/m3 1-hour mean
Animal and human experimental studies indicate that NO2– at short-term concentrations exceeding 200 μg/m
3 – is a toxic
gas with significant health effects. Animal toxicological studies also suggest that long-term exposure to NO2 at concentrations above current ambient concentrations has adverse effects.
Sulphur dioxide (SO2)
20 μg/m3 24-hour mean
500 μg/m3 10-minute mean
Short term exposures: Controlled studies involving exercising asthmatics indicate that a proportion experience changes in pulmonary function and respiratory symptoms after periods of exposure to SO2 as short as 10 minutes.
Long term exposures (over 24 hours): Early estimates of day-to-day changes in mortality, morbidity or lung function in relation to 24-hour average concentrations of SO2 were necessarily based on epidemiological studies in which people are typically exposed to a mixture of pollutants.
Source: WHO, 2005.
Provided the guidelines values being specified by WHO, the concentrations currently being found
in many cities in developed countries concerning ozone (O3) and particulate matter (PM) have a
risk for people’s health: it is possible to derive a quantitative relationship between the pollution levels
and specific health outcomes (increased mortality or morbidity). The exceedance of air quality
standards seriously increased respiratory and cardiovascular diseases, in particular in young children
and the elderly people. There seems to be a strong relationship between the amount of heavy traffic
and the health effects (EEA, 2009), affecting more severely disadvantaged people with increased risk of
respiratory diseases and other illness.
By achieving the targets and guidelines values specified by WHO, significant reductions in risks for
acute and chronic health effects from air pollution can be expected. And a significant reduction of
exposure to air pollution can be achieved through lowering the concentrations of several of the most
common air pollutants emitted during the combustion of fossil fuels. Such measures will also reduce in
parallel greenhouse gases emissions and contribute at the same time to the mitigation of global
warming, item broadly developed in the Synthesis Report on Urban Climate Resilience and tackled as
well on section 3.3.2 of this report.
Provided this situation and with the main aim of protecting human health, it is necessary to initiate
laws and regulations as well as actions that will lead to cleaner air and therefore better health
status, such as the NEC Directive (2001/81/EC) on national emission ceilings for certain
atmospheric pollutants5, where ceiling limits are established for nitrogen oxides (NOx), non-
5 http://eur-lex.europa.eu/LexUriServ/LexUriServ.do?uri=OJ:L:2001:309:0022:0030:EN:PDF
URBAN-NEXUS WP3 Synthesis Report. Health and Quality of Life
Page 25 of 66
methane volatile organic compounds (NMVOC), sulphur dioxide (SO2) and ammonia (NH3). All
these air pollutants, apart from being harmful for people in relation to their health mainly causing
respiratory illnesses, are also harmful for the environment causing soil and water acidification and
damage on vegetation.
EEA published a report (EEA, 2012b) evaluating the compliance of the Member States and of the
EU on the ceiling limits established by the NEC Directive, and the following key findings has been
highlighted:
‒ Nitrogen oxide (NOx) limits were exceeded most frequently, with 12 Member States failing to
keep emissions below agreed ceilings.
‒ Road transport contributes approximately 40 % of total NOx emissions in the EU. Reductions of
NOX from this sector over the last two decades have been lower than originally anticipated,
according to the report. This is partly because transport has grown more than expected, and
partly because the real-world emissions from diesel vehicles are higher than those estimated
when the vehicle emission limit standards were set.
‒ A lot of progress has been made in reducing sulphur dioxide (SO2) emissions in recent decades.
SO2 emissions in the EU were more than 40% below the EU’s ceiling for this pollutant, and no
Member States exceeded their SO2 ceiling.
URBAN-NEXUS WP3 Synthesis Report. Health and Quality of Life
Page 26 of 66
So, in order to reduce air pollution, several initiatives and programmes have been developed at local
level, focused on the improvement of cars and its related technology, on the utilization of cleaner fuels,
on the improvement of transport infrastructure and vehicle fleets, or on the promotion of public
transport and active living as well.
Several projects are also focused on the reduction of air pollution, such as the EC TRANSPHORM
project7 (Transport related Air Pollution and Health impacts – Integrated Methodologies for Assessing
Particulate Matter), an EU FP7 funded project providing advanced knowledge on the impact of
transport emissions on human health in Europe. This project should bring together internationally
leading air quality, health researchers and users (1) to improve the knowledge of transport related
airborne particulate matter (PM) and its impact on human health and (2) to develop and implement
assessment tools for scales ranging from city to Europe.
Other initiatives are implemented at local level to reduce air pollution such as green roofs. Green roofs
imply in parallel a great range of other environmental benefits such as the reduction of the “heat
6http://pda.elpais.com/index.php?module=elp_pdapsp&page=elp_pda_noticia&idNoticia=20120720elpnepaut_1
19.Tes&seccion=aut 7http://www.transphorm.eu/Home/tabid/1912/language/en-GB/Default.aspx
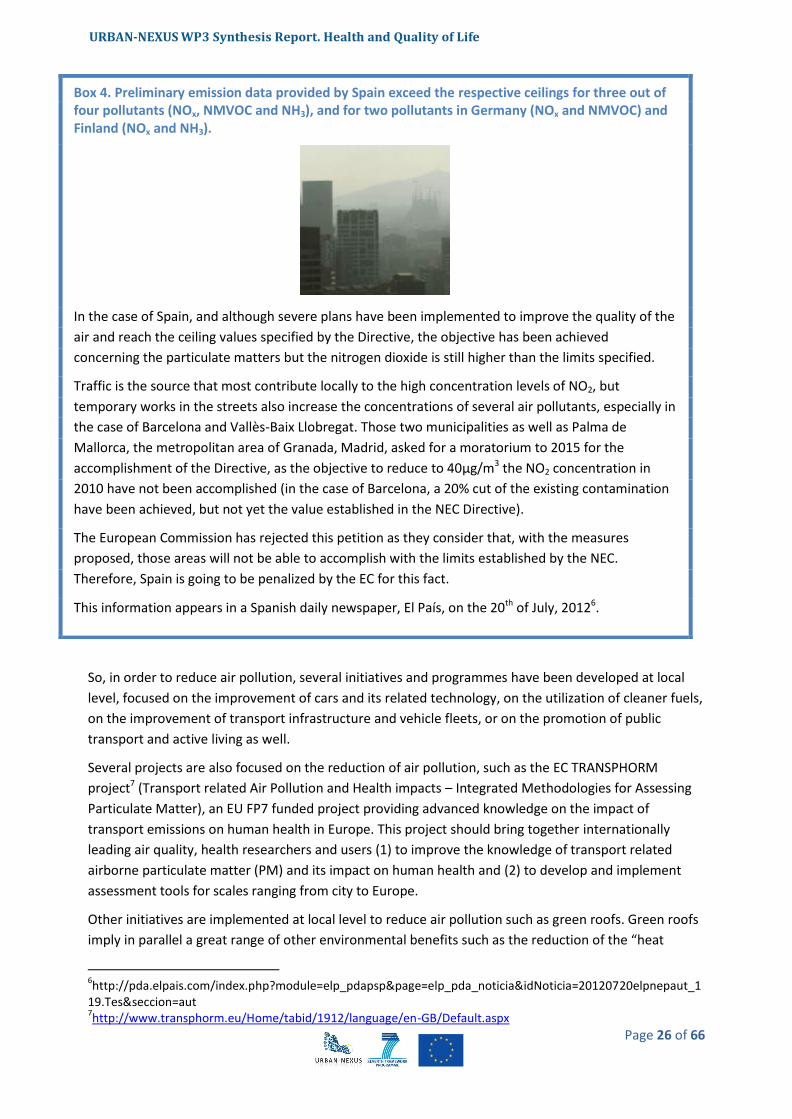
Box 4. Preliminary emission data provided by Spain exceed the respective ceilings for three out of four pollutants (NOx, NMVOC and NH3), and for two pollutants in Germany (NOx and NMVOC) and Finland (NOx and NH3).
In the case of Spain, and although severe plans have been implemented to improve the quality of the
air and reach the ceiling values specified by the Directive, the objective has been achieved
concerning the particulate matters but the nitrogen dioxide is still higher than the limits specified.
Traffic is the source that most contribute locally to the high concentration levels of NO2, but
temporary works in the streets also increase the concentrations of several air pollutants, especially in
the case of Barcelona and Vallès-Baix Llobregat. Those two municipalities as well as Palma de
Mallorca, the metropolitan area of Granada, Madrid, asked for a moratorium to 2015 for the
accomplishment of the Directive, as the objective to reduce to 40µg/m3 the NO2 concentration in
2010 have not been accomplished (in the case of Barcelona, a 20% cut of the existing contamination
have been achieved, but not yet the value established in the NEC Directive).
The European Commission has rejected this petition as they consider that, with the measures
proposed, those areas will not be able to accomplish with the limits established by the NEC.
Therefore, Spain is going to be penalized by the EC for this fact.
This information appears in a Spanish daily newspaper, El País, on the 20th of July, 20126.
URBAN-NEXUS WP3 Synthesis Report. Health and Quality of Life
Page 27 of 66
island” effects, storm water retention, or sound insulation, as well as it creates new spaces in the urban
areas that can be used for food production and recreational spaces (concepts further developed in
sections 3.3.2 and 4.1.2 respectively).
Finally, it is very important to invest resources in education and public awareness, to create corporate
responsibility among all citizens to achieve a decrease of the emissions and reduce the quantity of
energy used on individual or household scale to the neighbourhood scale and to the complete city area
as well.
4.1.1.2 Noise pollution
The EU Environmental Noise Directive had been established with the aim to define a common approach
intended to avoid, prevent or reduce the harmful effects of exposure to environmental noise.
It is crucial to consider that European cities have become increasingly 'noisy', not necessarily because
the noisy places have become noisier, but rather because there are fewer quiet places left. People are
affected by noise from traffic, leisure activities and the general neighbourhood at all hours of the day
and night. (EEA, 2009).
Road traffic, primarily main roads, and also railways and aircraft noise are the main environmental
noise sources inside and outside urban areas. Furthermore, noise problems are often worse in areas of
high density housing and deprived neighbourhoods, where aspects such as neighbourhood noise are
added to the environmental noise.
The Environmental Noise Directive8 (END) legislate about the assessment and management of
environmental noise, with the aim to define a common approach intended to avoid, prevent or reduce
on a prioritized basis the harmful effects, including annoyance, due to exposure to environmental
noise. It requires Member States to determine exposures to noise in major urban agglomerations
through means of noise mapping, as well as exposure due to major transport network infrastructures;
assessing the number of people disturbed during the day and night, informing the public of the results
of strategic noise mapping and where necessary, preparing and adopting action plans with a view to
preventing and reducing environmental noise. To achieve all those objectives, several administrations
should work together and invest the resources to achieve an improvement of the current situation.
All data being provided by the Member States under the END, related to the number of people exposed
to damaging noise levels and the action plans being undertaken to improve the current situation, show
that noise is a serious problem in Europe and lots of people are exposed to levels higher than the ones
recommended by WHO.
Several studies (Stansfeld et al., 2005; van Kempen, 2008; Babisch, 2006; Jarup et al., 2008, cited in
EEA, 2009) demonstrated that the exposure to high levels of environmental noise can be associated to
various health effects such as sleep disturbance, learning difficulties, loss of memory, inability to
concentrate or irreversible damages as heart attacks, hearing impairment and impact on mental health,
the last ones associated with chronic exposure to noise
The World Health Organisation issued a report entitled Night Noise Guidelines for Europe (WHO, 2009),
where guideline values for community noise in various settings have been established based on the
scientific evidence available. These guidelines, neither standards nor legally binding criteria, offer
guidance in reducing the health impacts of night noise, establishing the thresholds of night noise
8 http://ec.europa.eu/environment/noise/directive.htm
URBAN-NEXUS WP3 Synthesis Report. Health and Quality of Life
Page 28 of 66
exposure at Lnight,outside (as defined in the END) of 40dB. As interim target for those countries that cannot
achieve the 40dB in the short term, a value of Lnight, outside has been established at 55dB, but with the
objective to reduce it to the target of 40dB for the final protection of the public, including the most
vulnerable groups such as children, the chronically ill and the elderly.
Solutions to tackle noise pollution in urban areas have started to be implemented, as test cases, as a
result of studies or projects being financed by the European institutions or as measures being
promoted at European institutional level or at Member States level. Nevertheless, noise abatement
measures (replacement of road surfaces to low noise road surfaces, re-routing the existing traffic and
the implementation of changes in park and ride scheme and the establishment of sound barriers or the
optimisation of the transport modal split, amongst the most common measures being proposed and
implemented by local authorities) can hardly be implemented alone, which means that integrated and
multidisciplinary initiatives tackling urban management policies, mobility policies and social policies
(including people’s perception concerning noise) will be much more effective to improve the existing
situation in urban areas in Europe.
URBAN-NEXUS WP3 Synthesis Report. Health and Quality of Life
Page 29 of 66
9 https://wwwa.vito.be/bugs/index.htm
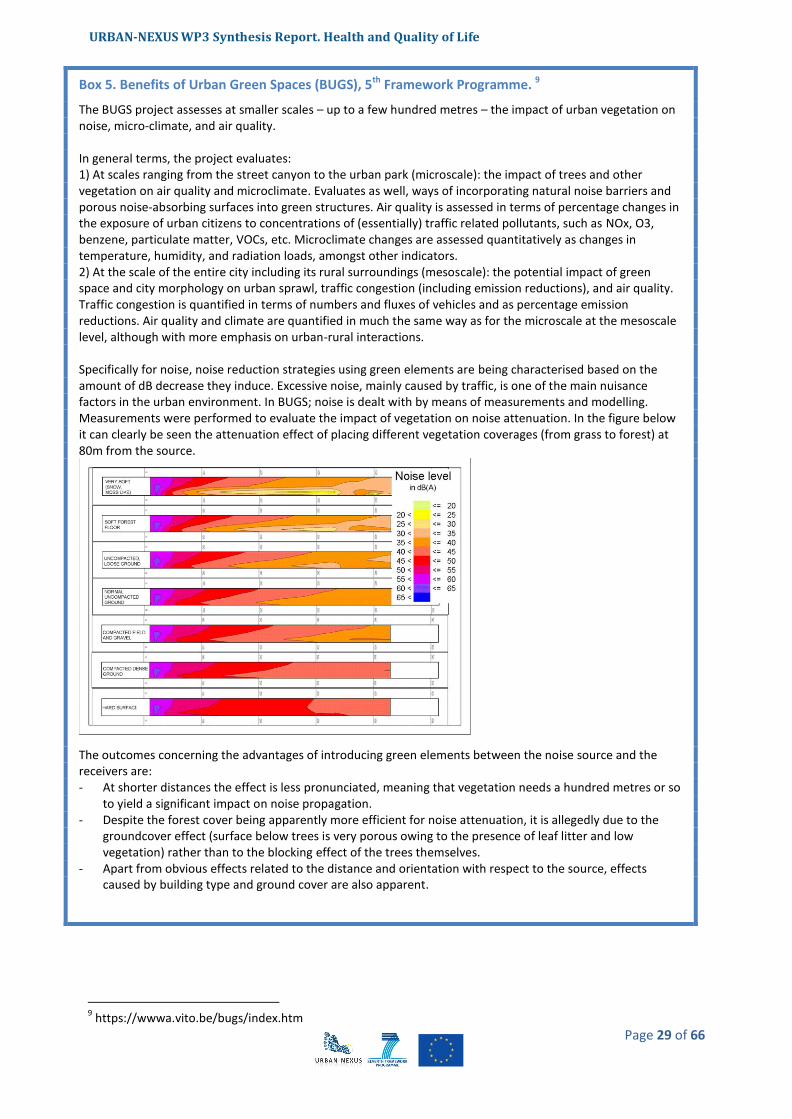
Box 5. Benefits of Urban Green Spaces (BUGS), 5th Framework Programme. 9
The BUGS project assesses at smaller scales – up to a few hundred metres – the impact of urban vegetation on noise, micro-climate, and air quality. In general terms, the project evaluates: 1) At scales ranging from the street canyon to the urban park (microscale): the impact of trees and other vegetation on air quality and microclimate. Evaluates as well, ways of incorporating natural noise barriers and porous noise-absorbing surfaces into green structures. Air quality is assessed in terms of percentage changes in the exposure of urban citizens to concentrations of (essentially) traffic related pollutants, such as NOx, O3, benzene, particulate matter, VOCs, etc. Microclimate changes are assessed quantitatively as changes in temperature, humidity, and radiation loads, amongst other indicators. 2) At the scale of the entire city including its rural surroundings (mesoscale): the potential impact of green space and city morphology on urban sprawl, traffic congestion (including emission reductions), and air quality. Traffic congestion is quantified in terms of numbers and fluxes of vehicles and as percentage emission reductions. Air quality and climate are quantified in much the same way as for the microscale at the mesoscale level, although with more emphasis on urban-rural interactions. Specifically for noise, noise reduction strategies using green elements are being characterised based on the amount of dB decrease they induce. Excessive noise, mainly caused by traffic, is one of the main nuisance factors in the urban environment. In BUGS; noise is dealt with by means of measurements and modelling. Measurements were performed to evaluate the impact of vegetation on noise attenuation. In the figure below it can clearly be seen the attenuation effect of placing different vegetation coverages (from grass to forest) at 80m from the source.
The outcomes concerning the advantages of introducing green elements between the noise source and the receivers are: - At shorter distances the effect is less pronunciated, meaning that vegetation needs a hundred metres or so
to yield a significant impact on noise propagation. - Despite the forest cover being apparently more efficient for noise attenuation, it is allegedly due to the
groundcover effect (surface below trees is very porous owing to the presence of leaf litter and low vegetation) rather than to the blocking effect of the trees themselves.
- Apart from obvious effects related to the distance and orientation with respect to the source, effects caused by building type and ground cover are also apparent.

URBAN-NEXUS WP3 Synthesis Report. Health and Quality of Life
Page 30 of 66
4.1.1.3 Combined effects of noise and air pollution in relation to health
The combination of several environmental stressors may enhance or exacerbate health effects caused
separately by an individual factor. The combined health effects of noise and air pollution are
considered in this section.
Noise levels are correlated with car, truck, and bus traffic and also with air pollutants. Differences
between day time, night time or the day of the week have a direct correlation with noise and air
pollutants variations: noise levels are temporally correlated with traffic and combustion pollutants; and
those correlations are modified by the time of the day, frequency and meteorological conditions.
Therefore, temporal variation in co-exposures to noise and air pollution in studies of the health effects
of these urban pollutants should be taken into account.
Several studies have been undertaken to analyse the differences between the exposure to solely one
environmental stressor or to more than one environmental stressor. Some of the most noticeable
remarks from analysing the combined health effects of both pollutants are highlighted below:
- Aircraft noise was associated with mortality from myocardial infarction, with a dose-response
relationship for level and duration of exposure. The association does not appear to be explained
by exposure to particulate matter air pollution, education, or socioeconomic status of the
municipality. (Huss et al, 2011)
- An association between railway noise and mean blood pressure readings was found, but this
association was not affected by the inclusion of NO2 or PM10 (sensitivity analysis) in the model.
The study reveals more severe health effects by transportation noise in vulnerable populations,
such as adults with hypertension, diabetes or cardio-vascular diseases. It has also been studied
the correlations between traffic noise and NO2 and between traffic noise and PM10, and it was
found that in rural centres, the correlation with PM10 was lower than with NO2 compared to
urban study centres. (Dratva et al, 2011).
- Medium and high frequency noise was more strongly correlated with air pollutants than low
frequency noise, and this correlation was stronger at night (to be taken into account that wind
speed modifies the associations). Co-exposures between noise and air, however, should be
considered in some epidemiologic time series studies. (Ross et al, 2011).
It is also important to assess, apart from traffic variables, the contribution of urban land use to the
noise and air pollution correlation. This contribution has been studied in the city of Girona, where a
previous investigation of the chronic effects of air pollution and noise on cardio-vascular diseases
already took place (REGICOR-AIR). As demonstrated in this study (M. Foraster et al. 2011), the
correlations found between NO2 and noise differed across the urban space, with lower correlations at
sites with higher traffic density and in the modern downtown. Traffic density, distance from the
location to the side walk and building density nearby explained some of the variability observed,
although some other variables not yet measured may have a significant role. The results of the study
also suggest that epidemiological studies should include then, a detailed local assessment of both
environmental factors.
URBAN-NEXUS WP3 Synthesis Report. Health and Quality of Life
Page 31 of 66
4.1.1.4 Electromagnetic pollution
Europe's populations have begun to show increasing concern over the potential health risks of
electromagnetic fields. “The potentially harmful effects of electromagnetic fields on the environment
and human health have not yet been fully elucidated and a number of scientific uncertainties continue
to exist in that regard.”(Committee on the Environment, Agriculture and Local and Regional Affairs,
May 2009). Electromagnetic radiation (EMR) or electromagnetic fields (EMFs) are the terms that
broadly describe exposures created by the vast array of wired and wireless technologies. The report
'Bioinitiative: A Rationale for a Biologically-Based Public Exposure Standard for Electromagnetic Fields'
(BioInitiative Working Group, August 2007) recommends precautionary limits of exposures where
people live, work and go to school. Safety limits for public exposure to EMFs need to be developed on
the basis of interaction among not only scientists, but also public health experts, public policy makers
and the general public.
According to this report the main reasons for disagreement among experts are:
1. Scientists and public health policy experts use very different definitions of the standard of
evidence used to judge the science, so they come to different conclusions about what to do.
Scientists do have a role, but it is not exclusive and other opinions matter.
2. We are all talking about essentially the same scientific studies, but use a different way of
measuring when “enough is enough” or “proof exists”.
3. Some experts keep saying that all studies have to be consistent (turn out the same way every
time) before they are comfortable saying an effect exists.
4. Some experts think that it is enough to look only at short-term, acute effects.
5. Other experts say that it is imperative to have studies over longer time (showing the effects of
chronic exposures) since that is the kind of world we live in.
6. Some experts say that everyone, including the very young, the elderly, pregnant women, and
people with illnesses have to be considered, but others say only the average person matter.
7. There is no unexposed population, making it harder to see increased risk of diseases.
8. There is lack of consensus about a single biological mechanism of action.
9. There is strong evidence of human epidemiological studies reporting risks from ELF and RF
exposures, but animal studies don’t show a strong toxic effect.
10. Vested interests have a substantial influence on the health debate.
In today’s world, everyone is exposed to two types of EMFs: (1) extremely low frequency
electromagnetic fields (ELF) from electrical and electronic appliances and power lines and (2)
radiofrequency radiation (RF) from wireless devices such as cell phones and cordless phones, cellular
antennas and towers, and broadcast transmission towers.
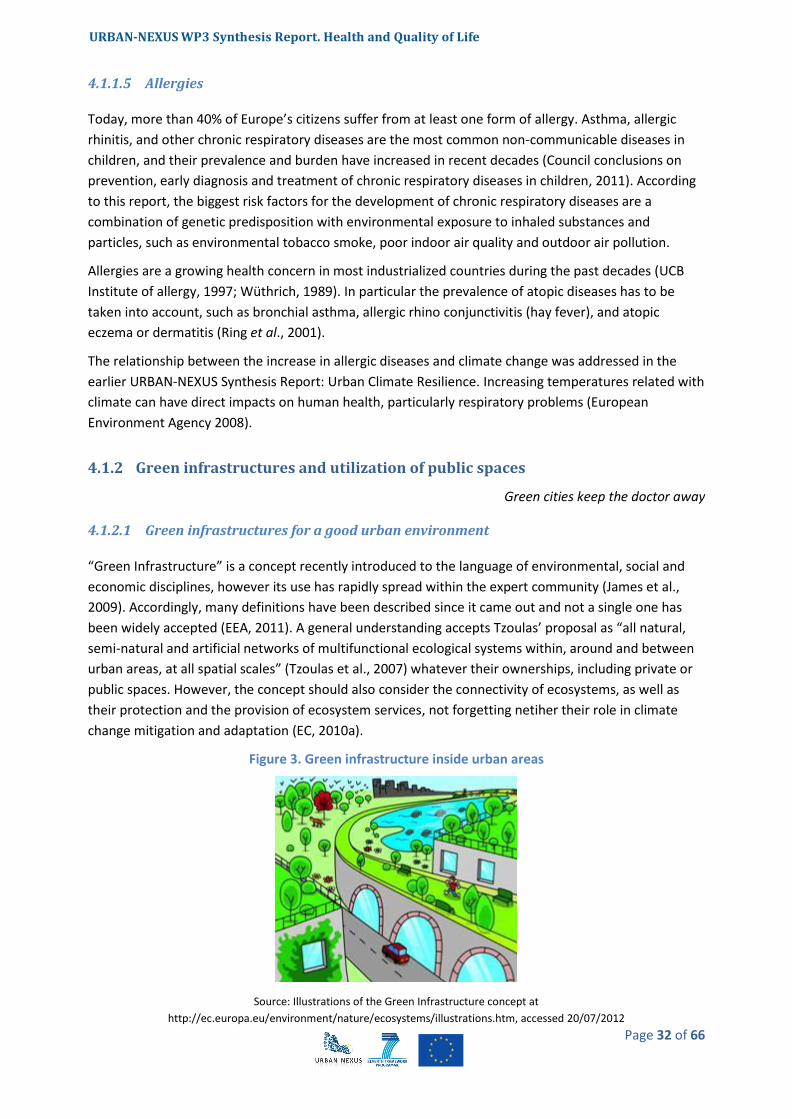
URBAN-NEXUS WP3 Synthesis Report. Health and Quality of Life
Page 32 of 66
4.1.1.5 Allergies
Today, more than 40% of Europe’s citizens suffer from at least one form of allergy. Asthma, allergic
rhinitis, and other chronic respiratory diseases are the most common non-communicable diseases in
children, and their prevalence and burden have increased in recent decades (Council conclusions on
prevention, early diagnosis and treatment of chronic respiratory diseases in children, 2011). According
to this report, the biggest risk factors for the development of chronic respiratory diseases are a
combination of genetic predisposition with environmental exposure to inhaled substances and
particles, such as environmental tobacco smoke, poor indoor air quality and outdoor air pollution.
Allergies are a growing health concern in most industrialized countries during the past decades (UCB
Institute of allergy, 1997; Wüthrich, 1989). In particular the prevalence of atopic diseases has to be
taken into account, such as bronchial asthma, allergic rhino conjunctivitis (hay fever), and atopic
eczema or dermatitis (Ring et al., 2001).
The relationship between the increase in allergic diseases and climate change was addressed in the
earlier URBAN-NEXUS Synthesis Report: Urban Climate Resilience. Increasing temperatures related with
climate can have direct impacts on human health, particularly respiratory problems (European
Environment Agency 2008).
4.1.2 Green infrastructures and utilization of public spaces
Green cities keep the doctor away
4.1.2.1 Green infrastructures for a good urban environment
“Green Infrastructure” is a concept recently introduced to the language of environmental, social and
economic disciplines, however its use has rapidly spread within the expert community (James et al.,
2009). Accordingly, many definitions have been described since it came out and not a single one has
been widely accepted (EEA, 2011). A general understanding accepts Tzoulas’ proposal as “all natural,
semi-natural and artificial networks of multifunctional ecological systems within, around and between
urban areas, at all spatial scales” (Tzoulas et al., 2007) whatever their ownerships, including private or
public spaces. However, the concept should also consider the connectivity of ecosystems, as well as
their protection and the provision of ecosystem services, not forgetting netiher their role in climate
change mitigation and adaptation (EC, 2010a).
Figure 3. Green infrastructure inside urban areas
Source: Illustrations of the Green Infrastructure concept at
http://ec.europa.eu/environment/nature/ecosystems/illustrations.htm, accessed 20/07/2012
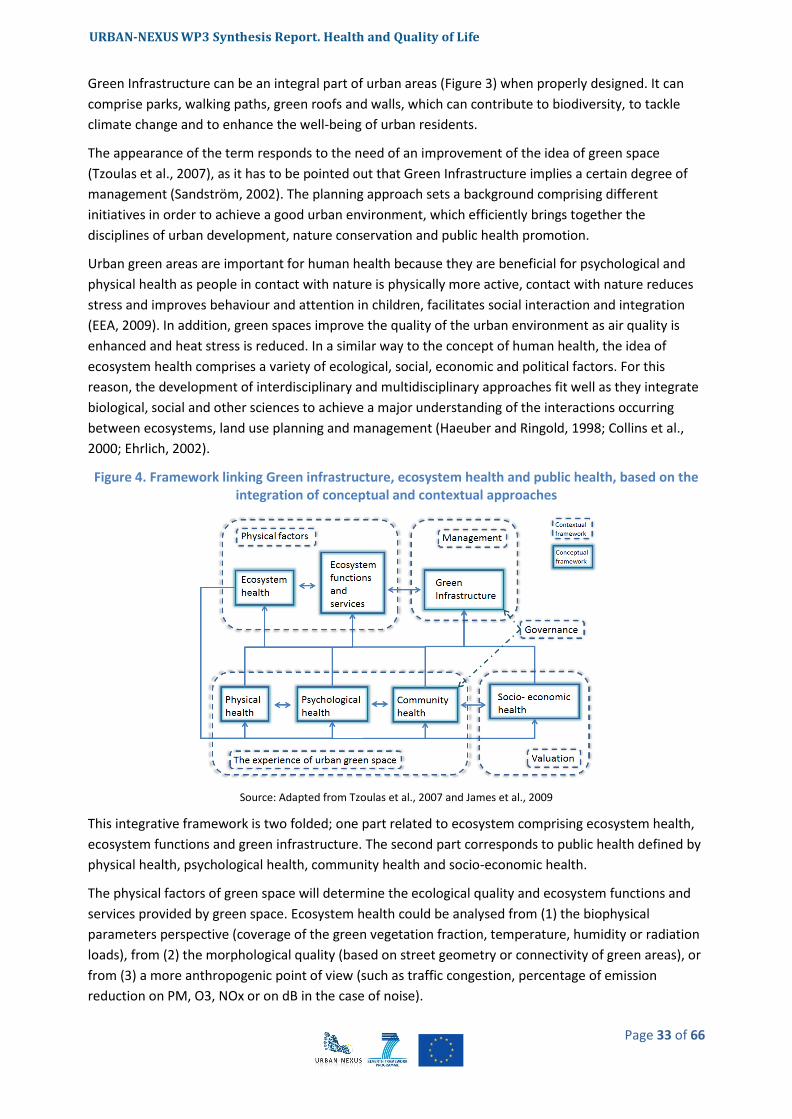
URBAN-NEXUS WP3 Synthesis Report. Health and Quality of Life
Page 33 of 66
Green Infrastructure can be an integral part of urban areas (Figure 3) when properly designed. It can
comprise parks, walking paths, green roofs and walls, which can contribute to biodiversity, to tackle
climate change and to enhance the well-being of urban residents.
The appearance of the term responds to the need of an improvement of the idea of green space
(Tzoulas et al., 2007), as it has to be pointed out that Green Infrastructure implies a certain degree of
management (Sandström, 2002). The planning approach sets a background comprising different
initiatives in order to achieve a good urban environment, which efficiently brings together the
disciplines of urban development, nature conservation and public health promotion.
Urban green areas are important for human health because they are beneficial for psychological and
physical health as people in contact with nature is physically more active, contact with nature reduces
stress and improves behaviour and attention in children, facilitates social interaction and integration
(EEA, 2009). In addition, green spaces improve the quality of the urban environment as air quality is
enhanced and heat stress is reduced. In a similar way to the concept of human health, the idea of
ecosystem health comprises a variety of ecological, social, economic and political factors. For this
reason, the development of interdisciplinary and multidisciplinary approaches fit well as they integrate
biological, social and other sciences to achieve a major understanding of the interactions occurring
between ecosystems, land use planning and management (Haeuber and Ringold, 1998; Collins et al.,
2000; Ehrlich, 2002).
Figure 4. Framework linking Green infrastructure, ecosystem health and public health, based on the integration of conceptual and contextual approaches
Source: Adapted from Tzoulas et al., 2007 and James et al., 2009
This integrative framework is two folded; one part related to ecosystem comprising ecosystem health,
ecosystem functions and green infrastructure. The second part corresponds to public health defined by
physical health, psychological health, community health and socio-economic health.
The physical factors of green space will determine the ecological quality and ecosystem functions and
services provided by green space. Ecosystem health could be analysed from (1) the biophysical
parameters perspective (coverage of the green vegetation fraction, temperature, humidity or radiation
loads), from (2) the morphological quality (based on street geometry or connectivity of green areas), or
from (3) a more anthropogenic point of view (such as traffic congestion, percentage of emission
reduction on PM, O3, NOx or on dB in the case of noise).
URBAN-NEXUS WP3 Synthesis Report. Health and Quality of Life
Page 34 of 66
Nevertheless, it is accepted by the scientific community that there are important gaps in urban green
space research (James et al., 2009). There is a need to encourage interdisciplinary and multidisciplinary
approaches, to develop joint initiatives across Europe, and a common framework for comparative
research.
However, it has been demonstrated that green infrastructures maintain the integrity of habitat
systems, contributes to ecosystem health in various ways, and are central to maintaining human health
(Tzoulas et al., 2007). From the management point of view, local measures can be implemented,
although it is important to involve national and European governments to assist on the different needs
and when plans requiring multi-level actions should be developed. A collaborative work involving a
variety of disciplines and at different spatial scales is needed to plan, design and manage green spaces,
although the management of urban green spaces normally falls on municipal or regional authorities
(Niemelä, 1999).
Governance can only be achieved when community participates in the process of planning and making
decisions about the green space. This fact will be highly related to community health and political
awareness. Governance can comprise decisions in the planning process, in the social use of the space
and the accessibility to it. The citizen perception of the green area will be determined by the capacity
degree of governance. Accordingly, this perception is related to the experience of the urban green
space; however it is more referred to the opportunity to come in contact with nature by each
individual. Citizen’s opinion is important to know the degree of satisfaction. The European Commission
(DG Regional Policy) has been using perception surveys to know people’s opinion about a range of
urban issues. In the survey undertaken on 2009, questions about people’s satisfaction with public parks
and gardens and with opportunities for outdoor recreation were introduced (EC, 2010b). The results
show that the majority of citizens were satisfied with the available green spaces in their cities pointing
out that the better satisfaction scores were for Malmo, Munich, Groningen, Cardiff and Luxemburg.
Valuation of green infrastructure requires a quantitative and qualitative economic valuation of both
physical and social ecosystem services provided by green areas. Further research is needed in this issue.
URBAN-NEXUS WP3 Synthesis Report. Health and Quality of Life
Page 35 of 66
From the social point of view, special care should be given to aspects related to the use of green space
in the development of deprived urban areas and to issues of accessibility of green areas and citizen
perception of green structures (K. De Ridder et al., 2004), as well as the involvement of the community
in the planning process of the green area.
There is strong evidence that indicates a lot of benefits linked to the use of the green spaces for both
physical and mental health and well-being. These include decreases in general health problems, blood
pressure, cholesterol and stress levels and improved perceived general health and resilience. Some
studies have even quantified the positive effect of green space. For instance, the chance of feeling
unhealthy is 1, 5 larger when living in environments with less green space than when living in an
environment with a lot of green space (Maas et al., 2006). Likewise, the chance that people visit their
general practitioner with complaints related to depression is 33% higher in living environments with
little greenspace than in living environments with lots of green space. Equal associations have been
found for diabetes and asthma (Maas et al., 2009)
The more often a person visits urban open green spaces, the less often he or she will report stress-
related illnesses. The distance to public green spaces seems to be of decisive importance, as is access to
a garden, in the form of a private garden or a green yard immediately adjacent to, for instance, an
apartment house. People do not usually compensate for lack of green environments in their own
residential area with more visits to public parks or urban forests. A garden can restore an elderly
person with low psycho-physiological balance to a state of better harmony. Health improvement seems
to be especially significant for the most susceptible (Grahn, 2005). There is also evidence that children
in day nurseries who have access to a varied outdoor environment with lots of nature elements are
healthier, can concentrate better and have better motor function (Grahn, 2006). Finally, it has been
demonstrated a link between the lack of green spaces and higher stress levels among people living in
“deprived" urban areas (Colding, 2011).
10
http://www.phenotype.eu/
Box 6.PHENOTYPE project10
Green space has been associated with a range of beneficial health effects in a number of experimental and epidemiological studies. These have mainly been carried out in north-western Europe and North America, but show that the potential positive health impacts of green space around the world could be large. People in expanding cities and new, developing ones, may benefit enormously health wise if sufficient green spaces are included.
However, we do not know exactly which kind of space is most beneficial and what is the underlying mechanism responsible for it. These could be related to physical activities and social contacts, reduction of stress, pollution, etc.
Questions such as the size of the green spaces to obtain an optimal benefit, the comparison of the benefits between small and large spaces, the aspects city planners need to take into consideration or the accessibility, availability of the different facilities or safety aspects are the type of questions that the Phenotype consortium will try to answer by conducting a number of studies in different parts of Europe. The wider geographical coverage is important to understand if, and to what extent, there are differences in availability of green spaces, perception and use in different areas in Europe (e.g. green space in the Netherlands is very different from the same kind of green spaces in Spain).
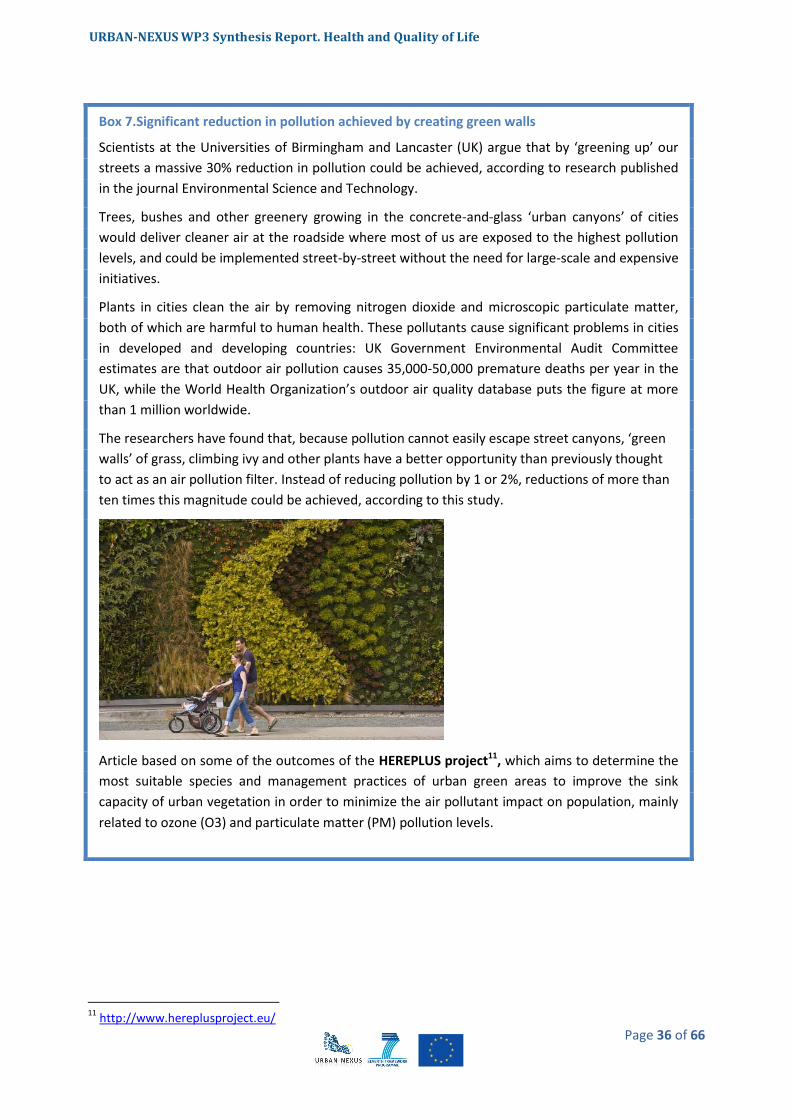
URBAN-NEXUS WP3 Synthesis Report. Health and Quality of Life
Page 36 of 66
11
http://www.hereplusproject.eu/
Box 7.Significant reduction in pollution achieved by creating green walls
Scientists at the Universities of Birmingham and Lancaster (UK) argue that by ‘greening up’ our
streets a massive 30% reduction in pollution could be achieved, according to research published
in the journal Environmental Science and Technology.
Trees, bushes and other greenery growing in the concrete-and-glass ‘urban canyons’ of cities
would deliver cleaner air at the roadside where most of us are exposed to the highest pollution
levels, and could be implemented street-by-street without the need for large-scale and expensive
initiatives.
Plants in cities clean the air by removing nitrogen dioxide and microscopic particulate matter,
both of which are harmful to human health. These pollutants cause significant problems in cities
in developed and developing countries: UK Government Environmental Audit Committee
estimates are that outdoor air pollution causes 35,000-50,000 premature deaths per year in the
UK, while the World Health Organization’s outdoor air quality database puts the figure at more
than 1 million worldwide.
The researchers have found that, because pollution cannot easily escape street canyons, ‘green
walls’ of grass, climbing ivy and other plants have a better opportunity than previously thought
to act as an air pollution filter. Instead of reducing pollution by 1 or 2%, reductions of more than
ten times this magnitude could be achieved, according to this study.
Article based on some of the outcomes of the HEREPLUS project11, which aims to determine the
most suitable species and management practices of urban green areas to improve the sink
capacity of urban vegetation in order to minimize the air pollutant impact on population, mainly
related to ozone (O3) and particulate matter (PM) pollution levels.
URBAN-NEXUS WP3 Synthesis Report. Health and Quality of Life
Page 37 of 66
4.1.2.2 The use of public spaces, including the green urban areas
Nevertheless, the use of other public areas and spaces additional to the green areas already described,
play an important role in terms of health and quality of life. People benefit from having good services
and green areas close to their homes. In the description of child-friendly environments by a Swedish
study, children in general mentioned proximity to schools, shops and amenities as often as green
spaces. This was not the case for adults, who mentioned green spaces more often than commercial or
public services as important environments for children´s development (Björklid, 2010).
In town centres and local neighbourhoods, public spaces provide social arenas for all kinds of people –
residents, workers, shoppers, visitors, and children at play. Different age groups tend to use public
spaces at different times of day and for different reasons. Older people and children in particular
appear to be influenced by the presence of other age groups. Older people are frequently absent from
public places, especially after dark. In addition to the social function of public spaces, some people use
them for privacy or to support a sense of territorial ownership – this particularly applies to groups of
young people and marginalised groups. Public spaces retain a democratic and civic function, alongside
commercially driven uses. Policy-makers can support this by encouraging diversity and harnessing
people’s tendency to ‘self-regulate’ to avoid conflict: over-regulated environments are not conducive to
vibrancy and integration (Holland et al, 2007).
Nature’s potentially positive effect on well-being may serve as an important resource for population
health. There is empirical evidence for different beneficial effects of natural environments on health
(Annerstedt, 2011).
Physical activity is associated with a number of positive health outcomes. Therefore, the design of
public space in order to facilitate physical activity might be an asset in healthy urban policies. However,
it has been stated that is difficult to change people’s behaviour towards a healthier lifestyle, such as
including more physical activity in their daily lives. Moreover, the benefits of increasing the physical
activity and therefore improving people’s mental health only arise if the green spaces are of high
quality, accessible and safe (WHO, 2012).
One example that gathers all those concepts is the case of urban vegetable gardens that assemble a
simultaneous sense of nature and society, rural and urban, labour and leisure, production and
consumption (Domene and Saurí, 2007). A healthy ecosystem produces fresh food, leisure and the
experience of rural nature. A community sense between users that also practise some exercise, feeling
personal fulfilment, which gives them physical and psychological benefits. And finally, there is also a
direct profit as the provision of fresh food, added to the social function of the urban vegetable garden,
with the final consequence of the improvement of environmental and cultural welfare.
URBAN-NEXUS WP3 Synthesis Report. Health and Quality of Life
Page 38 of 66
4.2 Socio-economic and cultural stressors and alleviators12
Should inequalities in health outcomes be recognised at the urban scale? How are environmental and
health impacts distributed throughout Europe? What is the trend in the socio-economic inequalities in
health in urban areas in Europe? Why focus on gender in urban health research?
4.2.1 Social equity, inequality, and vulnerable groups
Social health inequality refers to the differences in health opportunities and resources in relation to a
person's social class, gender, geographic area and race, which generally lead to a lower health status
for under-privileged groups (Marmot, 2007 and Mackenbach et al., 2008). Environmental and health
impacts are not equally distributed throughout Europe or within cities.
SUITE (Social and Urban Inclusion Through Housing) project has analysed how to integrate the three
pillars of sustainable housing: environmentally sound, economically viable and socially inclusive. The
main conclusions have been:
Social:
- Social sustainability of housing depends on a variety of factors, amongst which social mix is one
possible tool.
- To be successful, social mix policies should count on at least two conditions: political leadership
and funding.
- Applying social mix policies depends on a case-by-case assessment on whether it is necessary
and feasible.
- The Social Sustainability Workshop showcased useful tools to implement social mix (e.g. life-
cycle approach, planning and land use policies, compulsory purchase, minimum targets of social
housing, etc.).
- Robust contracting agreements are needed to create a lasting consensus about regeneration of
housing areas to develop a mixture of tenure, accommodation and people.
Economic:
- Despite the impact of the global economic crisis, housing affordability / housing exclusion have
been and is still a problem in most cities. Therefore, sustainable solutions are needed, which go
beyond contingent factors.
- In relation to housing exclusion: Case management in prevention from eviction; joined-up
services and strategies linking housing and communities; emphasis on the social aspects of
regeneration.
- Policy on homelessness in Newcastle was considered a good example, as well as the social work
carried out with young people.
- Some partners (in particular, those new member states) recognized that, while learning many
interesting things during the meeting, they face a severe lack of funding to put anything in
place.
12
It has been decided to analyse stressors and alleviators related to socio-economic and cultural aspects of health and quality of life in an interlinked way, due to the cross-cutting aspects identified in the different policies and projects reviewed.
URBAN-NEXUS WP3 Synthesis Report. Health and Quality of Life
Page 39 of 66
Environmental:
- Environmental sustainability is holistic, it includes more than energy efficiency, i.e. a wide array
of technical, urban and social measures.
- Higher initial investment can ‘pay off’; monitoring and evaluation shows positive effects.
- Some countries/cities are already mainstreaming high-grade solutions. There are numerous
information platforms.
- To be user-friendly, innovative solutions have to be accepted by residents. Early resident’s
involvement and easy descriptions are crucial.
- High-level new construction is easier. However, even modest solutions in the old stock have the
biggest overall impact (renovation, running costs, residents’ information and training).
The general results of the “Environmental health inequalities in Europe” (WHO 2012) state that the
unequal distribution of people’s exposure to environmental conditions is strongly related to a range of
sociodemographic determinants. It is strongly needed to identify population groups that are most
exposed or most vulnerable to environmental risks.
The main conclusions indicate that socioeconomic and demographic inequalities in risk exposure are
present in all countries. The report reviews inequalities related to housing, injuries, and the
environment, identifies gaps in evidence that still need to be filled, and suggests priority action to be
taken at both the subregional and the national level, bearing in mind those national variations.
To sum up, these are the main points of the report:
‒ Environmental health inequalities exist in all subregions and in all countries, and are most often
suffered by disadvantaged population groups.
‒ The magnitude of inequalities and the distribution of inequalities between advantaged and
disadvantaged population groups can be very diverse between countries and also depends on
the socioeconomic or demographic variable used for stratification.
‒ To allow reliable identification of the most relevant target groups and to understand better the
national inequality patterns and their causal mechanisms, more detailed environmental health
inequality reporting and assessment are needed at the national level.
‒ The evidence base for the assessment of environmental health inequalities needs to be
strengthened. This is valid for both data quantity (number of countries with data, number of
risk factors reported) and data quality (reliability, opportunities for stratification).
The assessment of housing-, injury- and environment-related inequalities shows that inequalities exist
throughout the WHO European Region. However, there are large differences between countries
regarding the magnitude of the inequalities and the most affected population groups. Depending on
the available data, inequality assessments were undertaken in relation to differences by sex, age,
income, relative poverty, household type, social position, employment, occupation, education and
difficulty paying bills. All of these sociodemographic determinants are found to be associated with
significant inequalities.
‒ Income and poverty-related inequalities are identified for noise exposure, exposure to second-
hand tobacco smoke at home and at work, and housing-related inequality indicators, where
they are most clearly expressed. Compared to the other determinants applied, income- and
poverty-related determinants display some of the strongest inequalities at subregional and
URBAN-NEXUS WP3 Synthesis Report. Health and Quality of Life
Page 40 of 66
national levels. Differences in national income levels are also associated with injury-related
fatalities, with low/middle income countries reporting higher mortality rates.
‒ Sex-related inequality is most strongly associated with injury, where male fatality rates are
often three times (and beyond) female fatality rates. Sex-related differences also appear in
relation to second-hand tobacco smoke exposure, yet play no important role for housing-
related risk factors.
‒ Age-related inequalities are present for injuries (especially falls) but differ in direction,
depending on the indicator. Age impacts are less prominent for the other inequality indicators.
‒ Household type-related inequalities in housing conditions are especially identified for single-
parent households, and increase when combined with low income and relative poverty factors.
‒ Data on inequalities by education, employment/occupation and self-assessed social position
are only available for some of the environment-related inequalities, but they show a diverse
inequality pattern: high education level is consistently associated with higher reported lack of
access to recreational and green areas, while employment/occupation level shows different
inequality patterns in exposure to second-hand smoke, with the direction of inequality
depending on sex and subregion.
Lower income households cannot afford homes in high price areas, and usually live in areas of dense
housing with less green and good quality public space, higher noise and air pollution levels or far away
from attractive urban areas. These segregation trends lead to temporary and more permanent unequal
developments, loss of social balance and cohesion. The resulting imbalances show themselves socio‑
economically in the exclusion of specific groups from employment and services like culture and
education, and by accumulation of socio‑economic and environmental problems in deprived areas.
Variability of social health inequalities exists both at European and regional and municipal scale. Recent
studies (Barceló et al.) states that there is evidence that geographic variability of social health
inequalities continues to exist even after individual risk factors have been taken into account. However,
relatively few studies have examined the contribution of exposure to air pollutants to those
inequalities. The geographic variability of inequalities in mortality and their associations with
socioeconomic and environmental inequalities in small areas of the metropolitan of Barcelona during
the period 1994 to 2003 has been studied. Furthermore, Mackenbach, J et al. 2008, found that
inequalities in mortality were small in some southern European countries and very large in most
countries in the eastern and Baltic regions. These variations among countries appeared to be
attributable in part to causes of death related to smoking or alcohol use or amenable to medical
intervention.
The ESPON13 Future Orientations for CIties (FOCI) Report “The Europe 2020 strategy towards a more
inclusive EU economy” proposes active inclusion strategies encompassing: social protection, addressing
labour market exclusion and tackling in-work poverty, access to quality services, such as healthcare,
childcare, housing. This project, in its final conclusions, states that "One of the main questions concerns
the apparent decoupling between social cohesion indicators and economic evolutions. Having reached
such a high development level, social cohesion in European cities is no more related to pure economic
wealth of the population".
Some projects address inequality at a scale of neighbourhood (see Box 8).
13
www.espon.eu
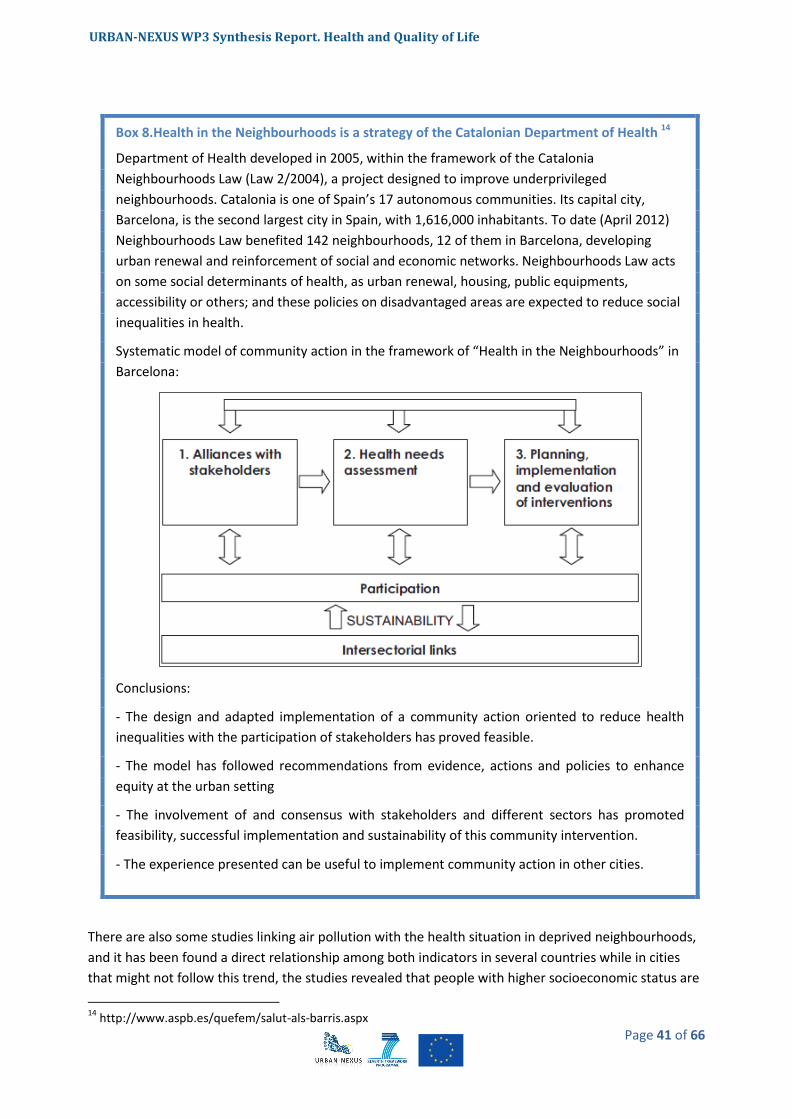
URBAN-NEXUS WP3 Synthesis Report. Health and Quality of Life
Page 41 of 66
There are also some studies linking air pollution with the health situation in deprived neighbourhoods,
and it has been found a direct relationship among both indicators in several countries while in cities
that might not follow this trend, the studies revealed that people with higher socioeconomic status are
14
http://www.aspb.es/quefem/salut-als-barris.aspx
Box 8.Health in the Neighbourhoods is a strategy of the Catalonian Department of Health 14
Department of Health developed in 2005, within the framework of the Catalonia
Neighbourhoods Law (Law 2/2004), a project designed to improve underprivileged
neighbourhoods. Catalonia is one of Spain’s 17 autonomous communities. Its capital city,
Barcelona, is the second largest city in Spain, with 1,616,000 inhabitants. To date (April 2012)
Neighbourhoods Law benefited 142 neighbourhoods, 12 of them in Barcelona, developing
urban renewal and reinforcement of social and economic networks. Neighbourhoods Law acts
on some social determinants of health, as urban renewal, housing, public equipments,
accessibility or others; and these policies on disadvantaged areas are expected to reduce social
inequalities in health.
Systematic model of community action in the framework of “Health in the Neighbourhoods” in
Barcelona:
Conclusions:
- The design and adapted implementation of a community action oriented to reduce health
inequalities with the participation of stakeholders has proved feasible.
- The model has followed recommendations from evidence, actions and policies to enhance
equity at the urban setting
- The involvement of and consensus with stakeholders and different sectors has promoted
feasibility, successful implementation and sustainability of this community intervention.
- The experience presented can be useful to implement community action in other cities.
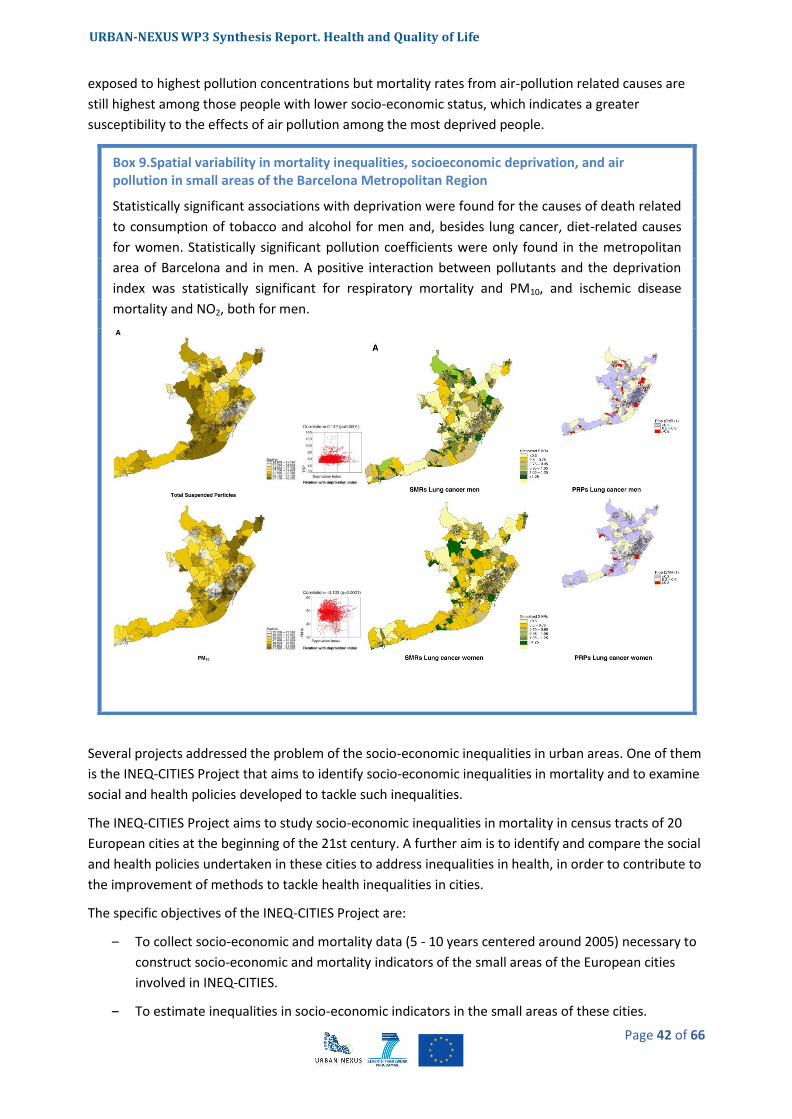
URBAN-NEXUS WP3 Synthesis Report. Health and Quality of Life
Page 42 of 66
exposed to highest pollution concentrations but mortality rates from air-pollution related causes are
still highest among those people with lower socio-economic status, which indicates a greater
susceptibility to the effects of air pollution among the most deprived people.
Several projects addressed the problem of the socio-economic inequalities in urban areas. One of them
is the INEQ-CITIES Project that aims to identify socio-economic inequalities in mortality and to examine
social and health policies developed to tackle such inequalities.
The INEQ-CITIES Project aims to study socio-economic inequalities in mortality in census tracts of 20
European cities at the beginning of the 21st century. A further aim is to identify and compare the social
and health policies undertaken in these cities to address inequalities in health, in order to contribute to
the improvement of methods to tackle health inequalities in cities.
The specific objectives of the INEQ-CITIES Project are:
‒ To collect socio-economic and mortality data (5 - 10 years centered around 2005) necessary to
construct socio-economic and mortality indicators of the small areas of the European cities
involved in INEQ-CITIES.
‒ To estimate inequalities in socio-economic indicators in the small areas of these cities.
Box 9.Spatial variability in mortality inequalities, socioeconomic deprivation, and air pollution in small areas of the Barcelona Metropolitan Region
Statistically significant associations with deprivation were found for the causes of death related
to consumption of tobacco and alcohol for men and, besides lung cancer, diet-related causes
for women. Statistically significant pollution coefficients were only found in the metropolitan
area of Barcelona and in men. A positive interaction between pollutants and the deprivation
index was statistically significant for respiratory mortality and PM10, and ischemic disease
mortality and NO2, both for men.
URBAN-NEXUS WP3 Synthesis Report. Health and Quality of Life
Page 43 of 66
‒ To estimate inequalities in mortality indicators across the small areas of the cities and to
analyse the relationships between mortality and socio-economic indicators at the small area
level.
‒ To estimate inequalities in avoidable mortality indicators across the small areas of the cities
and to analyse the relationships between avoidable mortality and socio-economic indicators at
the small area level.
‒ To describe mortality inequalities across small areas taking into account men and women
alongside children and working age populations.
‒ To collect information related to interventions to tackle inequalities in health that are
undertaken in the cities included in INEQ-CITIES and to describe the interventions reviewed.
‒ To collect information on social and health interventions to tackle inequalities in health that
use structural funds of the European Union in the cities included in INEQ-CITIES and to describe
the interventions reviewed.
‒ To make recommendations on the information and indicators necessary for monitoring and
tackling inequalities in health at the city level and to make recommendations on the policies to
tackle inequalities in health to be undertaken at the city and small area level.
Exposure to air toxins may be contributing to adverse health outcomes in urban neighbourhoods where
polluting land uses are often adjacent to housing, schools, and highly susceptible residents, such as
children with asthma (J. Corburn, 2007).
The key to improve health equity lies in optimizing urban settings for health. Urbanization can be a
positive determinant of health in the appropriate circumstances.
Segregation in public space is found to be a far more urgent issue in the context of urban segregation
than earlier recognized and urban form has a distinguishable influence on people’s everyday lives. The
research group on Spatial Analysis and Design (SAD) at the Royal Institute of Technology in Stockholm
(KTH), studied various aspects of the urban segregation in Sweden (Lars, 2006-2011) and found that
urban design practice is an important tool within anti-segregation initiatives.
4.2.2 Gender issues
Why focus on gender in urban health research? According to what several authors argue, a gender
analysis should be a part of the urban health research agenda in order to have a clearer conception of
how the urban environment influences and determines the health and well-being of both men and
women (UN-HABITAT 2012) (WHO, 2012).
Concerning gender inequalities in health, the WHO “European Health for All” strategy and the Health21
targets, state that gender issues should be considered in conjunction with those of differences in
socioeconomic groups. Women live longer than men (on average 5–7 years more in Western Europe
and about 7–15 years in eastern countries). Their double burden of work at home and in the workplace,
however, takes a heavy toll in terms of morbidity, and they are more likely than men to suffer from
depression and anxiety. Gender-specific issues such as maternal deaths are of grave concern in a
number of Member States. On the other hand, men are more prone to accidents, for example, and it is
the health of working-age men that has deteriorated most in Central and Eastern European and the
Newly Independent States (CEE/NIS) in recent years. Rape and wife battering, although grossly under-
reported, show alarming proportions in the large majority of countries; in fact, in industrialized
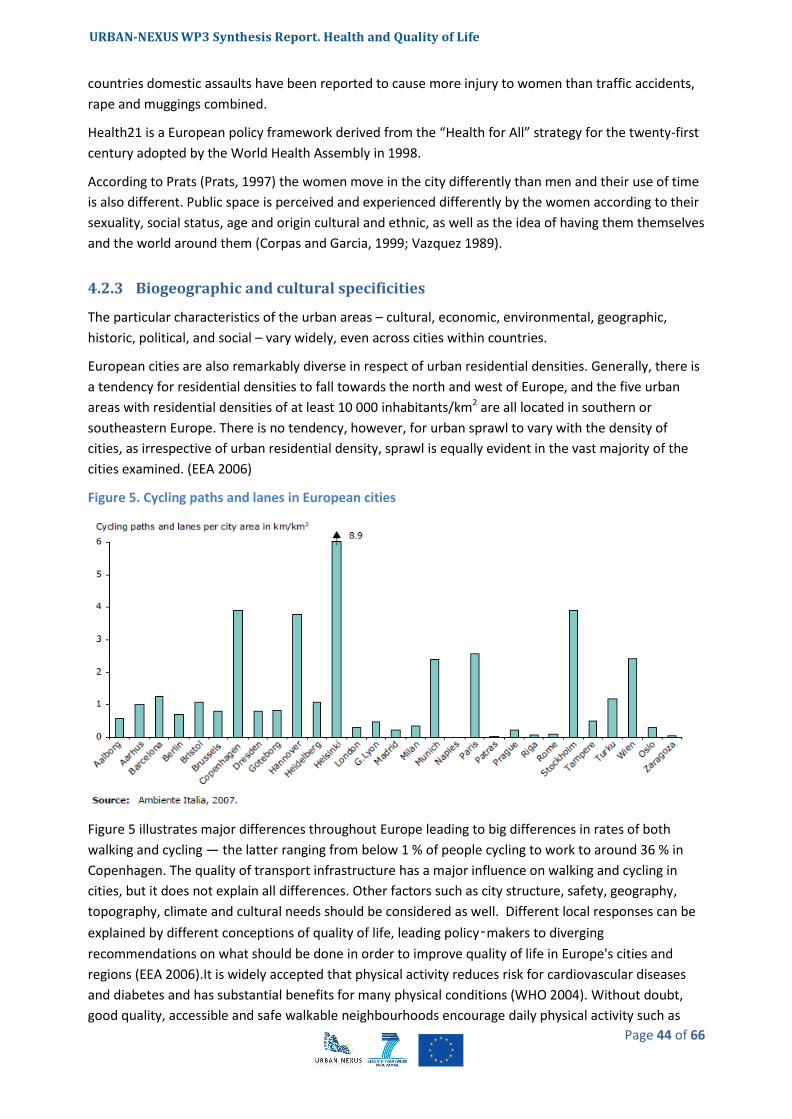
URBAN-NEXUS WP3 Synthesis Report. Health and Quality of Life
Page 44 of 66
countries domestic assaults have been reported to cause more injury to women than traffic accidents,
rape and muggings combined.
Health21 is a European policy framework derived from the “Health for All” strategy for the twenty-first
century adopted by the World Health Assembly in 1998.
According to Prats (Prats, 1997) the women move in the city differently than men and their use of time
is also different. Public space is perceived and experienced differently by the women according to their
sexuality, social status, age and origin cultural and ethnic, as well as the idea of having them themselves
and the world around them (Corpas and Garcia, 1999; Vazquez 1989).
4.2.3 Biogeographic and cultural specificities
The particular characteristics of the urban areas – cultural, economic, environmental, geographic,
historic, political, and social – vary widely, even across cities within countries.
European cities are also remarkably diverse in respect of urban residential densities. Generally, there is
a tendency for residential densities to fall towards the north and west of Europe, and the five urban
areas with residential densities of at least 10 000 inhabitants/km2 are all located in southern or
southeastern Europe. There is no tendency, however, for urban sprawl to vary with the density of
cities, as irrespective of urban residential density, sprawl is equally evident in the vast majority of the
cities examined. (EEA 2006)
Figure 5. Cycling paths and lanes in European cities
Figure 5 illustrates major differences throughout Europe leading to big differences in rates of both
walking and cycling — the latter ranging from below 1 % of people cycling to work to around 36 % in
Copenhagen. The quality of transport infrastructure has a major influence on walking and cycling in
cities, but it does not explain all differences. Other factors such as city structure, safety, geography,
topography, climate and cultural needs should be considered as well. Different local responses can be
explained by different conceptions of quality of life, leading policy‑makers to diverging
recommendations on what should be done in order to improve quality of life in Europe's cities and
regions (EEA 2006).It is widely accepted that physical activity reduces risk for cardiovascular diseases
and diabetes and has substantial benefits for many physical conditions (WHO 2004). Without doubt,
good quality, accessible and safe walkable neighbourhoods encourage daily physical activity such as
URBAN-NEXUS WP3 Synthesis Report. Health and Quality of Life
Page 45 of 66
walking and cycling. Consequently, these factors help combat the health impacts of sedentary lifestyles,
especially in relation to obesity and cardiovascular disease.
4.3 Urban structure and urban management types
What are the impacts of the urban form on health? How planning and design of the urban environment
can reduce health inequities and facilitate better health for all urban residents? What are the impacts of
different types of land use on health? How far open spaces and green areas influence health and well-
being?
Urban health problems are often too diverse and are difficult to be treated separately. The way in
which the urban environment is managed as a whole pays an important role in reducing health
problems and, consequently, improving people’s welfare and quality of life (EU, URBACT Programme,
2011).
There is strong evidence that multiplicity of factors, interacting between them, are affecting health
status in cities and this fact makes the analysis of such problems quite complex, as there is not usually a
single cause for a specific health problem.
The objective of this section is precisely to provide some hints on the different management policies
being applied in urban areas that have an influence on some of the health aspects dealt throughout the
whole report. Models of governance, policies based on a sustainable management of the city area,
transport, mobility and accessibility policies, etc. will be among the items that this section will discuss.
4.3.1 Shaping cities for health and quality of life
In the 19th century cities were insalubrious in so many ways that they came to be described in terms of
the risk of death run by their inhabitants15. The “sanitarist” approach to the problems related to city
spaces is best illustrated by the consolidation of hygienism. This branch of medicine started by
detecting risks of illness or death in the city and proceeded to analyse the urban landscape in terms of
health risk. The urban landscape, on the whole, is perceived as a high-risk scenario. The quality of the
air defined the quality of the urban landscape in terms of public health, and it is not surprising that the
hygienists were alarmed at the extreme urban density that characterised European industrial cities in
the 19th century. Technical solutions were applied in architecture to improve ventilation and air
circulation and, above all, to reduce urban density. The use of technology in urban risk management
culminated with the progressive implementation of the sewerage system over the past century
Moreover, in the second half of the 20th century most cities tried to reduce the air pollution caused by
burning coal for domestic heating. All these improvements increased life expectancy and lowered
infant mortality rates.
There are several factors influencing citizens’ well-being and their actual health, starting from the urban
structure itself, the type of buildings and neighbourhoods, city services and infrastructures, green
areas, etc. This chapter reviews the main facts regarding the relationship between the urban
environment form and configuration and health and quality of life.
15
According to Muñoz, in Generalitat de Catalunya, Departament de Salut (2008).
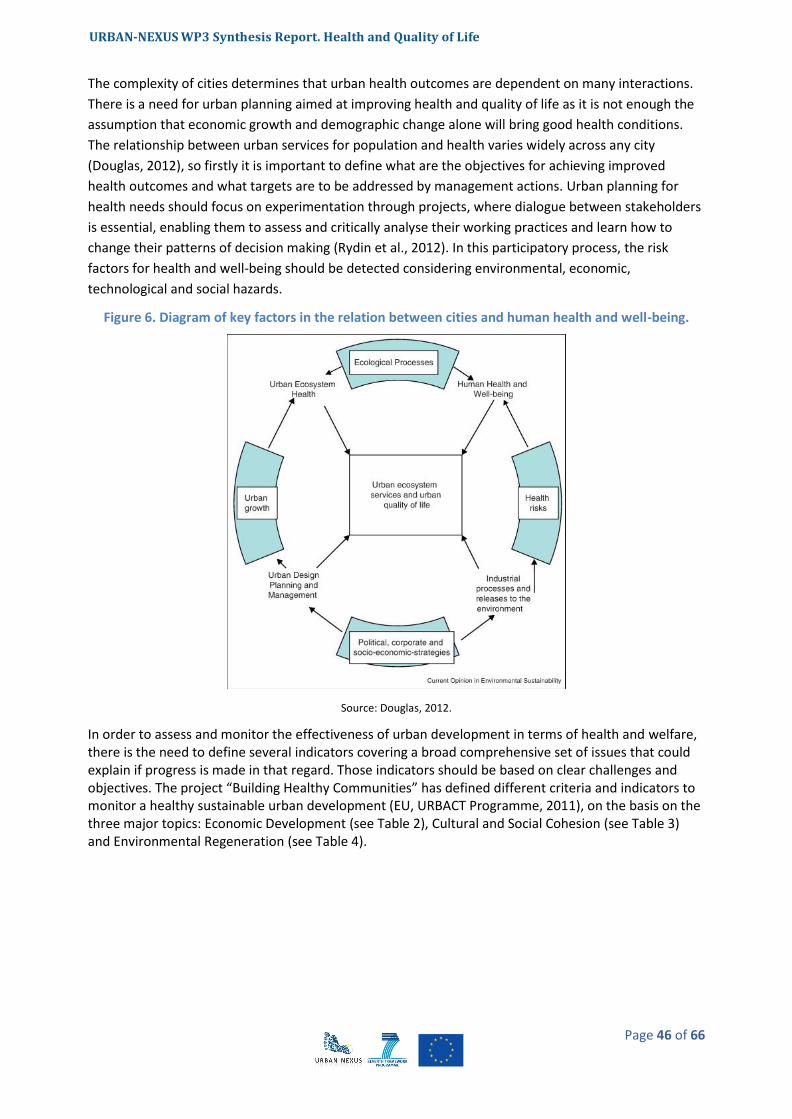
URBAN-NEXUS WP3 Synthesis Report. Health and Quality of Life
Page 46 of 66
The complexity of cities determines that urban health outcomes are dependent on many interactions.
There is a need for urban planning aimed at improving health and quality of life as it is not enough the
assumption that economic growth and demographic change alone will bring good health conditions.
The relationship between urban services for population and health varies widely across any city
(Douglas, 2012), so firstly it is important to define what are the objectives for achieving improved
health outcomes and what targets are to be addressed by management actions. Urban planning for
health needs should focus on experimentation through projects, where dialogue between stakeholders
is essential, enabling them to assess and critically analyse their working practices and learn how to
change their patterns of decision making (Rydin et al., 2012). In this participatory process, the risk
factors for health and well-being should be detected considering environmental, economic,
technological and social hazards.
Figure 6. Diagram of key factors in the relation between cities and human health and well-being.
Source: Douglas, 2012.
In order to assess and monitor the effectiveness of urban development in terms of health and welfare, there is the need to define several indicators covering a broad comprehensive set of issues that could explain if progress is made in that regard. Those indicators should be based on clear challenges and objectives. The project “Building Healthy Communities” has defined different criteria and indicators to monitor a healthy sustainable urban development (EU, URBACT Programme, 2011), on the basis on the three major topics: Economic Development (see Table 2), Cultural and Social Cohesion (see Table 3) and Environmental Regeneration (see Table 4).

URBAN-NEXUS WP3 Synthesis Report. Health and Quality of Life
Page 47 of 66
Table 2. Healthy sustainable urban development focusing on economic development.
Issues Objectives Indicators
Economic status and wealth
Improve the economic status and decrease the level of poverty
Income per capita Rate of poverty by gender Rate of poverty by ethnic group N. of births by teenage parent Dependency ratio
Attract more investments from other regions and from abroad
Rate of local investments Rate of international investments Economic activity composition
Employment and working conditions
Maintain high and stable levels of employment
Rate of local unemployment Labour force participation
Improve working conditions Level of employees satisfaction
Increase employability Level of attainment Rate of professional education compared to availability of jobs
Living conditions Reduce/Increase/Maintain the cost of living
Cost of living Cost of households per square metre
Source: EU, URBACT Programme, 2011

URBAN-NEXUS WP3 Synthesis Report. Health and Quality of Life
Page 48 of 66
Table 3. Healhty sustainable urban development focusing on cultural and social cohesion.
Issues Objectives Indicators
Demographic issues
Age Attract younger people population Improve elderly people living conditions
Aging index Rate of elderly people in need of social and health care Growth rate
Ethnicity Integrate the migrant population Density of migrants by country of origin Rate of family integration or reintegration
Family Improve family living conditions Rate of single parent families Rate of single teenager parents
Living Conditions issues
Housing
Improve the conditions of homeless
Rate of homeless people by ethnic group, gender and age
Rate of premature death among homeless people during winter or summer extreme weather events
Increase/maintain social homes Rate of social homes
Reduce the proportion of unfit (housing) stock
Rate of homes judged unfit to live in
Leisure time Increase leisure time opportunities for all
Level of attractiveness of parks, green areas and playgrounds
Improve access to recreational opportunities
Level of satisfaction of the cultural activities implemented by season in the area
Access to services
Improve health of the population Healthy Life Expectancy at birth
Improve accessibility to health services
Proximity of health services Level of satisfaction of the health services in the area Rate of health services accessible to disabled Proximity to pharmacies in the area Self reported health status
Improve accessibility to social services
Proximity of social services Level of satisfaction of the social services in the area Rate of people using social services by gender, age, ethnic group Rate of social services accessible to disabled Rate of voluntary organisations providing social services Rate of volunteers by age, gender and ethnic group
Improve accessibility to education and vocational training opportunities
Illiteracy rate Rate of education attainment by age, gender and ethnic group Proximity of schools by grade Proximity of vocational training venues Rate of schools accessible to disabled Rate of vocational training venues accessible to disabled
Improve/maintain accessibility to private services
Proximity of shops
Safety Increase the level of safety
Level of crime Rate of reported domestic violence Self reported level of safety by age, gender and ethnic group
Mental health and emotional well-being
Improve mental health, quality of life and emotional well-being
Rate of death by suicide
Rate of hospitalisations for intentional self‐harm Residents’ rating of how happy they are Residents’ satisfaction with their own lives in general Residents’ rating of experiencing negative stress
over the past 12 months
Source: Adapted from EU, URBACT Programme, 2011
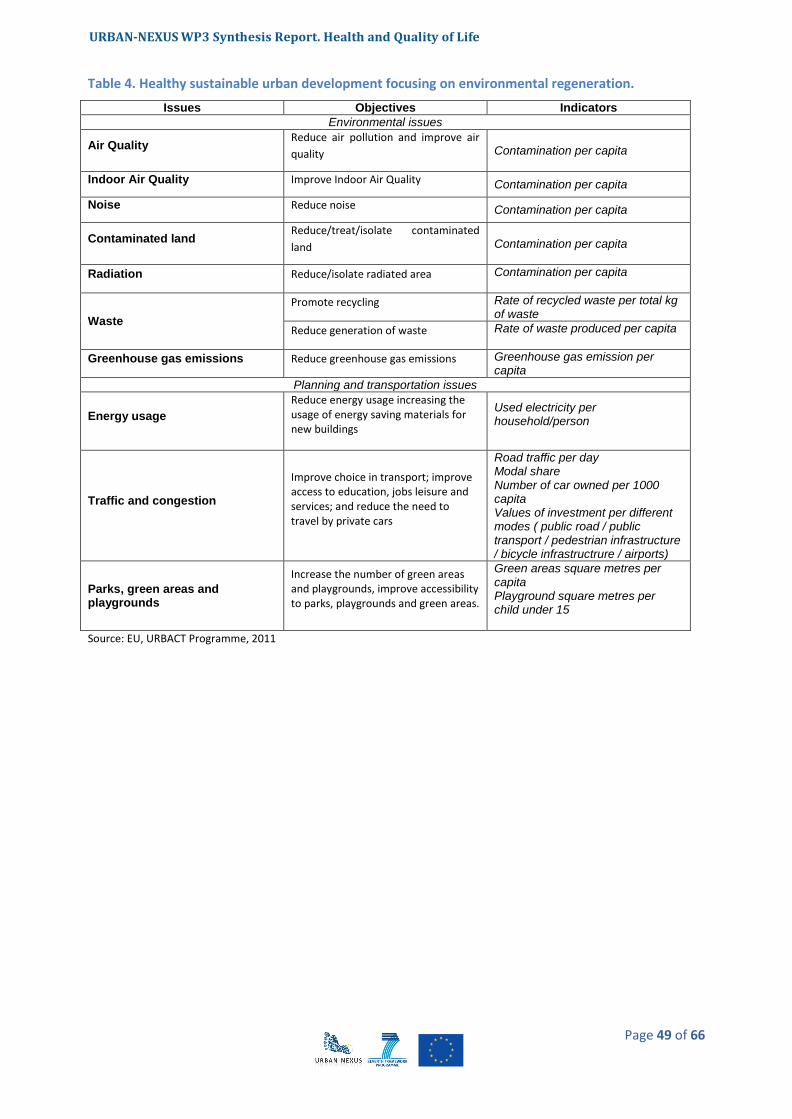
URBAN-NEXUS WP3 Synthesis Report. Health and Quality of Life
Page 49 of 66
Table 4. Healthy sustainable urban development focusing on environmental regeneration.
Issues Objectives Indicators
Environmental issues
Air Quality Reduce air pollution and improve air
quality Contamination per capita
Indoor Air Quality Improve Indoor Air Quality Contamination per capita
Noise Reduce noise Contamination per capita
Contaminated land Reduce/treat/isolate contaminated
land Contamination per capita
Radiation Reduce/isolate radiated area Contamination per capita
Waste
Promote recycling Rate of recycled waste per total kg of waste
Reduce generation of waste Rate of waste produced per capita
Greenhouse gas emissions Reduce greenhouse gas emissions Greenhouse gas emission per capita
Planning and transportation issues
Energy usage
Reduce energy usage increasing the usage of energy saving materials for new buildings
Used electricity per household/person
Traffic and congestion
Improve choice in transport; improve access to education, jobs leisure and services; and reduce the need to travel by private cars
Road traffic per day Modal share Number of car owned per 1000 capita Values of investment per different modes ( public road / public transport / pedestrian infrastructure / bicycle infrastructrure / airports)
Parks, green areas and playgrounds
Increase the number of green areas and playgrounds, improve accessibility to parks, playgrounds and green areas.
Green areas square metres per capita Playground square metres per child under 15
Source: EU, URBACT Programme, 2011
URBAN-NEXUS WP3 Synthesis Report. Health and Quality of Life
Page 50 of 66
4.3.2 Sustainable management and good governance
Taking into account that most of Europeans are urban dwellers, cities are of enormous economic, social
and environmental importance to Europe. They are centres of innovation and creativity, driving the
economy and creating the necessary wealth to raise the living standards of citizens. At the same time,
cities are also our main repositories of learning, culture and art. However, cities also present some of
the most difficult and pressing economic, environmental and social challenges for society. These
include dealing with inner-city decay, pollution, and economic stagnation in more deprived urban
areas.
The concept of sustainability applied to urban management is understood as a global approach for all
urban policies, in order to ensure a better future for citizens in terms of job opportunities, environment
safety, worthy housing and, in short, well-being and quality of life.
16
http://www.spahg.org.uk/
Box 10.Spatial Planning and Health 16
SPAHG is a group of planning and health experts: academics, practitioners and community
representatives, seeking to improve public health through the positive use of spatial planning. The
group aims to study, promote and disseminate knowledge on the relationship between spatial
planning and health, and to promote policies and action based upon evidence.
Spatial planning has a clear and strong influence on healthy choices made by individuals, and can be
seen as a force for social justice in positively addressing the issues highlighted below.
Evidence suggests that the following issues impact on physical and mental health:
- The location, density and mix of land uses
- Street layout and connectivity
- Access to public services, employment, local fresh food and other services
- Safety and security
- Open and green space
- Affordable and energy efficient housing
- Air quality and noise
- Extreme weather events and a changing climate
- Community interaction
- Transport
Formulating and implementing planning policies and development proposals based on the evidence
of how they affect human health is likely to improve our health. Building health into our urban and
our rural environments (or designing out unhealthy factors – we can ‘design in’ health, just as we try
to ‘design out’ crime) is a vital step towards delivering longer term improvements in health across
the whole of society. This can be as important as investment in medical interventions. Healthcare is
a vital service but it often treats the symptoms rather than the causes of health inequalities and poor
health. By building health into planning we seek to address some of the causes of poor health.
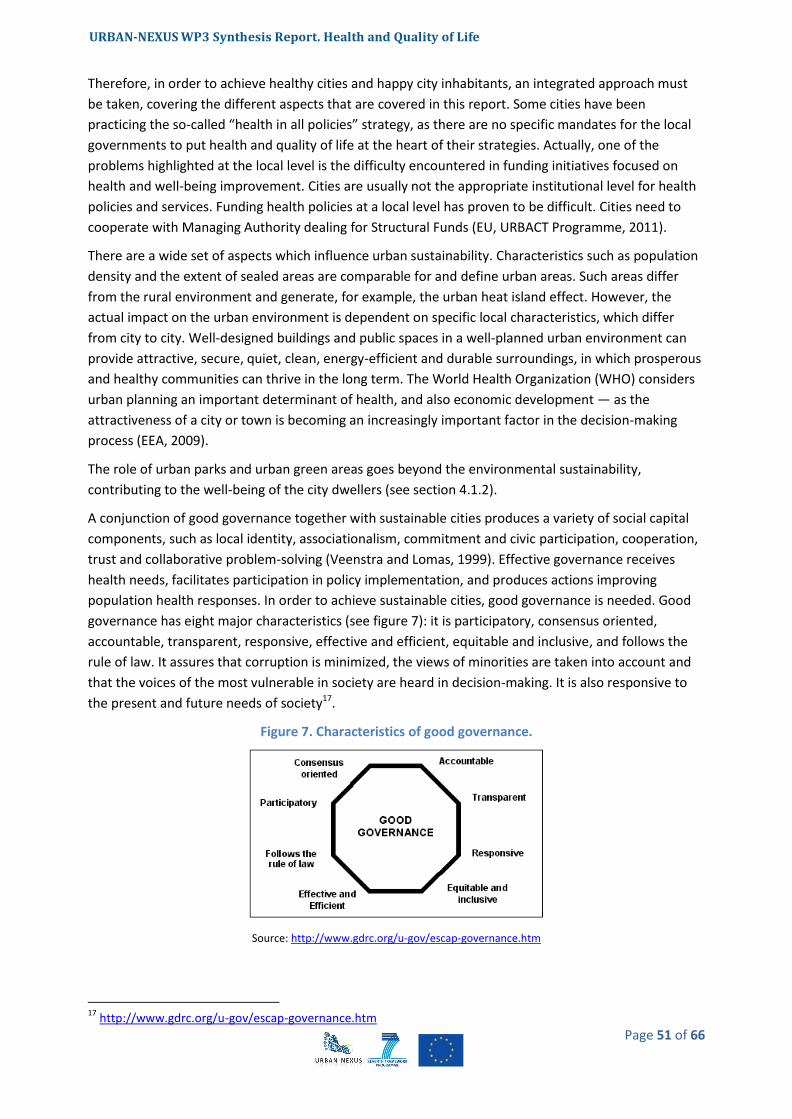
URBAN-NEXUS WP3 Synthesis Report. Health and Quality of Life
Page 51 of 66
Therefore, in order to achieve healthy cities and happy city inhabitants, an integrated approach must
be taken, covering the different aspects that are covered in this report. Some cities have been
practicing the so-called “health in all policies” strategy, as there are no specific mandates for the local
governments to put health and quality of life at the heart of their strategies. Actually, one of the
problems highlighted at the local level is the difficulty encountered in funding initiatives focused on
health and well-being improvement. Cities are usually not the appropriate institutional level for health
policies and services. Funding health policies at a local level has proven to be difficult. Cities need to
cooperate with Managing Authority dealing for Structural Funds (EU, URBACT Programme, 2011).
There are a wide set of aspects which influence urban sustainability. Characteristics such as population
density and the extent of sealed areas are comparable for and define urban areas. Such areas differ
from the rural environment and generate, for example, the urban heat island effect. However, the
actual impact on the urban environment is dependent on specific local characteristics, which differ
from city to city. Well-designed buildings and public spaces in a well-planned urban environment can
provide attractive, secure, quiet, clean, energy-efficient and durable surroundings, in which prosperous
and healthy communities can thrive in the long term. The World Health Organization (WHO) considers
urban planning an important determinant of health, and also economic development — as the
attractiveness of a city or town is becoming an increasingly important factor in the decision-making
process (EEA, 2009).
The role of urban parks and urban green areas goes beyond the environmental sustainability,
contributing to the well-being of the city dwellers (see section 4.1.2).
A conjunction of good governance together with sustainable cities produces a variety of social capital
components, such as local identity, associationalism, commitment and civic participation, cooperation,
trust and collaborative problem-solving (Veenstra and Lomas, 1999). Effective governance receives
health needs, facilitates participation in policy implementation, and produces actions improving
population health responses. In order to achieve sustainable cities, good governance is needed. Good
governance has eight major characteristics (see figure 7): it is participatory, consensus oriented,
accountable, transparent, responsive, effective and efficient, equitable and inclusive, and follows the
rule of law. It assures that corruption is minimized, the views of minorities are taken into account and
that the voices of the most vulnerable in society are heard in decision-making. It is also responsive to
the present and future needs of society17.
Figure 7. Characteristics of good governance.
Source: http://www.gdrc.org/u-gov/escap-governance.htm
17
http://www.gdrc.org/u-gov/escap-governance.htm
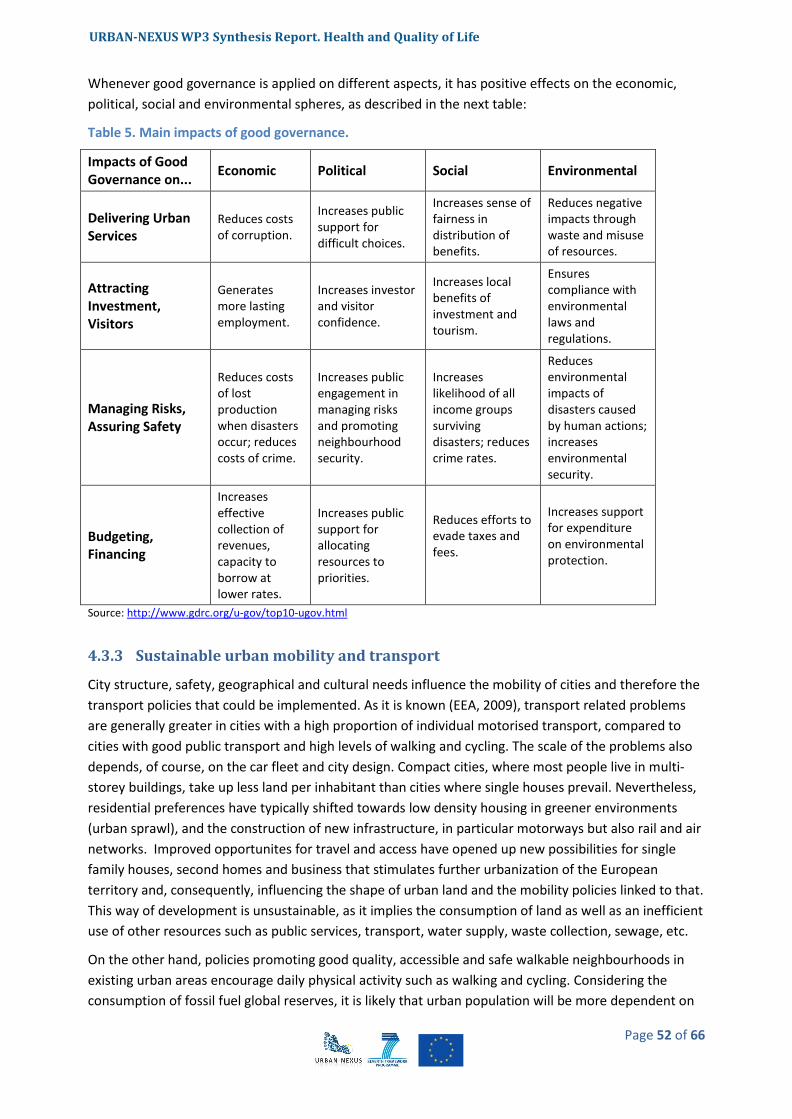
URBAN-NEXUS WP3 Synthesis Report. Health and Quality of Life
Page 52 of 66
Whenever good governance is applied on different aspects, it has positive effects on the economic,
political, social and environmental spheres, as described in the next table:
Table 5. Main impacts of good governance.
Impacts of Good Governance on...
Economic Political Social Environmental
Delivering Urban Services
Reduces costs of corruption.
Increases public support for difficult choices.
Increases sense of fairness in distribution of benefits.
Reduces negative impacts through waste and misuse of resources.
Attracting Investment, Visitors
Generates more lasting employment.
Increases investor and visitor confidence.
Increases local benefits of investment and tourism.
Ensures compliance with environmental laws and regulations.
Managing Risks, Assuring Safety
Reduces costs of lost production when disasters occur; reduces costs of crime.
Increases public engagement in managing risks and promoting neighbourhood security.
Increases likelihood of all income groups surviving disasters; reduces crime rates.
Reduces environmental impacts of disasters caused by human actions; increases environmental security.
Budgeting, Financing
Increases effective collection of revenues, capacity to borrow at lower rates.
Increases public support for allocating resources to priorities.
Reduces efforts to evade taxes and fees.
Increases support for expenditure on environmental protection.
Source: http://www.gdrc.org/u-gov/top10-ugov.html
4.3.3 Sustainable urban mobility and transport
City structure, safety, geographical and cultural needs influence the mobility of cities and therefore the
transport policies that could be implemented. As it is known (EEA, 2009), transport related problems
are generally greater in cities with a high proportion of individual motorised transport, compared to
cities with good public transport and high levels of walking and cycling. The scale of the problems also
depends, of course, on the car fleet and city design. Compact cities, where most people live in multi-
storey buildings, take up less land per inhabitant than cities where single houses prevail. Nevertheless,
residential preferences have typically shifted towards low density housing in greener environments
(urban sprawl), and the construction of new infrastructure, in particular motorways but also rail and air
networks. Improved opportunites for travel and access have opened up new possibilities for single
family houses, second homes and business that stimulates further urbanization of the European
territory and, consequently, influencing the shape of urban land and the mobility policies linked to that.
This way of development is unsustainable, as it implies the consumption of land as well as an inefficient
use of other resources such as public services, transport, water supply, waste collection, sewage, etc.
On the other hand, policies promoting good quality, accessible and safe walkable neighbourhoods in
existing urban areas encourage daily physical activity such as walking and cycling. Considering the
consumption of fossil fuel global reserves, it is likely that urban population will be more dependent on
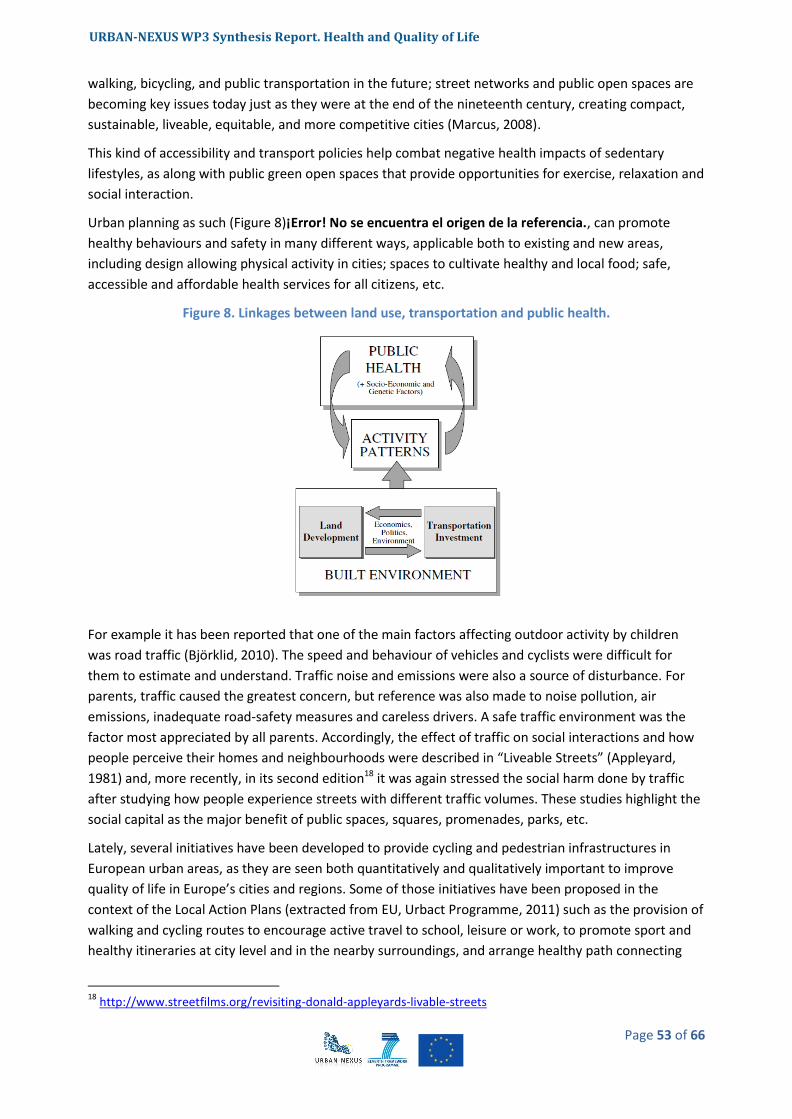
URBAN-NEXUS WP3 Synthesis Report. Health and Quality of Life
Page 53 of 66
walking, bicycling, and public transportation in the future; street networks and public open spaces are
becoming key issues today just as they were at the end of the nineteenth century, creating compact,
sustainable, liveable, equitable, and more competitive cities (Marcus, 2008).
This kind of accessibility and transport policies help combat negative health impacts of sedentary
lifestyles, as along with public green open spaces that provide opportunities for exercise, relaxation and
social interaction.
Urban planning as such (Figure 8)¡Error! No se encuentra el origen de la referencia., can promote
healthy behaviours and safety in many different ways, applicable both to existing and new areas,
including design allowing physical activity in cities; spaces to cultivate healthy and local food; safe,
accessible and affordable health services for all citizens, etc.
Figure 8. Linkages between land use, transportation and public health.
For example it has been reported that one of the main factors affecting outdoor activity by children
was road traffic (Björklid, 2010). The speed and behaviour of vehicles and cyclists were difficult for
them to estimate and understand. Traffic noise and emissions were also a source of disturbance. For
parents, traffic caused the greatest concern, but reference was also made to noise pollution, air
emissions, inadequate road-safety measures and careless drivers. A safe traffic environment was the
factor most appreciated by all parents. Accordingly, the effect of traffic on social interactions and how
people perceive their homes and neighbourhoods were described in “Liveable Streets” (Appleyard,
1981) and, more recently, in its second edition18 it was again stressed the social harm done by traffic
after studying how people experience streets with different traffic volumes. These studies highlight the
social capital as the major benefit of public spaces, squares, promenades, parks, etc.
Lately, several initiatives have been developed to provide cycling and pedestrian infrastructures in
European urban areas, as they are seen both quantitatively and qualitatively important to improve
quality of life in Europe’s cities and regions. Some of those initiatives have been proposed in the
context of the Local Action Plans (extracted from EU, Urbact Programme, 2011) such as the provision of
walking and cycling routes to encourage active travel to school, leisure or work, to promote sport and
healthy itineraries at city level and in the nearby surroundings, and arrange healthy path connecting
18
http://www.streetfilms.org/revisiting-donald-appleyards-livable-streets
URBAN-NEXUS WP3 Synthesis Report. Health and Quality of Life
Page 54 of 66
past and future such as promoting a cultural path between historical and industrial areas, among
others.
19
http://dotherightmix.eu/
Box 11. Do the Right Mix Sustainable Urban Mobility19
- The European Commission's Sustainable Urban Mobility campaign represents a three-year initiative
aiming to support sustainable urban mobility campaigners in 31 countries. The central objective of
this new campaign is to promote the advantages of combining different modes of transportation.
Commission Vice-President Siim Kallas, responsible for transport, said: "We want to encourage
people to vary the way they move around the city - so our slogan invites people to "Do the Right
Mix". This campaign will give a boost to the local, regional, and national awareness-raising actions
that play a crucial role in creating and promoting this 21st century culture of urban mobility. It is vital
to promote diversity in our daily mobility choices."
- In addition, the campaign includes initiatives such as an award for European cities based on their
sustainable urban mobility plans; and coordinated awareness-raising activities and events in 31
participating countries: EU Member States, EEA Member States (Iceland, Liechtenstein and Norway)
and Croatia.
- The European Commission’s Sustainable Urban Mobility campaign is linked to the European
Mobility Week, which runs from 16 to 22 September every year and culminates in the ’In Town
Without My Car!’ day. The campaign is managed by the Directorate-General for Mobility and
Transport and funded through the Intelligent Energy Europe Programme – the EU’s support
programme for non-technological actions in the field of energy efficiency and renewable energy
sources.
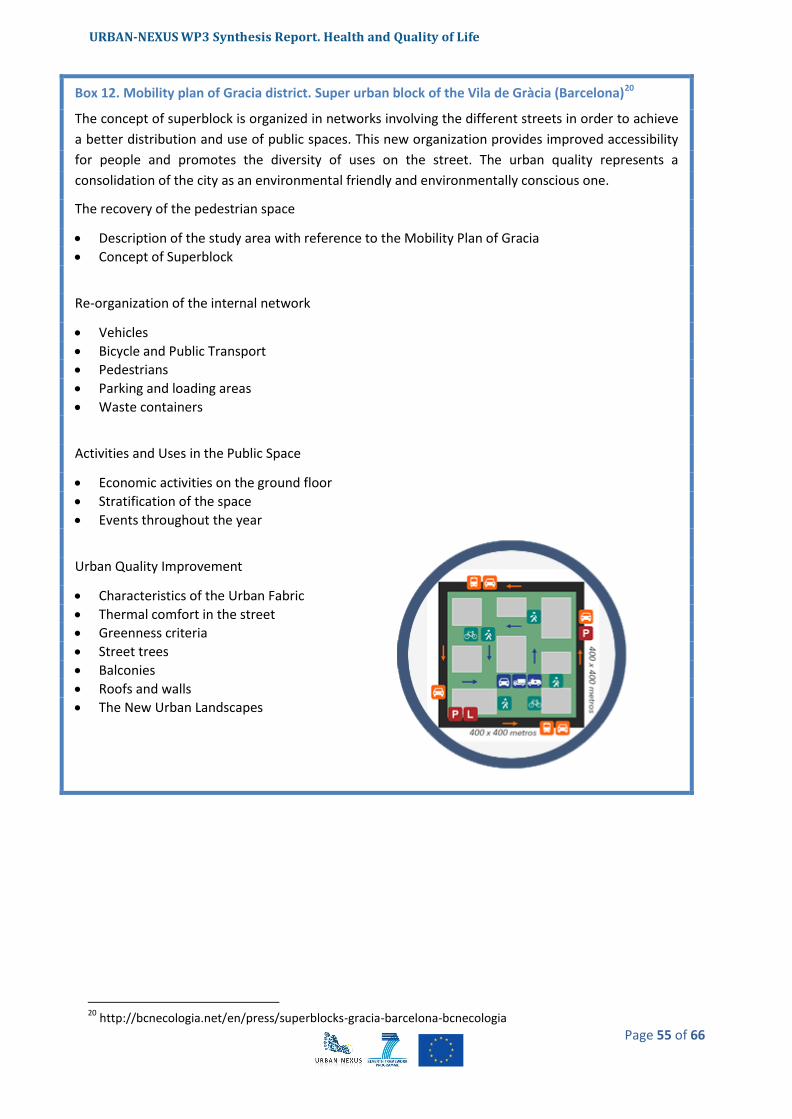
URBAN-NEXUS WP3 Synthesis Report. Health and Quality of Life
Page 55 of 66
20
http://bcnecologia.net/en/press/superblocks-gracia-barcelona-bcnecologia
Box 12. Mobility plan of Gracia district. Super urban block of the Vila de Gràcia (Barcelona)20
The concept of superblock is organized in networks involving the different streets in order to achieve
a better distribution and use of public spaces. This new organization provides improved accessibility
for people and promotes the diversity of uses on the street. The urban quality represents a
consolidation of the city as an environmental friendly and environmentally conscious one.
The recovery of the pedestrian space
Description of the study area with reference to the Mobility Plan of Gracia
Concept of Superblock
Re-organization of the internal network
Vehicles
Bicycle and Public Transport
Pedestrians
Parking and loading areas
Waste containers
Activities and Uses in the Public Space
Economic activities on the ground floor
Stratification of the space
Events throughout the year
Urban Quality Improvement
Characteristics of the Urban Fabric
Thermal comfort in the street
Greenness criteria
Street trees
Balconies
Roofs and walls
The New Urban Landscapes

URBAN-NEXUS WP3 Synthesis Report. Health and Quality of Life
Page 56 of 66
4.3.4 Urban structure and built environment
More than two thirds of the European population lives in urban areas (EEA, 2009). About 1600
settlements in Europe are considered functional urban areas, with over 50 000 inhabitants (Figure 9),
the 75 largest and most important ones are identified as Metropolitan European Growth Areas.
Figure 9. Number of cities greater than 50 000 inhabitants by country
Urbanisation is evident in many different forms, sometimes in concentrated compact centres but
typically in low density developments associated with planned or spontaneous urban sprawl21.
From the nineties, several scientific articles highlight the existing link between the urban form in
relation not only to a certain degree of urban air quality but more importantly, to achieve a sustainable
living and working environments in the future (L.O. Marquez and N.C. Smith, 1999). Cities are the
centre of human activity, the primary consumer of resources and the major producer of waste. The
integration of different models that study the structure of the cities with models that measure the
quality of the environment has become a crucial exercise to plan the type of urban development that is
wished to be achieved.
The way city dwellers prefer to live, enabled by the organisation and design of their city, influences the
urban environment in many ways apart from the overall consumption patterns (EEA, 2009).
The following list shows the key features of a healthy city (WHO, Healthy cities project):
- A clean, safe, high quality environment (including adequate and affordable housing)
- A stable ecosystem
- A strong, mutually supportive, and non-exploitative community
- Much public participation in and control over the decisions affecting life, health, and
well-being
- The provision of basic needs (food, water, shelter, income, safety, work) for all people
21
PBL, 2008 and 2009, cited in EEA (2009)
URBAN-NEXUS WP3 Synthesis Report. Health and Quality of Life
Page 57 of 66
- Access to a wide range of experiences and resources, with the possibility of multiple
contacts, interaction, and communication
- A diverse, vital, and innovative economy
- Encouragement of connections with the past, with the varied cultural and biological
heritage, and with other groups and individuals
- A city form (design) that is compatible with and enhances the preceding features of
behaviour
- An optimum level of appropriate public health and care services accessible to all
- A high health status (both a high positive health status and a low disease status)
The physical space where we live in directly affects our quality of life. The type of housing,
neighbourhood and, to less extent, city and metropolitan area are crucial aspects of well-being
amongst citizens. For instance, Nordström (2008) has confirmed the importance of physical space to 12
year old children in agreement with environment psychology theory. When children have access to
space they behave very differently than when they have little access to space. They relate differently
socially and across gender and they move around much more when there is space that they can use,
demonstrating that space might have an intrinsic value to children (Nordström, 2008). Moreover,
several studies published in the last 5 years, from the USA, Australia, Europe, Canada, and Japan
demonstrate strong associations between the built environment, health status, and health behaviours
(GCPH, 2007).
We can see also the effects that redeveloping a deprived neighbourhood can have on individual health.
Redevelopment in Hovsjö improved well-being such that the proportion of respondents who stated
that it was “good” or “very good” to live in Hovsjö more than doubled between 2008 and 2012.
Furthermore, the redevelopment seemed to improve individual health (Sundquist, 2012).
Recently many projects and initiatives have been launched with the aim of building better cities. This is
the case of the project that has just started, named “City and protocol”22. This initiative led by the City
Council of Barcelona begins with the participation of the following cities: Amsterdam, Barcelona,
Boston, Buenos Aires, Busan, Copenhagen, Derby, Dublin, Genoa, Helsinki, Hyderabad, Istanbul, Lima,
Livorno, Lion, Maputo, Medellin, Milan, Moscow, Nairobi, Nueva York, Niza, Paris, Quito, Roma, San
Francisco, Seoul, Taipei, Turin, Uppsala, Venetia, Vienna, Yokohama.
The cities and 70% of the world's population living in them, have common challenges that need to find
a shared language and formulas for flowing ideas, indicators, technological solutions, management
models. This is the aim of the City Protocol project. Certainly, it remains to draw exactly what the
project means, how to approach and how far to go. City protocol will enable better understanding and
cooperation among the different actors (city council, academia, institutions, companies, and society)
involved in the development of a more sustainable, efficient, cohesive, innovative and smart city. It will
deliver benefits within and between cities, by addressing cities in an integrated systemic way.
22
http://cityprotocol.org/index.html
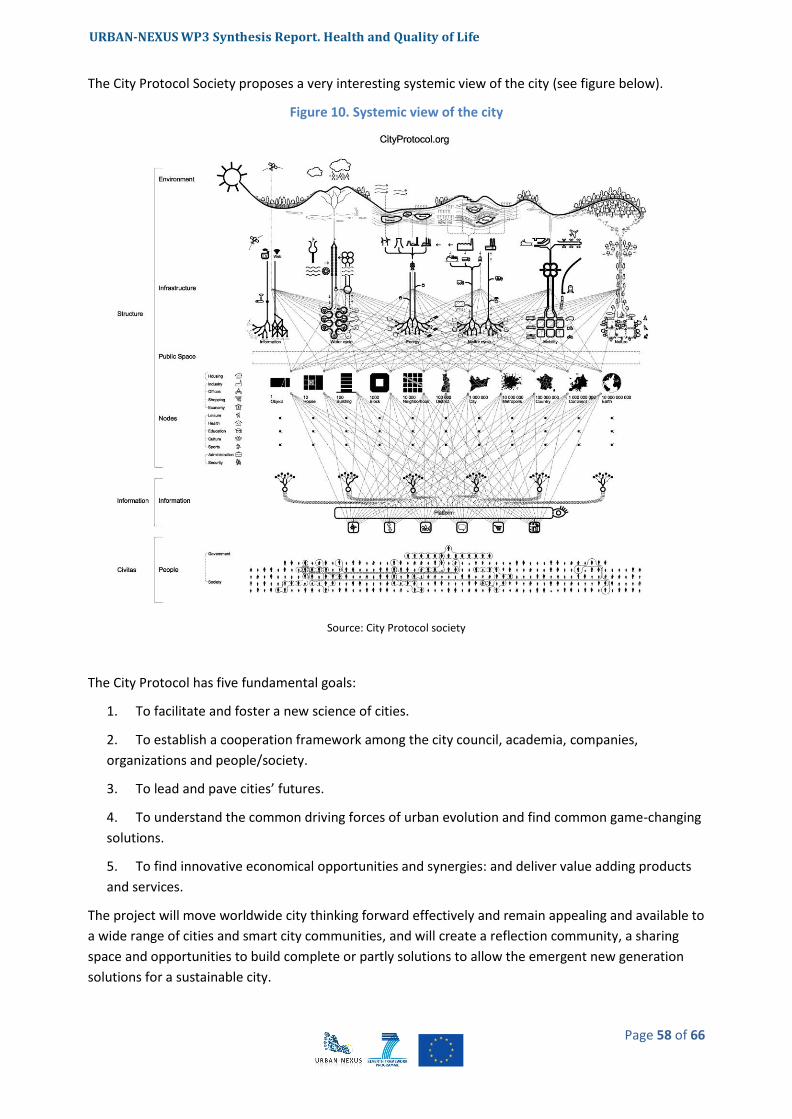
URBAN-NEXUS WP3 Synthesis Report. Health and Quality of Life
Page 58 of 66
The City Protocol Society proposes a very interesting systemic view of the city (see figure below).
Figure 10. Systemic view of the city
Source: City Protocol society
The City Protocol has five fundamental goals:
1. To facilitate and foster a new science of cities.
2. To establish a cooperation framework among the city council, academia, companies,
organizations and people/society.
3. To lead and pave cities’ futures.
4. To understand the common driving forces of urban evolution and find common game-changing
solutions.
5. To find innovative economical opportunities and synergies: and deliver value adding products
and services.
The project will move worldwide city thinking forward effectively and remain appealing and available to
a wide range of cities and smart city communities, and will create a reflection community, a sharing
space and opportunities to build complete or partly solutions to allow the emergent new generation
solutions for a sustainable city.
URBAN-NEXUS WP3 Synthesis Report. Health and Quality of Life
Page 59 of 66
5 About urban nexus
URBAN-NEXUS enables knowledge transfer and stimulates dialogue to
form long-lasting partnerships amongst researchers, practitioners, policy
makers, civil society and SMEs. It promotes integrated approaches to
sustainable urban development.
URBAN-NEXUS is a Coordination and Support Action funded by European
Framework Programme 7 from 1st September 2011 until 31st August
2014.
[email protected] www.urban-nexus.eu
The project consortium
Co-ordinator Netherlands Institute for City Innovation Studies Netherlands
Mistra Urban Futures Chalmers University of Technology, Sweden
Sniffer, UK
EUROCITIES, Europe
UAB – Autonomous University of Barcelona, Catalunya
ICLEI – Sustainability
Management and
Urban Governance,
Europe
FORMAS – Swedish Research Council for Environment and Spatial Planning, Sweden
ADVANCITY French
competitiveness cluster
on ecotechnologies and
sustainable cities,
France
UWE- University of the West England, UK
SIRS – Information
System and Spatial
Reference, France
ASDE – Agency for Sustainable development and Euro-Integration, Bulgaria
Bauhaus Dessau Foundation, Germany
REC – Regional REC Environmental Centre for Central and Eastern Europe, Hungary

URBAN-NEXUS Draft WP3 Synthesis Report. Health and Quality of Life
Page 60 of 66

URBAN-NEXUS Draft WP3 Synthesis Report. Health and Quality of Life
Page 61 of 66
6 References
Annersted, M. (2011). Nature and public health. Swedish Agricultural University, Alnarp.
Barceló, M. A., Saez, M., Saurina, C. (2009). Spatial variability in mortality inequalities, socioeconomic deprivation, and air pollution in small areas of the Barcelona Metropolitan Region, Spain. Science of The Total Environment. Volume 407, Issue 21, 15 October 2009, Pages 5501–5523
BioInitiative Report (2007). A Rationale for a Biologically-based Public Exposure Standard for Electromagnetic fields (ELF and RF).
Björklid, Pia (2010). Sustainable development from the perspective of children. Studies of children's uses of, and parents' evaluation of, local environments in the city and countryside. Lärarhögskolan, Stockholm University.
Bowler, D.E., Buyung-Ali, L., Knight, T.M., Pullin, A.S., (2010). Urban greening to cool towns and cities: A systematic review of the empirical evidence. Landscape and Urban Planning 97, 147–155.
C. Borrego, H. Martins, O. Tchepel, L. Salmim, A. Monteiro, A.I Miranda, (2006). How urban structure can affect city sustainability from an air quality perspective. Environmental Modeling & Software 21, 461-467.
Colding, J. (2011). Creating incentives for increased public engagement in ecosystem management through urban commons. Chapter 13 in Adapting Institutions: Meeting the Challenge of Global Environmental Change. Boyd, E. and Folke, C. (Eds). Cambridge University Press, Cambridge, UK.
Collins, J.P., Kinzig, A., Grimm, N.B., Fagan, W.F., Hope, D., Wu, J., Borer, E.T., (2000). A new urban ecology. Am. Sci. 88, 416–425.
Council of Europe. Committee on the Environment, (2009). The potential dangers of electromagnetic fields and their effect on the environment. Agriculture and Local and Regional Affairs. Reference to the committee: Doc. 11894, Reference 3563 of 29 May 2009.
Corpas, Mª del Carmen; García, José Diego (1999). La ciudad y el urbanismo desde una perspectiva de género: el uso del espacio y el tiempo. Còrdova: Servicio de Publicaciones de la Universidad de Córdoba.
De Groot, R.S., Wilson, M.A., Boumans, R.M.J., (2002). A typology for the classification, description and evaluation of ecosystem functions, goods and services. Ecological Economics 41, 393–408.
De Ridder, K., Adamec, V., Bañuelos, A., Bruse, M., Bürger, M., Damsgaard, O., Dufek, J., Hirsch, J., Lefebre, F., Pérez-Lacorzana, J.M., Thierry, A., Weber, C., (2004). An integrated methodology to assess the benefits of urban green space. Science of the Total Environment 334-335, 489–497.
Diez-Roux, A. V., Green, F. T., Alazraqui, M., Spinelli, H. (2007) Intraurban variations in adult mortality in a large Latin American city. Journal of Urban Health, 84 (3): 319-33.
URBAN-NEXUS Draft WP3 Synthesis Report. Health and Quality of Life
Page 62 of 66
Douglas M, Thomson H, Jepson R, Hurley F, Higgins M, Muirie J, Gorman D (eds) (2007). Health
Impact Assessment of Transport Initiatives: A Guide, NHS Health Scotland Edinburgh.
Gregory, D.; Johnston, R.; Pratt, G. et al., eds. (2009). "Quality of Life". Dictionary of Human Geography (5th ed.). Oxford: Wiley-Blackwell.
Domene, E., Saurí, D., (2007). Urbanization and class-produced natures: Vegetable gardens in the Barcelona Metropolitan Region, Geoforum 38, 287-298.
Dratva J, Phuleria HC., Foraster M., Gaspoz J-M., Keidel D., Künzli N., Liu SLJ., Pons M., Zemp E., Gerbase MW., Schindler C. (2012), Transportation noise and blood pressure in a population-based sample of adults, Environmental Health Perspectives.
EC, European Commission, DG Regional Policy, (2007). Survey on perceptions of quality of life in 75 European cities, Brussels.
EC, European Commission, (2010a). European Commission Conference on Green Infrastructure implementation, Brussels, 19/11/2010. At http://ec.europa.eu/environment/nature/ecosystems/green_infrastructure.htm accessed 18 July 2012.
EC, European Commission, (2010b). Survey on perceptions of quality of life in 75 European cities. Flash Eurobarometer.
EC, European Commission, (2012). Illustrations of the Green Infrastructure concept. At http://ec.europa.eu/environment/nature/ecosystems/illustrations.htm, accessed 20/07/2012.
EEA, (2006). Urban sprawl in Europe: the ignored challenge, EEA Report No 10/2006. Copenhagen.
EEA (2008). Impacts of Europe's changing climate — 2008 indicator-based assessment. Copenhagen.
EEA, (2009). Ensuring quality of life in Europe's cities and towns. Tackling the environmental challenges driven by European and global change, EEA Report 5/2009. Copenhagen.
EEA, (2011). Green infrastructure and territorial cohesion: The concept of green infrastructure and its integration into policies using monitoring systems (EEA technical report 18/2011), Luxembourg: Publications Office of the European Union.
EEA, (2012a). Urban Adaptation to Climate Change in Europe: challenges and opportunities together with supportive national and European policies (EEA report 2/2012), Luxembourg: Office for Official Publications of the European Union.
EEA, (2012b). NEC Directive status report 2011, EEA Technical Report 6/2012- Copenhagen.
Ehrlich, P.R., (2002). Human natures, nature conservation, and environmental ethics, BioScience 52, 31–43.
EU, URBACT Programme, (2011). Building Healthy Communities (BHC) project, Final Report, Downloadable at http://urbact.eu/fileadmin/Projects/Building_Healthy_Communities__BHC_/outputs_media/Final_Report_bhc_saved.pdf
URBAN-NEXUS Draft WP3 Synthesis Report. Health and Quality of Life
Page 63 of 66
EU, URBACT Programme, (2011). Social and Urban Inclusion Through Housing (SUITE) project, Outputs available at http://urbact.eu/en/projects/quality-sustainable-living/suite/our-outputs/
Europe 2020 Strategy (2012) Towards a smarter, greener and more inclusive EU economy? - Issue number 39/2012.
Future Orientations for CIties (FOCI), Applied Research 2013/1/1, Final Scientific Report | Version 15/12/2010
Fuller, R.A., Gaston, K.J., (2009). The scaling of green space coverage in European cities. Biology Letters 5.
Generalitat de Catalunya, Departament de Salut. (2008) Paisatge i salut / Edició a cura de Joan Nogué, Laura Puigbert i Gemma Bretcha.— Olot : Observatori del Paisatge de Catalunya ; Barcelona,.
Glasgow Centre for Population and Health (GCPH, 2007.) Health and the Physical Characteristics of Urban Neighbourhoods. http://www.gcph.co.uk/publications/153_health_and_the_physical_characteristics_of_urban_neighbourhoods
Grahn, Patrik (2005). Urban parks as a salutogenic factor. The significance of green open spaces to peoples health in every-day life. Swedish Agricultural University, Alnarp.
Grahn, Patrik (2006). The significance of the outdoor stay and environment to childrens health and development. Swedish Agricultural University, Alnarp.
Gregory, Derek; Johnston, Ron; Pratt, Geraldine et al., eds. (2009). “Quality of Life”. Dictionary of Human Geography (5th ed.). Oxford: Wiley-Blackwell.
Haeuber, R., Ringold, P., (1998). Ecology, the social sciences, and environmental policy. Ecol. Appl. 8, 330–331.
Holland, Caroline et al (2007). Social interactions in urban public places. Joseph Rowntree Foundation. Published by the Policy Press, United Kingdom.
Huss A, Spoerri A, Egger M, Röösli M. (2010). Aircraft noise, air pollution, and mortality from myocardial infarction. Epidemiology;21(6):829-836.
J. Corburn, (2007). Urban land use, air toxics and public health: Assessing hazardous exposures at the neighborhood scale. Enviornmental Impact Assessment Review 27, 145-160.
James, P., Tzoulas, K., Adams, M.D., Barber, A., Box, J., Breuste, J., Elmqvist, T., Frith, M., Gordon, C., Greening, K.L., Handley, J., Haworth, S., Kazmierczak, A.E., Johnston, M., Korpela, K., Moretti, M., Niemelä, J., Pauleit, S., Roe, M.H., Sadler, J.P., Ward Thompson, C. (2009). Towards an integrated understanding of green space in the European built environment. Urban Forestry and Urban Greening, 8 (2), 65-75.
K. De Ridder et al. (2004). An integrated methodology to assess the benefits of urban green space, Science of the Total Environment 334– 335, 489–497.

URBAN-NEXUS Draft WP3 Synthesis Report. Health and Quality of Life
Page 64 of 66
Lars, Marcus (2006-2011). Urban form and social segregation – from residential segregation to social integration in public space. www.kth.se/social/user/27181
Leorey O. Marquez, Nariida C. Smith, (1999). A framework for linking urban form and air quality, Environmental Modeling & Software 14, 541-548.
Levi, Lennart; Anderson, Lars (1975). La tensión psicosocial: población, ambiente y calidad de vida, Mèxic: El Manual Moderno.
L. Freeman (2012), Gentrification and Well-Being International Encyclopedia of Housing and Home, Pages 280-286
Lindberg, F et al. (2010). The influence of vegetation and green spaces on human thermal comfort in urban areas – a quantitative approach, Gothenburg University, Dep. of Earth Sciences
M. Foraster et al. (2011). Local determinants of road traffic noise levels versus determinants of air pollution levels in a Mediterranean city. Environmental Research 111, 177–183.
Maas, J. et al (2006). Green space, urbanity, and health: how strong is the relation? J. Epidemiol. Community Health 2006;60;587-592 doi:10.1136/jech.2005.043125
Maas, J. et al (2009). Morbidity is related to a green living environment, J Epidemiol Community Health doi:10.1136/jech.2008.079038
Mackenbach, J et al. (2008). Socioeconomic Inequalities in Health in 22 European Countries, N Engl J Med 2008; 358:2468-2481 June 5, 2008.
Marcus, Lars (2008). Urban form and economical sustainability - spatial conditions for the development of local economies, The research group on Spatial Analysis and Design (SAD) at KTH.
Marmot, M., Friel, S., Bell, R., Houweling, T.A., Taylor, S., (2008). Commission on Social determinants of Health, Closing the gap in a generation: health equity through action on the social determinants of health, Lancet 372 (9650), 1661–1669.
McPherson EG, Scott KI, Simpson JR. (1998). Estimating cost effectiveness of residential yard trees for improving air quality in Sacramento, California, using existing models. Atmospheric Environ 32, 75–84.
Niemelä, J. (1999). Ecology and urban planning, Biodiversity and Conservation 8, 119–131.
Nordström, M. (2008). Children and Open Spaces in the City. Accessibility, Use and Influence, Stockholm University, Human Geography.
Ong, B.L., (2002). Green plot ratio: an ecological measure for architecture and urban planning, Landscape and Urban Planning 965, 1–15.
Pflieger, G. (2009). How Does Urban Public Transport Change Cities? Correlations between Past and
Present Transport and Urban Planning Policies, Urban Stud, vol. 46 no. 7 1421-1437.
R. Atkinson (2012) International Encyclopedia of Housing and Home, Pages 269-274
URBAN-NEXUS Draft WP3 Synthesis Report. Health and Quality of Life
Page 65 of 66
Ring, J., Krämer, U., Schäfer, T. and Behrendt ,H. 2001. Why Are Allergies Increasing? Current
Opinion in Immunology Volume 13, Issue 6, 701–708.
Ross Z, Kheirbek I, Clougherty JE, Kazuhiko I, Matte T, Markowitz S, Eisl H. Noise, air pollutants and traffic: Continuous measurement and correlation at a high-traffic location in New York City, Environmental Research 2011;doi:10.1016/j.envres.2011.09.004.
Rydin, Y et al (2012). Shaping cities for health: complexity and the planning of urban environments in the 21st century Review Article, The Lancet, Volume 379, Issue 9831, 2–8 June 2012, Pages 2079-2108
Sandström, U.F.,(2002). Green Infrastructure planning in urban Sweden, Plann. Pract. Res. 17 (4), 373–385.
Spatial Planning and Health Group (SPAHG). (2011). Steps to Healthy Planning: Proposals for Action.
Sundquist, Jan (2012). Deconstruction of a deprived urban neighbourhood – a longitudinell study on physical activity, nutrition and health.
Takano T, Nakamura K. (2001). An analysis of health levels and various indicators of urban environments for Healthy Cities projects, J Epidemiol Community Health 2001; 55: 263–70.
Tzoulas, K., Korpela,K., Venn,S., Yli-Pelkonen, V., Kazmierczak, A., Niemelä, J., James, P. (2007). Promoting ecosystem and human health in urban areas using Green infrastructure: A literature review. Landscape and Urban Planning 81, 167–178.
UCB Institute of allergy, (1997). European Allergy White Paper: Allergic Diseases as a Public Health
Problem in Europ,. The UCB Institute of Allergy, Brussels.
United Nations Human Settlements Programme 2012.
UN-Habitat (2012). Gender and Urban Planning: Issues and Trends.
UN-Habitat(2012), State of the World’s Cities Report 2012/2013.
Veenstra, G., Lomas, J. (1999). Home is where the governing is: social capital and regional health governance. Health and Place Volume 5, Issue 1, 1-12
World Health Organization (1999). European Health for All, Regional Office for Europe, Copenhagen Series No.6
World Health Organization (2004). Global Strategy on Diet, Physical Activity and Health.
World Health Organization (2005). Air quality guidelines – global update.
World Health Organisation (2007). Our cities, our health, our future: Acting on social determinants for health equity in urban settings Report to the WHO Commission on Social Determinants of Health from the Knowledge Network on Urban Settings.

URBAN-NEXUS Draft WP3 Synthesis Report. Health and Quality of Life
Page 66 of 66
World Health Organisation (2008), Closing the gap in a generation: Health equity through action on the social determinants of health: www.who.int/social_determinants/thecommission/finalreport/en/index.html
World Health Organization, (2009). Night Noise Guidelines for Europe.
World Health Organisation, (2012). Addressing the social determinants of health: the urban dimension and the role of local government. Available at http://www.euro.who.int/__data/assets/pdf_file/0005/166136/UrbanDimensions.pdf
World Health Organisation, (2012). Environmental health inequalities in Europe. Assessment report. Executive summary. WHO Regional Office for Europe. 2012. ISBN 978 92 890 0260 8
World Health Organisation, Healthy cities project webpage: http://www.euro.who.int/en/what-we-do/health-topics/environment-and-health/urban-health/activities/healthy-cities
Wüthrich, B. (1989). Epidemiology of the allergic diseases: are they really on the increase? Int Arch
Allergy Appl Immunol 90, 3-10
Web links
http://cityprotocol.org/index.html
http://www.aspb.cat/quefem/documents_salut_barris.htm
http://www.aspb.cat/quefem/salut-als-barris.aspx
https://www.ucl.ac.uk/ineqcities/atlas
http://www.gdrc.org/u-gov/escap-governance.htm