health effects of tropical storms and hurricanes in … · ii health effects of tropical storms and...
TRANSCRIPT
Health Effects of Tropical Storms and Hurricanes in Florida

ii
Health Effects of Tropical Storms and Hurricanes in Florida
Florida Department of HealthDivision of Disease Control and Health Protection
Bureau of Epidemiology4052 Bald Cypress Way, Bin A-12
Tallahassee, FL 32399(850) 245-4401
www.flhealth.gov
Published March 2015
This document was developed by the Bureau of Epidemiology in cooperation with U.S. Centers for Disease Control and Prevention (CDC), National Center for Environmental Health Project Number
5UE1EH001047-03.
iii
Table of Contents
Executive Summary.........................................................................................................................Historic Patterns ..............................................................................................................................Geographic Vulnerability ................................................................................................................Health Implications ..........................................................................................................................Methods ...........................................................................................................................................Drowning .........................................................................................................................................Injury ................................................................................................................................................Carbon Monoxide Poisoning ...........................................................................................................Foodborne and Waterborne Disease ..............................................................................................Summary Conclusions.....................................................................................................................Citations...........................................................................................................................................Acknowledgements .........................................................................................................................Appendix I: Data Sources ................................................................................................................Appendix II: Discrepancies Between Reporting Sources ................................................................
List of Figures
Figure 1. Estimated hurricane return periods from the National Hurricane Center .........................Figure 2. Saffir-Simpson scale with wind, surge, and damage descriptions ...................................Figure 3. Trends in the number of hurricane landfalls in Florida by decade (1900-2009) ..............Figure 4. Wind hazard risk in Florida A) Tropical storm B) Hurricane (Source: Hazards andVulnerability Research Institute) ......................................................................................................Figure 5. Storm surge risk in Florida A) Category 1 hurricane B) Category 3 hurricane C) Category 5 hurricane (Source: Hazards and Vulnerability Research Institute). ..............................Figure 6. Storm tracks during the 2004-2012 Florida hurricane seasons (Source: National Oceanic and Atmospheric Administration). ......................................................................................Figure 7. Example of impact and control periods used in analysis using Tropical Storm Bonnie, 2010.................................................................................................................................................Figure 8. Rate of drowning-related deaths per 100,000 population, Florida, 2004-2012 ................Figure 9. Rate of ED visits for unintentional injury per 100,000 population, Florida, 2005-2012. ...Figure 10. Rate of hospitalizations for unintentional injury per 100,000 population, Florida, 2004-2012.................................................................................................................................................Figure 11. Rate of carbon monoxide exposures per 100,000 population, FPICN, Florida, 2004-2012.................................................................................................................................................Figure 12. Rate of carbon monoxide poisoning ED visits per 100,000 population, Florida, 2005-2012.................................................................................................................................................Figure 13. Rate of carbon monoxide poisoning hospitalizations per 100,000 population, Florida, 2004-2012 .......................................................................................................................................Figure 14. Rate of campylobacteriosis per 100,000 population, Florida, 2004-2012. .....................Figure 15. Rate of cryptosporidiosis per 100,000 population, Florida, 2004-2012. .........................Figure 16. Rate of giardiasis per 100,000 population, Florida, 2004-2012 .....................................Figure 17. Rate of salmonellosis per 100,000 population, Florida, 2004-2012 ...............................Figure 18. Rate of vibriosis per 100,000 population, Florida, 2004-2012. .......................................
1245691012152020222223
223
4
5
7
81010
11
13
14
141517171818
List of Tables
Table 1. Number of Florida counties affected by tropical cyclones from 2004 to 2012, by year, system, strength, and impact type ...................................................................................................Table 2. Drowning death indicator ...................................................................................................Table 3. All-cause injury indicator ....................................................................................................Table 4. Carbon monoxide poisoning indicator................................................................................Table 5. Foodborne and waterborne disease indicators ..................................................................
79111316
iv
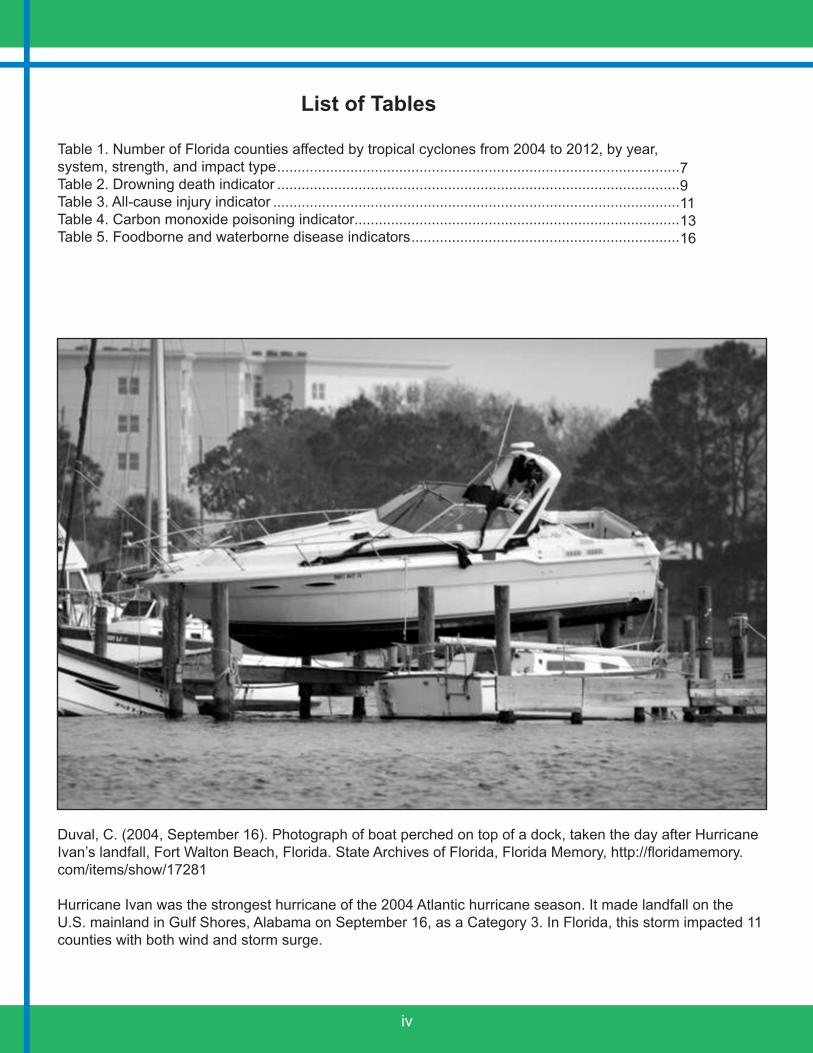
Duval, C. (2004, September 16). Photograph of boat perched on top of a dock, taken the day after Hurricane Ivan’s landfall, Fort Walton Beach, Florida. State Archives of Florida, Florida Memory, http://floridamemory.com/items/show/17281
Hurricane Ivan was the strongest hurricane of the 2004 Atlantic hurricane season. It made landfall on the U.S. mainland in Gulf Shores, Alabama on September 16, as a Category 3. In Florida, this storm impacted 11 counties with both wind and storm surge.
1
Executive Summary
Florida is vulnerable to tropical storms and experiences more hurricane landfalls than any other state (Malmstadt, Scheitlin, & Elsner, 2009). The nature of this hazard, however, is variable. Multi-year cycles either promote or suppress storm formation in the Atlantic Ocean and direct storms toward or away from the state. Some regions of Florida are more geographically at risk than others, with average time between hurricane landfalls ranging from six to 13 years, depending on the location. While storm surge affects coastal communities, storm-force winds can potentially impact any county in the state. Local and state planning and emergency response efforts often focus on this hazard, but communities need to remain cognizant of the risk posed by tropical storms and hurricanes, especially during periods with limited storm activity.
Hurricanes have historically been the deadliest weather event in Florida, with approximately 3,000 deaths being attributed to them in the past century (Winsberg, 2003). As the field of meteorology has developed, storm forecasts have become more accurate, more precise, and longer-range, thus providing advanced warnings for preparedness. However, today, tropical storms and hurricanes still contribute, both directly and indirectly, to a variety of health outcomes. Before, during, and after storms, risks include drowning, injury, carbon monoxide (CO) poisoning, and foodborne and waterborne disease.
In order to examine the relationships between storms and health outcomes in Florida, counties that were impacted with either tropical storm-force or hurricane-force winds and/or storm surge were identified. From 2004 to 2012, eight hurricanes and 11 tropical storms made landfall in or impacted all of Florida’s 67 counties in some manner. Health data were collected from a variety of sources: drowning deaths from Florida Vital Statistics; injury-related emergency department (ED) visits and hospitalizations from the Florida Agency for Health Care Administration (AHCA); CO poisonings from the Florida Poison Information Center Network (FPICN); and foodborne and waterborne reports from the Florida Department of Health, Notifiable Disease Surveillance System (Merlin).
For most health outcomes of interest, rates of illness were higher in the post-tropical cyclone impact periods compared to control periods, with rates of illness also being higher after hurricanes vs. tropical storms. However, rates of drowning were not increased after a tropical cyclone, with rates in the impact and control periods being similar. Injury-related ED visits and hospitalizations were associated with tropical cyclones and showed a 3% and 4% increase during impact periods, respectively. CO poisoning showed the strongest associations with tropical cyclones, with impact periods having rates between 3.4 and 6.6 times higher than control periods. Cryptosporidiosis, salmonellosis, and vibriosis were also significantly associated with impact periods, whereas campylobacteriosis and giardiasis were not.
Exe
cutiv
e S
umm
ary
2
Historic Patterns
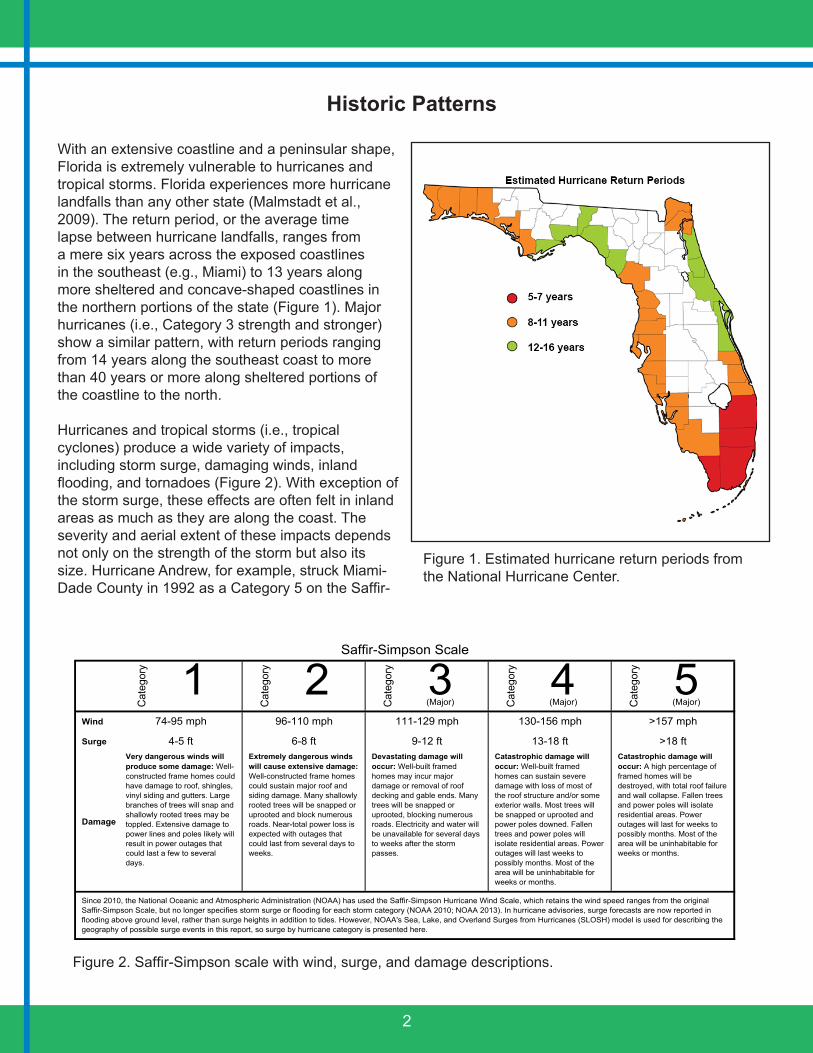
With an extensive coastline and a peninsular shape, Florida is extremely vulnerable to hurricanes and tropical storms. Florida experiences more hurricane landfalls than any other state (Malmstadt et al., 2009). The return period, or the average time lapse between hurricane landfalls, ranges from a mere six years across the exposed coastlines in the southeast (e.g., Miami) to 13 years along more sheltered and concave-shaped coastlines in the northern portions of the state (Figure 1). Major hurricanes (i.e., Category 3 strength and stronger) show a similar pattern, with return periods ranging from 14 years along the southeast coast to more than 40 years or more along sheltered portions of the coastline to the north.
Hurricanes and tropical storms (i.e., tropical cyclones) produce a wide variety of impacts, including storm surge, damaging winds, inland flooding, and tornadoes (Figure 2). With exception of the storm surge, these effects are often felt in inland areas as much as they are along the coast. The severity and aerial extent of these impacts depends not only on the strength of the storm but also its size. Hurricane Andrew, for example, struck Miami-Dade County in 1992 as a Category 5 on the Saffir-
1 2 3 4 5(Major) (Major) (Major)
Wind
Surge
Damage
Saffir-Simpson Scale
Since 2010, the National Oceanic and Atmospheric Administration (NOAA) has used the Saffir-Simpson Hurricane Wind Scale, which retains the wind speed ranges from the original Saffir-Simpson Scale, but no longer specifies storm surge or flooding for each storm category (NOAA 2010; NOAA 2013). In hurricane advisories, surge forecasts are now reported in flooding above ground level, rather than surge heights in addition to tides. However, NOAA's Sea, Lake, and Overland Surges from Hurricanes (SLOSH) model is used for describing the geography of possible surge events in this report, so surge by hurricane category is presented here.
>157 mph
>18 ftCatastrophic damage will occur: A high percentage of framed homes will be destroyed, with total roof failure and wall collapse. Fallen trees and power poles will isolate residential areas. Power outages will last for weeks to possibly months. Most of the area will be uninhabitable for weeks or months.
Very dangerous winds will produce some damage: Well-constructed frame homes could have damage to roof, shingles, vinyl siding and gutters. Large branches of trees will snap and shallowly rooted trees may be toppled. Extensive damage to power lines and poles likely will result in power outages that could last a few to several days.
111-129 mph
9-12 ftCatastrophic damage will occur: Well-built framed homes can sustain severe damage with loss of most of the roof structure and/or some exterior walls. Most trees will be snapped or uprooted and power poles downed. Fallen trees and power poles will isolate residential areas. Power outages will last weeks to possibly months. Most of the area will be uninhabitable for weeks or months.
130-156 mph
13-18 ft
74-95 mph
4-5 ftExtremely dangerous winds will cause extensive damage: Well-constructed frame homes could sustain major roof and siding damage. Many shallowly rooted trees will be snapped or uprooted and block numerous roads. Near-total power loss is expected with outages that could last from several days to weeks.
96-110 mph
6-8 ft
Cat
egor
y
Devastating damage will occur: Well-built framed homes may incur major damage or removal of roof decking and gable ends. Many trees will be snapped or uprooted, blocking numerous roads. Electricity and water will be unavailable for several days to weeks after the storm passes.
Cat
egor
y
Cat
egor
y
Cat
egor
y
Cat
egor
y
Figure 1. Estimated hurricane return periods from the National Hurricane Center.
Figure 2. Saffir-Simpson scale with wind, surge, and damage descriptions.

3
0
1
2
3
4
5
6
7
8
9
Num
ber o
f Hur
rican
e La
ndfa
lls
Florida Hurricane Landfalls by Decade
Minor Major
Simpson Scale; it was an intense but small storm whose big impacts were largely confined to the counties along the track. In contrast, Hurricane Frances was much weaker, a Category 2 that trudged slowly across the central part of the state in 2005; however, its exceptionally large circulation produced significant impacts across much of the state. In fact, there was a point in which hurricane-force wind gusts were observed simultaneously on both the Atlantic and Gulf Coasts of the state.
There is much variability in the number of hurricane landfalls with respect to time (Figure 3). Six hurricanes, for example, made landfall in the state in 2004 and 2005, but none have made landfall through 2014. Inter-annual variations in hurricane landfalls can be tied to the subtle variations in the large-scale circulation, such as the positioning of the Bermuda High, which is typically positioned east of Florida and the strength of the upper-level winds. During El Niño years, strong upper-level winds hinder hurricane development over the Atlantic Ocean and, in many cases, steer them northward before reaching Florida. Conversely, during La Niña years, hurricanes develop more frequently over the Atlantic, and the probabilities of landfall increase across the state. Over longer time scales, hurricane frequencies can be tied to inter-decadal variations in the sea surface temperatures across the Atlantic, which follows a cycle called the Atlantic Multi-decadal Oscillation (AMO). The AMO was most positive between 1930 and 1949, and 19 hurricanes made landfall along the Florida coast. In contrast, only six hurricanes made landfall during the AMO negative phase between 1970 and 1989.
It is not clear if the number of hurricanes across the Atlantic basin has increased over the last approximately 100 years. While Holland and Webster (2007) and Mann and Emmanuel (2006) identified a positive trend, Landsea (2007) points out that the pre-satellite era (prior to the late 1960s) record of tropical activity is likely missing numerous storms and that the record may be worse before airplane reconnaissance began in the mid-1940s. Landsea, Vecchi, Bengtsson, and Knutson (2010) also suggest that there has been a significant increase in the number of short-lived storms detected since the introduction of satellites, suggesting that these were likely missed in the earlier portions of the hurricane records.
Bac
kgro
und
Figure 3. Trends in the number of hurricane landfalls in Florida by decade (1900-2009).
4
Geographic Vulnerability
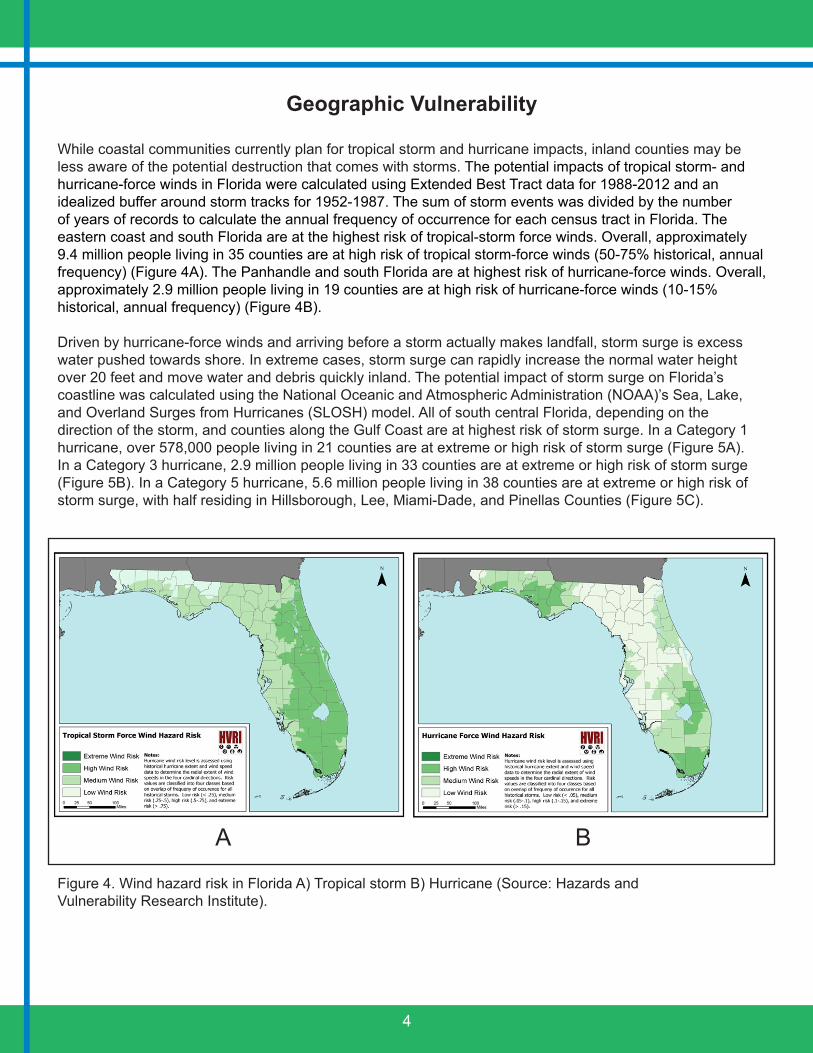
While coastal communities currently plan for tropical storm and hurricane impacts, inland counties may be less aware of the potential destruction that comes with storms. The potential impacts of tropical storm- and hurricane-force winds in Florida were calculated using Extended Best Tract data for 1988-2012 and an idealized buffer around storm tracks for 1952-1987. The sum of storm events was divided by the number of years of records to calculate the annual frequency of occurrence for each census tract in Florida. The eastern coast and south Florida are at the highest risk of tropical-storm force winds. Overall, approximately 9.4 million people living in 35 counties are at high risk of tropical storm-force winds (50-75% historical, annual frequency) (Figure 4A). The Panhandle and south Florida are at highest risk of hurricane-force winds. Overall, approximately 2.9 million people living in 19 counties are at high risk of hurricane-force winds (10-15% historical, annual frequency) (Figure 4B).
Driven by hurricane-force winds and arriving before a storm actually makes landfall, storm surge is excess water pushed towards shore. In extreme cases, storm surge can rapidly increase the normal water height over 20 feet and move water and debris quickly inland. The potential impact of storm surge on Florida’s coastline was calculated using the National Oceanic and Atmospheric Administration (NOAA)’s Sea, Lake, and Overland Surges from Hurricanes (SLOSH) model. All of south central Florida, depending on the direction of the storm, and counties along the Gulf Coast are at highest risk of storm surge. In a Category 1 hurricane, over 578,000 people living in 21 counties are at extreme or high risk of storm surge (Figure 5A). In a Category 3 hurricane, 2.9 million people living in 33 counties are at extreme or high risk of storm surge (Figure 5B). In a Category 5 hurricane, 5.6 million people living in 38 counties are at extreme or high risk of storm surge, with half residing in Hillsborough, Lee, Miami-Dade, and Pinellas Counties (Figure 5C).
Figure 4. Wind hazard risk in Florida A) Tropical storm B) Hurricane (Source: Hazards andVulnerability Research Institute).
A B

5
A
C
B
Health Implications
The physical and economic impacts of tropical cyclones are well-documented and often the primary focus of post-impact recovery efforts. However, there are several public health impacts associated with these systems. These include direct health effects, such as injury and death that occur immediately due to the destructive force of winds and surge. However, indirect health effects that are related to clean-up efforts or power outages and loss of infrastructure, such as CO poisoning and foodborne and waterborne disease can also pose a risk to the public.
No weather-related event has caused as many deaths in Florida as hurricanes, with approximately 3,000 deaths being attributed to these events in the past century (Winsberg, 2003). Death may occur before, during, and after storm impact. In 2004 and 2005, eight hurricanes resulted in 213 deaths: 9% occurred pre-impact, 31% during impact, and 60% post-impact (Ragan, Schulte, Nelson, & Jones, 2008). Drowning is a leading cause of hurricane-related deaths, due to higher than normal water levels from storm surge and the greater potential for stronger currents (e.g., rip currents). Such deaths typically occur around the time of impact, immediately before and after. During the 2004 and 2005 Florida hurricane seasons, drowning was the second most common cause of unintentional death (Ragan et al., 2008). Drowning was the most common cause of death related to Hurricane Sandy in 2012 with 45% of these drowning deaths occurring in flooded homes (Casey-Lockyer et al., 2013).
Hea
lth Im
plic
atio
ns
Figure 5. Storm surge risk in Florida A) Category 1 hurricane B) Category 3 hurricane C) Category 5 hurricane (Source: Hazards and Vulnerability Research Institute).

6
Injury is also a common cause of hurricane-related morbidity and mortality. For example, surveillance for illness and injury in three Mississippi counties after Hurricane Katrina recorded 4,391 (38%) ED visits for injury out of 11,424 total visits (McNeill et al., 2006). Most hurricane-related deaths are due to unintentional injury, with 76% of deaths during the 2004-2005 Florida hurricane seasons being deemed unintentional (Ragan et al., 2008). Injury may occur in the time period leading up to the storm during preparation and evacuation activities, during the storm itself, or in the days and weeks that follow during clean-up efforts. After Hurricane Charley (2004), 10 of the 17 deaths related to trauma occurred on the day of impact, while all but one of the remaining trauma-related deaths occurred within two weeks of impact (Jones et al., 2004).
CO poisoning is also a noted health hazard after hurricanes due to the use of gas-powered generators and improper ventilation or unsafe location of these generators. In 2005, CO poisoning accounted for 13% of all hurricane-related deaths in Florida (Ragan et al., 2008). After Hurricane Sandy (2012), nine reported deaths were due to CO poisoning (Casey-Lockyer et al., 2013). Non-fatal CO poisonings have also been detected after hurricanes, with five being detected after Hurricane Katrina (McNeill et al., 2006).
Storm surge, wind, and flooding associated with extreme storms may also have negative effects on human health by contaminating potable water sources used to prepare food or for personal hygiene or by causing power outages leading to food storage challenges, thereby increasing the risk of foodborne and waterborne illness. Increased precipitation intensity can lead to or worsen many forms of water pollution, including the transmission of pathogens that threaten human health (IPCC, 2007). Cases of diarrheal illness, specifically vibriosis, have been reported after hurricane events in the United States (Engelthaler et al., 2005; Straif-Bourgeois et al., 2006; McNeill et al., 2006).
Methods
The Southeast Regional Climate Center provided maximum wind speeds observed in all Florida counties for each tropical cyclone from 2004 through 2012. Only counties experiencing tropical storm-force (39-73.9 mph) or hurricane-force (≥74 mph) winds were included. Storm surge data for the Gulf Coast was obtained from the Louisiana State University SURGEDAT database. From 2004 to 2012, eight hurricanes and 11 tropical storms made landfall in or impacted all of Florida’s 67 counties in some manner (Table 1; Figure 6). Most storms that impacted Florida counties made landfall and included wind damage alone or both wind and storm surge. However, a few storms that did not make landfall in Florida did produce storm surge impacting coastal counties (e.g., Hurricane Katrina in 2005 and Ike in 2008).
A variety of health data sources are readily available in Florida to study the effects of tropical cyclone impacts on human health outcomes. Using existing data sources is beneficial for several reasons. They provide immediate access to data to understand historical trends and associations between weather and public health, and they collect information statewide on a variety of health outcomes and diseases. However, using these data sources is not without limitations. These data sources were mostly created for surveillance or quality assurance purposes and were not intended for research in general or to specifically study the effects of weather hazards on health. Information on data sources can be found in Appendix 1.

7
Year System Max Strength* Counties ImpactBonnie TS 3 Wind/Storm SurgeCharley 4 21 Wind/Storm SurgeFrances 2 54 Wind/Storm SurgeIvan 3 11 Wind/Storm SurgeJeanne 3 36 Wind/Storm SurgeArlene TS 8 Wind/Storm SurgeDennis 3 22 Wind/Storm SurgeKatrina 1 1 Storm SurgeOphelia TS 1 WindRita TS 3 Wind/Storm SurgeWilma 3 26 Wind/Storm SurgeAlberto TS 32 Wind/Storm SurgeErnesto TS 2 WindAndrea TS 2 WindBarry TS 16 WindFay TS 40 Wind/Storm SurgeIke 1 1 Storm Surge
2009 Claudette TS 7 Wind/Storm Surge2010 Bonnie TS 1 Wind
2008
*Maximum strength of system in Florida or impacting Florida. TS=Tropical storm; 1=Category 1 hurricane; 2=Category 2 hurricane; 3=Category 3 hurricane; 4=Category 4 hurricane
2004
2005
2006
2007
Met
hods
Table 1. Number of Florida counties affected by tropical cyclones from 2004 to 2012, by year, system, strength, and impact type.
Figure 6. Storm tracks during the 2004-2012 Florida hurricane seasons (Source: National Oceanic and Atmospheric Administration).
8
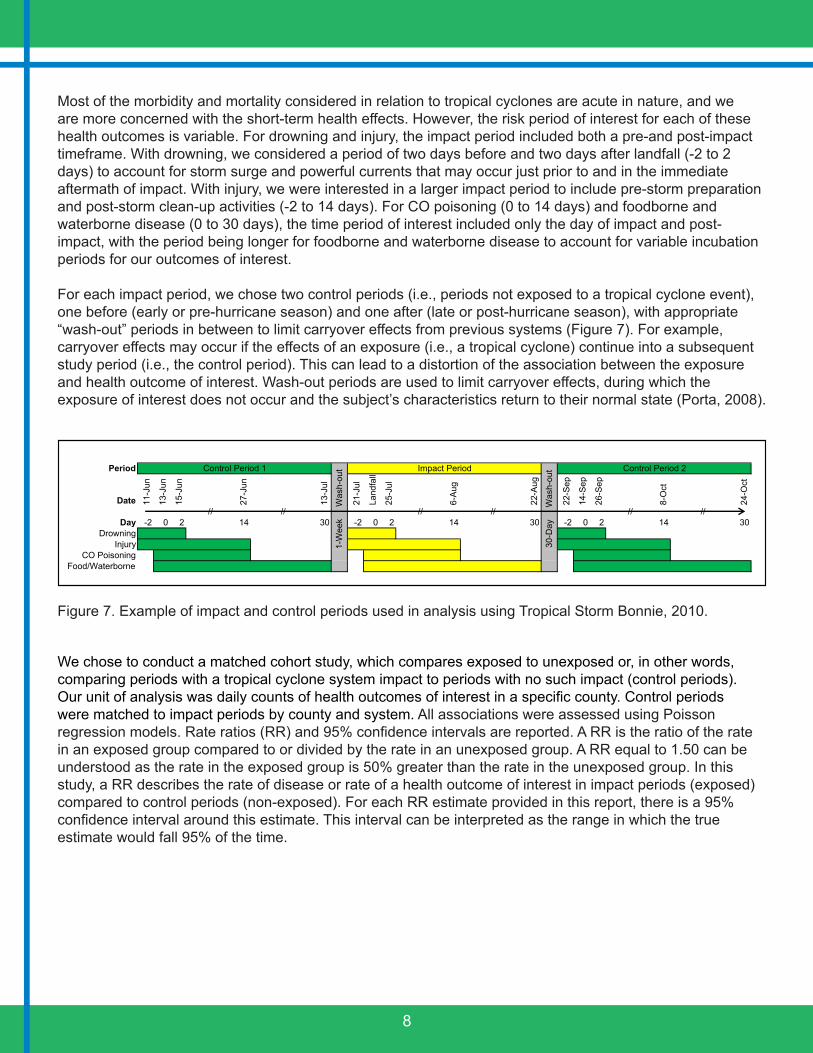
Most of the morbidity and mortality considered in relation to tropical cyclones are acute in nature, and we are more concerned with the short-term health effects. However, the risk period of interest for each of these health outcomes is variable. For drowning and injury, the impact period included both a pre-and post-impact timeframe. With drowning, we considered a period of two days before and two days after landfall (-2 to 2 days) to account for storm surge and powerful currents that may occur just prior to and in the immediate aftermath of impact. With injury, we were interested in a larger impact period to include pre-storm preparation and post-storm clean-up activities (-2 to 14 days). For CO poisoning (0 to 14 days) and foodborne and waterborne disease (0 to 30 days), the time period of interest included only the day of impact and post-impact, with the period being longer for foodborne and waterborne disease to account for variable incubation periods for our outcomes of interest.
For each impact period, we chose two control periods (i.e., periods not exposed to a tropical cyclone event), one before (early or pre-hurricane season) and one after (late or post-hurricane season), with appropriate “wash-out” periods in between to limit carryover effects from previous systems (Figure 7). For example, carryover effects may occur if the effects of an exposure (i.e., a tropical cyclone) continue into a subsequent study period (i.e., the control period). This can lead to a distortion of the association between the exposure and health outcome of interest. Wash-out periods are used to limit carryover effects, during which the exposure of interest does not occur and the subject’s characteristics return to their normal state (Porta, 2008).
Period
Date 11-J
un
13-J
un
15-J
un
27-J
un
13-J
ul
21-J
ul
Land
fall
25-J
ul
6-A
ug
22-A
ug
22-S
ep
14-S
ep
26-S
ep
8-O
ct
24-O
ct
Day -2 0 2 14 30 -2 0 2 14 30 -2 0 2 14 30Drowning
InjuryCO Poisoning
Food/Waterborne
Control Period 2
// // // // ////
Control Period 1
1-W
eek
W
ash-
out Impact Period
30-
Day
W
ash-
out
Figure 7. Example of impact and control periods used in analysis using Tropical Storm Bonnie, 2010.
We chose to conduct a matched cohort study, which compares exposed to unexposed or, in other words, comparing periods with a tropical cyclone system impact to periods with no such impact (control periods). Our unit of analysis was daily counts of health outcomes of interest in a specific county. Control periods were matched to impact periods by county and system. All associations were assessed using Poisson regression models. Rate ratios (RR) and 95% confidence intervals are reported. A RR is the ratio of the rate in an exposed group compared to or divided by the rate in an unexposed group. A RR equal to 1.50 can be understood as the rate in the exposed group is 50% greater than the rate in the unexposed group. In this study, a RR describes the rate of disease or rate of a health outcome of interest in impact periods (exposed) compared to control periods (non-exposed). For each RR estimate provided in this report, there is a 95% confidence interval around this estimate. This interval can be interpreted as the range in which the true estimate would fall 95% of the time.
9
Drowning
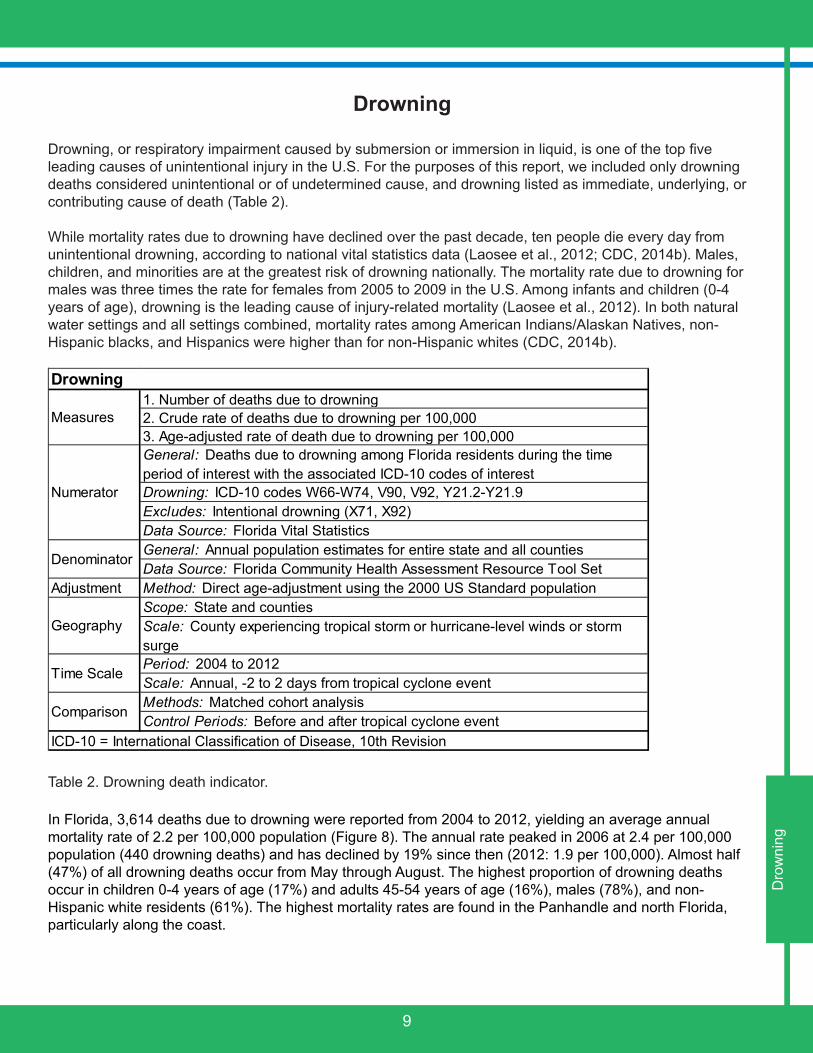
Drowning, or respiratory impairment caused by submersion or immersion in liquid, is one of the top five leading causes of unintentional injury in the U.S. For the purposes of this report, we included only drowning deaths considered unintentional or of undetermined cause, and drowning listed as immediate, underlying, or contributing cause of death (Table 2).
While mortality rates due to drowning have declined over the past decade, ten people die every day from unintentional drowning, according to national vital statistics data (Laosee et al., 2012; CDC, 2014b). Males, children, and minorities are at the greatest risk of drowning nationally. The mortality rate due to drowning for males was three times the rate for females from 2005 to 2009 in the U.S. Among infants and children (0-4 years of age), drowning is the leading cause of injury-related mortality (Laosee et al., 2012). In both natural water settings and all settings combined, mortality rates among American Indians/Alaskan Natives, non-Hispanic blacks, and Hispanics were higher than for non-Hispanic whites (CDC, 2014b).
1. Number of deaths due to drowning2. Crude rate of deaths due to drowning per 100,0003. Age-adjusted rate of death due to drowning per 100,000General: Deaths due to drowning among Florida residents during the time period of interest with the associated ICD-10 codes of interestDrowning: ICD-10 codes W66-W74, V90, V92, Y21.2-Y21.9Excludes: Intentional drowning (X71, X92)Data Source: Florida Vital StatisticsGeneral: Annual population estimates for entire state and all countiesData Source: Florida Community Health Assessment Resource Tool Set
Adjustment Method: Direct age-adjustment using the 2000 US Standard populationScope: State and countiesScale: County experiencing tropical storm or hurricane-level winds or storm surgePeriod: 2004 to 2012Scale: Annual, -2 to 2 days from tropical cyclone eventMethods: Matched cohort analysisControl Periods: Before and after tropical cyclone event
ICD-10 = International Classification of Disease, 10th Revision
Comparison
Time Scale
Drowning
Measures
Numerator
Denominator
Geography
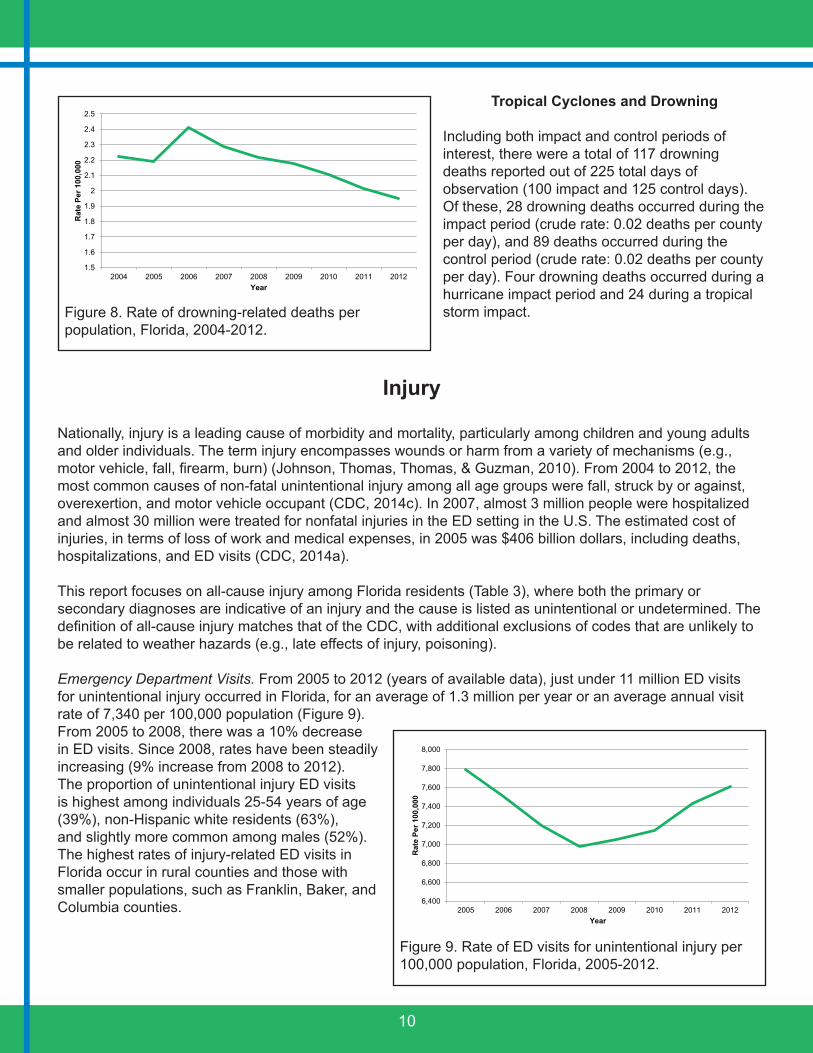
In Florida, 3,614 deaths due to drowning were reported from 2004 to 2012, yielding an average annual mortality rate of 2.2 per 100,000 population (Figure 8). The annual rate peaked in 2006 at 2.4 per 100,000 population (440 drowning deaths) and has declined by 19% since then (2012: 1.9 per 100,000). Almost half (47%) of all drowning deaths occur from May through August. The highest proportion of drowning deaths occur in children 0-4 years of age (17%) and adults 45-54 years of age (16%), males (78%), and non-Hispanic white residents (61%). The highest mortality rates are found in the Panhandle and north Florida, particularly along the coast.
Dro
wni
ngTable 2. Drowning death indicator.
10
Tropical Cyclones and Drowning
Including both impact and control periods of interest, there were a total of 117 drowning deaths reported out of 225 total days of observation (100 impact and 125 control days). Of these, 28 drowning deaths occurred during the impact period (crude rate: 0.02 deaths per county per day), and 89 deaths occurred during the control period (crude rate: 0.02 deaths per county per day). Four drowning deaths occurred during a hurricane impact period and 24 during a tropical storm impact.
Injury
Nationally, injury is a leading cause of morbidity and mortality, particularly among children and young adults and older individuals. The term injury encompasses wounds or harm from a variety of mechanisms (e.g., motor vehicle, fall, firearm, burn) (Johnson, Thomas, Thomas, & Guzman, 2010). From 2004 to 2012, the most common causes of non-fatal unintentional injury among all age groups were fall, struck by or against, overexertion, and motor vehicle occupant (CDC, 2014c). In 2007, almost 3 million people were hospitalized and almost 30 million were treated for nonfatal injuries in the ED setting in the U.S. The estimated cost of injuries, in terms of loss of work and medical expenses, in 2005 was $406 billion dollars, including deaths, hospitalizations, and ED visits (CDC, 2014a).
This report focuses on all-cause injury among Florida residents (Table 3), where both the primary or secondary diagnoses are indicative of an injury and the cause is listed as unintentional or undetermined. The definition of all-cause injury matches that of the CDC, with additional exclusions of codes that are unlikely to be related to weather hazards (e.g., late effects of injury, poisoning).
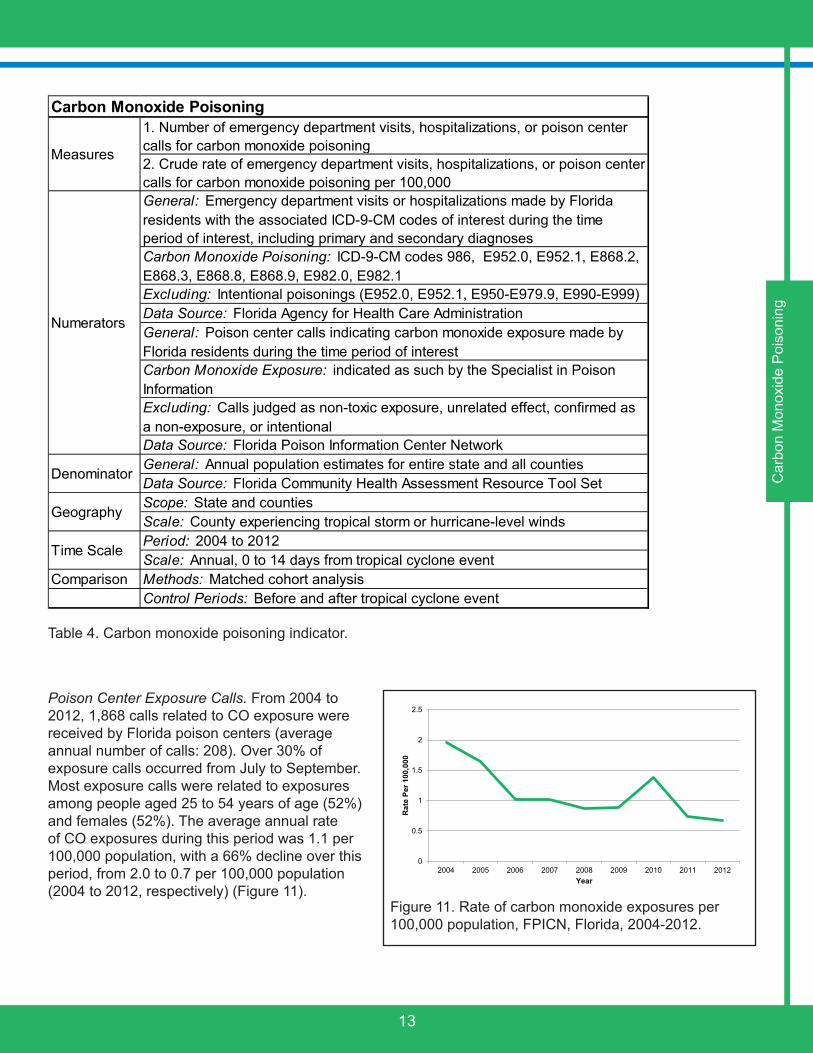
Emergency Department Visits. From 2005 to 2012 (years of available data), just under 11 million ED visits for unintentional injury occurred in Florida, for an average of 1.3 million per year or an average annual visit rate of 7,340 per 100,000 population (Figure 9). From 2005 to 2008, there was a 10% decrease in ED visits. Since 2008, rates have been steadily increasing (9% increase from 2008 to 2012). The proportion of unintentional injury ED visits is highest among individuals 25-54 years of age (39%), non-Hispanic white residents (63%), and slightly more common among males (52%). The highest rates of injury-related ED visits in Florida occur in rural counties and those with smaller populations, such as Franklin, Baker, and Columbia counties.
1.5
1.6
1.7
1.8
1.9
2
2.1
2.2
2.3
2.4
2.5
2004 2005 2006 2007 2008 2009 2010 2011 2012
Rat
e Pe
r 100
,000
Year
Figure 8. Rate of drowning-related deaths per population, Florida, 2004-2012.
6,400
6,600
6,800
7,000
7,200
7,400
7,600
7,800
8,000
2005 2006 2007 2008 2009 2010 2011 2012
Rat
e Pe
r 100
,000
Year
Figure 9. Rate of ED visits for unintentional injury per 100,000 population, Florida, 2005-2012.

11
1. Number of emergency department visits or hospitalizations for all-cause injury2. Crude rate of emergency department visits or hospitalizations for all-cause injury per 100,0003. Age-adjusted rate of emergency department visits or hospitalizations for all-cause injury per 100,000General: Emergency department visits or hospitalizations made by Florida residents during the time period of interest with the associated ICD-9-CM codes of interest, including primary and secondary diagnosesInjury: ICD-9-CM codes 800-904, 910-929, 940-957, 959, 995.55, E800-E848, E850-E869, E880-E929Excludes: Intentional injury (E950-E979, E990-E999), late effects (905-909), foreign body entering orifice (930-939), traumatic complications (958), poisoning and toxic effects of substances (960-989), and other or unspecified effects (990-995)Data Source: Florida Agency for Health Care AdministrationGeneral: Annual population estimates for entire state and all countiesData Source: Florida Community Health Assessment Resource Tool Set
Adjustment Method: Direct age-adjustment using the 2000 US Standard populationScope: State and countiesScale: County experiencing tropical storm or hurricane-level winds or storm surgePeriod: 2004 to 2012Scale: Annual, -2 to 14 days from tropical cyclone eventMethods: Matched cohort analysisControl Periods: Before and after tropical cyclone event
ICD-9-CM = International Classification of Disease, 9th Revision, Clinical Modification
Comparison
Time Scale
Injury
Measures
Numerator
Denominator
Geography
Hospitalizations. From 2004 to 2012, 1.3 million hospitalizations for unintentional injury occurred among Florida residents (average number of visits per year: 149,687). The average annual visit rate during this period was 810 visits per 100,000 population (Figure 10). However, hospitalization rates for unintentional injury have been steadily increasing since 2004 (11% increase). Here, the highest proportion of cases occur among individuals aged 65 years and older (57%), non-Hispanic white residents (76%), and females (53%). The highest rates of injury-related hospitalizations in Florida occur in rural counties and those with smaller populations, such as Union, Okeechobee, and Levy counties.
720
740
760
780
800
820
840
860
880
2004 2005 2006 2007 2008 2009 2010 2011 2012
Rat
e Pe
r 100
,000
Year
Figure 10. Rate of hospitalizations for unintentional injury per 100,000 population, Florida, 2004-2012.
Inju
ry, A
ll C
ause
Table 3. All-cause injury indicator.

12
Tropical Cyclones and Injury
Emergency Department Visits. During impact and control periods combined, there were 688,493 visits to the ED related to unintentional or undetermined injury. Among the 235 impact follow-up days, 185,745 visits occurred (crude rate: 67.45 ED visits per county per day); whereas among the 374 control follow-up days, 502,748 visits occurred (crude rate: 51.97 ED visits per county per day). During the 235 impact days only, 30 days of follow-up were hurricane-related and 205 days were tropical storm-related. Follow-up days associated with hurricanes had a greater rate of injury-related ED visits than days associated with tropical storms (crude rate: 132.97 vs. 60.76 ED visits per county per day). ED visit rates were significantly higher in impact vs. control periods (RR: 1.03; 95% CI: 1.02, 1.05). The most common types of injuries during control periods included falls (29%), being struck by an object (14%), and motor vehicle transport accident (13%). The most common types of injuries during impact periods were falls (28%), being struck by an object (14%), and being cut or pierced (11%).
Hospitalizations. During our time periods of interest, 110,430 hospitalizations related to injury occurred. Crude hospitalization rates related to injury in the 425 control period follow-up days were 4.58 hospitalizations per county per day, and in the 293 impact period follow-up days were 7.20 hospitalizations per county per day. Rates were higher after hurricane impacts (10.48 hospitalizations per county per day) than tropical storm impacts (6.67 hospitalizations per county per day). We examined associations between tropical cyclones and all-cause injury hospitalizations. Impact periods were associated with a 4% increase in hospitalization rates compared to control periods (RR: 1.04; 95% CI: 1.02, 1.05). The most common types of injuries during control periods included falls (51%), motor vehicle transport accidents (13%), and other injuries (3%); whereas during impact periods, the most common types were falls (50%), motor vehicle transport accidents (11%), and being struck by an object (3%).
Carbon Monoxide Poisoning
CO poisoning is an illness that is caused by the inhalation and absorption of CO gas, which is an odorless gas that is produced by automobiles, generators, and other fuel burning devices. Symptoms of CO poisoning may include weakness, fatigue, headache, dizziness, nausea, shortness of breath, loss of consciousness, and death. On average, 430 deaths due to unintentional, non-fire-related CO poisoning occur each year in the U.S., with the death rate being highest among males and individuals at least 65 years of age (Xu, 2014). According to National Poison Center data, an average of approximately 6,800 CO exposures per year were reported to poison centers from 2000-2009, with just over half requiring treatment in a health care facility and 78% occurring at the person’s place of residence (Bronstein, 2011). In 2007, 230,000 ED visits and 22,000 hospitalizations were associated with CO poisoning in the U.S. (Iqbal, 2012).
We used both poison center exposure calls, hospitalization, and ED data to assess the burden of CO poisoning among Florida residents. We included only unintentional cases of exposure or poisoning, and excluded cases associated with fire, when possible (Table 4). Please note that some cases of CO exposures or poisonings may be documented in more than one of the data sets used in this report; however, de-duplication was not possible due to the lack of personal identifiers available in these data sources.
From all sources, 2004, 2005, and 2010 had the greatest number of CO poisonings or exposures reported during our time period of interest. The increase in 2004-2005 is most likely related to the intense hurricane seasons experienced during this period, and the increase in 2010 is most likely related to the extreme cold temperatures experienced throughout Florida in January. Poisonings and exposures were more likely to occur in December and January or late summer and early fall, coinciding with the use of generators for cold weather or tropical cyclone related power outages.
13
1. Number of emergency department visits, hospitalizations, or poison center calls for carbon monoxide poisoning2. Crude rate of emergency department visits, hospitalizations, or poison center calls for carbon monoxide poisoning per 100,000General: Emergency department visits or hospitalizations made by Florida residents with the associated ICD-9-CM codes of interest during the time period of interest, including primary and secondary diagnosesCarbon Monoxide Poisoning: ICD-9-CM codes 986, E952.0, E952.1, E868.2, E868.3, E868.8, E868.9, E982.0, E982.1Excluding: Intentional poisonings (E952.0, E952.1, E950-E979.9, E990-E999)Data Source: Florida Agency for Health Care AdministrationGeneral: Poison center calls indicating carbon monoxide exposure made by Florida residents during the time period of interest Carbon Monoxide Exposure: indicated as such by the Specialist in Poison Information Excluding: Calls judged as non-toxic exposure, unrelated effect, confirmed as a non-exposure, or intentionalData Source: Florida Poison Information Center NetworkGeneral: Annual population estimates for entire state and all countiesData Source: Florida Community Health Assessment Resource Tool SetScope: State and countiesScale: County experiencing tropical storm or hurricane-level windsPeriod: 2004 to 2012Scale: Annual, 0 to 14 days from tropical cyclone event
Comparison Methods: Matched cohort analysisControl Periods: Before and after tropical cyclone event
Carbon Monoxide Poisoning
Measures
Denominator
Geography
Time Scale
Numerators
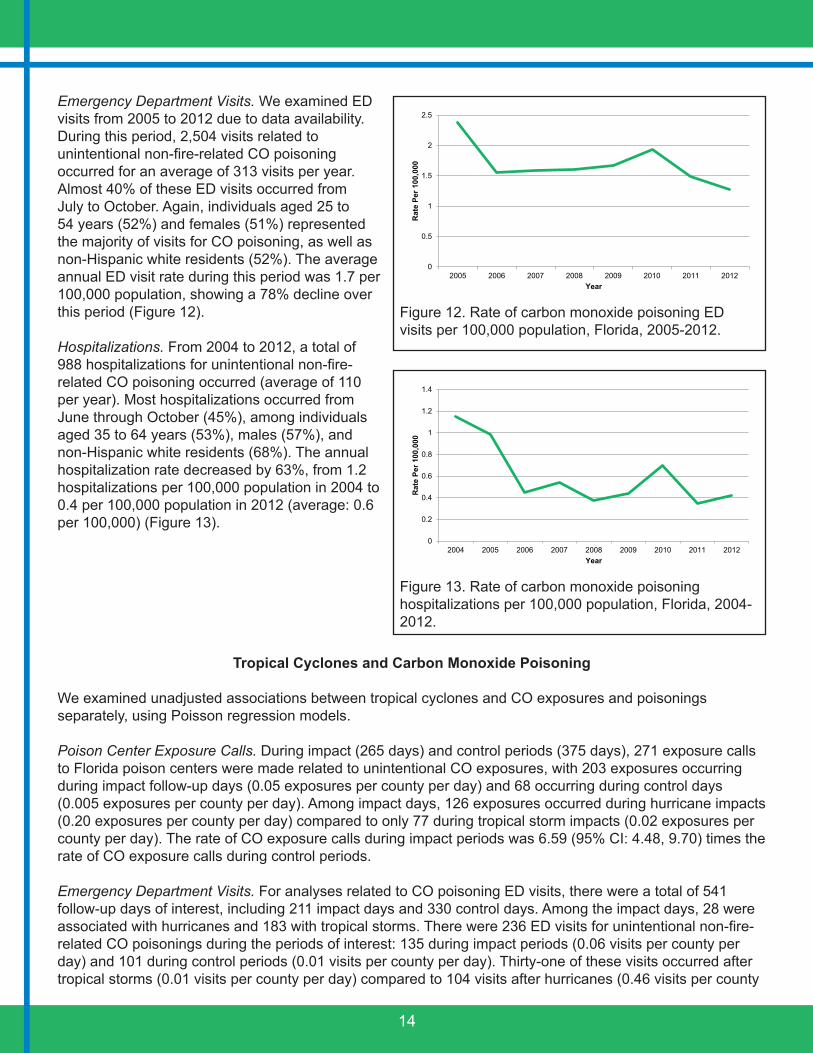
Poison Center Exposure Calls. From 2004 to 2012, 1,868 calls related to CO exposure were received by Florida poison centers (average annual number of calls: 208). Over 30% of exposure calls occurred from July to September. Most exposure calls were related to exposures among people aged 25 to 54 years of age (52%) and females (52%). The average annual rate of CO exposures during this period was 1.1 per 100,000 population, with a 66% decline over this period, from 2.0 to 0.7 per 100,000 population (2004 to 2012, respectively) (Figure 11).
0
0.5
1
1.5
2
2.5
2004 2005 2006 2007 2008 2009 2010 2011 2012
Rat
e Pe
r 100
,000
Year
Figure 11. Rate of carbon monoxide exposures per 100,000 population, FPICN, Florida, 2004-2012.
Car
bon
Mon
oxid
e P
oiso
ning
Table 4. Carbon monoxide poisoning indicator.
14
Emergency Department Visits. We examined ED visits from 2005 to 2012 due to data availability. During this period, 2,504 visits related to unintentional non-fire-related CO poisoning occurred for an average of 313 visits per year. Almost 40% of these ED visits occurred from July to October. Again, individuals aged 25 to 54 years (52%) and females (51%) represented the majority of visits for CO poisoning, as well as non-Hispanic white residents (52%). The average annual ED visit rate during this period was 1.7 per 100,000 population, showing a 78% decline over this period (Figure 12).
Hospitalizations. From 2004 to 2012, a total of 988 hospitalizations for unintentional non-fire-related CO poisoning occurred (average of 110 per year). Most hospitalizations occurred from June through October (45%), among individuals aged 35 to 64 years (53%), males (57%), and non-Hispanic white residents (68%). The annual hospitalization rate decreased by 63%, from 1.2 hospitalizations per 100,000 population in 2004 to 0.4 per 100,000 population in 2012 (average: 0.6 per 100,000) (Figure 13).
Tropical Cyclones and Carbon Monoxide Poisoning
We examined unadjusted associations between tropical cyclones and CO exposures and poisonings separately, using Poisson regression models.
Poison Center Exposure Calls. During impact (265 days) and control periods (375 days), 271 exposure calls to Florida poison centers were made related to unintentional CO exposures, with 203 exposures occurring during impact follow-up days (0.05 exposures per county per day) and 68 occurring during control days (0.005 exposures per county per day). Among impact days, 126 exposures occurred during hurricane impacts (0.20 exposures per county per day) compared to only 77 during tropical storm impacts (0.02 exposures per county per day). The rate of CO exposure calls during impact periods was 6.59 (95% CI: 4.48, 9.70) times the rate of CO exposure calls during control periods.
Emergency Department Visits. For analyses related to CO poisoning ED visits, there were a total of 541 follow-up days of interest, including 211 impact days and 330 control days. Among the impact days, 28 were associated with hurricanes and 183 with tropical storms. There were 236 ED visits for unintentional non-fire-related CO poisonings during the periods of interest: 135 during impact periods (0.06 visits per county per day) and 101 during control periods (0.01 visits per county per day). Thirty-one of these visits occurred after tropical storms (0.01 visits per county per day) compared to 104 visits after hurricanes (0.46 visits per county
0
0.2
0.4
0.6
0.8
1
1.2
1.4
2004 2005 2006 2007 2008 2009 2010 2011 2012
Rat
e Pe
r 100
,000
Year
Figure 13. Rate of carbon monoxide poisoning hospitalizations per 100,000 population, Florida, 2004-2012.
0
0.5
1
1.5
2
2.5
2005 2006 2007 2008 2009 2010 2011 2012
Rat
e Pe
r 100
,000
Year
Figure 12. Rate of carbon monoxide poisoning ED visits per 100,000 population, Florida, 2005-2012.
15
per day). Again, the rate of CO poisoning-related ED visits during impact periods was significantly greater than during control periods (RR: 3.44; 95% CI: 2.07, 5.72).
Hospitalizations. Finally, 183 hospitalizations related to unintentional non-fire-related CO poisonings occurred during the periods of interest (265 impact and 375 control days), with the majority occurring during impact periods rather than control periods (121 vs. 62, respectively). Among impact periods, hurricane impacts had a greater number of hospitalizations (87 visits or 0.14 per county per day) than did tropical storm impacts (34 visits or 0.01 per county per day). Rates of CO poisoning-related hospitalizations were also significantly higher during impact than control periods (RR: 4.00; 95% CI: 2.90, 5.51).
Foodborne and Waterborne Disease
The foodborne and waterborne diseases chosen as health indicators for this study are notifiable diseases in Florida (Table 5). Campylobacteriosis and salmonellosis are bacterial diseases more commonly associated with foodborne transmission. Giardiasis and cryptosporidiosis, protozoan diseases, and vibriosis, a bacterial disease, are more commonly associated with waterborne transmission and contamination of water sources. For some of these diseases, there are other modes of transmission besides foodborne or waterborne, such as environmental exposure and zoonotic or person-to-person transmission. Affected individuals, known as cases, often have mild or asymptomatic infections, and many cases do not seek treatment and are not reported.
Campylobacter: Campylobacteriosis is an enteric disease caused by bacteria from the genus Campylobacter. The illness is characterized by diarrhea, often with bloody stools, malaise, fever, abdominal pain, nausea, and vomiting. This is a zoonotic infection most commonly found in cattle and poultry, and usual mode of transmission is ingestion of the bacteria from undercooked meat, raw milk, and other contaminated sources (Control of Communicable Diseases Manual [CCDM], 2008; Florida Department of Health [DOH], 2011). It is estimated that 80% of all cases are foodborne. The estimated number of annual U.S. cases is over 2.4 million, and the ratio for reported to unreported cases is 1:38 (Mead et al., 1999).
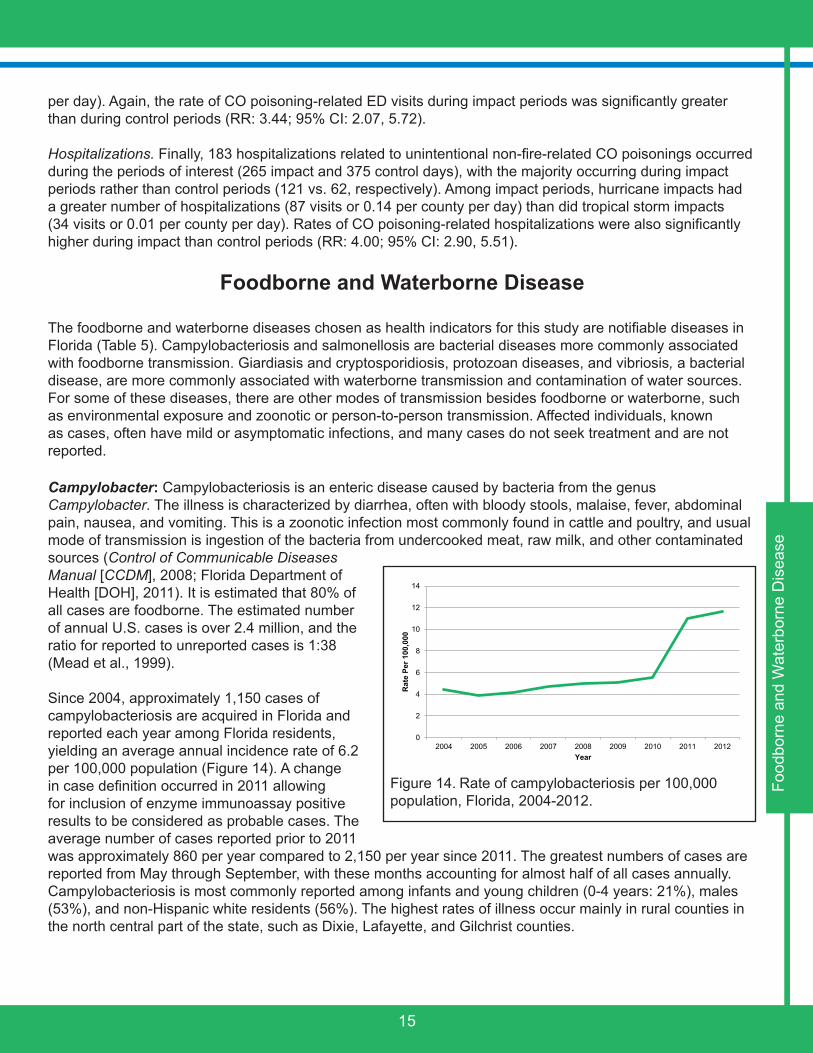
Since 2004, approximately 1,150 cases of campylobacteriosis are acquired in Florida and reported each year among Florida residents, yielding an average annual incidence rate of 6.2 per 100,000 population (Figure 14). A change in case definition occurred in 2011 allowing for inclusion of enzyme immunoassay positive results to be considered as probable cases. The average number of cases reported prior to 2011 was approximately 860 per year compared to 2,150 per year since 2011. The greatest numbers of cases are reported from May through September, with these months accounting for almost half of all cases annually. Campylobacteriosis is most commonly reported among infants and young children (0-4 years: 21%), males (53%), and non-Hispanic white residents (56%). The highest rates of illness occur mainly in rural counties in the north central part of the state, such as Dixie, Lafayette, and Gilchrist counties.
0
2
4
6
8
10
12
14
2004 2005 2006 2007 2008 2009 2010 2011 2012
Rat
e Pe
r 100
,000
Year
Food
born
e an
d W
ater
born
e D
isea
seFigure 14. Rate of campylobacteriosis per 100,000 population, Florida, 2004-2012.
16
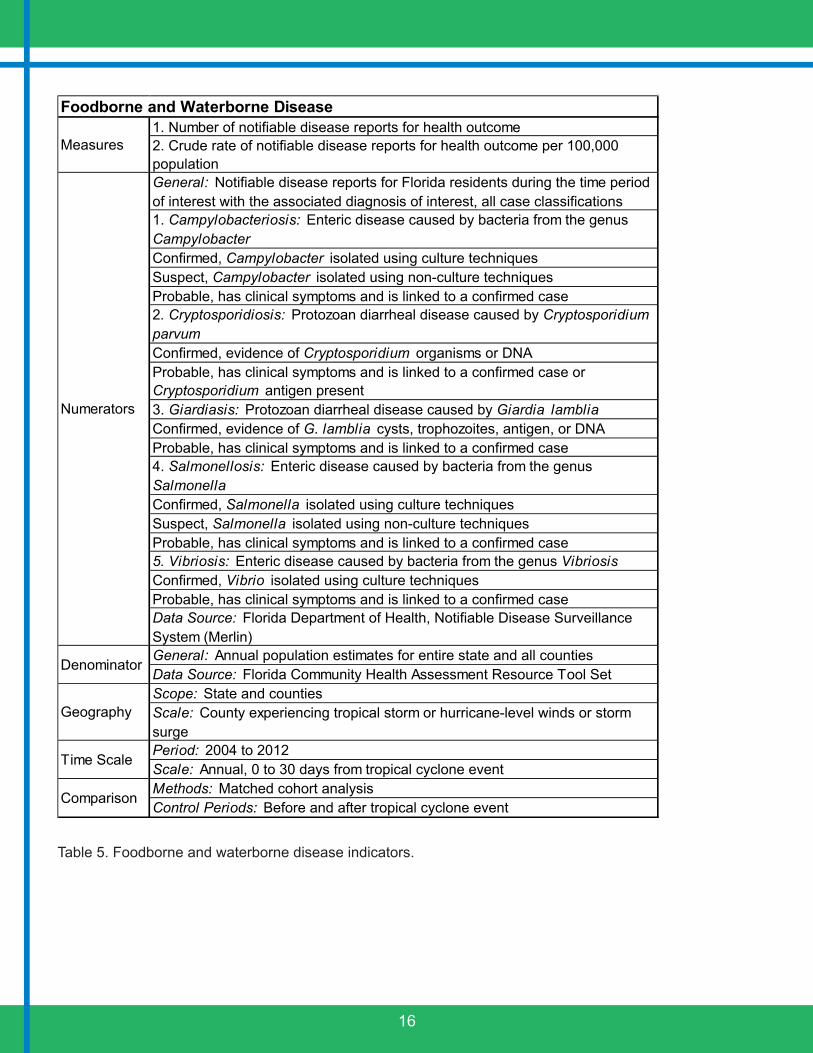
1. Number of notifiable disease reports for health outcome2. Crude rate of notifiable disease reports for health outcome per 100,000 populationGeneral: Notifiable disease reports for Florida residents during the time period of interest with the associated diagnosis of interest, all case classifications1. Campylobacteriosis: Enteric disease caused by bacteria from the genus CampylobacterConfirmed, Campylobacter isolated using culture techniquesSuspect, Campylobacter isolated using non-culture techniquesProbable, has clinical symptoms and is linked to a confirmed case2. Cryptosporidiosis: Protozoan diarrheal disease caused by Cryptosporidium parvumConfirmed, evidence of Cryptosporidium organisms or DNAProbable, has clinical symptoms and is linked to a confirmed case or Cryptosporidium antigen present3. Giardiasis: Protozoan diarrheal disease caused by Giardia lambliaConfirmed, evidence of G. lamblia cysts, trophozoites, antigen, or DNAProbable, has clinical symptoms and is linked to a confirmed case4. Salmonellosis: Enteric disease caused by bacteria from the genus SalmonellaConfirmed, Salmonella isolated using culture techniquesSuspect, Salmonella isolated using non-culture techniquesProbable, has clinical symptoms and is linked to a confirmed case5. Vibriosis: Enteric disease caused by bacteria from the genus VibriosisConfirmed, Vibrio isolated using culture techniquesProbable, has clinical symptoms and is linked to a confirmed caseData Source: Florida Department of Health, Notifiable Disease Surveillance System (Merlin)General: Annual population estimates for entire state and all countiesData Source: Florida Community Health Assessment Resource Tool SetScope: State and countiesScale: County experiencing tropical storm or hurricane-level winds or storm surgePeriod: 2004 to 2012Scale: Annual, 0 to 30 days from tropical cyclone eventMethods: Matched cohort analysisControl Periods: Before and after tropical cyclone event
Comparison
Time Scale
Foodborne and Waterborne Disease
Measures
Numerators
Denominator
Geography
Table 5. Foodborne and waterborne disease indicators.
17
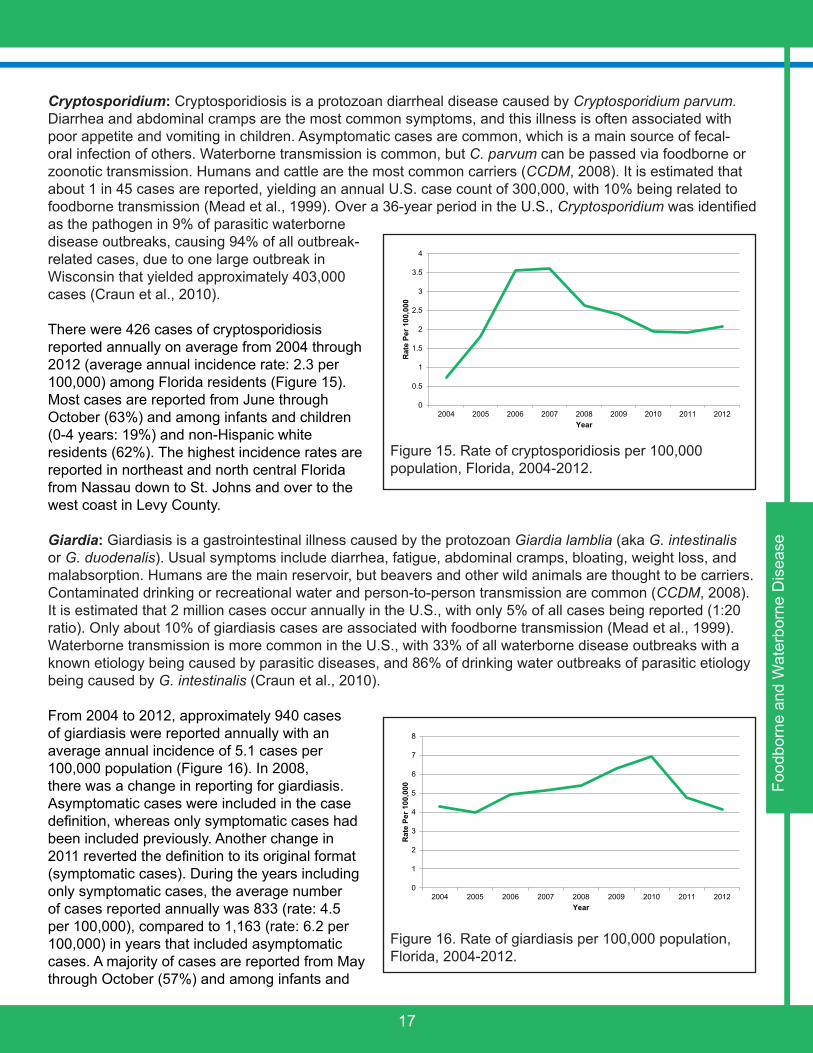
Cryptosporidium: Cryptosporidiosis is a protozoan diarrheal disease caused by Cryptosporidium parvum. Diarrhea and abdominal cramps are the most common symptoms, and this illness is often associated with poor appetite and vomiting in children. Asymptomatic cases are common, which is a main source of fecal-oral infection of others. Waterborne transmission is common, but C. parvum can be passed via foodborne or zoonotic transmission. Humans and cattle are the most common carriers (CCDM, 2008). It is estimated that about 1 in 45 cases are reported, yielding an annual U.S. case count of 300,000, with 10% being related to foodborne transmission (Mead et al., 1999). Over a 36-year period in the U.S., Cryptosporidium was identified as the pathogen in 9% of parasitic waterborne disease outbreaks, causing 94% of all outbreak-related cases, due to one large outbreak in Wisconsin that yielded approximately 403,000 cases (Craun et al., 2010).
There were 426 cases of cryptosporidiosis reported annually on average from 2004 through 2012 (average annual incidence rate: 2.3 per 100,000) among Florida residents (Figure 15). Most cases are reported from June through October (63%) and among infants and children (0-4 years: 19%) and non-Hispanic white residents (62%). The highest incidence rates are reported in northeast and north central Florida from Nassau down to St. Johns and over to the west coast in Levy County.
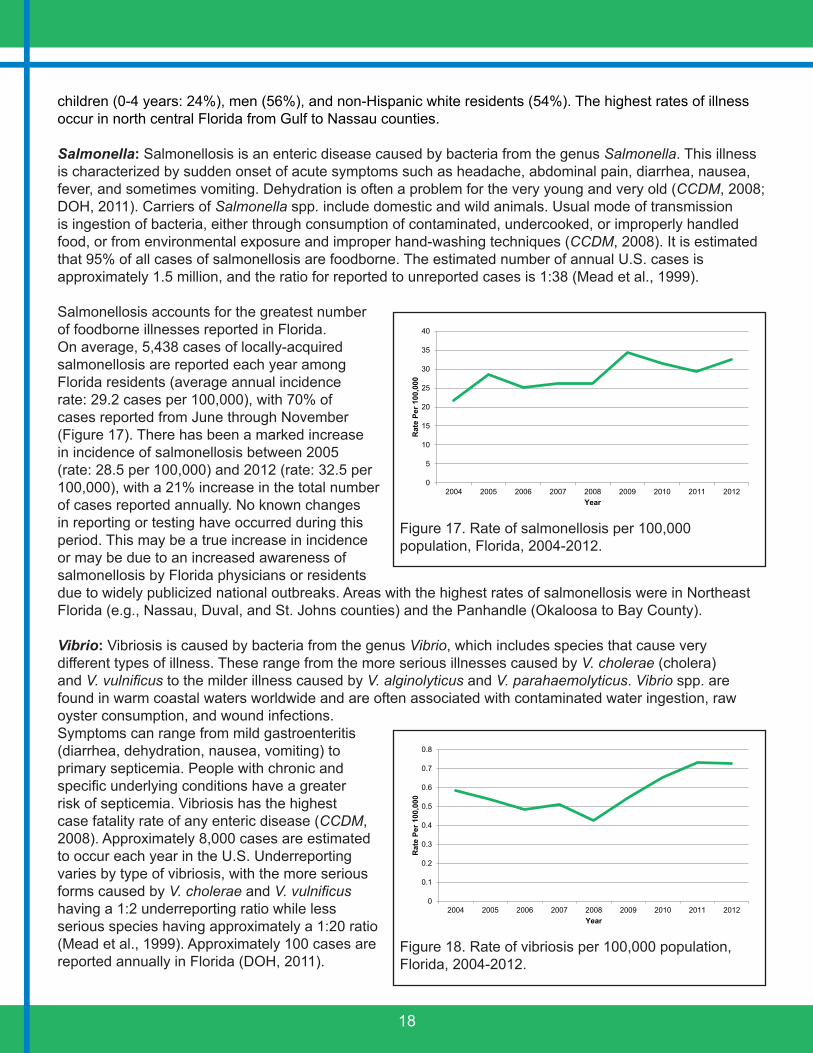
Giardia: Giardiasis is a gastrointestinal illness caused by the protozoan Giardia lamblia (aka G. intestinalis or G. duodenalis). Usual symptoms include diarrhea, fatigue, abdominal cramps, bloating, weight loss, and malabsorption. Humans are the main reservoir, but beavers and other wild animals are thought to be carriers. Contaminated drinking or recreational water and person-to-person transmission are common (CCDM, 2008). It is estimated that 2 million cases occur annually in the U.S., with only 5% of all cases being reported (1:20 ratio). Only about 10% of giardiasis cases are associated with foodborne transmission (Mead et al., 1999). Waterborne transmission is more common in the U.S., with 33% of all waterborne disease outbreaks with a known etiology being caused by parasitic diseases, and 86% of drinking water outbreaks of parasitic etiology being caused by G. intestinalis (Craun et al., 2010).
From 2004 to 2012, approximately 940 cases of giardiasis were reported annually with an average annual incidence of 5.1 cases per 100,000 population (Figure 16). In 2008, there was a change in reporting for giardiasis. Asymptomatic cases were included in the case definition, whereas only symptomatic cases had been included previously. Another change in 2011 reverted the definition to its original format (symptomatic cases). During the years including only symptomatic cases, the average number of cases reported annually was 833 (rate: 4.5 per 100,000), compared to 1,163 (rate: 6.2 per 100,000) in years that included asymptomatic cases. A majority of cases are reported from May through October (57%) and among infants and
0
0.5
1
1.5
2
2.5
3
3.5
4
2004 2005 2006 2007 2008 2009 2010 2011 2012R
ate
Per 1
00,0
00
Year
Figure 15. Rate of cryptosporidiosis per 100,000 population, Florida, 2004-2012.
0
1
2
3
4
5
6
7
8
2004 2005 2006 2007 2008 2009 2010 2011 2012
Rat
e Pe
r 100
,000
Year
Figure 16. Rate of giardiasis per 100,000 population, Florida, 2004-2012.
Food
born
e an
d W
ater
born
e D
isea
se
18
children (0-4 years: 24%), men (56%), and non-Hispanic white residents (54%). The highest rates of illness occur in north central Florida from Gulf to Nassau counties.
Salmonella: Salmonellosis is an enteric disease caused by bacteria from the genus Salmonella. This illness is characterized by sudden onset of acute symptoms such as headache, abdominal pain, diarrhea, nausea, fever, and sometimes vomiting. Dehydration is often a problem for the very young and very old (CCDM, 2008; DOH, 2011). Carriers of Salmonella spp. include domestic and wild animals. Usual mode of transmission is ingestion of bacteria, either through consumption of contaminated, undercooked, or improperly handled food, or from environmental exposure and improper hand-washing techniques (CCDM, 2008). It is estimated that 95% of all cases of salmonellosis are foodborne. The estimated number of annual U.S. cases is approximately 1.5 million, and the ratio for reported to unreported cases is 1:38 (Mead et al., 1999).
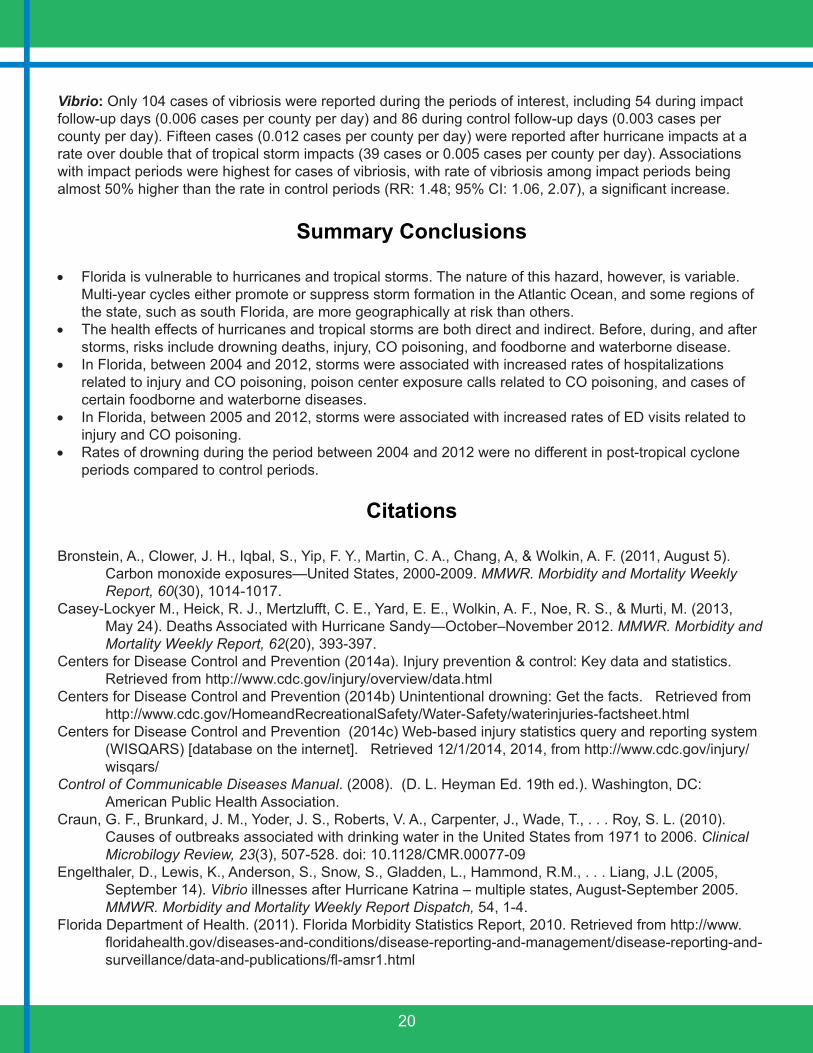
Salmonellosis accounts for the greatest number of foodborne illnesses reported in Florida. On average, 5,438 cases of locally-acquired salmonellosis are reported each year among Florida residents (average annual incidence rate: 29.2 cases per 100,000), with 70% of cases reported from June through November (Figure 17). There has been a marked increase in incidence of salmonellosis between 2005 (rate: 28.5 per 100,000) and 2012 (rate: 32.5 per 100,000), with a 21% increase in the total number of cases reported annually. No known changes in reporting or testing have occurred during this period. This may be a true increase in incidence or may be due to an increased awareness of salmonellosis by Florida physicians or residents due to widely publicized national outbreaks. Areas with the highest rates of salmonellosis were in Northeast Florida (e.g., Nassau, Duval, and St. Johns counties) and the Panhandle (Okaloosa to Bay County).
Vibrio: Vibriosis is caused by bacteria from the genus Vibrio, which includes species that cause very different types of illness. These range from the more serious illnesses caused by V. cholerae (cholera) and V. vulnificus to the milder illness caused by V. alginolyticus and V. parahaemolyticus. Vibrio spp. are found in warm coastal waters worldwide and are often associated with contaminated water ingestion, raw oyster consumption, and wound infections. Symptoms can range from mild gastroenteritis (diarrhea, dehydration, nausea, vomiting) to primary septicemia. People with chronic and specific underlying conditions have a greater risk of septicemia. Vibriosis has the highest case fatality rate of any enteric disease (CCDM, 2008). Approximately 8,000 cases are estimated to occur each year in the U.S. Underreporting varies by type of vibriosis, with the more serious forms caused by V. cholerae and V. vulnificus having a 1:2 underreporting ratio while less serious species having approximately a 1:20 ratio (Mead et al., 1999). Approximately 100 cases are reported annually in Florida (DOH, 2011).
0
5
10
15
20
25
30
35
40
2004 2005 2006 2007 2008 2009 2010 2011 2012
Rat
e Pe
r 100
,000
Year
Figure 17. Rate of salmonellosis per 100,000 population, Florida, 2004-2012.
0
0.1
0.2
0.3
0.4
0.5
0.6
0.7
0.8
2004 2005 2006 2007 2008 2009 2010 2011 2012
Rat
e Pe
r 100
,000
Year
Figure 18. Rate of vibriosis per 100,000 population, Florida, 2004-2012.

19
Between 2004 and 2012, a total of 961 cases of vibriosis were reported among Florida residents, yielding an average of 107 cases per year (average annual incidence rate: 0.58 per 100,000). As with most foodborne and waterborne illnesses, vibriosis has a distinct seasonal pattern, with 81% of cases occurring between April and October. There has been a marked increase in incidence of vibriosis between 2008 (rate: 0.42 per 100,000) and 2012 (rate: 0.72 per 100,000), with a 71% increase in the total number of cases reported annually (Figure 18). No known changes in reporting or testing have occurred during this period. This may be a true increase in incidence or may be due to an increased awareness of vibriosis by Florida physicians or residents as a result of educational campaigns and press releases from the DOH.
The epidemiology of this disease is markedly different from other foodborne and waterborne diseases. Most cases of vibriosis are reported among individuals aged 35 to 74 years (59%) and males (73%), in contrast to the higher rates in infants and children and fairly even gender distribution of the other diseases considered in this report. Additionally, a greater number of cases are reported in coastal communities statewide. Vibrio alginolyticus (27%) was the most common Vibrio species reported during this time period, followed by V. parahaemolyticus and V. vulnificus (26% each). Higher case rates are seen in the Panhandle of Florida.
Tropical Cyclones and Foodborne and Waterborne Disease
For all foodborne and waterborne diseases of interest, there were a total of 1,231 follow-up days of interest, including 456 impact days and 775 control days. Among the impact days, 42 were associated with hurricanes and 414 with tropical storms. We examined unadjusted associations between tropical cyclones and specific foodborne and waterborne diseases using Poisson regression models.
Campylobacter: During the impact and control periods of interest, there were 1,260 cases of campylobacteriosis reported. Among the impact days, there were 384 cases (crude rate: 0.04 cases per county per day); whereas among the control follow-up days, 876 cases were reported (0.03 per county per day). Follow-up days associated with hurricanes had a higher rate of case reports than tropical storm days (0.05 vs. 0.04 cases per county per day, respectively). Impact periods were associated with a slightly greater rate of campylobacteriosis cases than control periods (RR: 1.02; 95% CI: 0.90, 1.14), though this result was not significant.
Cryptosporidium: A total of 512 cases of cryptosporidiosis were reported during the periods of interest, with 160 in impact periods (0.02 cases per county per day) and 352 in control periods (0.01 cases per county per day). Hurricane impact days were associated with lower case rates than tropical storm days (0.01 vs. 0.02 cases per county per day, respectively). Impact periods were significantly associated with higher case rates than control periods (RR: 1.26; 95% CI: 1.04, 1.52).
Giardia: During the periods of interest, 1,159 cases of giardiasis were reported. Of these, 346 occurred during impact periods (0.04 cases per county per day) and 813 during control periods (0.03 cases per county per day). Among impact periods, 37 cases were reported after hurricane impacts, which had a slightly lower case rate (0.03 cases per county per day) compared to tropical storm impacts (309 cases or 0.04 cases per county per day). Though the result was not significant, impact periods were associated with slightly higher rates of giardiasis than control periods (RR: 1.01; 95% CI: 0.89, 1.14).
Salmonella: For salmonellosis, 6,909 total cases occurred during impact and control periods of interest. Of these, 2,537 occurred during impact follow-up days (0.28 cases per county per day) and 4,372 occurred during control follow-up days (0.15 cases per county per day). Case rates following hurricane impacts were greater than rates following tropical storm impacts (0.36 vs. 0.27 cases per county per day, respectively). Rates of salmonellosis were significantly increased by 35% in impact vs. control periods (RR: 1.35; 95% CI: 1.29, 1.42).
Food
born
e an
d W
ater
born
e D
isea
se
20
Vibrio: Only 104 cases of vibriosis were reported during the periods of interest, including 54 during impact follow-up days (0.006 cases per county per day) and 86 during control follow-up days (0.003 cases per county per day). Fifteen cases (0.012 cases per county per day) were reported after hurricane impacts at a rate over double that of tropical storm impacts (39 cases or 0.005 cases per county per day). Associations with impact periods were highest for cases of vibriosis, with rate of vibriosis among impact periods being almost 50% higher than the rate in control periods (RR: 1.48; 95% CI: 1.06, 2.07), a significant increase.
Summary Conclusions
• Florida is vulnerable to hurricanes and tropical storms. The nature of this hazard, however, is variable. Multi-year cycles either promote or suppress storm formation in the Atlantic Ocean, and some regions of the state, such as south Florida, are more geographically at risk than others.
• The health effects of hurricanes and tropical storms are both direct and indirect. Before, during, and after storms, risks include drowning deaths, injury, CO poisoning, and foodborne and waterborne disease.
• In Florida, between 2004 and 2012, storms were associated with increased rates of hospitalizations related to injury and CO poisoning, poison center exposure calls related to CO poisoning, and cases of certain foodborne and waterborne diseases.
• In Florida, between 2005 and 2012, storms were associated with increased rates of ED visits related to injury and CO poisoning.
• Rates of drowning during the period between 2004 and 2012 were no different in post-tropical cyclone periods compared to control periods.
Citations
Bronstein, A., Clower, J. H., Iqbal, S., Yip, F. Y., Martin, C. A., Chang, A, & Wolkin, A. F. (2011, August 5). Carbon monoxide exposures—United States, 2000-2009. MMWR. Morbidity and Mortality Weekly Report, 60(30), 1014-1017.
Casey-Lockyer M., Heick, R. J., Mertzlufft, C. E., Yard, E. E., Wolkin, A. F., Noe, R. S., & Murti, M. (2013, May 24). Deaths Associated with Hurricane Sandy—October–November 2012. MMWR. Morbidity and Mortality Weekly Report, 62(20), 393-397.
Centers for Disease Control and Prevention (2014a). Injury prevention & control: Key data and statistics. Retrieved from http://www.cdc.gov/injury/overview/data.html
Centers for Disease Control and Prevention (2014b) Unintentional drowning: Get the facts. Retrieved from http://www.cdc.gov/HomeandRecreationalSafety/Water-Safety/waterinjuries-factsheet.html
Centers for Disease Control and Prevention (2014c) Web-based injury statistics query and reporting system (WISQARS) [database on the internet]. Retrieved 12/1/2014, 2014, from http://www.cdc.gov/injury/wisqars/
Control of Communicable Diseases Manual. (2008). (D. L. Heyman Ed. 19th ed.). Washington, DC: American Public Health Association.
Craun, G. F., Brunkard, J. M., Yoder, J. S., Roberts, V. A., Carpenter, J., Wade, T., . . . Roy, S. L. (2010). Causes of outbreaks associated with drinking water in the United States from 1971 to 2006. Clinical Microbilogy Review, 23(3), 507-528. doi: 10.1128/CMR.00077-09
Engelthaler, D., Lewis, K., Anderson, S., Snow, S., Gladden, L., Hammond, R.M., . . . Liang, J.L (2005, September 14). Vibrio illnesses after Hurricane Katrina – multiple states, August-September 2005. MMWR. Morbidity and Mortality Weekly Report Dispatch, 54, 1-4.
Florida Department of Health. (2011). Florida Morbidity Statistics Report, 2010. Retrieved from http://www.floridahealth.gov/diseases-and-conditions/disease-reporting-and-management/disease-reporting-and-surveillance/data-and-publications/fl-amsr1.html
21
Holland, G. J., & Webster, P. J. (2007). Heightened tropical cyclone activity in the North Atlantic: Natural variability or climate trend? Philosophical Transactions: Mathematical, Physical and Engineering Sciences, 365(1860), 2695-2716.
Iqbal, S., Clower, J. H., Hernandez, S. A., Damon, S. A., & Yip, F. Y. (2012). A review of disaster-related carbon monoxide poisoning: surveillance, epidemiology, and opportunities for prevention. American Journal of Public Health, 102(10), 1957-63.
IPCC (2007). Climate Change 2007: Impacts, Adaptation and Vulnerability. Contribution of Working Group II to the Fourth Assessment Report of the Intergovernmental Panel on Climate Change. M.L. Parry, O.F. Canziani, J.P. Palutikof, P.J. van der Linden, & C.E. Hanson (Eds.), Cambridge University Press: Cambridge, UK.
Johnson, R. L., Thomas, R. G., Thomas, K. E., & Guzman, B. R. (Eds.) (2010). State Injury Indicators Report: Fifth Edition—2006. Atlanta, GA: Centers for Disease Control and Prevention.
Jones, K. T., Grigg, M., Crockett, L. K., Conti, L., Blackmore, C., Ward, D.,. . . Chertow, D. (2004, September 17). Preliminary medical examiner reports of mortality associated with Hurricane Charley—Florida 2004. MMWR. Morbidity and Mortality Weekly Report, 53(36), 835-837.
Landsea, C. W. (2007). Counting Atlantic tropical cyclones back to 1900. EOS, 88, 197-208. Landsea, C. W., Vecchi, G. A., Bengtsson, L., & Knutson, T. R. (2010). Impact of duration thresholds on
Atlantic tropical cyclone counts. Journal of Climate, 23, 2508-2519. Laosee, O. C., Gilchrist, J., & Rudd, R. A. (2012, May 18). Drowning—United States, 2005-2009. MMWR.
Morbidity and Mortality Weekly Report, 61(19), 344-347. Malmstadt, J., Sccheitlin, K., & Elsner, J. (2009). Florida Hurricanes and Damage Costs. Southeastern
Geographer, 49, 108-131. doi: 10.1353/sgo.0.0045Mann, M. E., & Emanuel, K. A. (2006). Atlantic hurricane trends linked to climate change. EOS, 87(24), 233-
241. doi: 10.1029/2006EO240001McNeill, K. M., Byers, P., Kittle, T., Hand, S., Parham, J., Mena, L., . . . Van Sickle, D. (2006, March 10).
Surveillance for illness and injury after Hurricane Katrina—Three counties, Mississippi, September 5-October 11, 2005. MMWR. Morbidity and Mortality Weekly Report, 55(9), 231-234.
Mead, P. S., Slutsker, L., Dietz, V., McCaig, L. F., Bresee, J. S., Shapiro, C., . . . Tauxe, R. V. (1999). Food-related illness and death in the United States. Emerging Infectious Diseases, 5(5), 607-625. doi: 10.3201/eid0505.990502
National Oceanic and Atmospheric Administration. (2010, February 17). NOAA National Weather Service to Use New Hurricane Wind Scale: Storm Surge and Flooding Prediction Dropped in New Scale. Retrived from http://www.noaanews.noaa.gov/stories2010/20100217_hurricane.html
National Oceanic and Atmospheric Administration. (2014). Historical Hurricane Tracks. Retrieved from http://coast.noaa.gov/hurricanes/#
National Oceanic and Atmospheric Administration, National Weather Service, National Hurricane Center. (2013). Saffier-Simpson Hurricane Wind Scale. Retrived from http://www.nhc.noaa.gov/aboutsshws.php
Needham, H. F., & Keim, B. D. (2012). A storm surge database for the US Gulf Coast. International Journal of Climatology, 32(14), 2108-2123.
Porta, M. (Ed.), 2008. A Dictionary of epidemiology, 5th edition. Oxford University Press: New York.Ragan, P., Schulte, J., Nelson, S. J., & Jones, K. T. (2008). Mortality surveillance: 2004 to 2005 Florida
hurricane-related deaths. The American Journal of Forensic Medicine and Pathology, 29(2), 148-153.Straif-Bourgeois, S., Sokol, T., Thomas, A., Ratard, R., Greene, K. D., Mintz, E., . . . Vranken, P. (2006,
January 20). Two cases of toxigenic Vibrio cholerae 01 infection after Hurricanes Katrina and Rita- Louisiana, October 2005. MMWR. Morbidity and Mortality Weekly Report, 55(2), 31-32.
Winsberg, M. D. (2003). Florida weather. Gainesville, FL: University Press of Florida.Xu, J. (2014, January 24). QuickStats: Average annual number of deaths and death rates from unintentional,
non-fire-related carbon monoxide poisoning, by sex and age group – United States, 1999-2010. MMWR. Morbidity and Mortality Weekly Report, 63(3), 65.
Cita
tions

22
Acknowledgments
Thank you to everyone whose dedication has made this effort successful, including members of the program’s Technical Advisory Group, the DOH staff who assisted in the grant application process, and the CDC Climate and Health Program for providing funding and technical assistance.
Special thanks to Dr. Charles E. Konrad for providing descriptions of historic tropical storm and hurricane patterns featured in this report and for careful and clear explanations of how to integrate weather data into a public health framework.
We truly appreciate the efforts of Jason Maynard, a Florida A&M University Masters of Public Health intern during the spring of 2014, who worked with us and helped develop the methodology for this analysis.
And finally, thank you to David Zierden, Melissa Griffin, and the rest of the staff at the Florida State University Center for Ocean-Atmospheric Prediction Studies for providing expert advice and useable weather data for our state.
For more information on geographic, social, and medical vulnerability to hazards in Florida, please see Climate-Sensitive Hazards in Florida: Identifying and Prioritizing Threats to Build Resilience against Climate Effects by Emrich, C.T., Morath, D.P., Bowser, G.C., Reeves, R. at the Hazard and Vulnerability Research Institute, available at http://www.floridahealth.gov/environmental-health/climate-and-health/vulnerability/index.html.
The following software was used for analysis and displaying results: Geographic Information System (GIS) ArcMAP v.10.0 (ESRI: Redlands, CA); SAS v9.3 (SAS Institute: Cary, NC); InDesign CS6 (Adobe: San Jose, CA).
Appendix 1: Data Sources
Agency for Health Care Administration (AHCA): AHCA, managed by the Executive Branch of the Florida state government, is the main health policy and planning entity responsible for managing the state’s Medicaid program, licensing the 41,000 state health care facilities, and sharing health care data (http://ahca.myflorida.com). AHCA has been collecting hospital discharge and ED data since 1988 and 2005, respectively. These data sources contain a detailed record of each hospitalization and ED visit, and each record lists the primary and contributing diagnoses, patient demographics, and billing information. Hospital discharge data also contain information on primary and secondary procedures. Some of the strengths of using AHCA data include the following: AHCA data provide comprehensive statewide coverage and have many years of historical data available; hospital discharge and ED data provide DOH the ability to study non-notifiable diseases and injuries, and provide additional data to augment and evaluate notifiable disease information; and AHCA data provide overall and categorical health care charges that can be used to estimate cost. Limitations of AHCA data include the absence of data from federal facilities, a six-month to one-year lag in access to data due to internal reporting and validation processes, limited available identifiers, and questionable clinical accuracy as with any study relying solely on ICD-9-CM codes.
Florida Poison Information Center Network (FPICN): The FPICN is coordinated through DOH Division of Children’s Medical Services, and includes three centers (Jacksonville, Tampa, and Miami) (http://www.fpicn.org). Each center is certified by the American Association of Poison Control Centers and is located on the campus of a major teaching hospital. FPICN also has a standalone data center. Patient exposures are assessed, managed, and coded by specialists in poison information including pharmacists, nurses,

23
physicians, or physician assistants trained and certified to operate the hotline. Data collected on each call includes demographic and geographic information, date and site of exposure, exposure reason, case management information, ingested substances, symptoms, and outcome. FPICN has been taking calls from Florida’s public since 1998, and data is available in real-time, 24 hours per day and seven days per week. The following limitations should be noted. FPICN has follow-up protocols to ensure accuracy and completeness of data, but missing information can still be a problem. Also, the poison centers rely heavily on self-reported information, rather than on validated clinical information, in some instances.
Florida’s Notifiable Disease Surveillance System (Merlin): Merlin is a web-based surveillance system that is maintained by the DOH, Division of Disease Control and Health Protection, Bureau of Epidemiology, Surveillance Systems Section (http://www.floridahealth.gov/diseases-and-conditions/disease-reporting-and-management/disease-reporting-and-surveillance/index.html). It is used for notifiable disease reporting by all of Florida’s 67 counties and has over 1,100 registered users. Data are collected and entered primarily by DOH staff located in the counties. Merlin is a single, statewide database with real-time web access for entering patient demographic and geographic information, case data (e.g., symptoms and exposures), laboratory results, health care visit information, extended case report form data, and control measures and outbreak information, where applicable. There are several strengths of the Merlin system that should be noted. Merlin is a flexible system that can be adapted to meet the unique needs for reporting of specific diseases through the Merlin Outbreak Module or Extended Data screens. Having statewide data on reportable diseases in Florida over the past two decades (since 1992) provides easily accessed essential background information, clinical data, and a means to view disease rates and other trends over time. The limitations of Merlin include variation in training and expertise of county staff, variable completeness and timeliness of case reporting, differing priorities for case follow-up, and differences in clinical and surveillance case definitions.
Southeast Regional Climate Center (SERCC): The SERCC is one of six regional offices around the U.S. that were established by NOAA in 1989 to put a greater focus on regional weather data, patterns, products, etc. (www.sercc.com). The SERCC is located at the University of North Carolina in Chapel Hill and serves the following U.S. states and territories: Alabama, Florida, Georgia, North Carolina, South Carolina, Virginia, Puerto Rico, and the U.S. Virgin Islands. The SERCC maintains regional weather data including historical summaries, monthly and seasonal data, local storm reports, temperature and precipitation data, and southeast-specific forecasts.
Comprehensive Surge Database (SURGEDAT): SURGEDAT is a comprehensive database for storm surge data for the U.S. Gulf Coast, developed and maintained by the Department of Geography and Anthropology at Louisiana State University (http://surge.srcc.lsu.edu/). SURGEDAT has collected data on location and peak surge height for all surge events since 1880 with at least a 1.22m storm surge. Information includes location and coordinates, storm system, and peak surge height, as well as peak surge-tide height. A variety of data sources were used to compile SURGEDAT including federal government agencies, academic publications, and newspaper and periodical articles (Needham & Keim, 2012). Of note, for many systems, only the peak surge event and location are included and not the full extent of the storm surge for each system. Therefore, other Florida counties may have experienced significant storm surge but are not included as such in our analyses. Other important limitations to note are the following: tide heights are based on both scientific and anecdotal information; and we are unable to differentiate between datums used, references of mean sea level, and storm tide vs. storm surge in some instances.
App
endi
x
24
Appendix 2: Discrepancies Between Reporting Sources
Please note that there may be differences between the numbers of cases of notifiable diseases reported in this Hazard and Health Profile and the DOH Bureau of Epidemiology annual Florida Morbidity Statistics Reports. For this report, we include all case classifications (confirmed, probable, and suspect) and only cases that were acquired in Florida among Florida residents, whereas the Morbidity Statistics Reports include all cases among Florida residents, regardless of where the disease was acquired, but only those cases considered confirmed and probable. Additionally, we exclude cases when no age at diagnosis is available.
There also may be differences between the ED visits, hospitalizations, and deaths reported in this report and counts or rates reported by other programs within DOH, including Florida Community Health Assessment Resource Tool Set. For this profile, standard definitions for unintentional drowning and all-cause injury were revised to be hazard-specific. For drowning, we excluded drowning deaths that occurred in the bathtub and included drowning deaths that resulted from motor vehicle accidents (e.g., boats). For injury, we additionally excluded injuries that were unlikely to be related to weather hazards (e.g., late effects of injuries, poisoning, and toxic effects of substances).
Published March 2015
Prepared By:Meredith Jagger, MS, MPH
Kristina Kintziger, PhDJustin Dumas
Sharon Watkins, PhD
Florida Department of HealthDivision of Disease Control and Health Protection
Bureau of Epidemiology4052 Bald Cypress Way, Bin A-12
Tallahassee, FL 32399(850) 245-4401
www.flhealth.gov
Suggested Citation:Florida Department of Health, Division of Disease Control and Health Protection, Bureau of Epidemiology, (2015). Health Effects of Tropical Storms and Hurricanes in Florida.