health care financing in eight latin american and ... · health care financing in eight latin...
TRANSCRIPT

Health Care Financing in Eight Latin American and Caribbean
Nations: The First Regional National Health Accounts Network
16


Health Care Financing in Eight Latin American
and Caribbean Nations: The First Regional National Health Accounts Network
Peter Berman, Ph.D. Harvard School of Public Health
Lisa Arellanes, M.Sc.
Harvard School of Public Health
Pamela Henderson, M.Sc. Consultant
Pan American Health Organization
Alessandro Magnoli, M.B.A. Harvard School of Public Health
April 1999

This publication was produced by the Partnerships for Health Reform, funded by USAID under contract no. HRN-C-00-95-00024, in collaboration with the Latin America and Caribbean Regional Health Sector Reform Initiative, funded by USAID under contract no. HRN-5974-C-00-5024-00. The opinions expressed herein are those of the authors and do not necessarily reflect the views of the U.S. Agency for International Development.

ABSTRACT
This paper presents summary results of the results of eight national health accounts (NHA) studies conducted in the Latin America and Caribbean region. The work was carried out by national teams using a common methodology. Substantial cooperation among the national groups was fostered through a regional network, which organized meetings and coordinated technical assistance to each team. The results show that comprehensive NHA studies are feasible in lower income countries and can significantly increase the accuracy and detail of health expenditures relative to previous studies. There are large differences across countries in the level of health spending and in its composition. In many of the countries, private sector financing intermediaries comprise a large share of total health spending. Hospitals and public health services are mainly supported by government funders, while ambulatory treatment services are primarily supported by private sector funders. The paper concludes with a discussion of policy applications of NHA and issues in applying the NHA methodology in lower income countries.

vii
TABLE OF CONTENTS
Acronyms ........................................................................................................................................ ix
Acknowledgements..........................................................................................................................xi
1. Introduction..............................................................................................................................1
2. Comparative Analysis of Health Expenditure: What Can We Learn?.........................................3
3. How Do The LACNHA Estimates Compare with Other Recent Efforts in the Region? .............7
3.1 Sources of Differences Between Health Expenditure Estimates...........................................7 3.2 Specific Analysis of Differences between Estimates: A Look at Four LAC Countries ....... 10
4. Income, Total Health Spending, and Outcomes....................................................................... 15
5. The Public-Private Mix in Health Care Financing ................................................................... 19
6. Resource Allocation in the Health Sector: Spending on Major Health Care Functions ............. 21
7. The Flow of Funds to Different Types of Health Care Providers ............................................. 23
8. Expenditure Shares to Different Types of Health Care Inputs.................................................. 27
9. Summary and Implications of Key Findings............................................................................ 29
10. Achievements, Limitations and Potential for Future Investigation ........................................... 31
10.1 Policy Uses of NHA in the Network Countries ................................................................. 31 10.2 Sustainability.................................................................................................................... 32 10.3 Methods ........................................................................................................................... 32 10.4 Conclusions...................................................................................................................... 33
Annex A. Bolivia ............................................................................................................................ 35
Annex B. Dominican Republic ........................................................................................................ 41
Annex C. Ecuador........................................................................................................................... 47
Annex D. El Salvador...................................................................................................................... 53
Annex E. Guatemala ....................................................................................................................... 59
Annex F. Mexico............................................................................................................................. 63
Annex G. Nicaragua........................................................................................................................ 73
Annex H. Peru................................................................................................................................. 79
Annex I. Bibliography..................................................................................................................... 83

Health Care Financing in Eight Latin American and Caribbean Nations: The First Regional NHA Network
viii
PUBLICATIONS OF THE REGIONAL INITIATIVE OF HEALTH SECTOR REFORM FOR LATIN AMERICA AND THE CARIBBEAN................................................................................. 85
List of Tables
Table 1. Comparison of Recent Total Health Expenditure Estimates in the LAC Region .......................... 8
Table 2. Explanation of Differences Between NHA and PAHO Health Expenditure Estimates ............... 10
Table 3. Comparison of Public-Private Proportions of Total Health Expenditure (in % of total expenditure) ............................................................................................................. 13
Table 4. Contrasting Views of Public-Private Mix in Health Care Financing: Sources and Financing Intermediaries (% total expenditure) ............................................................................... 19
Table 5. Distribution of Total Health Expenditure Across the Major Types of Payers or Financing Intermediaries (in % of total expenditure)....................................................................... 20
Table 6. Shares of Total Health Expenditures Allocated to Specific Functions (in % of total expenditure) ............................................................................................................. 21
Table 7. Ratio of Public to Private Financing (Financing Intermediaries) for Main Types of Health Care Services (where available) ........................................................................................... 22
Table 8. Ecuador, 1995: Financing Intermediaries to Providers Matrix (in % of total Expenditure)......... 23
Table 9. How Funding Flows to Different Types of Providers Classified by Ownership ......................... 24
Table 10. Expenditure Shares to Salary and Drugs and Supplies by Ministries of Health and Social Insurance Organizations in Eight LAC Countries........................................................... 27
List of Figures
Figure 1. Life Expectancy and Per Capita Health Expenditure................................................................ 15
Figure 2. Life Expectancy and Health Expenditure in GDP .................................................................... 16
Figure 3. GDP and Health Spending: Absolute Values........................................................................... 16
Figure 4. GDP Per Capita and % to Health............................................................................................. 17
Figure 5. Social Health Insurance Coverage and Per Capita Health Spending......................................... 17

ix
ACRONYMS
GDP Gross Domestic Product
IADB Inter-American Development Bank
ILO International Labor Organization
IMF International Monetary Fund
LAC Latin America and the Caribbean
MOH Ministry of Health
NGO Non-governmental Organization
NHA National Health Accounts
OECD Organization for Economic Cooperation and Development
PAHO Pan American Health Organization
PHR Partnerships for Health Reform
USAID United States Agency for International Development
WHO World Health Organization


xi
ACKNOWLEDGEMENTS
Support for this work was provided by the United States Agency for International Development (USAID) through the Partnerships for Health Reform (PHR) project (HRN-C-00-95-00024) and through USAID grants under the Latin America and Caribbean Equitable Access Initiative to the Pan American Health Organization. The authors would like to know the helpful comments received from Dr. A. K. Nandakumar and other colleagues at the PHR project. We especially acknowledge the hard work, dedication and excellent work done by the eight NHA country teams, whose reports are cited extensively here. However, the authors take full responsibility for any errors contained in this paper.


1
1. INTRODUCTION
The Latin America and Caribbean National Health Accounts (LACNHA) network is a collaboration between the Partnerships for Health Reform Project, the Pan American Health Organization (PAHO), and national teams in eight countries in the Latin American and Caribbean region: Bolivia, Dominican Republic, Ecuador, El Salvador, Guatemala, Mexico, Nicaragua, and Peru. Funding for this project was provided by the United States Agency for International Development (USAID).
The objective of the LACNHA network was the development of consistent and comparable national health accounts estimates in the participating countries. The network also emphasized capacity building in the countries. In each country, NHA teams comprised specialists with different areas of expertise in health system and expenditure analysis, representing different governmental and non-governmental institutions. Typically, these included the Ministry of Health, the Ministry of Finance, national statistical authorities, and research or policy institutes. The network provided training and technical assistance. Through three network meetings, country teams developed their skills, shared experience in process and interim results, and worked to standardize methods and classifications.
Following the third network workshop, each country team produced a final NHA report for their own country. These reports were preceded by a national policy seminar in which results were presented to decision makers and their policy implications discussed. While the focus has been on country-based capacity and the usefulness of NHA for national authorities, the success of the network in using similar allows for a comparison of the country results.
This paper presents the first comparison of the LACNHA results. Its focus is breadth of comparison rather than an in-depth look at specific health expenditure estimates or health care system issues. It covers the major elements of the NHA framework to convey the range of what can be analyzed. This paper describes a number of substantial differences across the LACNHA countries in the level of health sector spending and its composition. Since this is the first time such detailed comparisons have been possible, and since they are based on the first application of a new methodology, readers should be cautious in interpreting these results. While this paper discusses explanations and implications of the estimates reported, it seeks more to provoke questions and further inquiry rather than to provide comprehensively reasoned explanations for similarities and differences.
Section 2 of the paper discusses recent international experience with comparative analysis of health expenditure. The following section (3) compares LACNHA estimates of total health expenditure in dollar and share-of-gross domestic product (GDP) terms with other recent estimates for the network countries, explaining some of the sources of differences with previous figures. Subsequent sections then look at specific results across the LACNHA countries. This includes key aggregate system-level results linking total health spending to health outcomes and levels of insurance coverage (Section 4), the public-private mix of spending (5), resource allocation to specific types of health care services (6), and who finances specific types of providers and services (7). Section 8 presents results of resource use in terms of specific types of expenditures, such as salaries, drugs, and capital investment items. Section 9 reviews the main results and their implications. Finally, Section 10 reviews the limitations of the LACNHA results and proposes follow-up steps for the LACNHA countries and others in the region.

3
2. COMPARATIVE ANALYSIS OF HEALTH EXPENDITURE: WHAT CAN WE LEARN?
International comparative studies of health expenditure began in the early part of this century and have gained increasing currency in the last 30 years. The movement to create standardized, comparable national health expenditure estimates appears in the work of the International Labor Organization (ILO) and the World Health Organization (WHO) in the 1950s and 1960s (Abel-Smith, 1963). Today, the Organization for Economic Cooperation and Development (OECD) compiles comparable health expenditure statistics annually for its member countries and provides public access to a computerized data set covering over 30 years of such information (OECD, 1998).
For advanced countries, mainly OECD members, comparing the level, composition, and trends in national health spending with other countries is often a starting place for national debates on health sector policies and reform. Hurst (1992) highlighted many of the key issues in his comparison of health spending data for OECD countries. He noted, for example, the generally rising share of national income going to health care, the different rates in expenditure growth across countries with similar levels of health and health insurance coverage, and the differences in how money was being spent on different types of health care services. Such comparisons address a number of important questions for national policy, including:
• What is an appropriate level of spending on health care?
• What return in health improvement can a nation expect from spending more or less or from altering the composition of its spending?
• What health care system factors explain the rate of growth in health spending and differences across countries in that growth? Can health care system policies be adjusted to achieve a desired or feasible rate of growth?
Lower and middle income countries have lagged behind in developing comparable estimates of national health expenditure, although given their poorer health conditions and more limited resources, these and other questions might be seen to be even more important than in the advanced countries. There have been comparative studies of health expenditure in the lower income countries, but these have been constrained by coverage and data problems.
Regional comparative studies were produced for developing nations covering periods in the 1980s: Vogel (1993) for Africa, McGreevey (1990) and Suares et al. (1995) for Latin America, and Griffin (1992) for Asia. These studies generally pulled together data from available international statistics and country reports. They provided cross-national comparisons for one year within a recent range. They estimated total and per capita national health spending and the composition of total spending in terms of public and private financing intermediaries. Partial estimates of the uses of funds were sometimes possible, for example, showing the break-up of public spending in terms of hospital and non-hospital services.
These studies provided a first benchmark comparison of what poorer countries were spending on health care and how those funds were organized in terms of public and private payers. They highlighted several key points:
• There was wide variation in spending levels in lower income countries. Health spending and

Health Care Financing in Eight Latin American and Caribbean Nations: The First Regional NHA Network
4
health outcomes rose as income rose, but there was not a strong positive correlation between spending and outcomes for countries at similar levels of income.
• Private health spending was a large share of national totals, even in countries striving to achieve a comprehensive public sector finance and delivery system.
• Government spending on primary level services was lower than on hospital services in many lower income countries despite official policy to give priority to primary care.
In 1993, the World Bank and WHO published the first truly global estimate of health spending with estimates for 140 countries including total spending and public and private shares of spending (World Bank, 1993; Murray et al., 1994). No estimates of the composition of health spending in terms of different uses were carried out. For a significant number of countries, private health spending data were not available and had to be estimated based on the link between national income and health spending in countries for which data were available.
These country studies addressed questions similar to the regional comparative analyses but with wider coverage. They highlighted the positive correlation between total spending and national income. They also noted that there was not a close link between national spending as a share of income and health outcomes. This “noise” in the relationship between spending and health suggests that other factors are important. These other factors probably include both health care system factors and other dimensions of social and economic development.
All of these studies suffered from serious data limitations. Even where data were available, a common framework to organize and categorize the information was lacking. This is no different from where the OECD countries were in the 1960s, when they initiated a coordinated effort to develop comparable health expenditure statistics. The development of comparable NHA methods for lower income countries (Berman, 1997), such as those now available for the LACNHA network countries, is an important step in this direction.
This first round of NHA estimates for eight LAC countries cannot address all or even most of the relevant questions. But it does reflect some of the lessons learned from international experience with health expenditure comparisons. The estimates are based on a comprehensive framework of national health spending—boundaries are defined, and missing or inadequate information can be identified. Spending attributed to the public and private sector is clearly defined in terms of sources and financing intermediaries. The composition of health expenditure in terms of several important uses classifications has been estimated.
Based on this framework, as applied in LAC and other countries, one can start to answer some additional important questions for lower and middle income countries:
• In terms of total health expenditure, comprehensive estimates are reporting higher levels of spending than previously measured and indicating that for some lower income countries health spending is already at a high level relative to income (Berman, 1999). What factors account for these different levels of spending and how might they be affected by reforms in finance and organization now being contemplated in the region?
• Much of this higher total spending is related to higher private health spending, especially out-of-pocket spending by households. There are several examples of this in the LACNHA results. How is this burden distributed? Are the benefits in terms of health and welfare commensurate with the costs?
Comparative Analysis of Health Expenditure: What Can We Learn?
5
• The influence of public sector spending on the health care system can be gauged in part from different views of the composition of total spending. Which providers and which services are being funded from public financing intermediaries? Can the state achieve health, efficiency, and equity objectives of reform primarily through interventions of state finance and provision? What role should be played by regulation of finance and provision in the non-government sector?
• Within the budget-financed sector, what explains differences in the shares of spending to specific types of inputs such as personnel and drugs? How efficient is the allocation of funds to these inputs?
To address some of these questions, which have captured international attention, lower income countries will ultimately need to be able to track health spending over time. This will require repeated implementation of NHA using a standard framework. The LACNHA network has taken the first steps in this direction.


7
3. HOW DO THE LACNHA ESTIMATES COMPARE WITH OTHER RECENT EFFORTS IN THE REGION?
Countries in the Latin American and Caribbean region have participated in efforts to estimate national health expenditures almost since such efforts began in the 1960s (see, for example, Abel-Smith, 1963). More recently, international organizations such as the PAHO and the World Bank, as well as USAID, have assembled available information to permit cross-country comparisons of the level and composition of health expenditure (Zschock, 1986; McGreevey, 1990; PAHO, 1994). In the 1990s, several region-wide estimates were developed that can be used for comparison with the current study. These include a careful set of estimates made for 1988 by PAHO (Suares et al., 1995), estimates assembled for the World Bank’s World Development Report 1993 and then revised (Govindaraj et al., 1997), and most recently preliminary results of a re-estimate by PAHO (1998).
Nevertheless, because the process of collecting and analyzing national health spending data in these other efforts was quite different from that of the LACNHA network, differences in the results should not be surprising. These other studies consist of national and international statistics assembled from secondary sources by small groups of external analysts working with the agencies sponsoring the reviews. The data may not have been developed for the purpose of estimating national health spending. They were sometimes incomplete or included elements that went beyond the agreed upon definition of health expenditure. For example, government spending might have been estimated from the International Monetary Fund’s (IMF) statistics on central government expenditure, which do not include spending by state and local governments, but which might include non-health items of expenditure. Data may have been taken from different years and used to estimate spending in the study year. Finally, in assembling these data, it was very difficult to check for internal consistency and double-counting.
In contrast, the LACNHA data were collected by a team in each country based on a comprehensive and consistent framework that had been adopted by all the countries in the group (see Berman, 1997, for more detail on the content and advantages of this approach). The NHA methodology included a common definition of what should be included as health expenditure. Specific spending estimates were entered into a “sources and uses” matrix framework that helps the analyst ensure consistency and avoid double-counting. Estimates were reviewed and discussed by different institutions in each country, which helped identify problems.
A basic problem with comparisons of different estimates is that there is no “gold standard” against which to judge results—such standards will only emerge from more sustained efforts in the region to develop estimation methods and repeatedly apply them, testing the results over time against previous estimates and the standards of plausibility imposed by health finance experts. To overcome this problem, NHA takes a first step to apply a comprehensive methodology at the national level and to compare results with earlier, more ad hoc efforts. The approach for now, therefore, is to look at differences in these estimates and to attempt to explain, with the more detailed information that emerged from the LACNHA studies, why these differences would occur.
3.1 SOURCES OF DIFFERENCES BETWEEN HEALTH EXPENDITURE ESTIMATES
The figures displayed in Table 1 compare the recent estimates for health care expenditures in the LAC region. Some large differences are apparent across the estimates. For example, not only do the

Health Care Financing in Eight Latin American and Caribbean Nations: The First Regional NHA Network
8
estimates of the Dominican Republic’s expenditure on health as a percentage of GDP increase substantially from 1988 to 1995, but the two per capita health expenditure estimates for 1995 differ significantly: US$164 according to the NHA report and US$77 according to PAHO.
TABLE 1. COMPARISON OF RECENT TOTAL HEALTH EXPENDITURE ESTIMATES IN THE LAC REGION
BOLIVIA DOMINICAN REPUBLIC ECUADOR EL
SALVADOR GUATEMALA MEXICO NICARAGUA PERU
Total per capita health expenditure (US$1988)1 39 32 79 53 30 86 27 41
% GDP (1988)1 4.5 4.8 6.3 5 3.3 3.8 5 3.1 Total per capita health expenditure (US$1990)2 34 59 39 58 37 155 31 59
% GDP (1990) 2 5.5 3.6 3.7 5.9 5.0 5.5 7.9 3.1 Total per capita health expenditure (US$1995)3 39 164* 71 135* 35 168 54 112
% GDP (1995) 3 4.45 7.3* 4.6 7.4* 2.2 5.5 12.9 4.2 Total per capita health expenditure (US$1995) 4 48 77 71 158 56 160 35 128
% GDP (1995) † 6 5.3 5.1 6.8 4.2 4.8 9.2 5.5 *Estimates are for the year 1996. 1Suarez, R. et al., 1995 2Govindraj, R. et al., 1997 31998 NHA Reports 4PAHO, 1998.
As introduced above, several factors account for these differences. Different studies use different sources of data, and sometimes the data are inconsistent, for a number of reasons. The estimates of national health expenditures by international organizations may rely on internationally published data that may be several years older than those available to the in-country NHA teams. Making reliable projections based on such data depends on stable and predictable economic conditions and on the degree to which they apply to the health sector. One benefit of the NHA studies is the ability to examine health budgets and government accounts in detail and to access the most recent national data on health spending, including data from household surveys. Two examples of this are the Dominican Republic and Guatemala, where each country recently implemented a household survey that yielded data not available to the earlier studies. Using the surveys, the NHA teams were able to estimate current expenditures on health rather than project expenditures from older sources.
Another source of difference may arise from the revisions to macroeconomic data. GDP figures for a given year are often adjusted in later years as more information is obtained. Likewise, the choice of exchange rate (year-average or end-of-year rate) and population estimate also affects of these comparative figures.
Differences also result from changing the scope of what is counted as a health care expenditure. International classifications of government health care expenditures are based on definitions of the functions of governments taken from the standard United Nations classification systems. One source that regularly produces fiscal data on government health expenditures is the International Monetary Fund (IMF), in its annual yearbook on Government Finance Statistics. In Section 5 of the Manual on Government Finance Statistics, the IMF defines Health Affairs and Services as including:
• Hospital affairs and services,
• Clinics, and medical, dental and paramedical practitioners,
How Do the LACNHA Estimates Compare with other Recent Efforts in the Region?
9
• Public health affairs and services,
• Medications, prostheses, medical equipment, and appliances or other prescribed health-related products,
• Applied research and experimental development related to the health and medical delivery system, and
• Health affairs and services not elsewhere classified.
In estimating government health expenditures, PAHO and the World Bank have drawn information from the Government Finance Statistics, as well as from a broad range of official government documents, country studies, and reports. These sources report what governments report to them, assuming consistent application of the classifications and definitions. The NHA country teams on the other hand, had the resources and time to perform a substantially more detailed analysis of expenditures. For example, the teams carefully scrutinized budgets of their ministries of health as well as other ministries and departments, and determined which expenditures were directly related to health care. Thus, although the PAHO/World Bank and NHA definitions of health expenditures may be similar, the two estimates sometimes differ dramatically.
When comparing health spending from the late 1980s to the mid-1990s, it is important to recognize the significant economic changes taking place in the region. At the end of the 1970s, most LAC countries were affected by serious economic crisis, which led to structural adjustment programs. Additionally, in 1982 the external debt burden brought to light the economies’ vulnerability to world market fluctuations. The crisis led to a progressive decline in living conditions and the impoverishment of broad sectors of the population. A very important aspect of the crisis was the serious deterioration of quality and coverage of health services (in many countries not yet overcome), which in most cases relied heavily on budgets allocated by national governments. The economic crisis of the 1980s, stabilization, and structural adjustment programs have all had a profound impact on levels of national health expenditures and on the financing of the health sector, with declines in real health spending during the 1980s (Inter-American Development Bank [IADB], 1998; PAHO, 1998).
The LAC region began to show signs of recovery in the second half of the 1980s and the beginning of the 1990s, although serious political crises persisted in several countries. After four years of moderate expansion, with relative price stability and a large inflow of external capital, and an increase in GDP of more than five percent in 1994, the average annual rate of economic growth in the LAC region fell to 0.7 percent in 1995.1 However, inflation continued to decrease in the region as a whole: the median rate of inflation (the inflation experienced by the typical LAC country) fell from 31 percent in 1990 to 17 percent in 1995. The fiscal consolidation that underpins this inflation decline strengthened during 1995; the average deficit of the region’s economies fell to 1.2 percent of GDP, its lowest level in 20 years (IADB, 1998). These processes were accompanied by significant changes in the organization and role of the central governments, characterized in many cases by administrative decentralization and the privatization of public services. Even if LAC countries display considerable variations in central government expenditures as a percentage of GDP and in per capita health spending, it is possible to say that health expenditures recovered substantially during the 1990’s (IADB, 1998; PAHO, 1998).
1 This deceleration was attributable to the fact that Argentina and Mexico, two of the region’s largest economies, fell into deep recession in the aftermath of the financial crisis that followed the Mexican devaluation of December 1994. In the rest of the region, growth in 1995 was, on balance, similar to that recorded in 1994.
Health Care Financing in Eight Latin American and Caribbean Nations: The First Regional NHA Network
10
3.2 SPECIFIC ANALYSIS OF DIFFERENCES BETWEEN ESTIMATES: A LOOK AT FOUR LAC COUNTRIES
To understand the differences in health care expenditure estimates, one has to look at particular countries of concern. A case analysis of each of the four countries in which estimates differ by more than 10 to 15 percent (Bolivia, the Dominican Republic, Guatemala, and Nicaragua) appears below.2
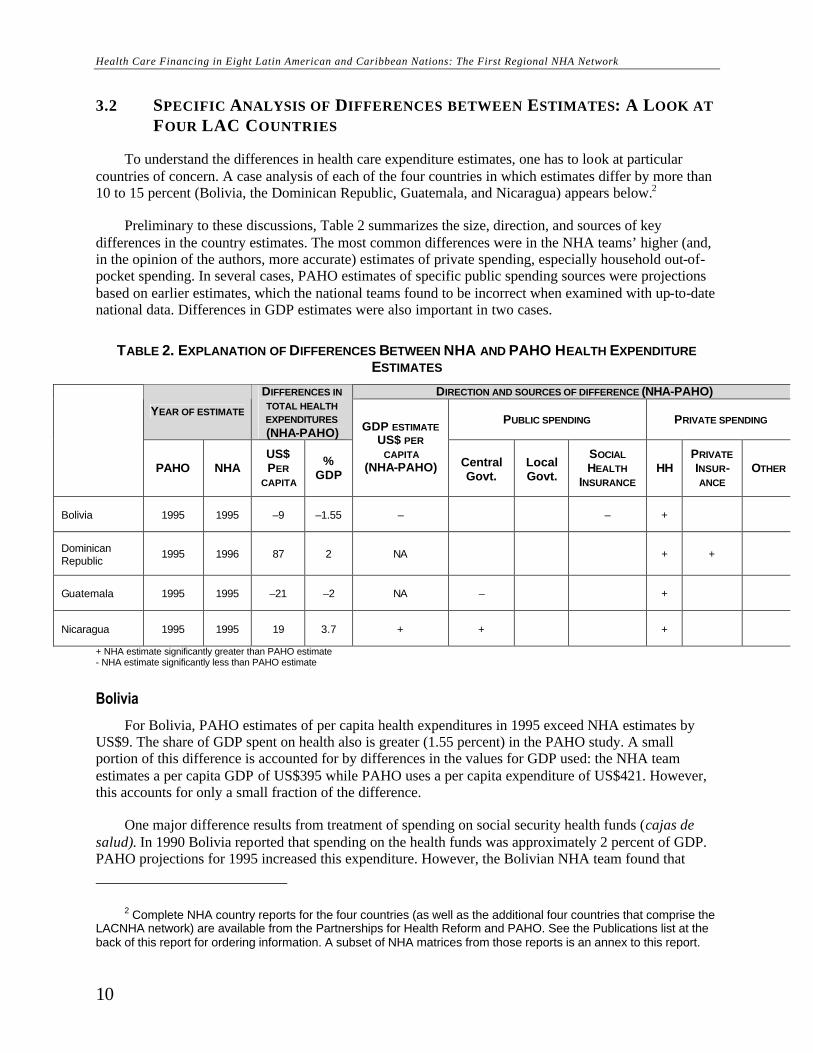
Preliminary to these discussions, Table 2 summarizes the size, direction, and sources of key differences in the country estimates. The most common differences were in the NHA teams’ higher (and, in the opinion of the authors, more accurate) estimates of private spending, especially household out-of-pocket spending. In several cases, PAHO estimates of specific public spending sources were projections based on earlier estimates, which the national teams found to be incorrect when examined with up-to-date national data. Differences in GDP estimates were also important in two cases.
TABLE 2. EXPLANATION OF DIFFERENCES BETWEEN NHA AND PAHO HEALTH EXPENDITURE ESTIMATES
DIRECTION AND SOURCES OF DIFFERENCE (NHA-PAHO)
YEAR OF ESTIMATE
DIFFERENCES IN TOTAL HEALTH EXPENDITURES (NHA-PAHO)
PUBLIC SPENDING PRIVATE SPENDING
PAHO NHA US$ PER
CAPITA
% GDP
GDP ESTIMATE US$ PER
CAPITA (NHA-PAHO) Central
Govt. Local Govt.
SOCIAL HEALTH
INSURANCE HH
PRIVATE INSUR-ANCE
OTHER
Bolivia 1995 1995 –9 –1.55 – – +
Dominican Republic
1995 1996 87 2 NA + +
Guatemala 1995 1995 –21 –2 NA – +
Nicaragua 1995 1995 19 3.7 + + +
+ NHA estimate significantly greater than PAHO estimate - NHA estimate significantly less than PAHO estimate
Bolivia
For Bolivia, PAHO estimates of per capita health expenditures in 1995 exceed NHA estimates by US$9. The share of GDP spent on health also is greater (1.55 percent) in the PAHO study. A small portion of this difference is accounted for by differences in the values for GDP used: the NHA team estimates a per capita GDP of US$395 while PAHO uses a per capita expenditure of US$421. However, this accounts for only a small fraction of the difference.
One major difference results from treatment of spending on social security health funds (cajas de salud). In 1990 Bolivia reported that spending on the health funds was approximately 2 percent of GDP. PAHO projections for 1995 increased this expenditure. However, the Bolivian NHA team found that
2 Complete NHA country reports for the four countries (as well as the additional four countries that comprise the LACNHA network) are available from the Partnerships for Health Reform and PAHO. See the Publications list at the back of this report for ordering information. A subset of NHA matrices from those reports is an annex to this report.
How Do the LACNHA Estimates Compare with other Recent Efforts in the Region?
11
spending actually decreased for the health funds, to approximately 1.5 percent of GDP. This reduces the difference between the two estimates to within 1 percent of GDP.
With respect to private sector spending, both PAHO and the NHA team projected their estimates from the same household survey implemented in 1990. However, the Bolivian NHA team was able to supplement this information with data collected in the 1992 round of the survey. They were also able to capture more subtle expenditure trends by using data from the consumer price index to calibrate their household health expenditure estimates. The team also made an additional adjustment on out-of-pocket spending: when estimating expenditures on pharmaceutical products, the NHA team performed a careful analysis of total pharmaceutical production and purchases and found that the household surveys underestimated out-of-pocket purchases of medication. Their figures for out-of-pocket medical purchases were adjusted accordingly. Finally, the Bolivian NHA report is unique in that it discusses external aid funding in the private sector.
Dominican Republic
Although the NHA figures for the Dominican Republic are for 1996 and PAHO’s are for 1995, the difference between the respective estimates is considerable. The NHA team estimated a per capita expenditure of US$164; PAHO estimated one of US$77. Additionally, the percent of GDP spent on health care differed—7.3 percent and 5.3 percent respectively.
The difference in the PAHO and the NHA estimates is accounted for almost completely by the use of different sources for private health expenditures. PAHO figures are based on a report (Hatton, 1996) that used data on final private consumption on health produced by the Central Bank. These figures do not include expenditures incurred through private insurance, a small but growing sector in the Dominican Republic. The report quotes a private expenditure of approximately 4 percent of GDP for 1994. Since the figures went only through 1994, PAHO estimated 1995 data using the income elasticity for health. The NHA team was able to utilize the Encuesta Nacional de Demografía y Salud, a household survey implemented in 1996 to determine private sector expenditures. The survey showed a private sector expenditure on health care of approximately 6 percent of GDP. This difference alone explains the 2 percent variance in GDP between the two sources.
Guatemala
The NHA team from Guatemala presented a 1995 health expenditure figure substantially lower—more than $20 per capita and 2 percent of GDP—than that of PAHO. Differences in the estimates for private expenditures account for about 1.2 percent of the GDP discrepancy; the remaining 0.6 percent is due to differences in estimates of public expenditure.
One explanation for the discrepancy stems from the source for private sector spending estimates. PAHO estimates are projections based on a 1981 household survey, the only survey available until recently. The NHA team, on the other hand, was able to utilize a 1997 household survey by the National Statistical Institute. The NHA team was also able to capture foreign aid in the private sector, with approximately 4 percent of total health expenditure occurring in non-governmental organizations (NGOs).
The reason for the difference in figures for public expenditures on health is less clear. The Guatemala NHA report dedicates an entire annex to the discussion of why previous estimates differ so significantly from NHA figures. The NHA team attributes the discrepancy to differences in the definition of health care activities, specifically, that previous estimates included activities related to water and sanitation as preventive health care expenditures. This is one area where further examination may need to be done.

Health Care Financing in Eight Latin American and Caribbean Nations: The First Regional NHA Network
12
Nicaragua
Of the eight LACNHA network countries, Nicaragua has the lowest GDP per capita and has experienced severe hyperinflation in the past decade (World Bank, 1997). With a GDP deflator for 1985-1995 of 961.6 percent, it is extremely difficult to accurately interpret survey results and budgets and convert to dollars. These kinds of problems can be found in the PAHO and NHA estimates where different values are used for GDP and population sizes. The NHA team reported a GDP per capita for 1995 of $448.5 while PAHO, using IMF data, reported one of $431.
The NHA team admittedly experienced difficulties obtaining official GDP figures for 1995 and 1996. This obstacle prohibited the team from consistently quoting a per capita health expenditure estimate. Thus, using the team’s estimates for public and private sector spending, and the IMF’s published GDP estimate for 1995, this report estimates that approximately 13 percent of GDP was spent on health care. The division between public and private expenditures was 68 percent and 32 percent respectively. This expenditure breakdown is consistent with the 1995 PAHO estimates, although estimates for both the public and private sectors are higher in the NHA study. In Nicaragua, the detailed examination of public expenditures, the inclusion of Ministry of Defense and Ministry of Governance figures, as well as the results of a 1996 household survey, all point to higher levels of expenditures than were previously suggested.
While the percentage of GDP dedicated to health expenditures appears high, in absolute terms, spending on health is relatively low for the region (US$54). Nicaragua also receives a substantial amount of foreign aid in the health sector, approximately 20 percent of total health expenditure.
These four cases help to demonstrate how and why health care expenditure estimates vary across sources. Still other factors that account for variations are different levels of GDP and inflation rates. Thus, while a country like Mexico may have a relatively average percentage GDP expenditure on health care (5.5 percent), in absolute terms, it has the highest expenditure per capita of any of the eight network countries. A final factor is illustrated in Table 3, which compares the public/private shares of total health expenditures as reported in the eight LACNHA studies. For Guatemala, the NHA report shows a division of 60:40 respectively while the PAHO figures show a 45:55 divide. As mentioned earlier, most, but not all of this difference is accounted for by the lower estimate of household spending resulting from the more recent survey.

How Do the LACNHA Estimates Compare with other Recent Efforts in the Region?
13
TABLE 3. COMPARISON OF PUBLIC-PRIVATE PROPORTIONS OF TOTAL HEALTH EXPENDITURE (IN % OF TOTAL EXPENDITURE)
BOLIVIA DOMINICAN REPUBLIC ECUADOR EL
SALVADOR GUATEMALA MEXICO NICARAGUA PERU
% Public (1990) 1 32 31 40 26 52 38 74 35
% Private (1990)1 68 69 60 74 48 62 26 65
% Public (1990)2 29 34 63 30 33 56 62 34
% Private (1990) 2 56 63 30 56 58 43 16 64
% Public (1995)–FA3 65 21 46 46 60 43 68 66
% Private (1995)–FA3 35 78 46 53 40 57 32 34
% Other (1995)-FA3 1 9
% Public (1995) 4 55 38 32 27 45 47 63 51
% Private (1995) 4 45 62 68 73 55 53 37 49 1Suarez, R. et al., 1995 2Govindraj, R., et al., 1997 31998 NHA Reports 4PAHO, 1998
Thus, it is important to keep the variances among estimates and across countries in mind during the discussion of the implications of the results of the eight NHA reports and in making cross-country comparisons.


15
4. INCOME, TOTAL HEALTH SPENDING, AND OUTCOMES
The estimate of total health expenditure in a nation that emerges from a comprehensive NHA study can be linked to a variety of other important national-level variables such as national income (total and per capita) and life expectancy. It is also instructive to explore how large health care system-level factors, such as the level of health insurance coverage in a country, may be associated with health spending.
Estimation of national income is fairly well standardized using the United Nations System of National Accounts. The exception among the LACNHA countries was Nicaragua, which by the time of the NHA study had not produced a reliable estimate of GDP since the early 1990s, when it was emerging from an extended period of civil conflict. Using the older GDP figure, Nicaragua reported health expenditure as 12.9 percent of GDP, a figure certainly well above the probable real level of current GDP. As a consequence of this problem, Nicaragua will be omitted from the comparisons in this section, which use national income figures.
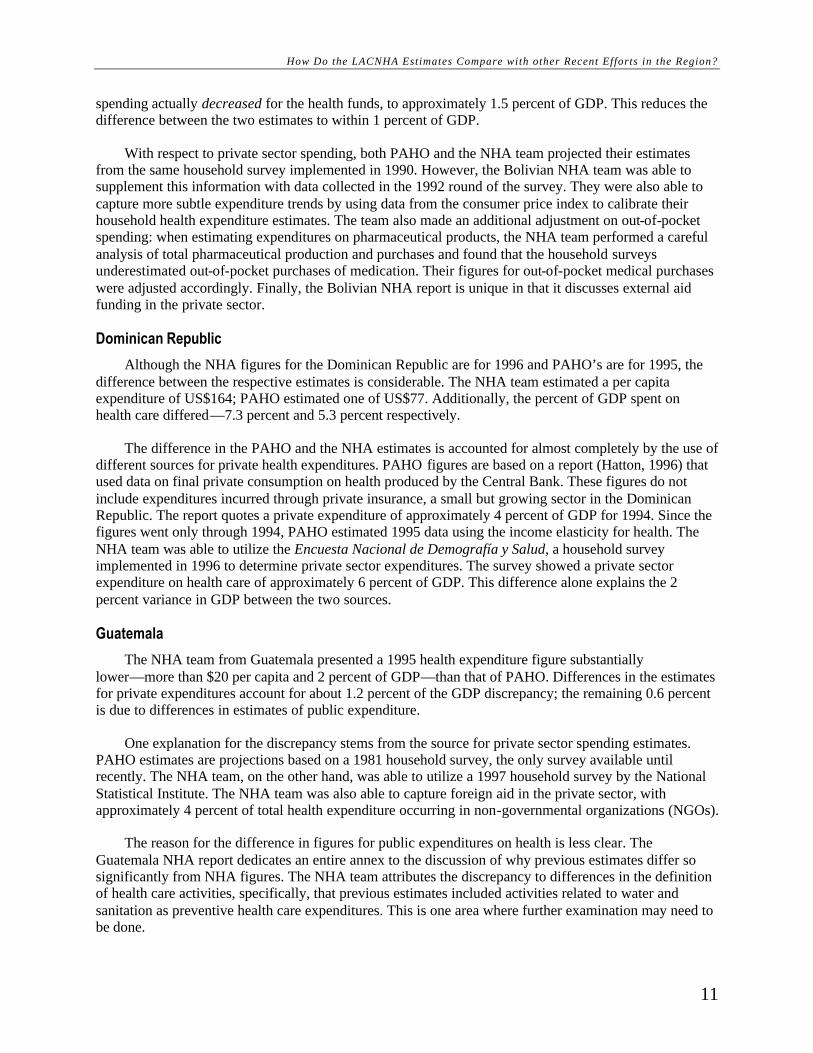
Figures 1 and 2 show the relationship between LACNHA health care spending and life expectancy. This positive association exists whether health spending is expressed in share of GDP terms or in absolute per capita terms. However, as has been shown in analysis of similar relationships for larger groups of countries (World Bank, 1993) this link may not be a simple one. Increasing health care spending is related to better health, but the efficacy of increasing health expenditure per se in improving health depends on other national and health care system factors, as reflected in the distribution of points around the simple linear regression line.
FIGURE 1. LIFE EXPECTANCY AND PER CAPITA HEALTH EXPENDITURE
60
62
64
66
68
70
72
0 50 100 150 200
Per Capita Health Spending ($)
Life
Exp
ecta
ncy
Health Care Financing in Eight Latin American and Caribbean Nations: The First Regional NHA Network
16
FIGURE 2. LIFE EXPECTANCY AND HEALTH EXPENDITURE IN GDP
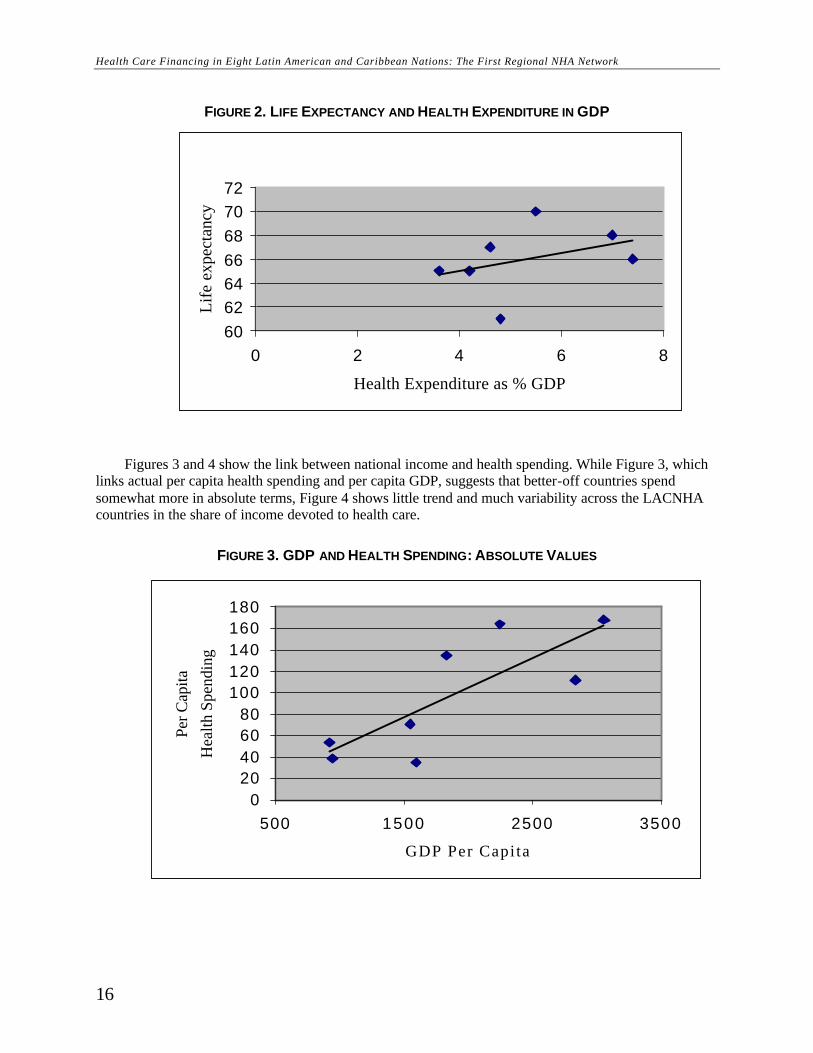
Figures 3 and 4 show the link between national income and health spending. While Figure 3, which links actual per capita health spending and per capita GDP, suggests that better-off countries spend somewhat more in absolute terms, Figure 4 shows little trend and much variability across the LACNHA countries in the share of income devoted to health care.
FIGURE 3. GDP AND HEALTH SPENDING: ABSOLUTE VALUES
60626466687072
0 2 4 6 8
Health Expenditure as % GDP
Life
exp
ecta
ncy
020406080
100120140160180
500 1500 2500 3500
GDP Per Capita
Per C
apita
Hea
lth S
pend
ing

Income, Total Health Spending, and Outcomes
17
FIGURE 4. GDP PER CAPITA AND % TO HEALTH
FIGURE 4. GDP PER CAPITA AND % GDP TO HEALTH
Figure 5 links health spending with the level of social health insurance coverage and indicates a strong positive relationship. There are several possible explanations for this. Per capita expenditure by social health insurance is generally higher than for government health services, which could be reflected in higher total health spending as insurance coverage increases. There is also evidence that insurance expenditure may not effectively replace household spending but rather supplement it, resulting in higher total spending.
FIGURE 5. SOCIAL HEALTH INSURANCE COVERAGE AND PER CAPITA HEALTH SPENDING
012345678
500 1500 2500 3500
GDP Per Capita ($)
% G
DP
to H
ealth
0
50
100
150
200
0 20 40 60 80 100
Percent of Population with Social Health Insurance
Per c
apita
hea
lth e
xpen
ditu
re ($
)


19
5. THE PUBLIC-PRIVATE MIX IN HEALTH CARE FINANCING
The NHA methodology provides two breakdowns of the public-private mix in health care financing. The first of these identifies public and private sources of financing, as defined in the NHA framework, where sources refers to entities who provide funds to those who are the final payers or purchasers of health care. The second breakdown relates to the public-private composition of expenditure by financing agents or intermediaries, the entities who receive funds from sources and use them to purchase or pay for health care services.
This approach differs from the usual presentation of the public-private mix in financing, which generally is drawn from analysis of financing intermediaries. For example, following on the practice of the health expenditure information reported by the Organization for Economic Cooperation and Development, public finance typically includes departments of government and social health insurance institutions, while private finance includes private health insurance, NGOs, direct payments for health care by private firms, and out-of-pocket payments by households.
One would expect the breakdown by sources to differ significantly from that by financing intermediaries. For instance, in many countries, social health insurance is largely financed by payments of private firms and workers through mandatory contributions. It is debatable whether social health insurance contributions should be called taxes or premiums, as they have some characteristics of both. But clearly they are different from general tax revenue collected by the state and not earmarked for health. The NHA methodology makes this distinction by identifying firms’ and households’ contributions to different financing intermediaries, including mandatory and voluntary insurance contributions and other payments, such as user charges. Of course, ultimately all health care financing is derived from “private” sources, if one considers who pays the taxes. The NHA methodology does not disaggregate sources of government financing according to who ultimately bears the burden.
Table 4 compares the public-private mix in terms of sources of financing with that of financing intermediaries. The sources breakdown includes three categories: public, including departments of government and state-owned enterprises: private, including private firms and households; and external aid, including foreign sources of funds. The financing intermediaries breakdown follows the usual convention, with public including departments of government, state-owned firms, and social health insurance, and private including private insurance, NGOs, private firms, and households.
TABLE 4. CONTRASTING VIEWS OF PUBLIC-PRIVATE MIX IN HEALTH CARE FINANCING: SOURCES AND FINANCING INTERMEDIARIES (% TOTAL EXPENDITURE)
BOLIVIA DOMINICAN REPUBLIC ECUADOR EL SALVADOR GUATEMALA MEXICO NICARAGUA PERU
Financing Intermediaries
% Public 65 21 46 46 60 43 68 66 % Private 35 78 46 53 40 57 32 34 % Ext Aid 1 9 Sources % Public 56 14 35 22 27 36 42 38 % Private 34 84 56 72 65 64 41 62 % Ext Aid 10 2 9 5 8 0 18 1 Source: See NHA Country Reports (Annexes)
Health Care Financing in Eight Latin American and Caribbean Nations: The First Regional NHA Network
20
In all eight LACNHA countries, the public share of spending is significantly higher for financing intermediaries than for sources. The difference in shares largely represents the importance of social health insurance and user fees in total expenditure, as public sector “payers” capture a larger share of total spending.
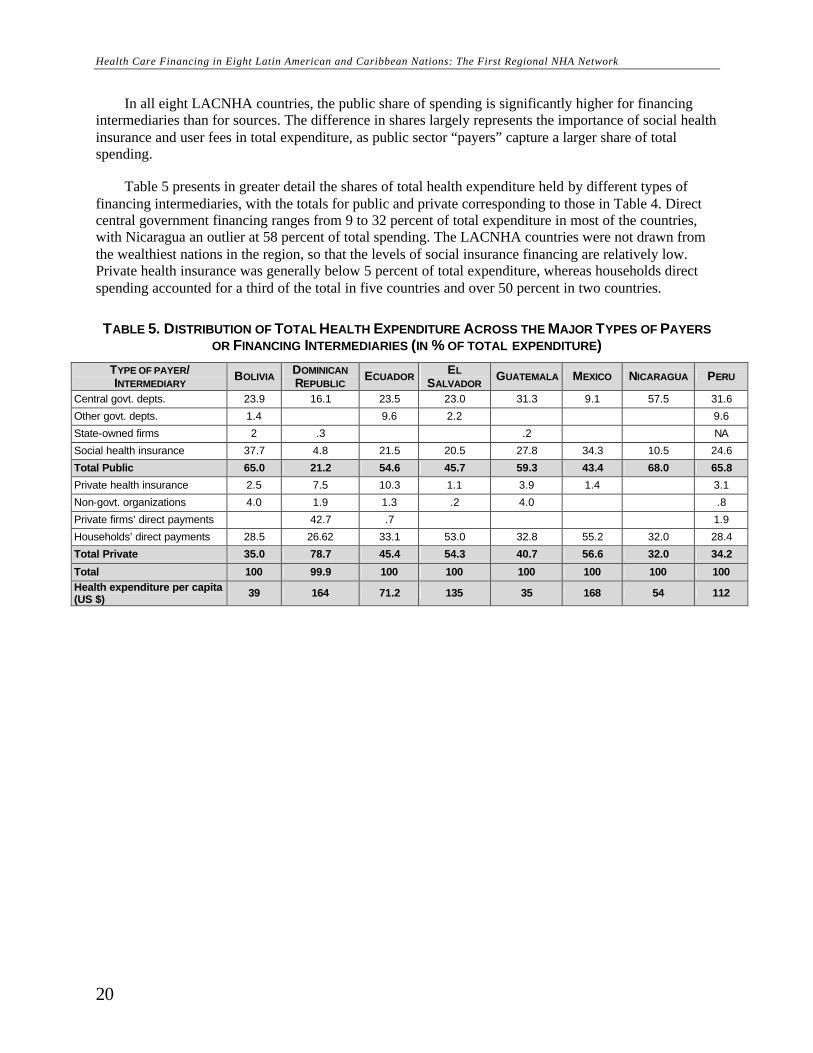
Table 5 presents in greater detail the shares of total health expenditure held by different types of financing intermediaries, with the totals for public and private corresponding to those in Table 4. Direct central government financing ranges from 9 to 32 percent of total expenditure in most of the countries, with Nicaragua an outlier at 58 percent of total spending. The LACNHA countries were not drawn from the wealthiest nations in the region, so that the levels of social insurance financing are relatively low. Private health insurance was generally below 5 percent of total expenditure, whereas households direct spending accounted for a third of the total in five countries and over 50 percent in two countries.
TABLE 5. DISTRIBUTION OF TOTAL HEALTH EXPENDITURE ACROSS THE MAJOR TYPES OF PAYERS OR FINANCING INTERMEDIARIES (IN % OF TOTAL EXPENDITURE)
TYPE OF PAYER/ INTERMEDIARY BOLIVIA DOMINICAN
REPUBLIC ECUADOR EL SALVADOR GUATEMALA MEXICO NICARAGUA PERU
Central govt. depts. 23.9 16.1 23.5 23.0 31.3 9.1 57.5 31.6
Other govt. depts. 1.4 9.6 2.2 9.6
State-owned firms 2 .3 .2 NA
Social health insurance 37.7 4.8 21.5 20.5 27.8 34.3 10.5 24.6
Total Public 65.0 21.2 54.6 45.7 59.3 43.4 68.0 65.8
Private health insurance 2.5 7.5 10.3 1.1 3.9 1.4 3.1
Non-govt. organizations 4.0 1.9 1.3 .2 4.0 .8
Private firms’ direct payments 42.7 .7 1.9
Households’ direct payments 28.5 26.62 33.1 53.0 32.8 55.2 32.0 28.4
Total Private 35.0 78.7 45.4 54.3 40.7 56.6 32.0 34.2
Total 100 99.9 100 100 100 100 100 100 Health expenditure per capita (US $) 39 164 71.2 135 35 168 54 112

21
6. RESOURCE ALLOCATION IN THE HEALTH SECTOR: SPENDING ON MAJOR HEALTH CARE FUNCTIONS
All eight countries tried to develop a “financing intermediaries to functions” matrix, one of the core breakdowns of the NHA framework. This matrix shows the flow of funds to the main health care functions, classified as personal health services for inpatient and ambulatory illness treatment; preventive and promotive public health services, both personal and collective; general administration; and other (includes medical education and training, research, and other unallocable costs). Unfortunately, in four of the countries—Bolivia, Dominican Republic, Ecuador, and Peru—some of the data needed to complete these estimates were not available. In the Dominican Republic and Peru, it was not possible to separate inpatient and ambulatory treatment services. In Bolivia and Ecuador, general administration and “other” expenditures could not be adequately separated. The results as reported are shown in Table 6.
TABLE 6. SHARES OF TOTAL HEALTH EXPENDITURES ALLOCATED TO SPECIFIC FUNCTIONS (IN % OF TOTAL EXPENDITURE)
BOLIVIA DOMINICAN
REPUBLIC ECUADOR EL SALVADOR GUATEMALA MEXICO NICARAGUA PERU
Inpatient curative care 30.01 42.60 42.10 46.98 28.49 35.42
Ambulatory curative care 31.41 67.04
20.80 31.13 33.30 50.67 42.63 76.02
Individual and collective preventive and health promotion services
2.94 7.37 2.30 5.52 4.50 9.00 15.90 12.34
Administration and other 33.17 25.49 34.30 21.25 15.22 11.85 6.11 11.64
Total 100 100 100 100 100 100 100 100 Source: See NHA Country Reports (Annexes)
Some interesting findings do emerge. Spending on personal illness care services ranged across all eight countries from 61 to 80 percent of total spending, with most values clustered nearer the higher number. Countries reporting the inpatient/ambulatory breakdown were evenly split as to which was higher. Preventive and promotive public health services accounted for less than 10 percent of total spending in six of eight countries and in no case more than 16 percent. Administration costs, which mainly include those of government and social health insurance, ranged from 4 percent to 15 percent of total spending in the six countries reporting.
The LACNHA country analysts generally reported difficulty with this type of functional breakdown of expenditures, especially with data from the public sector. Government departments, especially the ministries of health, tend to report expenditures according to budget categories. Often, a directorate of curative services funds both hospitals and clinics, with a significant share of publicly provided ambulatory care given by hospitals. In contrast, preventive and promotive public health services may be financed through budgets defined as such, although this may not include the fixed costs of personnel and facilities supporting these services. Social health insurance organizations may also directly finance their own providers with only limited purchasing of services from private or government providers. This is an important area for future work on national health expenditures.
The “financing intermediaries to function” matrices also can be used to analyze who finances different types of services. For example, are the funds available to government, social insurance, and private payers financing a similar mix of services or is there evidence of some type of financial division of responsibility for different types of health care? While the data from the LACNHA countries suffer

Health Care Financing in Eight Latin American and Caribbean Nations: The First Regional NHA Network
22
from estimation problems already mentioned, there is some indication of differential responsibilities in financing.
Table 7 shows the ratio of expenditure by public to private financing intermediaries for the main types of services: personal—inpatient and ambulatory treatment—and collective public health services. Government and social insurance financing is generally higher for inpatient services, while households direct payments pick up a significantly larger share of spending on ambulatory services. Governments are the largest financier of preventive services in most cases.
TABLE 7. RATIO OF PUBLIC TO PRIVATE FINANCING (FINANCING INTERMEDIARIES) FOR MAIN TYPES OF HEALTH CARE SERVICES (WHERE AVAILABLE)
BOLIVIA DOMINICAN REPUBLIC ECUADOR EL
SALVADOR GUATEMALA MEXICO NICARAGUA PERU
Personal Health Services
Inpatient Care 5.41 0.15 2.59 1.23 2.50 1.48 2.40 1.28
Ambulatory Care 2.84 NA 1.51 0.09 0.60 0.31 1.04 NA
Public Health Services (prevention and promotion) 23.50 0.03
all public
37.31 1.26 0.42 48.44 all public
Source: See NHA Country Reports (Annexes)
23
7. THE FLOW OF FUNDS TO DIFFERENT TYPES OF HEALTH CARE PROVIDERS
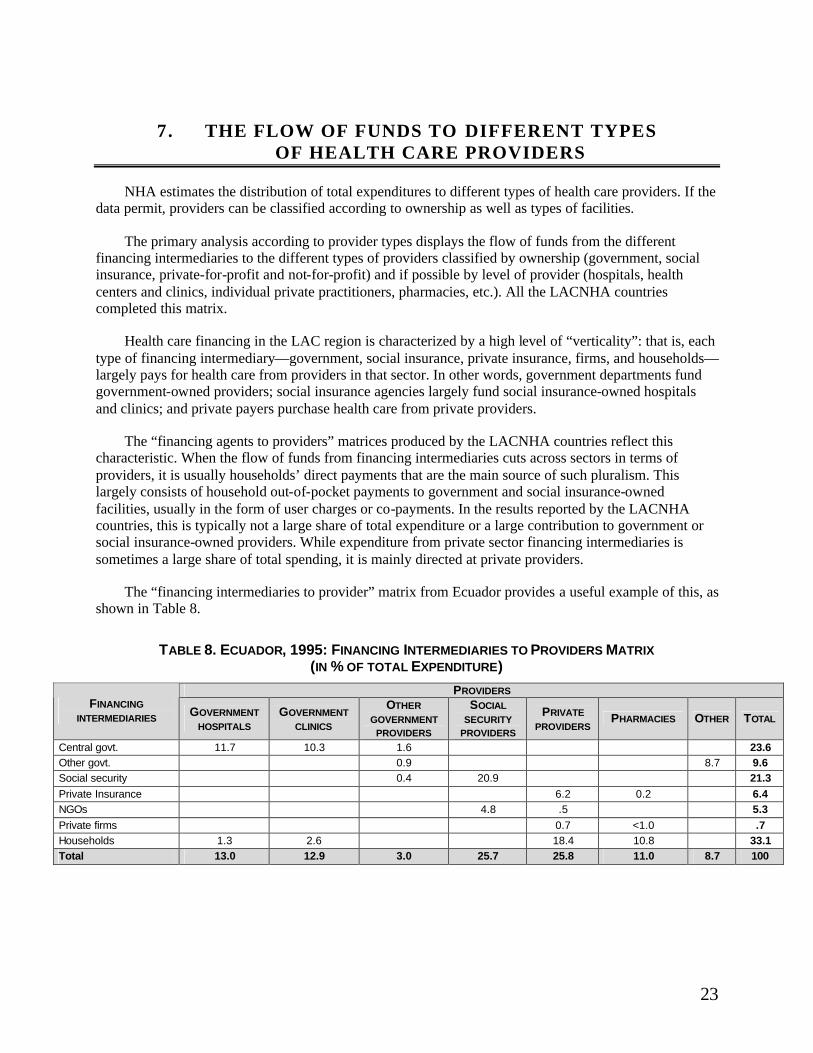
NHA estimates the distribution of total expenditures to different types of health care providers. If the data permit, providers can be classified according to ownership as well as types of facilities.
The primary analysis according to provider types displays the flow of funds from the different financing intermediaries to the different types of providers classified by ownership (government, social insurance, private-for-profit and not-for-profit) and if possible by level of provider (hospitals, health centers and clinics, individual private practitioners, pharmacies, etc.). All the LACNHA countries completed this matrix.
Health care financing in the LAC region is characterized by a high level of “verticality”: that is, each type of financing intermediary—government, social insurance, private insurance, firms, and households—largely pays for health care from providers in that sector. In other words, government departments fund government-owned providers; social insurance agencies largely fund social insurance-owned hospitals and clinics; and private payers purchase health care from private providers.
The “financing agents to providers” matrices produced by the LACNHA countries reflect this characteristic. When the flow of funds from financing intermediaries cuts across sectors in terms of providers, it is usually households’ direct payments that are the main source of such pluralism. This largely consists of household out-of-pocket payments to government and social insurance-owned facilities, usually in the form of user charges or co-payments. In the results reported by the LACNHA countries, this is typically not a large share of total expenditure or a large contribution to government or social insurance-owned providers. While expenditure from private sector financing intermediaries is sometimes a large share of total spending, it is mainly directed at private providers.
The “financing intermediaries to provider” matrix from Ecuador provides a useful example of this, as shown in Table 8.
TABLE 8. ECUADOR, 1995: FINANCING INTERMEDIARIES TO PROVIDERS MATRIX (IN % OF TOTAL EXPENDITURE)
PROVIDERS FINANCING
INTERMEDIARIES GOVERNMENT HOSPITALS
GOVERNMENT CLINICS
OTHER GOVERNMENT
PROVIDERS
SOCIAL SECURITY
PROVIDERS
PRIVATE PROVIDERS
PHARMACIES OTHER TOTAL
Central govt. 11.7 10.3 1.6 23.6 Other govt. 0.9 8.7 9.6 Social security 0.4 20.9 21.3 Private Insurance 6.2 0.2 6.4 NGOs 4.8 .5 5.3 Private firms 0.7 <1.0 .7 Households 1.3 2.6 18.4 10.8 33.1 Total 13.0 12.9 3.0 25.7 25.8 11.0 8.7 100

Health Care Financing in Eight Latin American and Caribbean Nations: The First Regional NHA Network
24
Private expenditure accounts for about 45 percent of total spending, of which households’ direct payments comprise more than three quarters. However, only 12 percent of these household payments (or about 4 percent of total health expenditure) is reported going to government providers. These funds comprise about 12 percent of total spending on services in government health centers and a quarter of total spending on services in government hospitals.
Ecuador reported no direct household spending on services provided by social insurance providers, and a number of the LACNHA countries reported no direct household spending on services at government providers. (NB: if a visit to a government provider resulted in outside purchase of pharmaceuticals this would not and should not be reported as spending at government providers in this breakdown.) The general results confirm that these type of cross-sectoral expenditures are very limited in the LACNHA countries. However, it is also possible that the available data do not record such payments, if they do occur and are illegal or not asked about.
Resource allocation across provider types provides another, sometimes significantly different picture of how health sector funds are being used. The breakdown by ownership categories, such as government-owned facilities, those owned by social health insurance organizations, and privately owned facilities, highlights the relative financial importance of the different sectors in delivering health care. The allocation across facility types, such as hospitals, clinics, and individual practitioners, shows where financial resources are consumed in the delivery system. Since facilities often provide a number of different types of services, the results may be different from the functional breakdowns shown in earlier sections of this paper.
Table 9 shows the allocation of expenditure across the major categories of providers classified by ownership—government, social insurance, and private providers. Government-owned providers accounted for less than 30 percent of total spending in six of the eight countries, the exceptions being Nicaragua and Peru. In Nicaragua, no social health insurance provider sector was reported, so that government facilities account for 62 percent of total spending. In the other seven countries, all of which reported a social health insurance provider sector—that is, hospitals and clinics owned and operated by the social insurance institutions—these facilities accounted for 20 percent to 40 percent of total spending. Private providers were the largest sector in five of the eight countries. In most of these countries private providers accounted for 35 percent to 55 percent of total spending, with the exception of the Dominican Republic where private provision was reported to consume almost four-fifths of total spending.
TABLE 9. HOW FUNDING FLOWS TO DIFFERENT TYPES OF PROVIDERS CLASSIFIED BY OWNERSHIP
BOLIVIA DOMINICAN REPUBLIC ECUADOR EL
SALVADOR GUATEMALA MEXICO NICARAGUA PERU
Govt. provider 28.59 14.87 28.80 25.12 28.82 9.51 62.60 41.22 Insurance provider 38.21 5.59 20.90 20.54 30.54 33.20 24.59 Private providers 33.20 79.53 41.30 54.35 36.02 57.40 37.40 34.19 Unspecified 8.70 4.62 Source: See NHA Country Report (Annexes)
The Flow of Funds to Different Types of Health Care Providers
25
Several of the LACNHA countries were able to estimate the flow of funds for total expenditures on specific types of services according to ownership of the providers delivering those services. For example, El Salvador highlights the sharp contrast in which providers (by ownership) deliver which types of services. Seventy percent of expenditures on inpatient curative services go to government and social security hospitals, while 91 percent of expenditures on outpatient curative services go to private providers. Preventive and promotive services expenditures go overwhelmingly to government-owned providers (78 percent) and to those owned by social insurance (almost 20 percent). Unfortunately, most of the other countries did not yet produce this type of “providers by functions” breakdown of expenditures.

27
8. EXPENDITURE SHARES TO DIFFERENT TYPES OF HEALTH CARE INPUTS
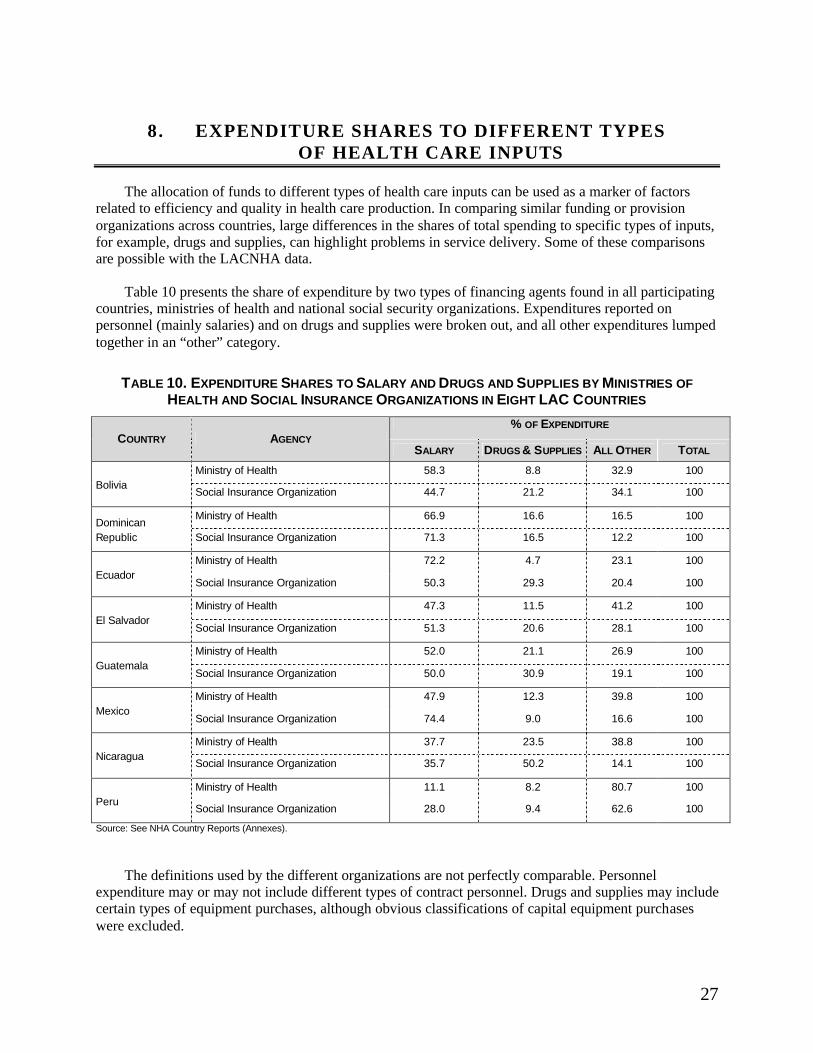
The allocation of funds to different types of health care inputs can be used as a marker of factors related to efficiency and quality in health care production. In comparing similar funding or provision organizations across countries, large differences in the shares of total spending to specific types of inputs, for example, drugs and supplies, can highlight problems in service delivery. Some of these comparisons are possible with the LACNHA data.
Table 10 presents the share of expenditure by two types of financing agents found in all participating countries, ministries of health and national social security organizations. Expenditures reported on personnel (mainly salaries) and on drugs and supplies were broken out, and all other expenditures lumped together in an “other” category.
TABLE 10. EXPENDITURE SHARES TO SALARY AND DRUGS AND SUPPLIES BY MINISTRIES OF HEALTH AND SOCIAL INSURANCE ORGANIZATIONS IN EIGHT LAC COUNTRIES
% OF EXPENDITURE COUNTRY AGENCY
SALARY DRUGS & SUPPLIES ALL OTHER TOTAL
Ministry of Health 58.3 8.8 32.9 100 Bolivia
Social Insurance Organization 44.7 21.2 34.1 100
Ministry of Health 66.9 16.6 16.5 100 Dominican Republic Social Insurance Organization 71.3 16.5 12.2 100
Ministry of Health 72.2 4.7 23.1 100 Ecuador
Social Insurance Organization 50.3 29.3 20.4 100
Ministry of Health 47.3 11.5 41.2 100 El Salvador
Social Insurance Organization 51.3 20.6 28.1 100
Ministry of Health 52.0 21.1 26.9 100 Guatemala
Social Insurance Organization 50.0 30.9 19.1 100
Ministry of Health 47.9 12.3 39.8 100 Mexico
Social Insurance Organization 74.4 9.0 16.6 100
Ministry of Health 37.7 23.5 38.8 100 Nicaragua
Social Insurance Organization 35.7 50.2 14.1 100
Ministry of Health 11.1 8.2 80.7 100 Peru
Social Insurance Organization 28.0 9.4 62.6 100
Source: See NHA Country Reports (Annexes).
The definitions used by the different organizations are not perfectly comparable. Personnel expenditure may or may not include different types of contract personnel. Drugs and supplies may include certain types of equipment purchases, although obvious classifications of capital equipment purchases were excluded.

Health Care Financing in Eight Latin American and Caribbean Nations: The First Regional NHA Network
28
In almost all the countries, the social health insurance organizations’ share of expenditure on drugs and supplies is greater than that of ministries of health; ministries average about 10 percent while social health insurance agencies average over 20 percent. Since personnel costs are probably higher in these agencies as well, this is probably a significant difference. It may also be reasonable to assume that the health insurance organizations are more likely to assure adequate drug supplies in their facilities and to be more responsive to consumer perceptions of quality. One should not draw strong normative conclusions from this simple comparison, since other factors such as the mix of facilities, programs, and patients may account for such differences. But, combined with widespread anecdotal information that ministry facilities lack essential inputs, it does suggest a systematic problem in resource allocation.
29
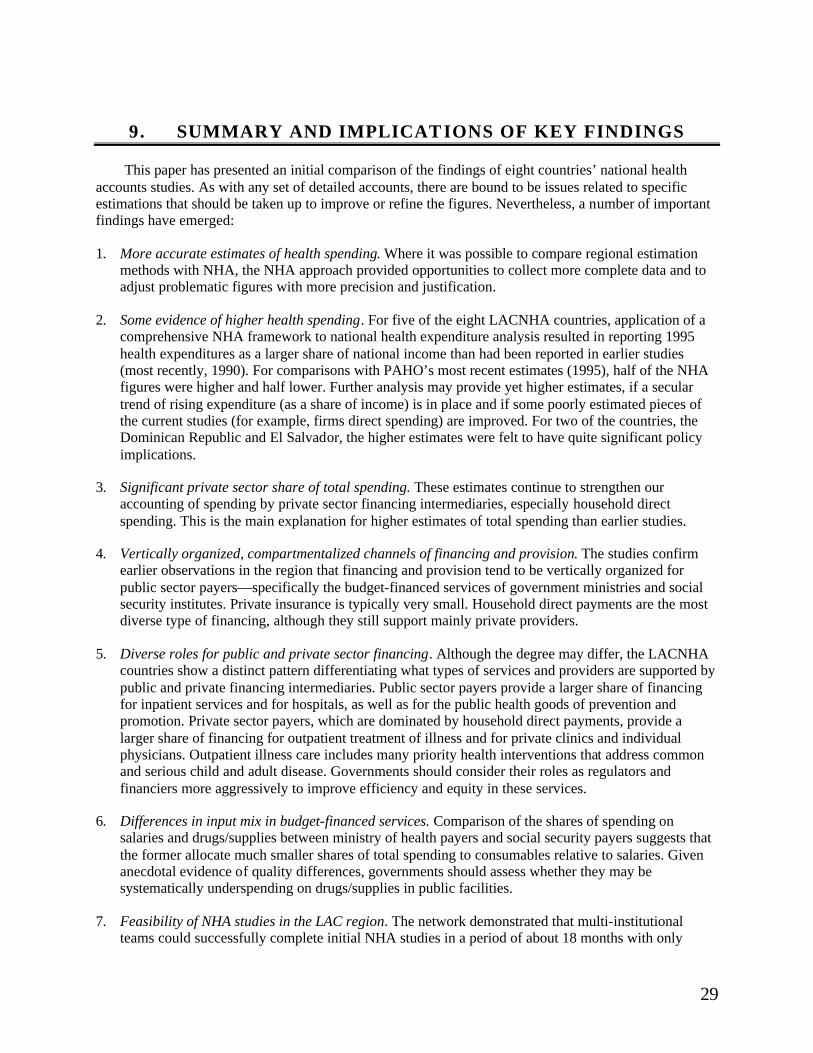
9. SUMMARY AND IMPLICAT IONS OF KEY FINDINGS
This paper has presented an initial comparison of the findings of eight countries’ national health accounts studies. As with any set of detailed accounts, there are bound to be issues related to specific estimations that should be taken up to improve or refine the figures. Nevertheless, a number of important findings have emerged:
1. More accurate estimates of health spending. Where it was possible to compare regional estimation methods with NHA, the NHA approach provided opportunities to collect more complete data and to adjust problematic figures with more precision and justification.
2. Some evidence of higher health spending. For five of the eight LACNHA countries, application of a comprehensive NHA framework to national health expenditure analysis resulted in reporting 1995 health expenditures as a larger share of national income than had been reported in earlier studies (most recently, 1990). For comparisons with PAHO’s most recent estimates (1995), half of the NHA figures were higher and half lower. Further analysis may provide yet higher estimates, if a secular trend of rising expenditure (as a share of income) is in place and if some poorly estimated pieces of the current studies (for example, firms direct spending) are improved. For two of the countries, the Dominican Republic and El Salvador, the higher estimates were felt to have quite significant policy implications.
3. Significant private sector share of total spending. These estimates continue to strengthen our accounting of spending by private sector financing intermediaries, especially household direct spending. This is the main explanation for higher estimates of total spending than earlier studies.
4. Vertically organized, compartmentalized channels of financing and provision. The studies confirm earlier observations in the region that financing and provision tend to be vertically organized for public sector payers—specifically the budget-financed services of government ministries and social security institutes. Private insurance is typically very small. Household direct payments are the most diverse type of financing, although they still support mainly private providers.
5. Diverse roles for public and private sector financing. Although the degree may differ, the LACNHA countries show a distinct pattern differentiating what types of services and providers are supported by public and private financing intermediaries. Public sector payers provide a larger share of financing for inpatient services and for hospitals, as well as for the public health goods of prevention and promotion. Private sector payers, which are dominated by household direct payments, provide a larger share of financing for outpatient treatment of illness and for private clinics and individual physicians. Outpatient illness care includes many priority health interventions that address common and serious child and adult disease. Governments should consider their roles as regulators and financiers more aggressively to improve efficiency and equity in these services.
6. Differences in input mix in budget-financed services. Comparison of the shares of spending on salaries and drugs/supplies between ministry of health payers and social security payers suggests that the former allocate much smaller shares of total spending to consumables relative to salaries. Given anecdotal evidence of quality differences, governments should assess whether they may be systematically underspending on drugs/supplies in public facilities.
7. Feasibility of NHA studies in the LAC region. The network demonstrated that multi-institutional teams could successfully complete initial NHA studies in a period of about 18 months with only

Health Care Financing in Eight Latin American and Caribbean Nations: The First Regional NHA Network
30
modest levels of technical support. While the results can certainly be improved, they provide a human, institutional, and technical basis for further work.
31
10. ACHIEVEMENTS, LIMITATIONS AND POTENTIAL FOR FUTURE INVESTIGATION
10.1 POLICY USES OF NHA IN THE NETWORK COUNTRIES
The LACNHA network was successful in producing NHA results for the participant countries. Are the results relevant for health policy and health sector reform? Can we demonstrate impact on health sector decision-making emerging from NHA analysis? These important questions remain to be answered. NHA is a basic data collection and analysis tool. It was not implemented in each country as a response to a specific national policy agenda, but rather as a general tool for health system analysis. Nonetheless, the national teams reported that NHA has been or will be useful in policy decision-making.
In Bolivia, NHA will provide a baseline estimate of national health spending according to the different uses of funds preceding a major decentralization of health spending authority to local governments. Subsequent studies may show how decentralization of financing affects total spending (do local governments raise more money?) and the allocation of spending to different types of service, providers, and inputs.
In Guatemala, there was great interest in the NHA estimates to help develop new resource allocation strategies as part of the national peace agreement ending that country’s civil conflict. The reconciliation government has made explicit promises to increase and redistribute social spending. NHA will help provide a baseline against which to monitor these efforts. NHA will also be an input for health policy design and reform programs as the government introduces reforms to shift the role of the MOH from entirely one of service provide to more of a regulator and intermediary agent in health financing.
Ecuador has been exploring significant health sector reform for several years, although these efforts have often been delayed by political changes. Reform is once again on the agenda and NHA is providing the most recent available picture of health financing.
In Mexico, NHA has been carried out three times since 1990. The results have raised awareness of the significant size of the health sector in Mexico’s economy, of regional and socioeconomic disparities in health spending, and of the major role played by private health care providers in Mexico’s health care system. This increased awareness has encouraged expanded government efforts to reach underserved regions and populations, and to reform social health insurance, which covers the majority of the population. NHA-type analysis has been expanded in Mexico to the state level, allowing analysis of the health system impact of fiscal decentralization. Government efforts to increase funding for basic health care can be monitored along with success in reorienting priorities toward cost-effective programs.
Peru and the Dominican Republic are planning or launching health care financing reform programs. NHA has provided a comprehensive framework for organizing their health financing information and a basis for estimating the costs and financial impact of reform strategies. Analysts from the Dominican Republic NHA team are using their results to assess the distribution of health care resources to different socio-economic classes in that country.
Three of the participating countries (Peru, El Salvador, and the Dominican Republic) formed teams comprising analysts of national income as well as health expenditures. These countries developed both the NHA and System of National Accounts-based satellite accounts. All three teams reported that the

32
NHA approach improved their national income accounts estimates and would enhance the understanding of the health sector by national finance authorities.
10.2 SUSTAINABILITY
All eight countries formed strong multi-agency NHA teams. The national results are group efforts, with significant participation by different agencies in the countries and only modest external inputs. This strengthens the acceptability of results in the countries. All eight countries kept to the structure of the NHA framework and produced results with a high degree of inter-country comparability. They all produced all four sets of NHA matrices. Review of the results by national and international experts indicates that these estimates are more comprehensive than most previously available studies, and that they have a high degree of validity. For the several national teams that combined national income accountants with health sector experts, it was generally reported that both sides felt the collaboration strengthened their respective work. In other words, better NHA improves national income estimates, and better understanding of the methods of national income accountants improves NHA.
In Ecuador and Guatemala, the national authorities have now launched specific new efforts to repeat NHA and to sustain NHA capacity for future work.
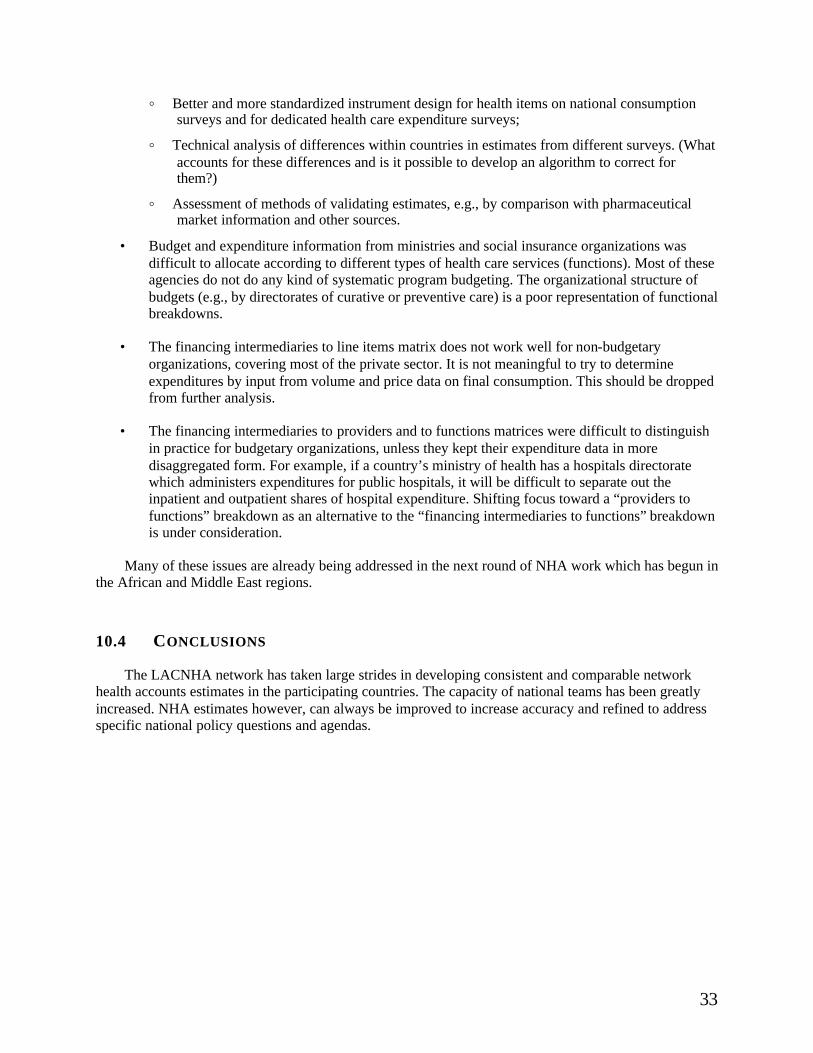
10.3 METHODS
For many of the participating countries, the LACNHA network was their first experience in developing estimates of national health expenditure. The NHA methods that were used had been developed and tested in a number of country-specific studies. But this was also the first time they were disseminated as part of a multi-country network, where the work was done by interagency national teams with only modest external technical support. This was a learning experience for all. National authorities investigated their own sources of data and debated their accuracy and completeness. External advisors observed and advised their national counterparts to see whether a methodology used in a few countries could be adapted to a much larger group of countries at the same time.
Not surprisingly, the results had both positive and negative elements. Some things worked well, others did not. Based on this experience, NHA methods can be improved. National authorities can learn not only from the new information generated, but also from the limitations of their results. In NHA, sometimes learning what we don’t know or can’t estimate can be very useful. Some of the key methodology lessons were:
• In general, comparable definitions of expenditure classifications are lacking. This is true when there are differences in categories across countries and even true sometimes when the same terminology is used in different countries. This is not surprising, as this was also the experience in the OECD countries when they began collecting health expenditure information. To strengthen comparability of findings, national authorities should work together to develop standardized definitions and to apply them in budgeting and expenditure for health care.
• While all countries had usable household survey data to estimate private spending, the quality and scope of this data varied greatly. Sometimes there were multiple sources of data which gave highly conflicted results. Since household spending is a large source of total spending in most countries in the region, further technical work on this aspect of national health expenditure estimation is needed. This could include:
33
B Better and more standardized instrument design for health items on national consumption surveys and for dedicated health care expenditure surveys;
B Technical analysis of differences within countries in estimates from different surveys. (What accounts for these differences and is it possible to develop an algorithm to correct for them?)
B Assessment of methods of validating estimates, e.g., by comparison with pharmaceutical market information and other sources.
• Budget and expenditure information from ministries and social insurance organizations was difficult to allocate according to different types of health care services (functions). Most of these agencies do not do any kind of systematic program budgeting. The organizational structure of budgets (e.g., by directorates of curative or preventive care) is a poor representation of functional breakdowns.
• The financing intermediaries to line items matrix does not work well for non-budgetary organizations, covering most of the private sector. It is not meaningful to try to determine expenditures by input from volume and price data on final consumption. This should be dropped from further analysis.
• The financing intermediaries to providers and to functions matrices were difficult to distinguish in practice for budgetary organizations, unless they kept their expenditure data in more disaggregated form. For example, if a country’s ministry of health has a hospitals directorate which administers expenditures for public hospitals, it will be difficult to separate out the inpatient and outpatient shares of hospital expenditure. Shifting focus toward a “providers to functions” breakdown as an alternative to the “financing intermediaries to functions” breakdown is under consideration.
Many of these issues are already being addressed in the next round of NHA work which has begun in the African and Middle East regions.
10.4 CONCLUSIONS
The LACNHA network has taken large strides in developing consistent and comparable network health accounts estimates in the participating countries. The capacity of national teams has been greatly increased. NHA estimates however, can always be improved to increase accuracy and refined to address specific national policy questions and agendas.


35
ANNEX A. BOLIVIA
Matriz 1: Agentes y Fuentes de Financiamiento
Matriz 2: Agentes y Prestadores de Servicios
Matriz 3: Agente y Tipo de Servicios
Matriz 4: Agente y Objecto del Gasto
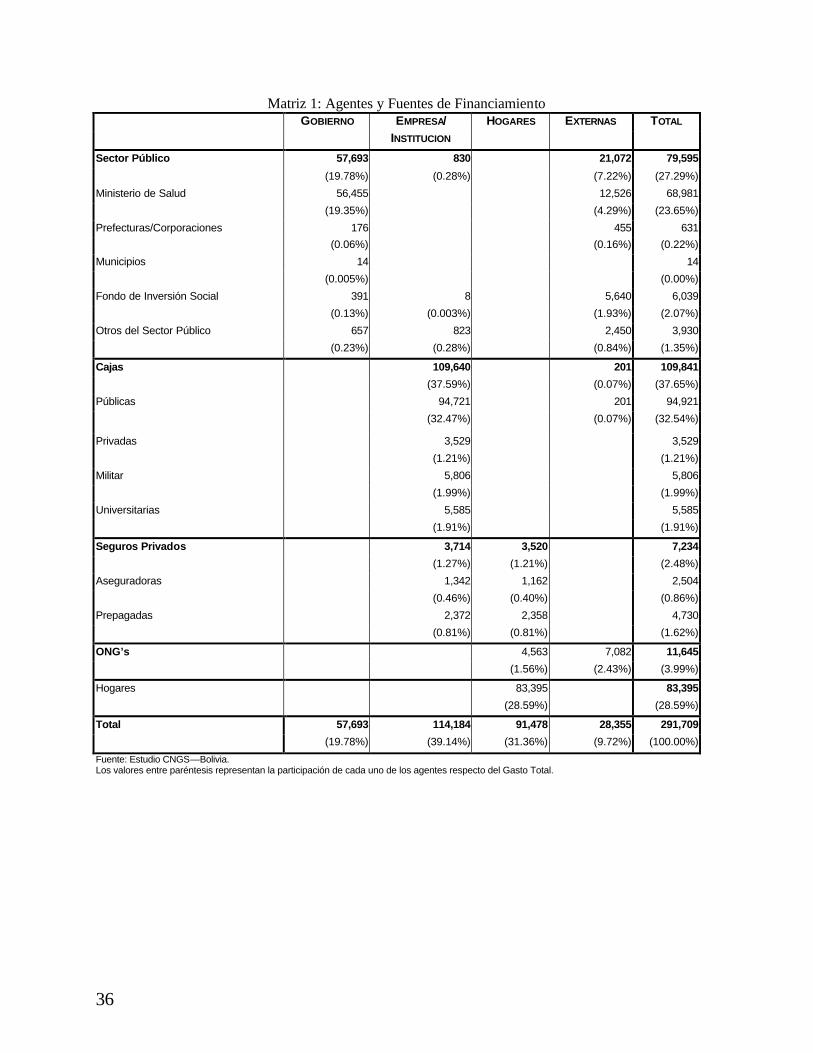
36
Matriz 1: Agentes y Fuentes de Financiamiento GOBIERNO EMPRESA/ HOGARES EXTERNAS TOTAL INSTITUCION
Sector Público 57,693 830 21,072 79,595
(19.78%) (0.28%) (7.22%) (27.29%)
Ministerio de Salud 56,455 12,526 68,981
(19.35%) (4.29%) (23.65%)
Prefecturas/Corporaciones 176 455 631
(0.06%) (0.16%) (0.22%)
Municipios 14 14
(0.005%) (0.00%)
Fondo de Inversión Social 391 8 5,640 6,039
(0.13%) (0.003%) (1.93%) (2.07%)
Otros del Sector Público 657 823 2,450 3,930
(0.23%) (0.28%) (0.84%) (1.35%)
Cajas 109,640 201 109,841
(37.59%) (0.07%) (37.65%)
Públicas 94,721 201 94,921
(32.47%) (0.07%) (32.54%)
Privadas 3,529 3,529
(1.21%) (1.21%)
Militar 5,806 5,806
(1.99%) (1.99%)
Universitarias 5,585 5,585
(1.91%) (1.91%)
Seguros Privados 3,714 3,520 7,234
(1.27%) (1.21%) (2.48%)
Aseguradoras 1,342 1,162 2,504
(0.46%) (0.40%) (0.86%)
Prepagadas 2,372 2,358 4,730
(0.81%) (0.81%) (1.62%)
ONG’s 4,563 7,082 11,645
(1.56%) (2.43%) (3.99%)
Hogares 83,395 83,395
(28.59%) (28.59%)
Total 57,693 114,184 91,478 28,355 291,709
(19.78%) (39.14%) (31.36%) (9.72%) (100.00%)
Fuente: Estudio CNGS—Bolivia. Los valores entre paréntesis representan la participación de cada uno de los agentes respecto del Gasto Total.

37
Matriz 2: Agentes y Prestadores de Servicios
GASTO NACIONAL EN SALUD PARA BOLIVIA, 1995, EN MILES DE DÓLARES CORRIENTES SERVICIOS CAJAS DE SERVICIOS PRIVADOS FARMACIAS PUBLICOS SALUD LUCRATIVO* ONG´S*
MED. TRAD.
TOTAL
SECTOR PÚBLICO 79,595 79,595 (27.29%)
Ministerio de Salud 68,981 68,981 (23.65%) (23.65%)
Prefecturas/Corporaciones 631 631 (0.22%) (0.22%)
Municipios 14 14 (0.00%) (0.005%)
Fondo de Inversión Social 6,039 6,039 (2.07%) (2.07%)
Otros del Sector Público 3,930 3,930 (1.35%) (1.35%)
CAJAS 109,841 109,841 (37.65%) (37.65%)
Públicas 94,921 94,921 (32.54%) (32.54%)
Privadas 3,529 3,529 (1.21%) (1.21%)
Militar 5,806 5,806 (1.99%) (1.99%)
Universitarias 5,585 5,585 (1.91%) (1.91%)
SEGUROS PRIVADOS 7,234 7,234 (2.48%) (2.48%)
Aseguradoras 2,504 2,504 (0.86%) (0.86%)
Prepagadas 4,730 4,730 (1.62%) (1.62%)
ONG´s 7,082 7,082 (2.43%) (2.43%)
HOGARES 3,818 1,628 25,366 4,811 52,121 214 87,958 (1.31%) (0.56%) (8.70%) (1.65%) (17.87%) (0.07%) (30.15%)
TOTAL 83,413 111,469 32,600 11,893 52,121 214 291,709 (28.59%) (38.21%) (11.18%) (4.08%) (17.87%) (0.07%) (100.00%)
Fuente: Estudio CNGS—Bolivia. Los valores entre paréntesis representan la participación de cada uno de los agentes respecto del Gasto Total.

38
Matriz 3: Agente y Tipo de Servicios
HOSPITALARIO AMBULATORIO PREVENCION/
OTROS No TOTALPROMOCION Asignables
SECTOR PÚBLICO 26,761 29,034 8,017 15,783 79,595(9.17%) (9.95%) (2.75%) (5.41%) (27.29%)
Ministerio de Salud 26,447 26,373 4,895 11,266 68,981(9.07%) (9.04%) (1.68%) (3.86%) (23.65%)
Prefecturas/Corporaciones 308 323 631(0.11%) (0.11%) (0.22%)
Municipios 5 8 1 14(0.002%) (0.00%) (0.0003%) (0.005%)
Fondo de Inversión Social 2,331 3,708 6,039(0.80%) (1.27%) (2.07%)
Otros del Sector Público 3,121 809 3,930(1.07%) (0.28%) (1.35%)
CAJAS 47,114 38,730 201 23,796 109,841(16.15%) (13.28%) (0.07%) (8.16%) (37.65%)
Públicas 43,378 29,887 201 21,456 94,921(14.87%) (10.25%) (0.07%) (7.36%) (32.54%)
Privadas 669 2,159 701 3,529(0.23%) (0.74%) (0.24%) (1.21%)
Militar 1,671 3,193 942 5,806(0.57%) (1.09%) (0.32%) (1.99%)
Universitarias 1,396 3,491 698 5,585(0.48%) (1.20%) (0.24%) (1.91%)
SEGUROS PRIVADOS 7,234 7,234(2.48%) (2.48%)
Aseguradoras 2,504 2,504(0.86%) (0.86%)
Prepagadas 4,730 4,730(1.62%) (1.62%)
ONG’S 1,980 7,802 349 1,514 11,645(0.68%) (2.67%) (0.12%) (0.52%) (3.99%)
HOGARES 11,681 16,048 55,666 83,395(4.00%) (5.50%) (19.08%) (28.59%)
TOTAL 87,535 91,614 8,567 96,759 7,234 291,709(30.01%) (31.41%) (2.94%) (33.17%) (2.48%) (100.00%)
Fuente: Estudio CNGS, en base a información proporcionada por el equipo del estudio CNGS. * Incluye compra de medicmentos en farmacias privadas nd. No disponible
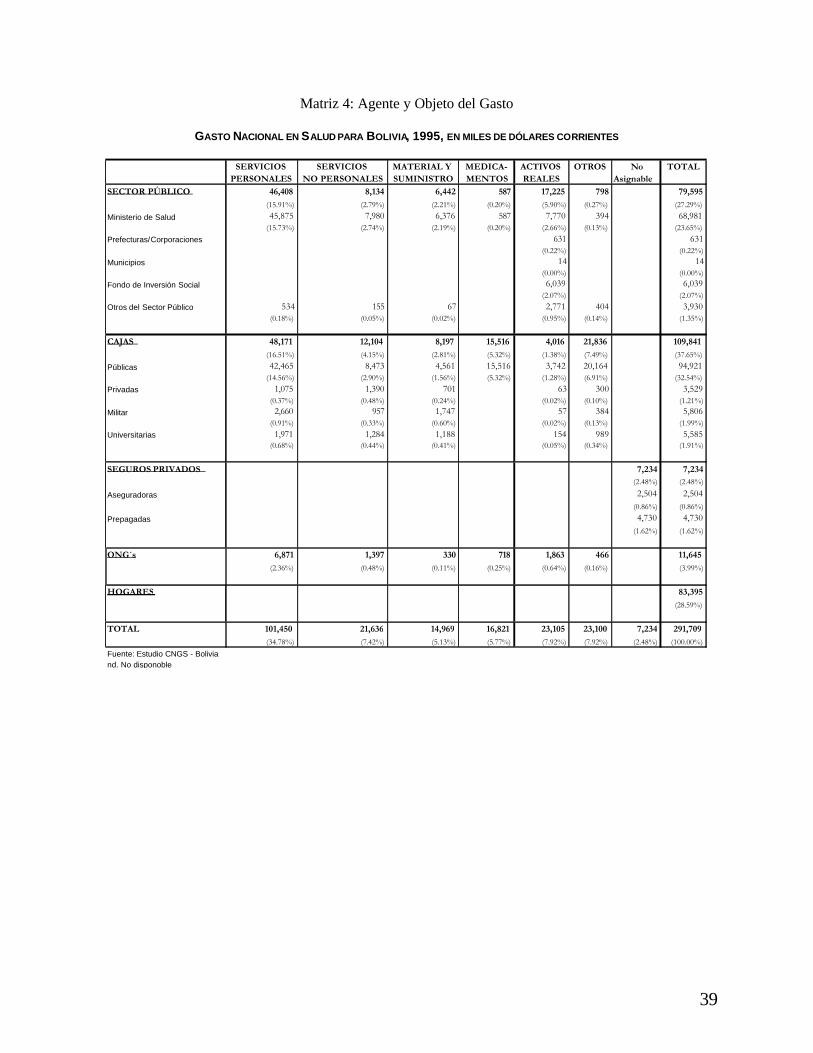
39
Matriz 4: Agente y Objeto del Gasto
GASTO NACIONAL EN SALUD PARA BOLIVIA, 1995, EN MILES DE DÓLARES CORRIENTES
SERVICIOS SERVICIOS MATERIAL Y MEDICA- ACTIVOS OTROS No TOTALPERSONALES NO PERSONALES SUMINISTRO MENTOS REALES Asignable
SECTOR PÚBLICO 46,408 8,134 6,442 587 17,225 798 79,595(15.91%) (2.79%) (2.21%) (0.20%) (5.90%) (0.27%) (27.29%)
Ministerio de Salud 45,875 7,980 6,376 587 7,770 394 68,981(15.73%) (2.74%) (2.19%) (0.20%) (2.66%) (0.13%) (23.65%)
Prefecturas/Corporaciones 631 631(0.22%) (0.22%)
Municipios 14 14(0.00%) (0.00%)
Fondo de Inversión Social 6,039 6,039(2.07%) (2.07%)
Otros del Sector Público 534 155 67 2,771 404 3,930(0.18%) (0.05%) (0.02%) (0.95%) (0.14%) (1.35%)
CAJAS 48,171 12,104 8,197 15,516 4,016 21,836 109,841(16.51%) (4.15%) (2.81%) (5.32%) (1.38%) (7.49%) (37.65%)
Públicas 42,465 8,473 4,561 15,516 3,742 20,164 94,921(14.56%) (2.90%) (1.56%) (5.32%) (1.28%) (6.91%) (32.54%)
Privadas 1,075 1,390 701 63 300 3,529(0.37%) (0.48%) (0.24%) (0.02%) (0.10%) (1.21%)
Militar 2,660 957 1,747 57 384 5,806(0.91%) (0.33%) (0.60%) (0.02%) (0.13%) (1.99%)
Universitarias 1,971 1,284 1,188 154 989 5,585(0.68%) (0.44%) (0.41%) (0.05%) (0.34%) (1.91%)
SEGUROS PRIVADOS 7,234 7,234(2.48%) (2.48%)
Aseguradoras 2,504 2,504(0.86%) (0.86%)
Prepagadas 4,730 4,730(1.62%) (1.62%)
ONG´s 6,871 1,397 330 718 1,863 466 11,645(2.36%) (0.48%) (0.11%) (0.25%) (0.64%) (0.16%) (3.99%)
HOGARES 83,395(28.59%)
TOTAL 101,450 21,636 14,969 16,821 23,105 23,100 7,234 291,709(34.78%) (7.42%) (5.13%) (5.77%) (7.92%) (7.92%) (2.48%) (100.00%)
Fuente: Estudio CNGS - Boliviand. No disponoble

41
ANNEX B. DOMINICAN REPUBLIC
Matriz 1: Flujo de Fondos de los Hogares como Fuente según Agentes Financieros
Matriz 2 Flujo de Hogar como Agente Financiero a los Proveedores
Matriz 3: Gasto en salud de los Hogares por Función
Matriz 4: Gasto en Salud por Objeto

MATRIZ 1: FLUJO DE FONDOS DE LOS HOGARES COMO FUENTE SEGÚN AGENTES FINANCIEROS

MATRIZ 2: FLUJO DE HOGAR COMO AGENTE FINANCIERO A LOS PROVEEDORES
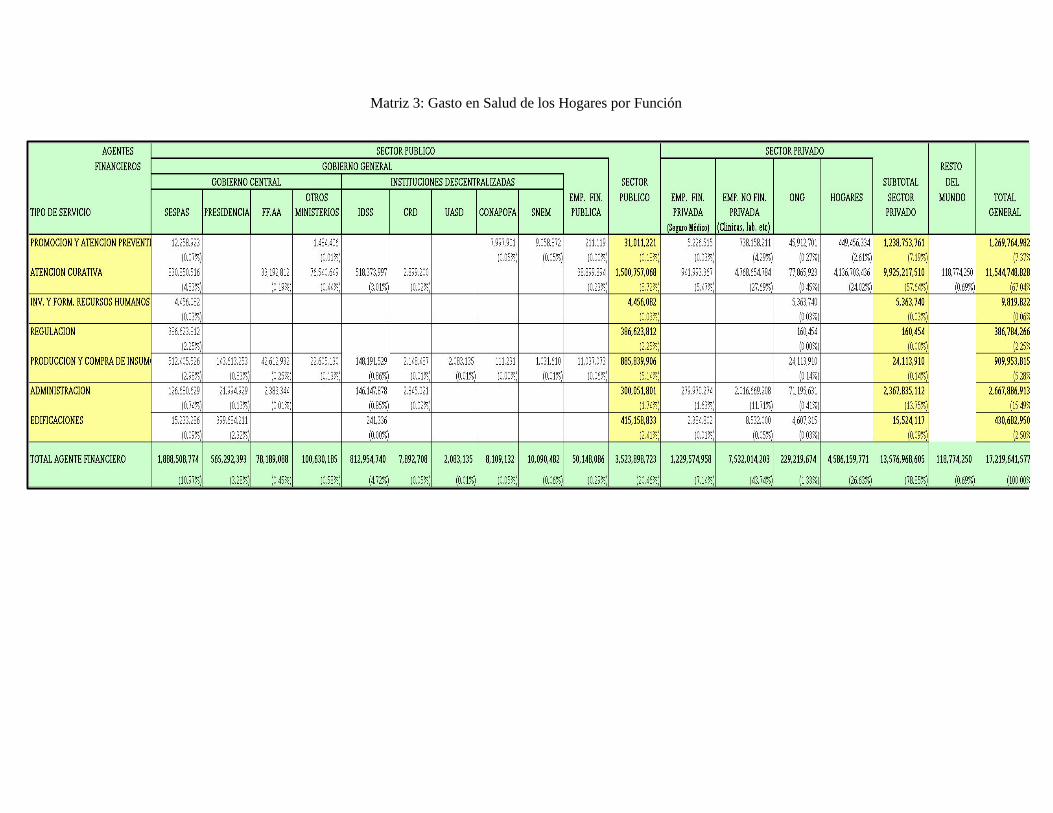
Matriz 3: Gasto en Salud de los Hogares por Función
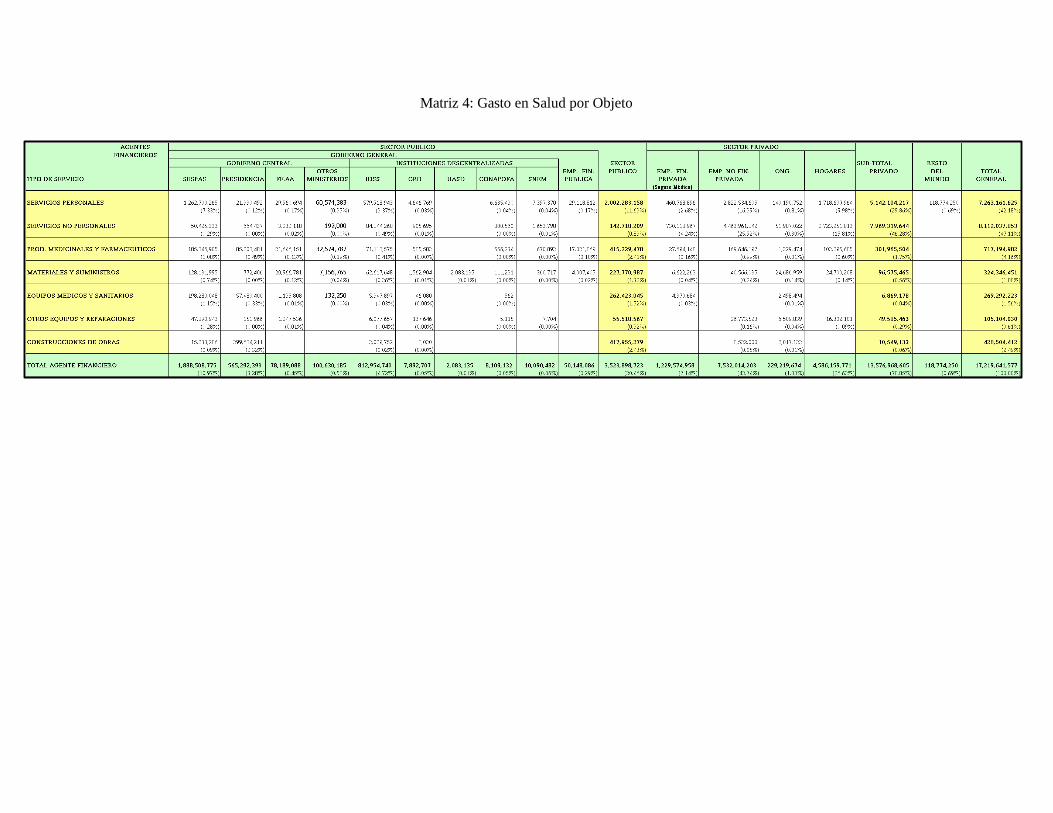
Matriz 4: Gasto en Salud por Objeto

47
ANNEX C. ECUADOR
Matriz 1: Informe Completo de la MatrizFuentes a Agentes Financieros
Matriz 2: Informe Completo de la Matriz Agentes Financieros a Proveedores
Matriz 3: Informe Completo de la Matriz Funciones a Agentes Financieros
Matriz 4: Informe Completo de la Matriz Agentes Financieros a Tipos de Gasto
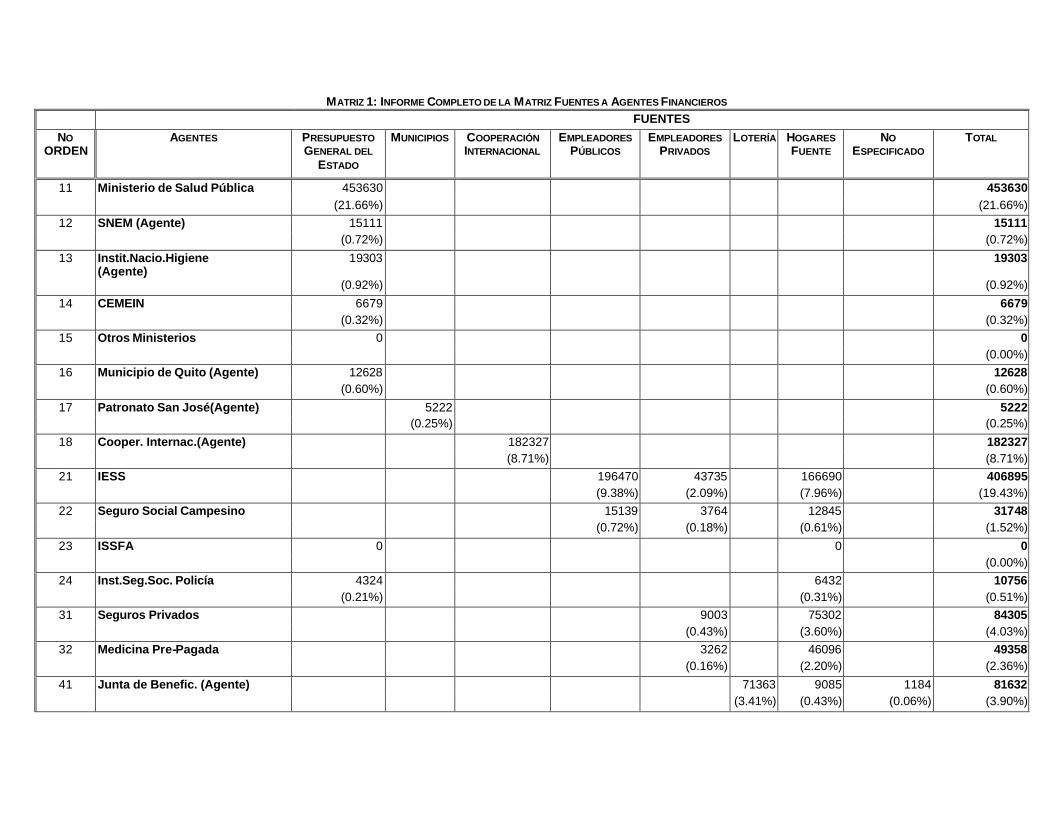
MATRIZ 1: INFORME COMPLETO DE LA MATRIZ FUENTES A AGENTES FINANCIEROS FUENTES
NO ORDEN
AGENTES PRESUPUESTO GENERAL DEL
ESTADO
MUNICIPIOS COOPERACIÓN INTERNACIONAL
EMPLEADORES PÚBLICOS
EMPLEADORES PRIVADOS
LOTERÍA HOGARES FUENTE
NO ESPECIFICADO
TOTAL
11 Ministerio de Salud Pública 453630 453630 (21.66%) (21.66%)
12 SNEM (Agente) 15111 15111 (0.72%) (0.72%)
13 Instit.Nacio.Higiene (Agente)
19303 19303
(0.92%) (0.92%)
14 CEMEIN 6679 6679 (0.32%) (0.32%)
15 Otros Ministerios 0 0 (0.00%)
16 Municipio de Quito (Agente) 12628 12628 (0.60%) (0.60%)
17 Patronato San José(Agente) 5222 5222 (0.25%) (0.25%)
18 Cooper. Internac.(Agente) 182327 182327 (8.71%) (8.71%)
21 IESS 196470 43735 166690 406895 (9.38%) (2.09%) (7.96%) (19.43%)
22 Seguro Social Campesino 15139 3764 12845 31748 (0.72%) (0.18%) (0.61%) (1.52%)
23 ISSFA 0 0 0 (0.00%)
24 Inst.Seg.Soc. Policía 4324 6432 10756 (0.21%) (0.31%) (0.51%)
31 Seguros Privados 9003 75302 84305 (0.43%) (3.60%) (4.03%)
32 Medicina Pre-Pagada 3262 46096 49358 (0.16%) (2.20%) (2.36%)
41 Junta de Benefic. (Agente) 71363 9085 1184 81632 (3.41%) (0.43%) (0.06%) (3.90%)

FUENTES
NO ORDEN
AGENTES PRESUPUESTO GENERAL DEL
ESTADO
MUNICIPIOS COOPERACIÓN INTERNACIONAL
EMPLEADORES PÚBLICOS
EMPLEADORES PRIVADOS
LOTERÍA HOGARES FUENTE
NO ESPECIFICADO
TOTAL
42 SOLCA 8818 4988 13806 (0.42%) (0.24%) (0.66%)
43 INNFA 448 4057 4505 (0.02%) (0.19%) (0.22%)
44 Cruz Roja Ecuatoriana 27 1164 1191 (0.00%) (0.06%) (0.06%)
45 Otras ONG´s 5831 2525 8356 (0.28%) (0.12%) (0.40%)
49 Empresas (Agente) 14107 14107 (0.67%) (0.67%)
50 Hogares (Agente) 692855 692855 (33.08%) (33.08%)
TOTAL 511702 5222 188158 211609 76396 71363 1E+06 11393 2094414
(24.43%) (0.25%) (8.98%) (10.10%) (3.65%) (3.41%) (48.63%) (0.54%) (100.00%)
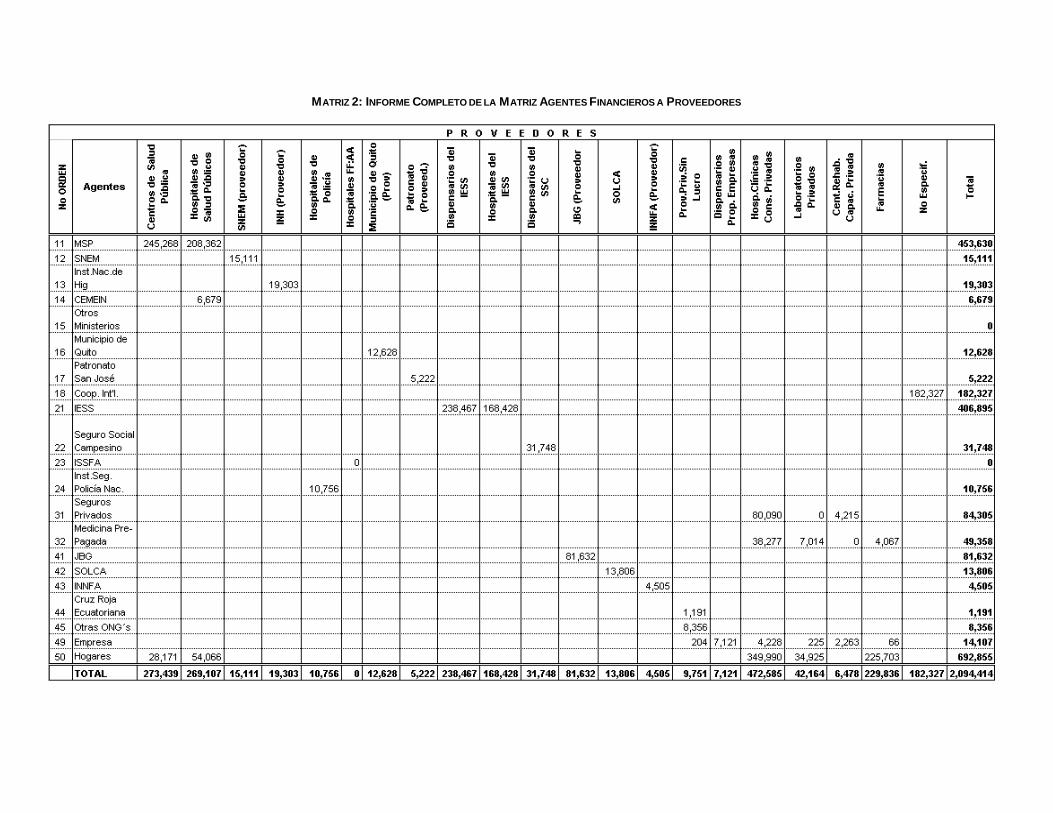
MATRIZ 2: INFORME COMPLETO DE LA MATRIZ AGENTES FINANCIEROS A PROVEEDORES
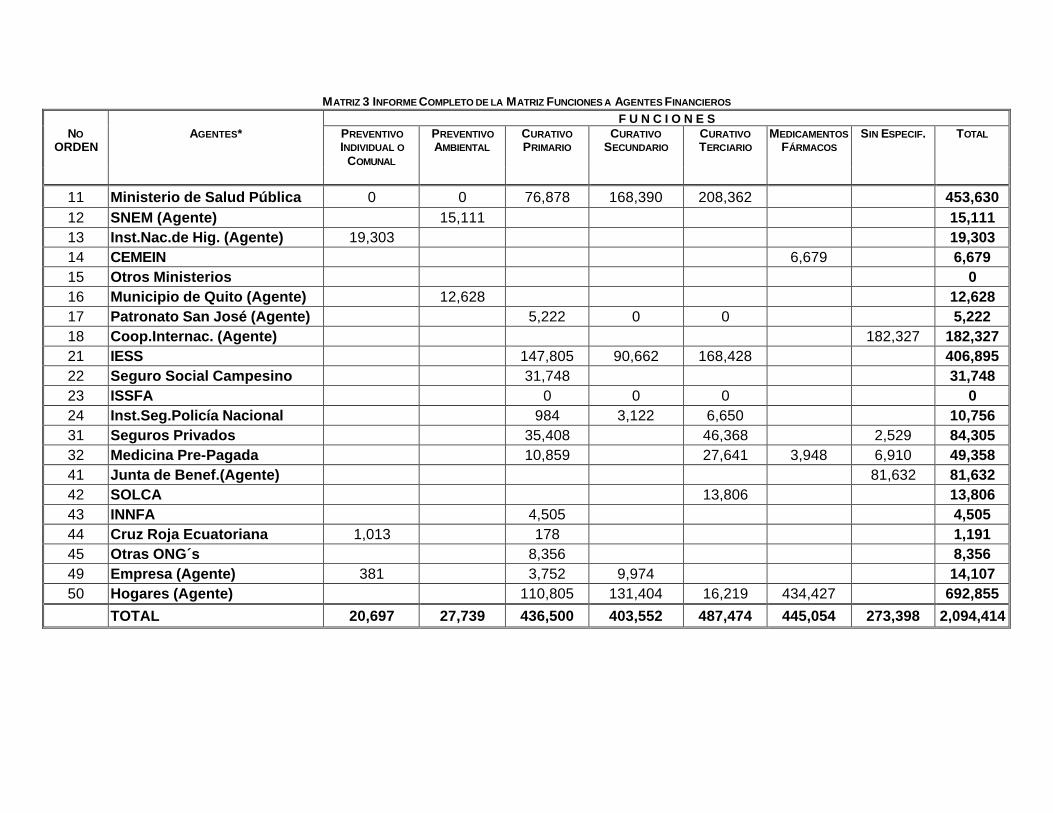
MATRIZ 3 INFORME COMPLETO DE LA MATRIZ FUNCIONES A AGENTES FINANCIEROS F U N C I O N E S
NO ORDEN
AGENTES* PREVENTIVO INDIVIDUAL O
COMUNAL
PREVENTIVO AMBIENTAL
CURATIVO PRIMARIO
CURATIVO SECUNDARIO
CURATIVO TERCIARIO
MEDICAMENTOS FÁRMACOS
SIN ESPECIF. TOTAL
11 Ministerio de Salud Pública 0 0 76,878 168,390 208,362 453,630 12 SNEM (Agente) 15,111 15,111 13 Inst.Nac.de Hig. (Agente) 19,303 19,303 14 CEMEIN 6,679 6,679 15 Otros Ministerios 0 16 Municipio de Quito (Agente) 12,628 12,628 17 Patronato San José (Agente) 5,222 0 0 5,222 18 Coop.Internac. (Agente) 182,327 182,327 21 IESS 147,805 90,662 168,428 406,895 22 Seguro Social Campesino 31,748 31,748 23 ISSFA 0 0 0 0 24 Inst.Seg.Policía Nacional 984 3,122 6,650 10,756 31 Seguros Privados 35,408 46,368 2,529 84,305 32 Medicina Pre-Pagada 10,859 27,641 3,948 6,910 49,358 41 Junta de Benef.(Agente) 81,632 81,632 42 SOLCA 13,806 13,806 43 INNFA 4,505 4,505 44 Cruz Roja Ecuatoriana 1,013 178 1,191 45 Otras ONG´s 8,356 8,356 49 Empresa (Agente) 381 3,752 9,974 14,107 50 Hogares (Agente) 110,805 131,404 16,219 434,427 692,855
TOTAL 20,697 27,739 436,500 403,552 487,474 445,054 273,398 2,094,414
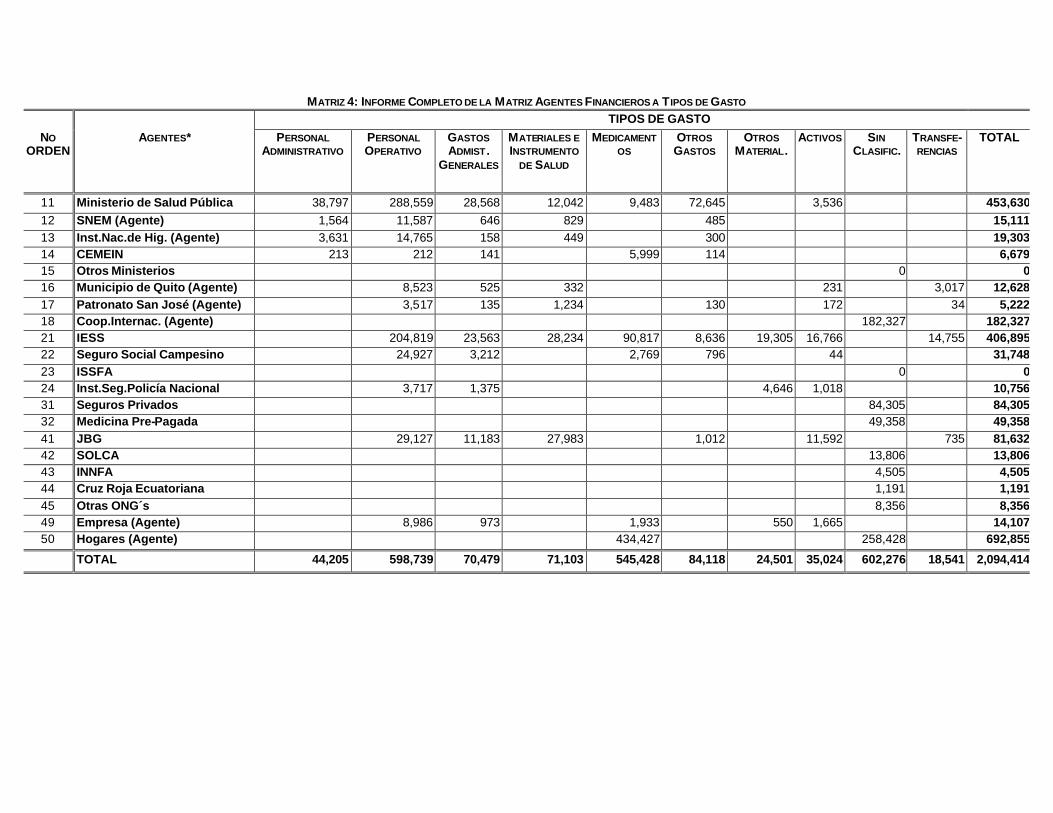
MATRIZ 4: INFORME COMPLETO DE LA MATRIZ AGENTES FINANCIEROS A T IPOS DE GASTO TIPOS DE GASTO
NO ORDEN
AGENTES* PERSONAL ADMINISTRATIVO
PERSONAL OPERATIVO
GASTOS ADMIST .
GENERALES
MATERIALES E INSTRUMENTO
DE SALUD
MEDICAMENTOS
OTROS GASTOS
OTROS MATERIAL.
ACTIVOS SIN CLASIFIC.
TRANSFE-RENCIAS
TOTAL
11 Ministerio de Salud Pública 38,797 288,559 28,568 12,042 9,483 72,645 3,536 453,63012 SNEM (Agente) 1,564 11,587 646 829 485 15,11113 Inst.Nac.de Hig. (Agente) 3,631 14,765 158 449 300 19,30314 CEMEIN 213 212 141 5,999 114 6,67915 Otros Ministerios 0 016 Municipio de Quito (Agente) 8,523 525 332 231 3,017 12,62817 Patronato San José (Agente) 3,517 135 1,234 130 172 34 5,22218 Coop.Internac. (Agente) 182,327 182,32721 IESS 204,819 23,563 28,234 90,817 8,636 19,305 16,766 14,755 406,89522 Seguro Social Campesino 24,927 3,212 2,769 796 44 31,74823 ISSFA 0 024 Inst.Seg.Policía Nacional 3,717 1,375 4,646 1,018 10,75631 Seguros Privados 84,305 84,30532 Medicina Pre-Pagada 49,358 49,35841 JBG 29,127 11,183 27,983 1,012 11,592 735 81,63242 SOLCA 13,806 13,80643 INNFA 4,505 4,50544 Cruz Roja Ecuatoriana 1,191 1,19145 Otras ONG´s 8,356 8,35649 Empresa (Agente) 8,986 973 1,933 550 1,665 14,10750 Hogares (Agente) 434,427 258,428 692,855
TOTAL 44,205 598,739 70,479 71,103 545,428 84,118 24,501 35,024 602,276 18,541 2,094,414
53
ANNEX D. EL SALVADOR
Matrix 1: Sources to Financing Agents
Matrix 2: Financing Agents to Providers
Matrix 3: Financing Agents to Functions of Health Care
Matrix 4: Financing Agents to Line Items

Health Care Financing in Eight Latin American and Ca ribbean Nations: The First Regional NHA Network
54
MATRIX 1: SOURCES TO FINANCING AGENTS
IN COLONES CORRIENTES Sources
FA Central Gov (GOES)
Public Firms Foreign Assistance
Privately-Owned Firms
Households Other TOTAL
MSPAS 1,309,574,973 333,649,120 42,676,389 16,261,593 1,702,162,075
ISSS 228,848,044 767,512,845 418,159,633 107,485,877 1,522,006,399
HH 3,933,963,960 3,933,963,960
Priv Ins 81,607,000 81,607,000
NGOs 11,981,486 11,981,486
Other 159,150,000 159,150,000
TOTAL 1,468,724,973 228,848,044 345,630,606 767,512,845 4,394,799,982 205,354,470 7,410,870,920
IN PERCENTAGES Sources
FA Central Gov (GOES)
Public Firms Foreign Assistance
Privately-Owned Firms
Households Other TOTAL
MSPAS 76.94% 19.60% 2.51% 0.96% 100.00% ISSS 15.04% 50.43% 27.47% 7.06% 100.00% HH 100.00% 100.00% Priv Ins 100.00% 100.00% NGOs 100.00% 100.00% Other 100.00% 100.00% TOTAL 19.82% 3.09% 4.66% 10.36% 59.30% 2.77% 100.00%
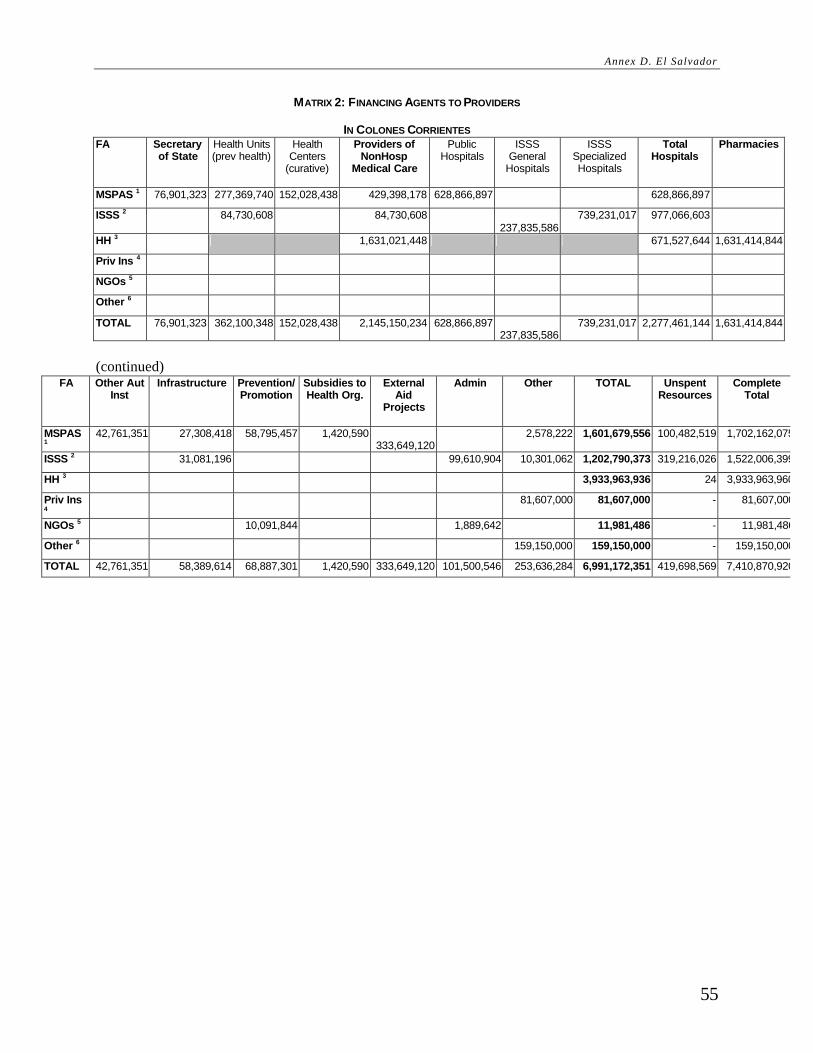
Annex D. El Salvador
55
MATRIX 2: FINANCING AGENTS TO PROVIDERS
IN COLONES CORRIENTES FA Secretary
of State Health Units (prev health)
Health Centers
(curative)
Providers of NonHosp
Medical Care
Public Hospitals
ISSS General
Hospitals
ISSS Specialized Hospitals
Total Hospitals
Pharmacies
MSPAS 1 76,901,323 277,369,740 152,028,438 429,398,178 628,866,897 628,866,897
ISSS 2 84,730,608 84,730,608 237,835,586
739,231,017 977,066,603
HH 3 1,631,021,448 671,527,644 1,631,414,844
Priv Ins 4
NGOs 5
Other 6
TOTAL 76,901,323 362,100,348 152,028,438 2,145,150,234 628,866,897 237,835,586
739,231,017 2,277,461,144 1,631,414,844
(continued)
FA Other Aut Inst
Infrastructure Prevention/ Promotion
Subsidies to Health Org.
External Aid
Projects
Admin Other TOTAL Unspent Resources
Complete Total
MSPAS 1
42,761,351 27,308,418 58,795,457 1,420,590 333,649,120
2,578,222 1,601,679,556 100,482,519 1,702,162,075
ISSS 2 31,081,196 99,610,904 10,301,062 1,202,790,373 319,216,026 1,522,006,399
HH 3 3,933,963,936 24 3,933,963,960
Priv Ins 4
81,607,000 81,607,000 - 81,607,000
NGOs 5 10,091,844 1,889,642 11,981,486 - 11,981,486
Other 6 159,150,000 159,150,000 - 159,150,000
TOTAL 42,761,351 58,389,614 68,887,301 1,420,590 333,649,120 101,500,546 253,636,284 6,991,172,351 419,698,569 7,410,870,920

Health Care Financing in Eight Latin American and Ca ribbean Nations: The First Regional NHA Network
56
AS PERCENTAGES FA Secretary
of State Health Units (prev health)
Health Centers
(curative)
Total NonHosp
Medical Care
Public Hospitals
ISSS General
Hospitals
ISSS Specialized Hospitals
Total Hospitals
Pharmacies
MSPAS 4.80% 17.32% 9.49% 26.81% 39.26% 39.26%
ISSS 7.04% 7.04% 19.77% 61.46% 81.23%
HH 41.46% 17.07% 41.47%
Priv Ins
NGOs
Other
TOTAL 1.10% 5.18% 2.17% 30.68% 9.00% 3.40% 10.57% 32.58% 23.34%
FA Other Aut
Inst Infrastructure Prevention/
Promotion Subsidies to Health Org
External Aid Projects Admin (central level)
Other TOTAL
MSPAS 2.67% 1.70% 3.67% 0.09% 20.83% 0.16% 100.00%
ISSS 2.58% 8.28% 0.86% 100.00%
HH 100.00%
Priv Ins 100.00%
NGOs 84% 100.00%
Other 100.00% 100.00%
TOTAL 0.61% 0.84% 0.99% 0.02% 4.77% 1.45% 3.63% 100.00%

MATRIX 3: FINANCING AGENTS TO FUNCTIONS OF HEALTH CARE
IN COLONES CORRIENTES FA Functions
Admin Prevention/ Promotion
Ambulatory Care
Hosptial Care Other Infra- structure
Other (ext aid projects)
TOTAL Unspent Resources
Complete Total
MSPAS 1 157,271,345 376,028,617 89,696,778 646,819,553 4,021,805 213,553,307 114,288,151 1,601,679,556 100,482,519 1,702,162,075 ISSS 2 99,610,904 84,730,608 977,066,603 10,301,062 31,081,196 1,202,790,373 319,216,026 1,522,006,399
HH 3 2,002,225,598 1,319,613,550 612,124,788 3,933,963,936 24 3,933,963,960 Priv Ins 4 81,607,000 81,607,000 - 81,607,000
NGOs 5 1,889,642 10,091,844 11,981,486 - 11,981,486 Other 6 159,150,000 159,150,000 - 159,150,000
TOTAL 258,771,891 386,120,461 2,176,652,984 2,943,499,706 867,204,655 244,634,503 114,288,151 6,991,172,351 419,698,569 7,410,870,920
AS PERCENTAGES FA Functions
Admin Prevention/ Promotion
Ambulatory Care
Hosptial Care Other Infrastructure Other (ext aid projects) TOTAL
MSPAS 9.82% 23.48% 13.33% 7.14% 100.00% ISSS 8.28% 0.86% 2.58% 100.00% HH 50.90% 33.54% 15.56% 100.00% Priv Ins 100.00% 100.00% NGOs 15.77% 100.00% Other 100.00% 100.00% TOTAL 3.70% 5.52% 31.13% 42.10% 12.40% 3.50% 1.63% 100.00%
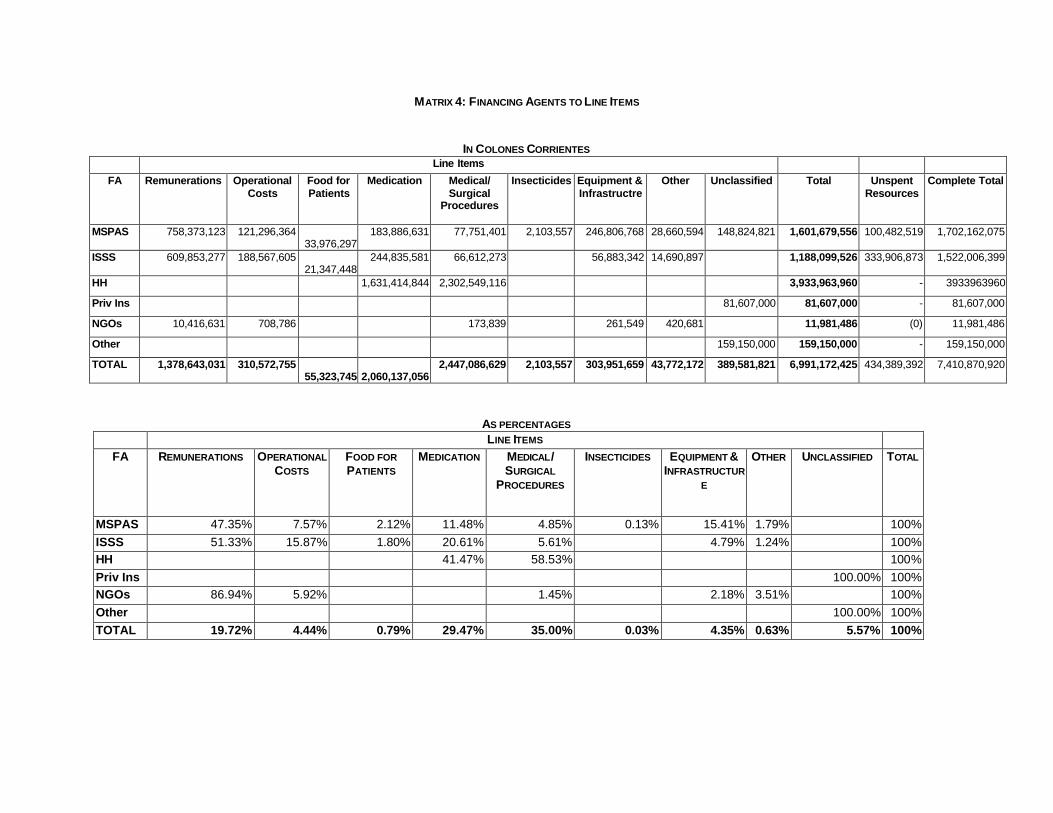
MATRIX 4: FINANCING AGENTS TO LINE ITEMS
IN COLONES CORRIENTES Line Items
FA Remunerations Operational Costs
Food for Patients
Medication Medical/ Surgical
Procedures
Insecticides Equipment & Infrastructre
Other Unclassified Total Unspent Resources
Complete Total
MSPAS 758,373,123 121,296,364 33,976,297
183,886,631 77,751,401 2,103,557 246,806,768 28,660,594 148,824,821 1,601,679,556 100,482,519 1,702,162,075
ISSS 609,853,277 188,567,605 21,347,448
244,835,581 66,612,273 56,883,342 14,690,897 1,188,099,526 333,906,873 1,522,006,399
HH 1,631,414,844 2,302,549,116 3,933,963,960 - 3933963960
Priv Ins 81,607,000 81,607,000 - 81,607,000
NGOs 10,416,631 708,786 173,839 261,549 420,681 11,981,486 (0) 11,981,486
Other 159,150,000 159,150,000 - 159,150,000
TOTAL 1,378,643,031 310,572,755 55,323,745
2,060,137,056
2,447,086,629 2,103,557 303,951,659 43,772,172 389,581,821 6,991,172,425 434,389,392 7,410,870,920
AS PERCENTAGES LINE ITEMS
FA REMUNERATIONS OPERATIONAL COSTS
FOOD FOR PATIENTS
MEDICATION MEDICAL/ SURGICAL
PROCEDURES
INSECTICIDES EQUIPMENT & INFRASTRUCTUR
E
OTHER UNCLASSIFIED TOTAL
MSPAS 47.35% 7.57% 2.12% 11.48% 4.85% 0.13% 15.41% 1.79% 100% ISSS 51.33% 15.87% 1.80% 20.61% 5.61% 4.79% 1.24% 100% HH 41.47% 58.53% 100% Priv Ins 100.00% 100% NGOs 86.94% 5.92% 1.45% 2.18% 3.51% 100% Other 100.00% 100% TOTAL 19.72% 4.44% 0.79% 29.47% 35.00% 0.03% 4.35% 0.63% 5.57% 100%
59
ANNEX E. GUATEMALA
Matriz 1: Fuentes a Agentes, 1995
Matriz 2: Financing Agents to Providers
Matriz 3: Financing Agents to Functions of Health Care
Matriz 4: Financing Agents to Line Items

Health Care Financing in Eight Latin American and Caribbean Nations: The First Regional NHA Network
60
MATRIZ 1: FUENTES A AGENTES, 1995
(CIFRAS EN QUETZALES) FUENTES
AGENTES Gobierno Cooperación Externa
Hogares Empresas TOTAL Dólares EUA
Ministerio de Salud 497,063,143.14 45,223,503.33 542,286,646.47 90,381,107.75 Otros Ministerios 52,682,253.60 n.d. 52,682,253.60 8,780,375.60 Fondos Sociales 3,439,000.00 3,439,000.00 573,166.67 IGSS 44,782,876.44 n.d. 153,878,510.60 330,295,424.07 528,956,811.11 88,159,468.52 Subtotal Gasto Público
597,967,273.18 45,223,503.33 153,878,510.60 330,295,424.07 1,127,364,711.18 187,894,118.53
ONG 8,618,235.10 67,058,510.05 121,276.84 - 75,798,021.98 12,633,003.66 Seguros Privados n.d. n.d. 39,650,890.00 35,162,110.00 74,813,000.00 12,468,833.33 Fondo de Hogares 623,095,670.44 623,095,670.44 103,849,278.41 Subtotal Gasto Privado
8,618,235.10 67,058,510.05 662,867,837.28 35,162,110.00 773,706,692.42 128,951,115.40
TOTAL 606,585,508.28 112,282,013.38 816,746,347.88 365,457,534.07 1,901,071,403.60 316,845,233.93
Dólares EUA 101,097,584.71 18,713,668.90 136,124,391.31 60,909,589.01 316,845,233.93

MATRIZ 2: AGENTES A PROVEEDORES, 1995
(CIFRAS EN QUETZALES)
Proveedores Ministerio de Salud
Otros Ministerios
Fondos Sociales IGSS ONG Seguros
Privados Fondo de Hogares TOTAL DOLARES
Ministerio de Salud 533,214,535.47 47,855,690.09 3,439,000.00 9,475,158.55 593,984,384.11 98,997,397.35
IGSS - n.d 528,956,811.11 528,956,811.11 88,159,468.52 Hospital militar y Policía Nacional
- 4,826,563.51 4,826,563.51 804,427.25
Municipalidades 5,526,310.00 n.d. 5,526,310.00 921,051.67 Subtotal Sector Público 538,740,845.47 52,682,253.60 3,439,000.00 528,956,811.11 - - 9,475,158.55 1,133,294,068.73 188,882,344.79
ONG proveedoras 3,545,801.00 - 26,878,129.53 12,730,580.86 43,154,511.39 7,192,418.56 Privados Lucrativos - - 44,109,000.00 410,802,907.91 454,911,907.91 75,818,651.32 Farmacias - - n.d. 190,087,023.12 190,087,023.12 31,681,170.52 Subtotal Sector Privado 3,545,801.00 - - - 26,878,129.53 44,109,000.00 613,620,511.89 688,153,442.42 114,692,240.40
Otros 48,919,892.45 30,704,000.00 79,623,892.45 13,270,648.74 TOTAL 542,286,646.47 52,682,253.60 3,439,000.00 528,956,811.11 75,798,021.98 74,813,000.00 623,095,670.44 1,901,071,403.60 316,845,233.93
DOLARES 90,381,107.75 8,780,375.60 573,166.67 88,159,468.52 12,633,003.66 12,468,833.33 103,849,278.41 316,845,233.93

MATRIZ 3: A FLUJO DE AGENTES A FUNCIONES, 1995 Funciones Ministerio de
Salud Otros
Ministerios Fondos Sociales
IGSS ONG Seguros Privados
Fondo de Hogares
TOTAL DOLARES
Administración 71,615,831.00 830,328.00 953,000.00 115,695,034.84 10,273,177.41 199,367,371.25 33,227,895.21 Programas Preventivos
22,361,174.00 - 19,040,953.11 19,371,721.18 15,705,898.28 76,479,746.58 12,746,624.43
Atención médica ambulatoria
174,870,049.00 4,686,233.07 106,000.00 76,163,812.45 17,594,474.49 396,814,632.90 670,235,201.92 111,705,866.99
Atención médica hospitalaria
254,814,203.00 - 285,614,296.70 10,213,689.22 44,109,000.00 210,575,139.25 805,326,328.18 134,221,054.70
Infraestructura 445,136.20 47,165,692.53 2,380,000.00 32,442,714.00 n.d. 82,433,542.73 13,738,923.79 Gastos no asignables a prog.
18,180,253.27 - - 18,344,959.67 30,704,000.00 67,229,212.94 11,204,868.82
TOTAL 542,286,646.47 52,682,253.60 3,439,000.00 528,956,811.11 75,798,021.98 74,813,000.00 623,095,670.44 1,901,071,403.60 316,845,233.93 DOLARES 90,381,107.75 8,780,375.60 573,166.67 88,159,468.52 12,633,003.66 12,468,833.33 103,849,278.41 316,845,233.93
MATRIZ 4: A FLUJO DE AGENTES A ELEMENTOS DE GASTO, 1995 Elemento de
Gasto Ministerio de
Salud Otros
Ministerios Fondos Sociales
IGSS ONG Seguros Privados
Fondo de Hogares TOTAL DOLARES
Servicios Personales
282,224,832.43 - 953,000.00 264,564,184.49 n.d. - 547,742,016.92 91,290,336.15
Servicios No Personales
32,064,314.42 - - 30,099,877.14 n.d. - 62,164,191.56 10,360,698.59
Servicios Médicos 9,072,111.00 - - n.d. 44,109,000.00 433,008,647.32 486,189,758.32 81,031,626.39 Medicamentos 79,887,340.03 2,204,533.07 106,000.00 107,624,336.93 8,552,637.78 - 190,087,023.12 388,461,870.93 64,743,645.15 Equipo y material médico
34,586,287.58 14,348,196.41 644,000.00 55,743,222.04 n.d. - 105,321,706.03 17,553,617.67
Eq. Y mat. No médico
90,786,388.36 - - 30,262,095.91 n.d. - 121,048,484.27 20,174,747.38
Infraestructura 445,136.20 35,299,196.12 1,736,000.00 24,401,160.07 n.d. - 61,881,492.39 10,313,582.07 Mantenimiento 2,650,905.25 830,328.00 - 4,764,495.41 n.d. - 8,245,728.66 1,374,288.11 Gastos No Clasificados
10,569,331.20 - - 11,497,439.12 67,245,384.20 30,704,000.00 120,016,154.52 20,002,692.42
TOTAL 542,286,646.47 52,682,253.60 3,439,000.00 528,956,811.11 75,798,021.98 74,813,000.00 623,095,670.44 1,901,071,403.60 316,845,233.93 Dólares 90,381,107.75 8,780,375.60 573,166.67 88,159,468.52 12,633,003.66 12,468,833.33 103,849,278.41 316,845,233.93

63
ANNEX F. MEXICO
Matriz 1: Gasto en Salud según Fuents de Financiamiento, 1995
Matriz 2: Gasto en Salud que Asignan los Agentes a las Instituciones Prestadores de Servicios
Matriz 3: Gasto en Salud por Tipo de Servicios de los Agentes, 1995
Matriz 4: Tipo de Gasto de los Agentes de Servicios de Salud, 1995
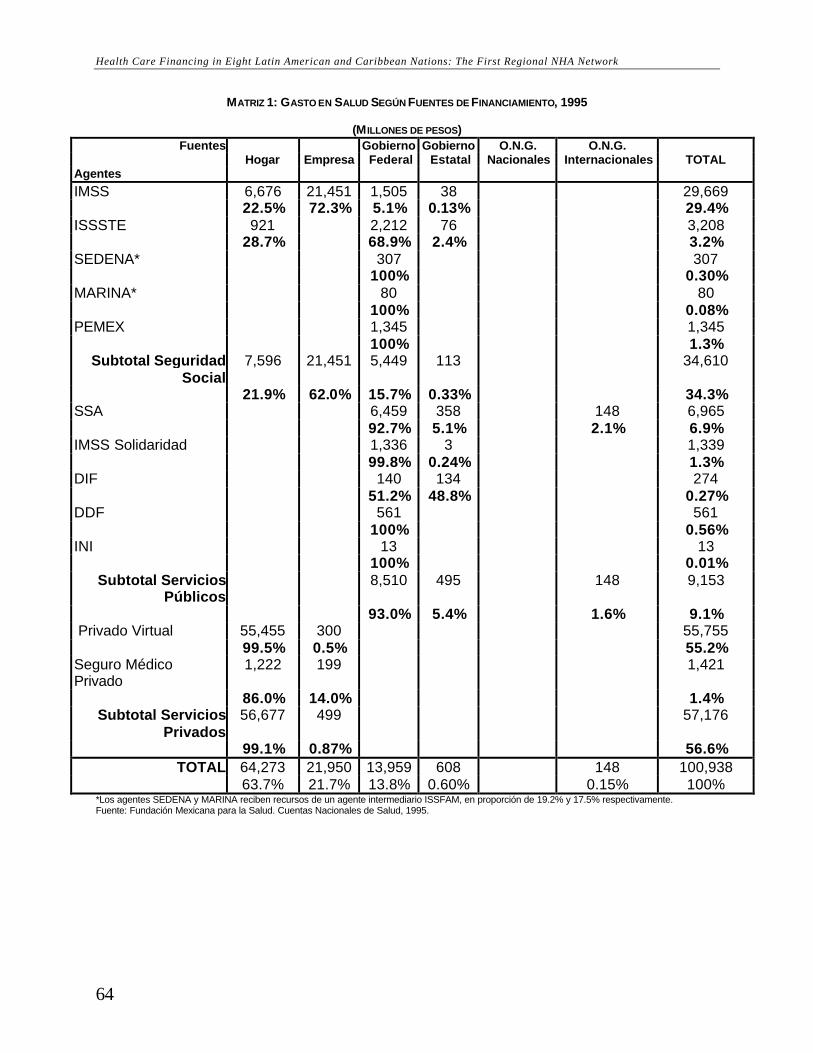
Health Care Financing in Eight Latin American and Caribbean Nations: The First Regional NHA Network
64
MATRIZ 1: GASTO EN SALUD SEGÚN FUENTES DE FINANCIAMIENTO, 1995
(M ILLONES DE PESOS) Fuentes Gobierno Gobierno O.N.G. O.N.G.
Hogar Empresa Federal Estatal Nacionales Internacionales TOTAL Agentes
IMSS 6,676 21,451 1,505 38 29,669 22.5% 72.3% 5.1% 0.13% 29.4% ISSSTE 921 2,212 76 3,208 28.7% 68.9% 2.4% 3.2% SEDENA* 307 307 100% 0.30% MARINA* 80 80 100% 0.08% PEMEX 1,345 1,345
100% 1.3% Subtotal Seguridad
Social7,596 21,451 5,449 113 34,610
21.9% 62.0% 15.7% 0.33% 34.3% SSA 6,459 358 148 6,965 92.7% 5.1% 2.1% 6.9% IMSS Solidaridad 1,336 3 1,339 99.8% 0.24% 1.3% DIF 140 134 274 51.2% 48.8% 0.27% DDF 561 561 100% 0.56% INI 13 13
100% 0.01% Subtotal Servicios
Públicos 8,510 495 148 9,153
93.0% 5.4% 1.6% 9.1% Privado Virtual 55,455 300 55,755 99.5% 0.5% 55.2% Seguro Médico Privado
1,222 199 1,421
86.0% 14.0% 1.4% Subtotal Servicios
Privados56,677 499 57,176
99.1% 0.87% 56.6% TOTAL 64,273 21,950 13,959 608 148 100,938
63.7% 21.7% 13.8% 0.60% 0.15% 100% *Los agentes SEDENA y MARINA reciben recursos de un agente intermediario ISSFAM, en proporción de 19.2% y 17.5% respectivamente. Fuente: Fundación Mexicana para la Salud. Cuentas Nacionales de Salud, 1995.
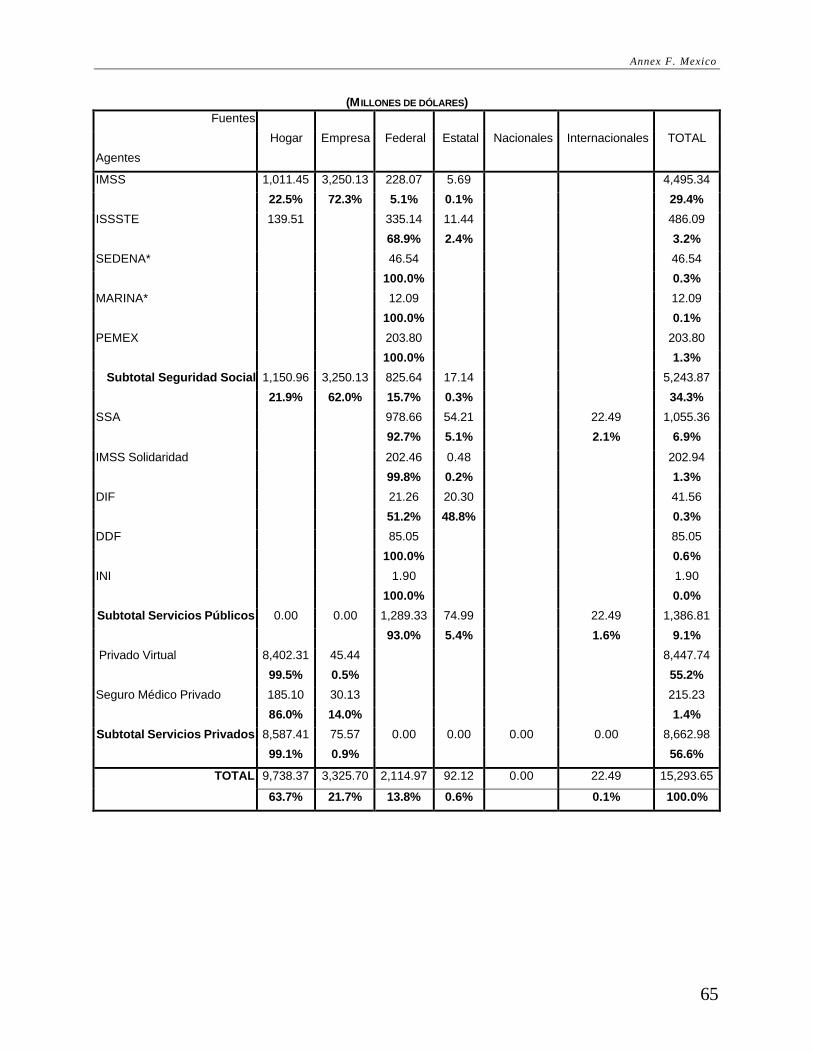
Annex F. Mexico
65
(M ILLONES DE DÓLARES) Fuentes
Hogar Empresa Federal Estatal Nacionales Internacionales TOTAL
Agentes
IMSS 1,011.45 3,250.13 228.07 5.69 4,495.34
22.5% 72.3% 5.1% 0.1% 29.4%
ISSSTE 139.51 335.14 11.44 486.09
68.9% 2.4% 3.2%
SEDENA* 46.54 46.54
100.0% 0.3%
MARINA* 12.09 12.09
100.0% 0.1%
PEMEX 203.80 203.80
100.0% 1.3%
Subtotal Seguridad Social 1,150.96 3,250.13 825.64 17.14 5,243.87
21.9% 62.0% 15.7% 0.3% 34.3%
SSA 978.66 54.21 22.49 1,055.36
92.7% 5.1% 2.1% 6.9%
IMSS Solidaridad 202.46 0.48 202.94
99.8% 0.2% 1.3%
DIF 21.26 20.30 41.56
51.2% 48.8% 0.3%
DDF 85.05 85.05
100.0% 0.6%
INI 1.90 1.90
100.0% 0.0%
Subtotal Servicios Públicos 0.00 0.00 1,289.33 74.99 22.49 1,386.81
93.0% 5.4% 1.6% 9.1%
Privado Virtual 8,402.31 45.44 8,447.74
99.5% 0.5% 55.2%
Seguro Médico Privado 185.10 30.13 215.23
86.0% 14.0% 1.4%
Subtotal Servicios Privados 8,587.41 75.57 0.00 0.00 0.00 0.00 8,662.98
99.1% 0.9% 56.6%
TOTAL 9,738.37 3,325.70 2,114.97 92.12 0.00 22.49 15,293.65
63.7% 21.7% 13.8% 0.6% 0.1% 100.0%

MATRIZ 2: GASTO EN SALUD QUE ASIGNAN LOS AGENTES A LAS INSTITUCIONES PRESTADORAS DE SERVICIOS
(M ILLONES DE PESOS) Instituciones prestadoras IMSS ISSSTE SEDENA MARINA PEMEX SSA IMSS Sol. DIF DDF INI Privado Farmacias Privado
Agentes Lucrativo no lucrativo TOTAL
IMSS 28,670 1,000 29,669 96.6% 3.4% 29.4% ISSSTE 33 3,105 8 62 3,208 1.0% 96.8% 0.3% 1.9% 3.2% SEDENA 307 307 100% 0.3% MARINA 80 80 100% 0.1% PEMEX 1,345 1,345
100% 1.33% Subtotal Seguridad Social 28,703 3,105 307 80 1,345 8 1,061 34,610
82.9% 9.0% 0.9% 0.2% 3.9% 0.02% 3.1% 34.3% SSA 6,965 6,965 6.9% IMSS Solidaridad 1,339 1,339 100% 1.3% DIF 274 274 100% 0.3% DDF 561 561 100% 0.6% INI 13 13 100% 0.01%
Subtotal Servicios Públicos 6,965 1,339 274 561 13 9,153 76.1% 14.6% 3.0% 6.1% 0.14% 9.1% Privado Virtual 0.03 349 38,649 16,560 198 55,755 0.6% 69% 30% 0.4% 55.2% Seguro Médico Privado 1,421 1,421
100% 1.4% Subtotal Servicios Privados 0.03 349 40,069 16,560 198 57,176
0.6% 70.1% 29.0% 0.3% 56.6%
TOTAL 28,703 3,105 307 80 1,345 7,322 1,339 274 561 13 41,131 16,560 198 100,938 28.4% 3.1% 0.3% 0.1% 1.3% 7.3% 1.3% 0.3% 0.6% 0.01% 40.7% 16.4% 0.2% 100%

Annex F. Mexico
(M ILLONES DE DÓLARES) Instituciones prestadoras IMSS ISSSTE SEDENA MARINA PEMEX SSA IMSS
Sol. DIF DDF INI Privado Farmacia
s Privado
Agentes Lucrativo no lucrativo TOTAL
IMSS 4,343.89 151.45 4,495.34
96.6% 3.4% 4.5%
ISSSTE 5.00 470.46 1.25 9.38 486.09
1.0% 96.8% 0.3% 1.9% 0.5%
SEDENA 46.54 46.54
100% 0.0%
MARINA 12.09 12.09
100% 0.0%
PEMEX 203.80 203.80
100% 0.20%
Subtotal Seguridad Social 4,348.89 470.46 46.54 12.09 203.80 1.25 160.83 5,243.87
82.9% 9.0% 0.9% 0.2% 3.9% 0.02% 3.1% 5.2%
SSA 1,055.36
1.0%
IMSS Solidaridad 202.94 202.94
100% 0.2%
DIF 41.56 41.56
100% 0.0%
DDF 85.05 85.05
100% 0.1%
INI 1.90 1.90
100% 0.00%
Subtotal Servicios Públicos 1,055.36 202.94 41.56 85.05 1.90 1,386.81
76.1% 14.6% 3.0% 6.1% 0.14% 1.4%
Privado Virtual 0.00 52.85 5,855.86 2,509.03 29.99 8,447.74
0.00% 0.6% 69% 30% 0.4% 8.4%
Seguro Médico Privado 215.23 215.23
100% 0.2%
Subtotal Servicios Privados 0.00 52.85 6,071.09 2,509.03 29.99 8,662.98
0.00% 0.6% 70.1% 29.0% 0.3% 8.6%
TOTAL 4,348.89 470.46 46.55 12.09 203.80 1,109.47 202.94 41.56 85.05 1.90 6,231.92 2,509.03 29.99 15,293.65
28.4% 3.1% 0.3% 0.1% 1.3% 7.3% 1.3% 0.3% 0.6% 0.01% 40.7% 16.4% 0.2% 15%
Fuente: Fundación Mexicana para la Salud. Cuentas Nacionales de Salud, 1995.
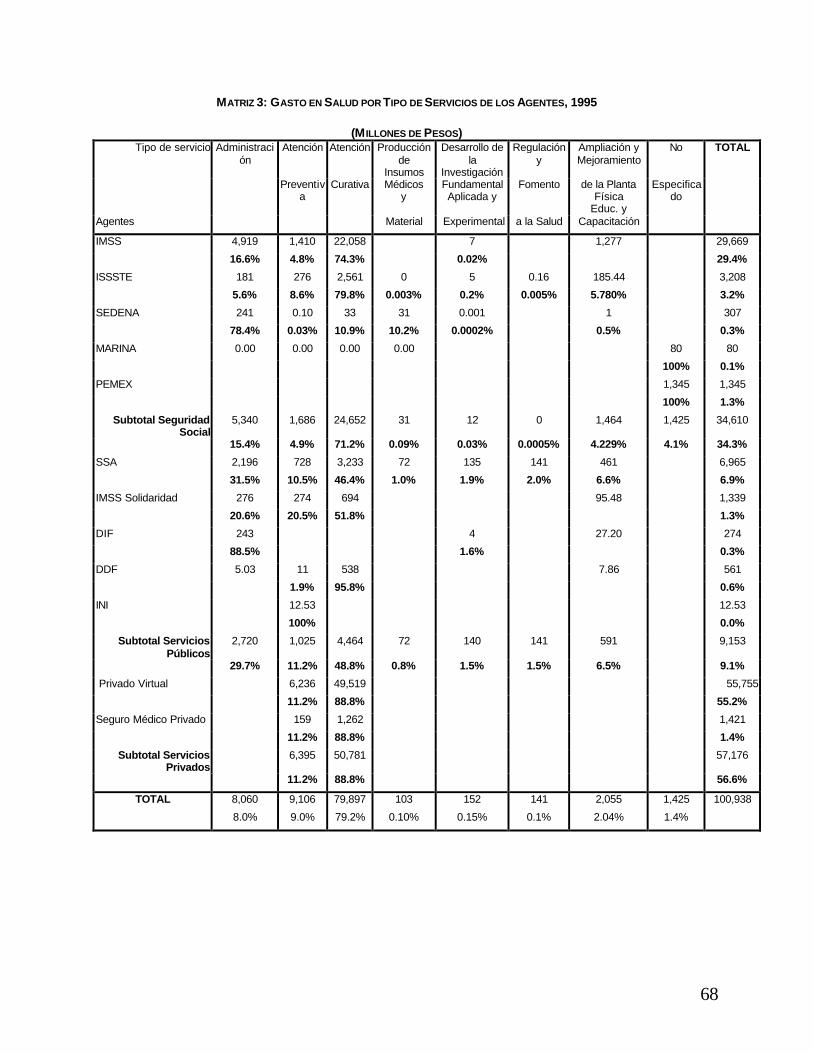
68
MATRIZ 3: GASTO EN SALUD POR TIPO DE SERVICIOS DE LOS AGENTES, 1995
(M ILLONES DE PESOS) Tipo de servicio Administraci
ón Atención Atención Producción
de Insumos
Desarrollo de la
Investigación
Regulación y
Ampliación y Mejoramiento
No TOTAL
Preventiva
Curativa Médicos y
Fundamental Aplicada y
Fomento de la Planta Física
Educ. y
Especificado
Agentes Material Experimental a la Salud Capacitación
IMSS 4,919 1,410 22,058 7 1,277 29,669
16.6% 4.8% 74.3% 0.02% 29.4%
ISSSTE 181 276 2,561 0 5 0.16 185.44 3,208
5.6% 8.6% 79.8% 0.003% 0.2% 0.005% 5.780% 3.2%
SEDENA 241 0.10 33 31 0.001 1 307
78.4% 0.03% 10.9% 10.2% 0.0002% 0.5% 0.3%
MARINA 0.00 0.00 0.00 0.00 80 80
100% 0.1%
PEMEX 1,345 1,345
100% 1.3%
Subtotal Seguridad Social
5,340 1,686 24,652 31 12 0 1,464 1,425 34,610
15.4% 4.9% 71.2% 0.09% 0.03% 0.0005% 4.229% 4.1% 34.3%
SSA 2,196 728 3,233 72 135 141 461 6,965
31.5% 10.5% 46.4% 1.0% 1.9% 2.0% 6.6% 6.9%
IMSS Solidaridad 276 274 694 95.48 1,339
20.6% 20.5% 51.8% 1.3%
DIF 243 4 27.20 274
88.5% 1.6% 0.3%
DDF 5.03 11 538 7.86 561
1.9% 95.8% 0.6%
INI 12.53 12.53
100% 0.0%
Subtotal Servicios Públicos
2,720 1,025 4,464 72 140 141 591 9,153
29.7% 11.2% 48.8% 0.8% 1.5% 1.5% 6.5% 9.1%
Privado Virtual 6,236 49,519 55,755
11.2% 88.8% 55.2%
Seguro Médico Privado 159 1,262 1,421
11.2% 88.8% 1.4%
Subtotal Servicios Privados
6,395 50,781 57,176
11.2% 88.8% 56.6%
TOTAL 8,060 9,106 79,897 103 152 141 2,055 1,425 100,938
8.0% 9.0% 79.2% 0.10% 0.15% 0.1% 2.04% 1.4%
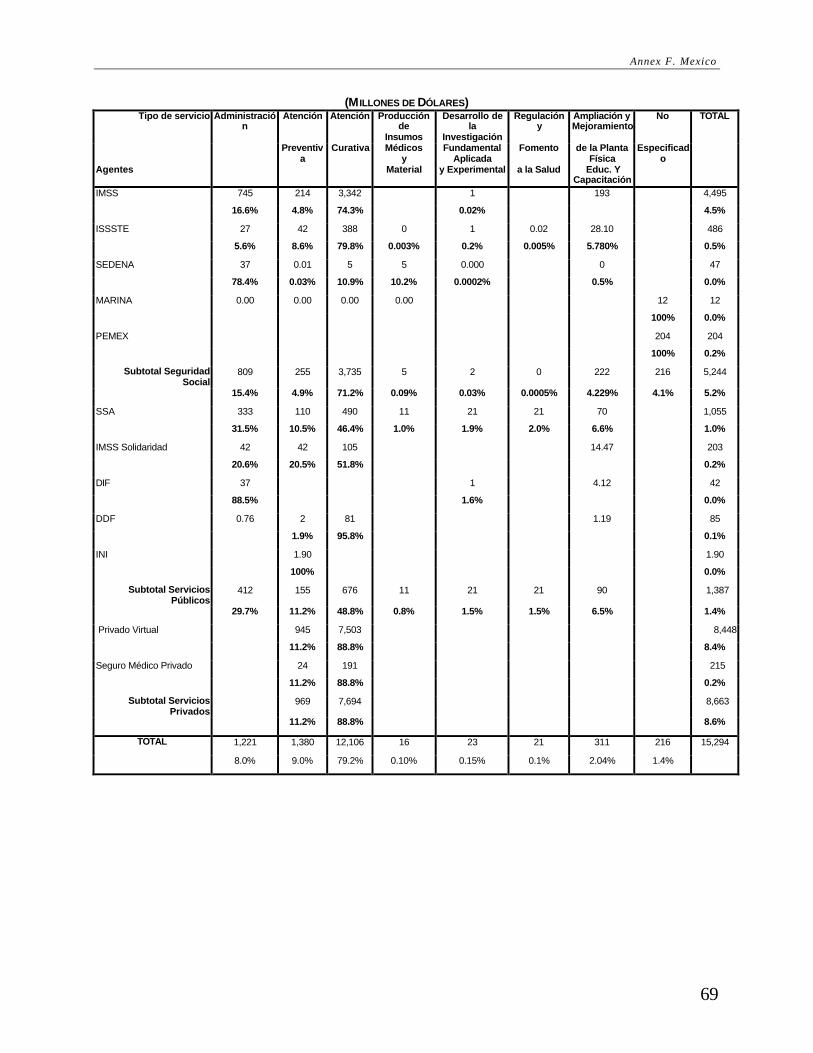
Annex F. Mexico
69
(M ILLONES DE DÓLARES) Tipo de servicio Administració
n Atención Atención Producción
de Insumos
Desarrollo de la
Investigación
Regulación y
Ampliación y Mejoramiento
No TOTAL
Preventiva
Curativa Médicos y
Fundamental Aplicada
Fomento de la Planta Física
Especificado
Agentes Material y Experimental a la Salud Educ. Y Capacitación
IMSS 745 214 3,342 1 193 4,495
16.6% 4.8% 74.3% 0.02% 4.5%
ISSSTE 27 42 388 0 1 0.02 28.10 486
5.6% 8.6% 79.8% 0.003% 0.2% 0.005% 5.780% 0.5%
SEDENA 37 0.01 5 5 0.000 0 47
78.4% 0.03% 10.9% 10.2% 0.0002% 0.5% 0.0%
MARINA 0.00 0.00 0.00 0.00 12 12
100% 0.0%
PEMEX 204 204
100% 0.2%
Subtotal Seguridad Social
809 255 3,735 5 2 0 222 216 5,244
15.4% 4.9% 71.2% 0.09% 0.03% 0.0005% 4.229% 4.1% 5.2%
SSA 333 110 490 11 21 21 70 1,055
31.5% 10.5% 46.4% 1.0% 1.9% 2.0% 6.6% 1.0%
IMSS Solidaridad 42 42 105 14.47 203
20.6% 20.5% 51.8% 0.2%
DIF 37 1 4.12 42
88.5% 1.6% 0.0%
DDF 0.76 2 81 1.19 85
1.9% 95.8% 0.1%
INI 1.90 1.90
100% 0.0%
Subtotal Servicios Públicos
412 155 676 11 21 21 90 1,387
29.7% 11.2% 48.8% 0.8% 1.5% 1.5% 6.5% 1.4%
Privado Virtual 945 7,503 8,448
11.2% 88.8% 8.4%
Seguro Médico Privado 24 191 215
11.2% 88.8% 0.2%
Subtotal Servicios Privados
969 7,694 8,663
11.2% 88.8% 8.6%
TOTAL 1,221 1,380 12,106 16 23 21 311 216 15,294
8.0% 9.0% 79.2% 0.10% 0.15% 0.1% 2.04% 1.4%
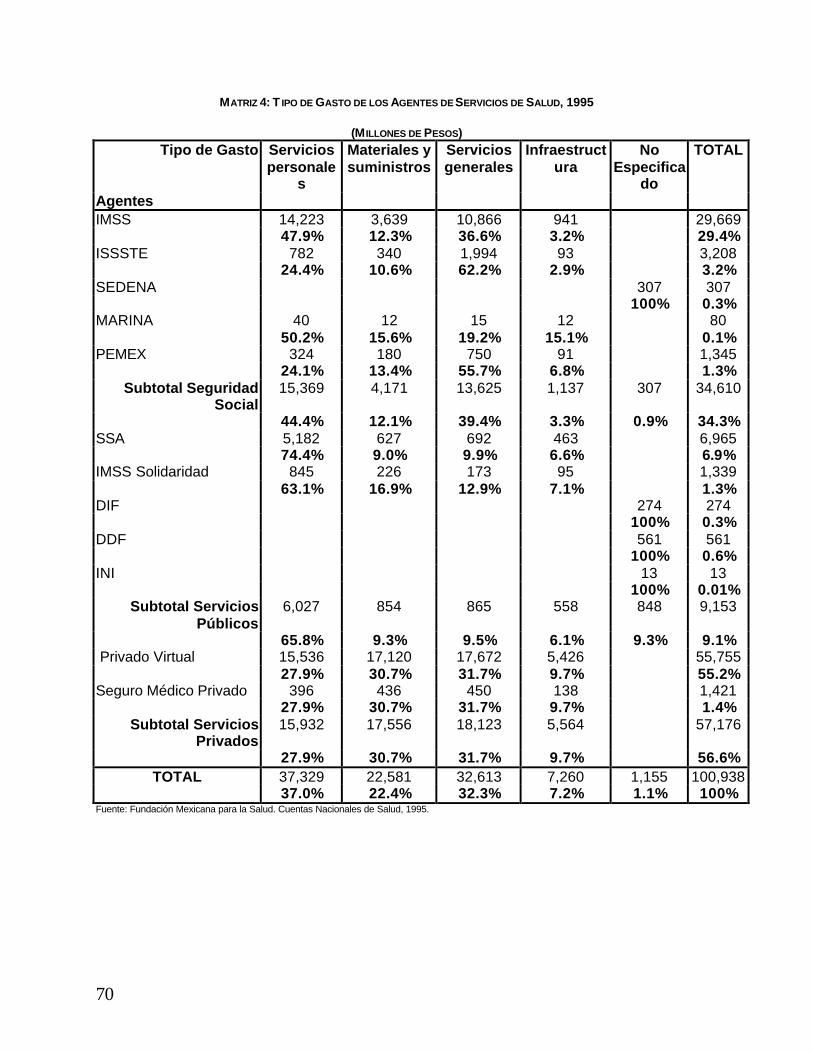
70
MATRIZ 4: T IPO DE GASTO DE LOS AGENTES DE SERVICIOS DE SALUD, 1995
(M ILLONES DE PESOS) Tipo de Gasto Servicios
personales
Materiales y suministros
Servicios generales
Infraestructura
No Especifica
do
TOTAL
Agentes IMSS 14,223 3,639 10,866 941 29,669 47.9% 12.3% 36.6% 3.2% 29.4% ISSSTE 782 340 1,994 93 3,208 24.4% 10.6% 62.2% 2.9% 3.2% SEDENA 307 307 100% 0.3% MARINA 40 12 15 12 80 50.2% 15.6% 19.2% 15.1% 0.1% PEMEX 324 180 750 91 1,345 24.1% 13.4% 55.7% 6.8% 1.3%
Subtotal Seguridad Social
15,369 4,171 13,625 1,137 307 34,610
44.4% 12.1% 39.4% 3.3% 0.9% 34.3% SSA 5,182 627 692 463 6,965 74.4% 9.0% 9.9% 6.6% 6.9% IMSS Solidaridad 845 226 173 95 1,339 63.1% 16.9% 12.9% 7.1% 1.3% DIF 274 274 100% 0.3% DDF 561 561 100% 0.6% INI 13 13
100% 0.01% Subtotal Servicios
Públicos 6,027 854 865 558 848 9,153
65.8% 9.3% 9.5% 6.1% 9.3% 9.1% Privado Virtual 15,536 17,120 17,672 5,426 55,755 27.9% 30.7% 31.7% 9.7% 55.2% Seguro Médico Privado 396 436 450 138 1,421
27.9% 30.7% 31.7% 9.7% 1.4% Subtotal Servicios
Privados 15,932 17,556 18,123 5,564 57,176
27.9% 30.7% 31.7% 9.7% 56.6% TOTAL 37,329 22,581 32,613 7,260 1,155 100,938
37.0% 22.4% 32.3% 7.2% 1.1% 100% Fuente: Fundación Mexicana para la Salud. Cuentas Nacionales de Salud, 1995.

Annex F. Mexico
71
(M ILLONES DE DÓLARES) Tipo de Gasto Servicios
personales Materiales y suministros
Servicios generales
Infraestructura No Especificado
TOTAL
Agentes IMSS 2,155.05 551.36 1,646.34 142.59 4,495.34 47.9% 12.3% 36.6% 3.2% 29.4% ISSSTE 118.42 51.50 302.11 14.06 486.09 24.4% 10.6% 62.2% 2.9% 3.2% SEDENA 46.54 47 100% 0.3% MARINA 6.06 1.89 2.32 1.82 12.09 50.2% 15.6% 19.2% 15.1% 0.1% PEMEX 49.13 27.25 113.58 13.84 203.80 24.1% 13.4% 55.7% 6.8% 1.3%
Subtotal Seguridad Social
2,328.67 632.00 2,064.34 172.31 46.54 5,243.87
44.4% 12.1% 39.4% 3.3% 0.9% 34.3% SSA 785.22 95.05 104.92 70.17 1,055.36 74.4% 9.0% 9.9% 6.6% 6.9% IMSS Solidaridad 127.99 34.31 26.21 14.44 202.94 63.1% 16.9% 12.9% 7.1% 1.3% DIF 41.56 41.56 100% 0.3% DDF 85.05 85.05 100% 0.6% INI 1.90 1.90
100% 0.0% Subtotal Servicios
Públicos 913.21 129.37 131.12 84.61 128.50 1,386.81
65.8% 9.3% 9.5% 6.1% 9.3% 9.1% Privado Virtual 2,354.01 2,593.98 2,677.62 822.13 8,447.74 27.9% 30.7% 31.7% 9.7% 55.2% Seguro Médico Privado 59.98 66.09 68.22 20.95 215.23
27.9% 30.7% 31.7% 9.7% 1.4% Subtotal Servicios
Privados 2,413.99 2,660.07 2,745.85 843.08 8,662.98
27.9% 30.7% 31.7% 9.7% 56.6% TOTAL 5,655.87 3,421.44 4,941.31 1,099.99 175.04 15,293.65
37.0% 22.4% 32.3% 7.2% 1.1% 100.0% Fuente: Fundación Mexicana para la Salud. Cuentas Nacionales de Salud, 1995.


73
ANNEX G. NICARAGUA
Matriz 1: Fuentes de Financiamento a Fondos
Matriz 2: Fondos/Instituciones de Salud a Prestadores de Servicios de Salud
Matriz 3: Fondos/Institutciones a Tipo de Servicio/Programa
Matriz 4: Fondos/Instituciones a Función/Objecto de Gasto
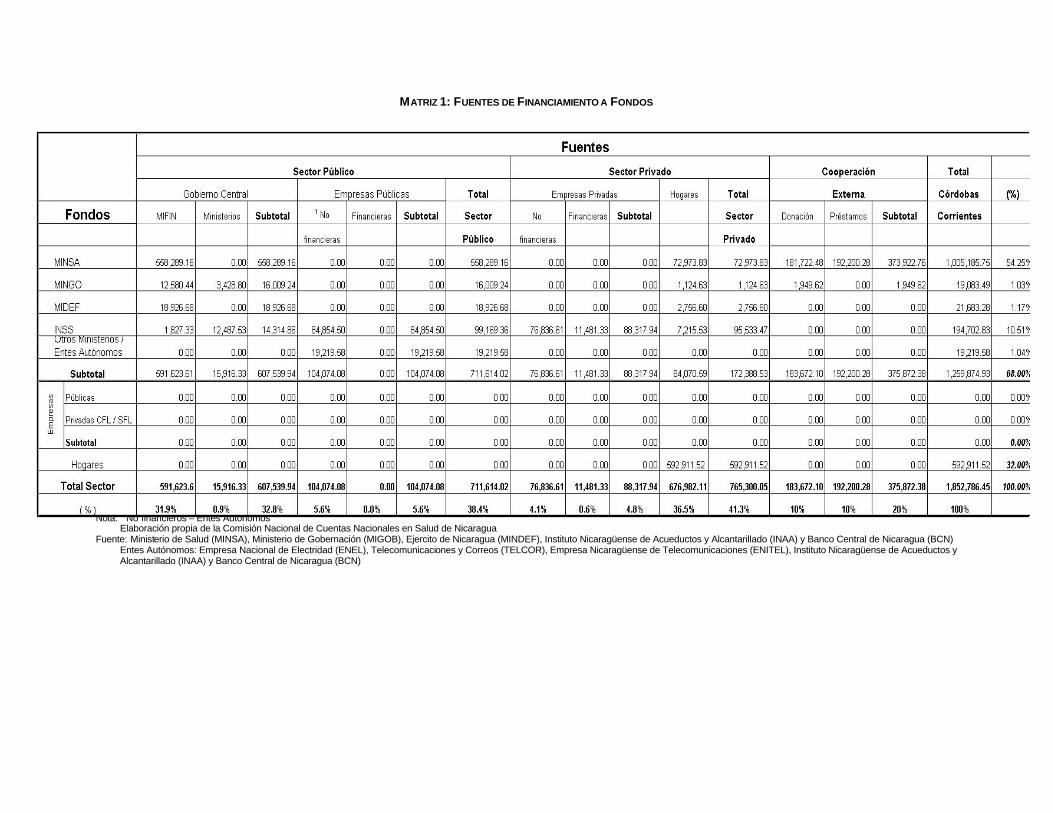
MATRIZ 1: FUENTES DE FINANCIAMIENTO A FONDOS
Nota: 1 No financieros – Entes Autónomos
Elaboración propia de la Comisión Nacional de Cuentas Nacionales en Salud de Nicaragua Fuente: Ministerio de Salud (MINSA), Ministerio de Gobernación (MIGOB), Ejercito de Nicaragua (MINDEF), Instituto Nicaragüense de Acueductos y Alcantarillado (INAA) y Banco Central de Nicaragua (BCN)
Entes Autónomos: Empresa Nacional de Electridad (ENEL), Telecomunicaciones y Correos (TELCOR), Empresa Nicaragüense de Telecomunicaciones (ENITEL), Instituto Nicaragüense de Acueductos y Alcantarillado (INAA) y Banco Central de Nicaragua (BCN)
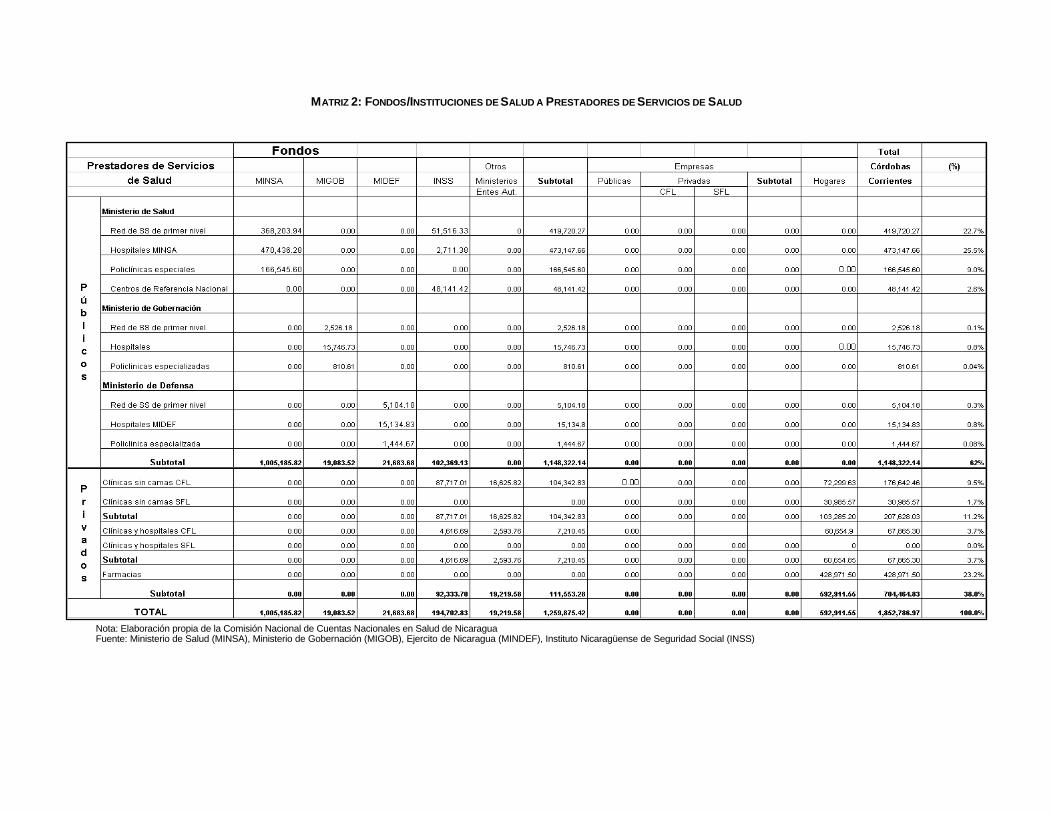
MATRIZ 2: FONDOS/INSTITUCIONES DE SALUD A PRESTADORES DE SERVICIOS DE SALUD
Nota: Elaboración propia de la Comisión Nacional de Cuentas Nacionales en Salud de Nicaragua Fuente: Ministerio de Salud (MINSA), Ministerio de Gobernación (MIGOB), Ejercito de Nicaragua (MINDEF), Instituto Nicaragüense de Seguridad Social (INSS)

MATRIZ 3: FONDOS/INSTITUCIONES A T IPO DE SERVICIO/PROGRAMA
Nota: Elaboración propia de la Comisión Nacional de Cuentas Nacionales en Salud de Nicaragua Fuente: Ministerio de Salud (MINSA), Ministerio de Gobernación (MIGOB), Ejercito de Nicaragua (MINDEF), Instituto Nicaragüense de Seguridad Social (INSS)
Entes Autónomos: Empresa Nacional de Electridad (ENEL), Telecomunicaciones y Correos (TELCOR), Empresa Nicaragüense de Telecomunicaciones (ENTEL), Instituto Nicaragüense de Acueductos y Alcantarillado (INAA) y Banco Central de Nicaragua (BCN)
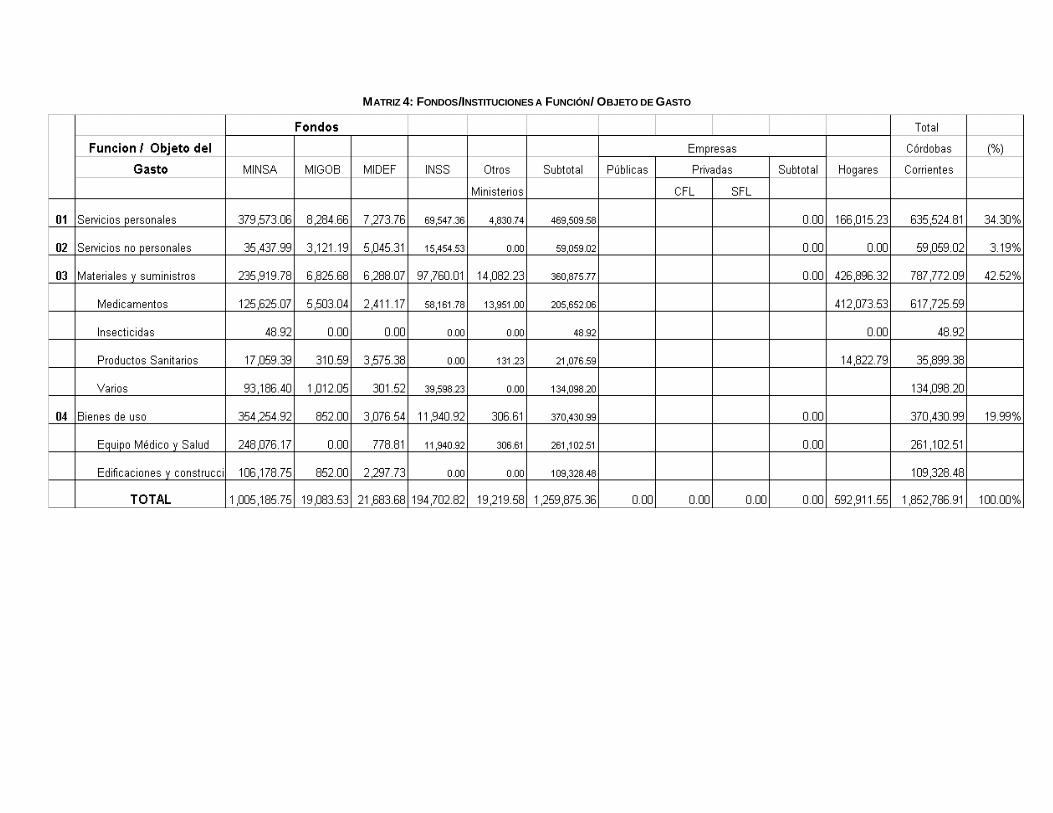
MATRIZ 4: FONDOS/INSTITUCIONES A FUNCIÓN/ OBJETO DE GASTO

79
ANNEX H. PERU
Matriz 1: Fuentes de Financiamento a Fondos
Matriz 2: Agentes Financieros a Proveedores 1996
Matriz 3: Agentes Financieros a Funciones 1996
Matriz 4: Agentes Financieros a Tipos de Gasto 1996

Health Care Financing in Eight Latin American and Caribbean Nations: The first Regional NHA Network
80
MATRIZ 1: FUENTES A AGENTES FINANCIEROS 1996
(EN NUEVO SOLES)
Cooperación Extranjera
Empresas Privadas
Hogares Ministerio de Finanzas
Total
Empresas Privadas 136003 2022948 2158951 Gobiernos Regionales 5397 57894 533104 596395 Instituciones Públicas Descentralizadas
825 3635 83039 87499
Ministerio de Salud 31083 33079 115107 924090 1103359 Organizaciones No Gubernamentales de Servicio de Salud
18469 35945 54414
Otras Instituciones Públicas 6370 1142139 1148509 Seguro Privado 148217 73102 221319 Seguro Social 1722090 28708 1750798 TOTAL 49552 2081556 2307764 2682372 7121244
MATRIZ 2: AGENTES FINANCIEROS A PROVEEDORES 1996
Empresas Privadas
Gobiernos Regionales
Instituciones Públicas
Descentralizadas
Ministerio de Salud NGOs
Otras Instituciones Públicas
Seguro Privado
Seguro Social TOTAL
Clínicas Privados con Fines de Lucro
454937 94197 59625 608759
Clínicas Privados sin Fines de Lucro
47877 47877
Empresas Autoproductoras de Salud
50286 50286
Farmacias 1653728 6537 62798 1723063Hospitales del Seguro Social 1541093 1541093Hospitales Estatales 563822 19500 1084622 386373 2054317Seguro Privado 64324 64324 Servicios Públicos Diversos 32575 67998 18737 762135 150080 1031525TOTAL 2158951 596397 87498 1103359 54414 1148508 221319 1750798 7121244
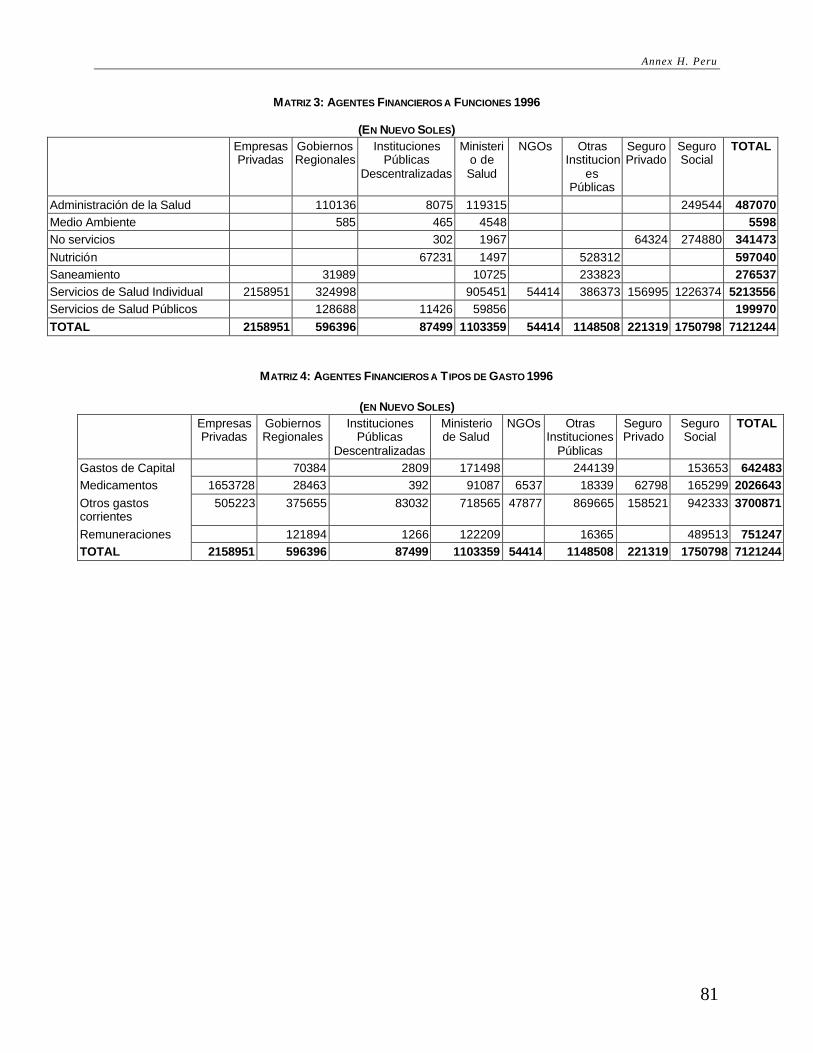
Annex H. Peru
81
MATRIZ 3: AGENTES FINANCIEROS A FUNCIONES 1996
(EN NUEVO SOLES) Empresas
Privadas Gobiernos Regionales
Instituciones Públicas
Descentralizadas
Ministerio de Salud
NGOs Otras Institucion
es Públicas
Seguro Privado
Seguro Social
TOTAL
Administración de la Salud 110136 8075 119315 249544 487070 Medio Ambiente 585 465 4548 5598 No servicios 302 1967 64324 274880 341473 Nutrición 67231 1497 528312 597040 Saneamiento 31989 10725 233823 276537 Servicios de Salud Individual 2158951 324998 905451 54414 386373 156995 1226374 5213556 Servicios de Salud Públicos 128688 11426 59856 199970 TOTAL 2158951 596396 87499 1103359 54414 1148508 221319 1750798 7121244
MATRIZ 4: AGENTES FINANCIEROS A T IPOS DE GASTO 1996
(EN NUEVO SOLES) Empresas
Privadas Gobiernos Regionales
Instituciones Públicas
Descentralizadas
Ministerio de Salud
NGOs Otras Instituciones
Públicas
Seguro Privado
Seguro Social
TOTAL
Gastos de Capital 70384 2809 171498 244139 153653 642483 Medicamentos 1653728 28463 392 91087 6537 18339 62798 165299 2026643 Otros gastos corrientes
505223 375655 83032 718565 47877 869665 158521 942333 3700871
Remuneraciones 121894 1266 122209 16365 489513 751247 TOTAL 2158951 596396 87499 1103359 54414 1148508 221319 1750798 7121244

83
ANNEX I. BIBLIOGRAPHY
Abel-Smith, B. 1963. Paying for health services: A study of the costs and sources of finance in six countries. WHO Public Health Paper #17. Washington, DC: World Health Organization.
Berman P. 1997. “National Health Accounts in Developing Countries: Appropriate Methods and Recent Applications.” Health Economics 6:11-30.
Berman P. 1999. “What Can the U.S. Learn from National Health Accounting Efforts Elsewhere?” Health Care Financing Review. In press.
CEPAR-USAID. 1998. Cuentas nacionales de gastos en salud: Ecuador 1995, informe final. Ecuador: Proyecto Análisis y Promoción de Politicas de Salud.
Fundación Mexicana para la Salud. 1998. Cuentas nacionales de salud.
Govindaraj R, et al. 1997. “Health Expenditures in Latin America and the Caribbean.” Social Science and Medicine 44:157-169.
Griffin, C.C. 1992. Health Care in Asia: A Comparative Study of Cost and Financing. World Bank Regional and Sectoral Studies. Washington, DC: The World Bank.
Hatton, M. 1996. El Financiamento Público al Sistema de Salud en la República Dominicana. Draft. Centro de Investigación Económica para el Caribe (CIECA).
Hurst, J. 1992. The Reform of Health Care: A Comparative Analysis of Seven OECD Countries. Paris: Organisation for Economic Cooperation and Development.
IADB Department of Statistics. 1998. http://www.iadb.org/int/sta/English/StaWeb/.
International Monetary Fund. 1986. A Manual on Government Finance Statistics. Washington, DC: International Monetary Fund.
McGreevey W. 1990. Social Security in Latin America: Issues and Options for the World Bank. World Bank Discussion Papers. Washington, DC: The World Bank.
Ministerio de Salud y Previsión Social. 1998. Estudio sobre cuentas nacionales de financiamiento y gasto en salud. Bolivia: Unidad de Reforma de Salud.
Murray CJL, Govindaraj R, and Musgrove P. 1994. “National Health Expenditures: A Global Analysis.” In Murray, C.J.L. and Lopez, A.D. (eds.) Global Comparative Assessments in the Health Sector: Disease Burden, Expenditures, and Intervention Packages. Geneva: World Health Organization.
Organization for European Cooperation and Development. 1998. OECD Health Data 98. Software.
Pan American Health Organization. 1994. Health Conditions in the Americas, Volume I. Washington, DC: Pan American Health Organization, World Health Organization.

Health Care Financing in Eight Latin American and Caribbean Nations: The first Regional NHA Network
84
Pan American Health Organization. 1998. Preliminary Estimates on Health Expenditures in Latin America and the Caribbean. Washington, DC: PAHO, Public Policy and Health Program, Division of Health and Human Development for Health in the Americas 1998.
República de Guatemala Ministerio de Salud Pública y Asistencia Social. 1997. Informe final: Cuentas nacionales de salud, 1995-1997. Guatemala: Unidad Sectorial de Planificación de la Salud.
Suares R, Henderson P, Barillas E, and Vieira C. 1995. National Health Expenditure and Financing in Latin America and the Caribbean: Challenges for the 1990s. PAHO Health Development Series No. 3. Washington, DC: Pan American Health Organization, WHO.
Vogel RJ. 1993. Financing Health Care in sub-Saharan Africa. Westport, CT: Greenwood Press.
World Bank. 1993. Investing in Health. World Development Report. Washington, DC: The World Bank.
World Bank. 1997. World Development Report 1997. Washington, DC.
Zschock, 1986. “Medical Care Under Social Insurance in Latin America.” Latin American Research Review 21(1):99-122.

85
To obtain additional information or to order any of our publications please contact: Partnerships for Health Reform (PHR)
Abt Associates Inc. 4800 Montgomery Lane, Suite 600
Bethesda, MD 20814 USA Fax (301) 652-3916, E-mail: [email protected]
Visit our website: www.phrproject.com
PUBLICATIONS OF THE REGIONAL INITIATIVE OF HEALTH SECTOR REFORM FOR LATIN AMERICA AND THE CARIBBEAN
1. Methodology for Monitoring and Evaluation of Health Sector Reform in Latin America and the Caribbean (English/Spanish)
2. Base Line for Monitoring and Evaluation of Health Sector Reform in Latin America and the Caribbean (English/Spanish)
3. Análisis del Sector Salud en Paraguay (Preliminary Version)
4. Clearinghouse on Health Sector Reform
5. Final Report – Regional Forum on Provider Payment Mechanisms (Lima, Peru, 16-17 November, 1998) (English/Spanish)
6. Indicadores de Medición de la Reforma del Sector Salud en cuanto al Desempeño del Sistema
7. Mecanismos de Pago a Prestadores en el Sistema de Salud: Incentivos, Resultados e Impacto Organizacional en Países en Desarrollo
8. Cuentas Nacionales de Salud: Bolivia
9. Cuentas Nacionales de Salud: Ecuador
10. Cuentas Nacionales de Salud: Guatemala
11. Cuentas Nacionales de Salud: Mexico
12. Cuentas Nacionales de Salud: Perú
13. Cuentas Nacionales de Salud: República Dominicana (Preliminary Version)
14. Cuentas Nacionales de Salud: Nicaragua
15. Cuentas Nacionales de Salud: El Salvador (Preliminary Version)
16. Health Care Financing in Eight Latin American and Caribbean Nations: The First Regional National Health Accounts network
Special Edition
1. Cuentas Nacionales de Salud: Resúmenes de Ocho Estudios Nacionales en América Latina y el Caribe