haze measurement techniqueshaze • haze is defined as an aggravated form of fog in a polished...
TRANSCRIPT

FY07 New Start Program Execution Strategy
DISTRIBUTION STATEMENT D. Distribution authorized to the Department of Defense and U.S. DoD contractors strictly associated with TARDEC for the purpose of providing support for TARDEC's Survivability External Review. (30 August 2007) For Official Use Only (FOUO) caveat assigned so as not to place U.S. personnel at risk or compromise security procedures. Destroy by shredding or tearing to make unreadable upon completion of this review process. Other requests for this document shall be referred to the TARDEC Strategic Plans & Programs Office, ATTN: AMSRD-TAR -IP/ MS #205, 6501 East 11 Mile Road, Warren, MI 48397-5000.
Haze measurement techniquesPOC: Elena Bankowski

Report Documentation Page Form ApprovedOMB No. 0704-0188
Public reporting burden for the collection of information is estimated to average 1 hour per response, including the time for reviewing instructions, searching existing data sources, gathering andmaintaining the data needed, and completing and reviewing the collection of information. Send comments regarding this burden estimate or any other aspect of this collection of information,including suggestions for reducing this burden, to Washington Headquarters Services, Directorate for Information Operations and Reports, 1215 Jefferson Davis Highway, Suite 1204, ArlingtonVA 22202-4302. Respondents should be aware that notwithstanding any other provision of law, no person shall be subject to a penalty for failing to comply with a collection of information if itdoes not display a currently valid OMB control number.
1. REPORT DATE 20 OCT 2009
2. REPORT TYPE N/A
3. DATES COVERED -
4. TITLE AND SUBTITLE Haze measurement techniques
5a. CONTRACT NUMBER
5b. GRANT NUMBER
5c. PROGRAM ELEMENT NUMBER
6. AUTHOR(S) Elena Bankowski
5d. PROJECT NUMBER
5e. TASK NUMBER
5f. WORK UNIT NUMBER
7. PERFORMING ORGANIZATION NAME(S) AND ADDRESS(ES) US Army RDECOM-TARDEC 6501 E 11 Mile Rd Warren, MI48397-5000, USA
8. PERFORMING ORGANIZATION REPORT NUMBER 20274RC
9. SPONSORING/MONITORING AGENCY NAME(S) AND ADDRESS(ES) US Army RDECOM-TARDEC 6501 E 11 Mile Rd Warren, MI48397-5000, USA
10. SPONSOR/MONITOR’S ACRONYM(S) TACOM/TARDEC
11. SPONSOR/MONITOR’S REPORT NUMBER(S) 20274RC
12. DISTRIBUTION/AVAILABILITY STATEMENT Approved for public release, distribution unlimited
13. SUPPLEMENTARY NOTES The original document contains color images.
14. ABSTRACT
15. SUBJECT TERMS
16. SECURITY CLASSIFICATION OF: 17. LIMITATIONOF ABSTRACT
SAR
18. NUMBEROF PAGES
27
19a. NAME OFRESPONSIBLE PERSON
a. REPORT unclassified
b. ABSTRACT unclassified
c. THIS PAGE unclassified
Standard Form 298 (Rev. 8-98) Prescribed by ANSI Std Z39-18
HAZE
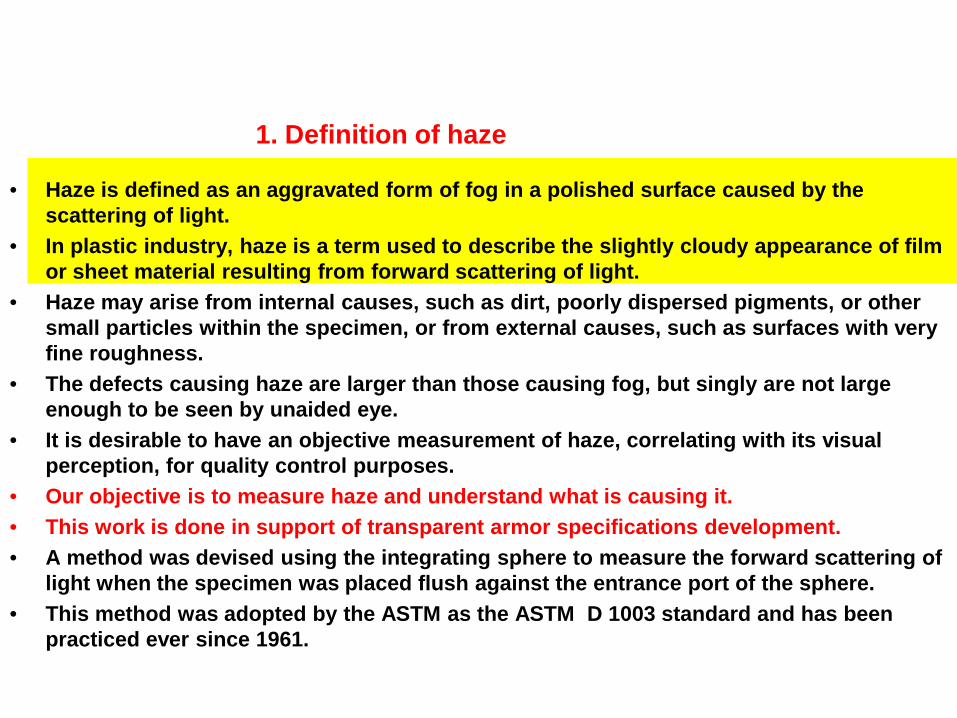
• Haze is defined as an aggravated form of fog in a polished surface caused by the scattering of light.
• In plastic industry, haze is a term used to describe the slightly cloudy appearance of film or sheet material resulting from forward scattering of light.
• Haze may arise from internal causes, such as dirt, poorly dispersed pigments, or other small particles within the specimen, or from external causes, such as surfaces with very fine roughness.
• The defects causing haze are larger than those causing fog, but singly are not large enough to be seen by unaided eye.
• It is desirable to have an objective measurement of haze, correlating with its visual perception, for quality control purposes.
• Our objective is to measure haze and understand what is causing it.• This work is done in support of transparent armor specifications development.• A method was devised using the integrating sphere to measure the forward scattering of
light when the specimen was placed flush against the entrance port of the sphere.• This method was adopted by the ASTM as the ASTM D 1003 standard and has been
practiced ever since 1961.
1. Definition of haze
00.10.20.30.40.50.60.70.80.9
1
300 500 700 900
Rel
ativ
e en
ergy
Wavelength (nm)
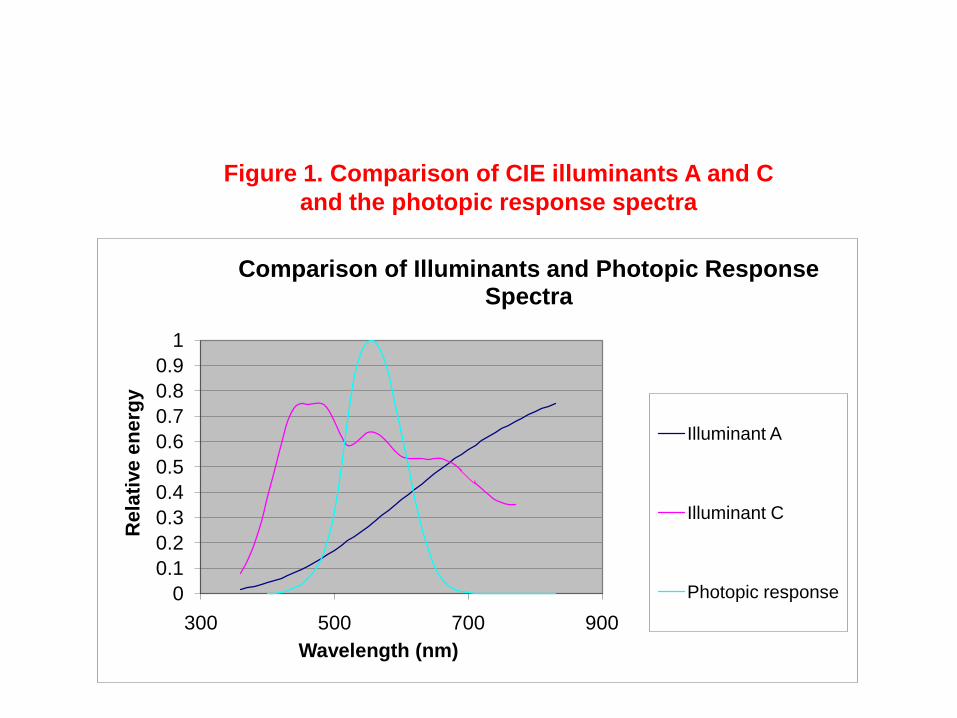
Comparison of Illuminants and Photopic Response Spectra
Illuminant A
Illuminant C
Photopic response
Figure 1. Comparison of CIE illuminants A and C and the photopic response spectra
HAZE
00.10.20.30.40.50.60.7
400 600
Rel
ativ
e en
ergy
Wavelength (nm)
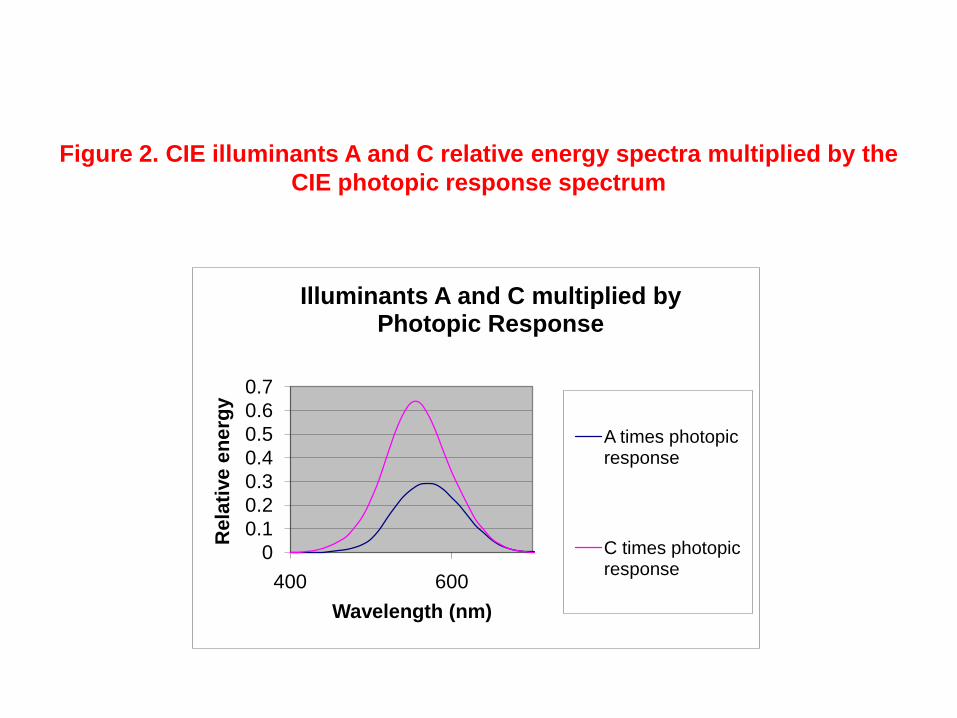
Illuminants A and C multiplied by Photopic Response
A times photopic response
C times photopic response
Figure 2. CIE illuminants A and C relative energy spectra multiplied by the CIE photopic response spectrum
HAZE
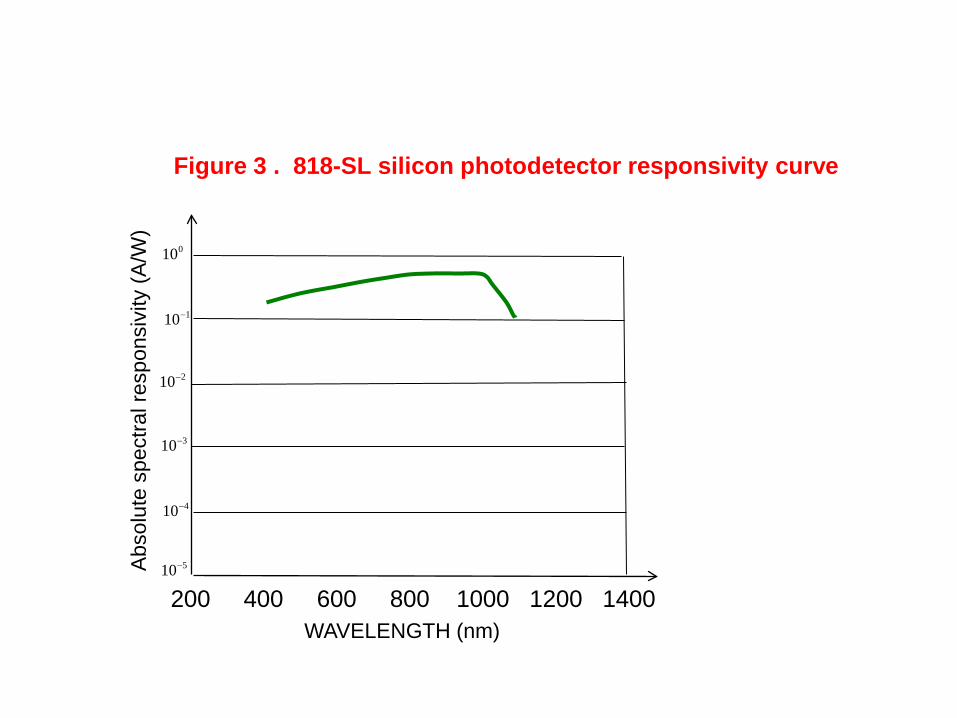
Figure 3 . 818-SL silicon photodetector responsivity curve
HAZE
Abs
olut
e sp
ectra
l res
pons
ivity
(A/W
)
200 400 600 800 1000 1200 1400
010
110−
210−
310−
410−
510−
WAVELENGTH (nm)
Haze
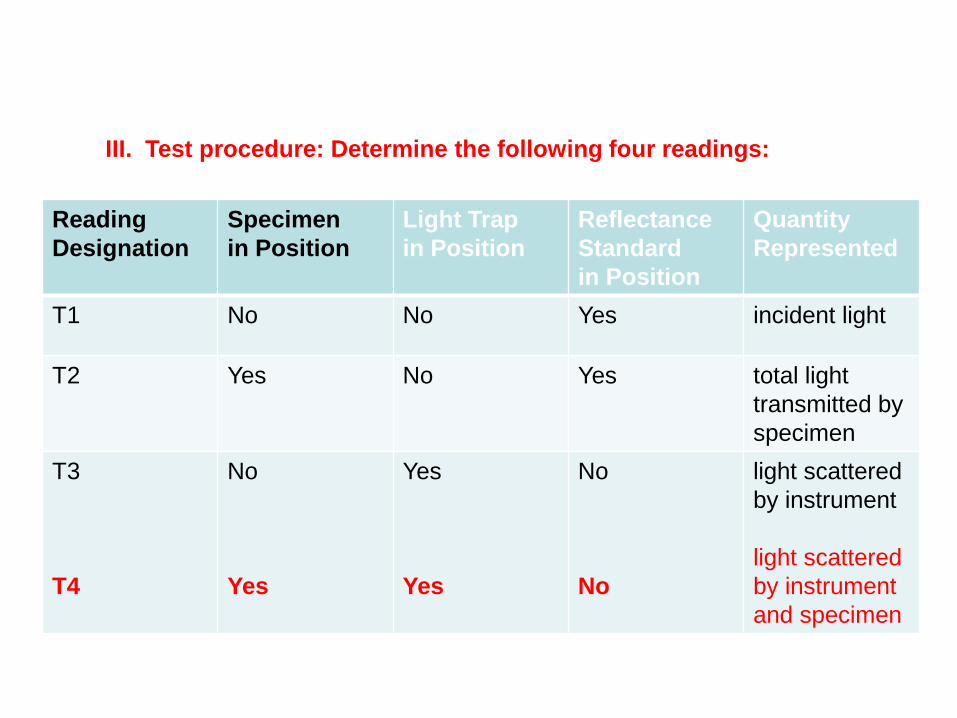
III. Test procedure: Determine the following four readings:
ReadingDesignation
Specimen in Position
Light Trapin Position
Reflectance Standard in Position
QuantityRepresented
T1 No No Yes incident light
T2 Yes No Yes total light transmitted by specimen
T3
T4
No
Yes
Yes
Yes
No
No
light scattered by instrument
light scattered by instrument and specimen
Haze
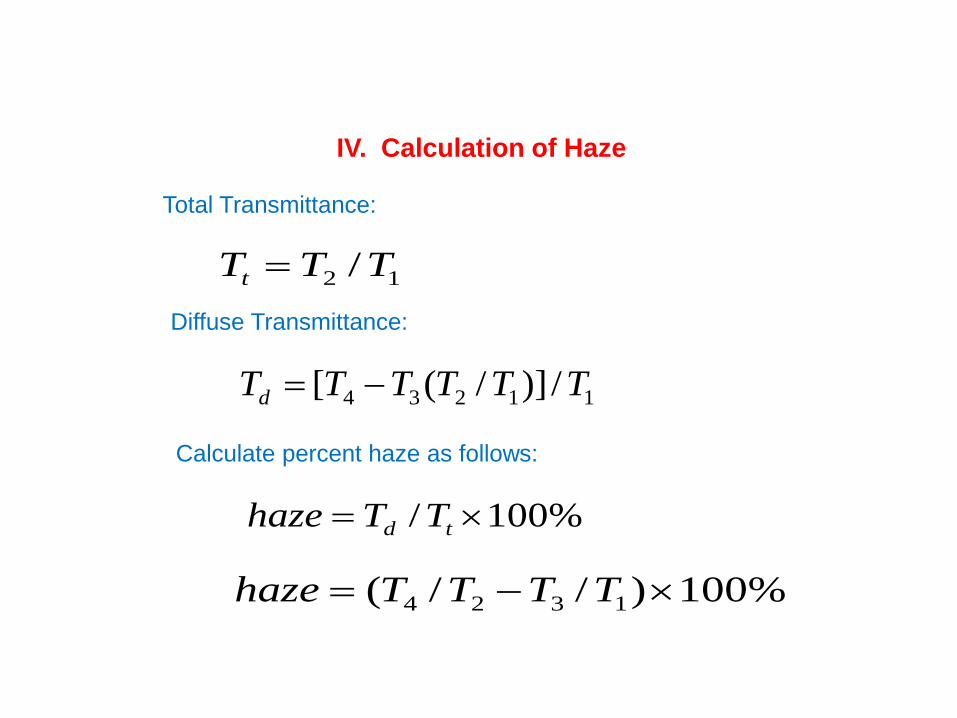
IV. Calculation of Haze
Total Transmittance:
12 /TTTt =Diffuse Transmittance:
11234 /)]/([ TTTTTTd −=
Calculate percent haze as follows:
%100/ ×= td TThaze
%100)//( 1324 ×−= TTTThaze
Haze
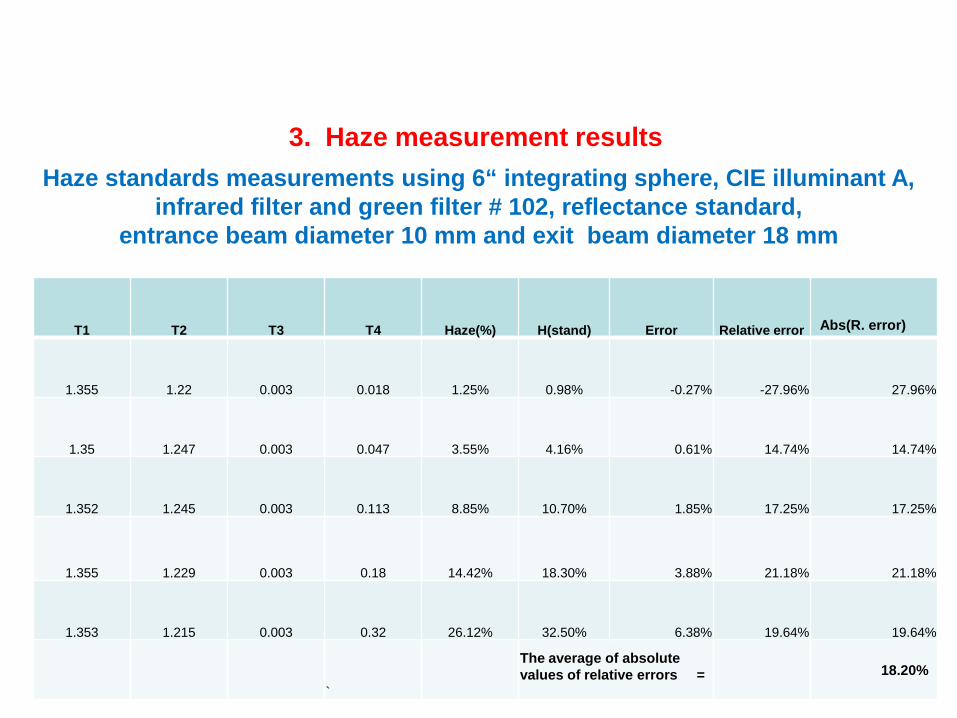
Haze standards measurements using 6“ integrating sphere, CIE illuminant A, infrared filter and green filter # 102, reflectance standard,
entrance beam diameter 10 mm and exit beam diameter 18 mm
3. Haze measurement results
T1 T2 T3 T4 Haze(%) H(stand) Error Relative error Abs(R. error)
1.355 1.22 0.003 0.018 1.25% 0.98% -0.27% -27.96% 27.96%
1.35 1.247 0.003 0.047 3.55% 4.16% 0.61% 14.74% 14.74%
1.352 1.245 0.003 0.113 8.85% 10.70% 1.85% 17.25% 17.25%
1.355 1.229 0.003 0.18 14.42% 18.30% 3.88% 21.18% 21.18%
1.353 1.215 0.003 0.32 26.12% 32.50% 6.38% 19.64% 19.64%
`
The average of absolute values of relative errors = 18.20%

HAZE
3a. Haze measurement results
Series 1 – certified haze standards values %Series 2 – measured haze values %
0.00%
5.00%
10.00%
15.00%
20.00%
25.00%
30.00%
35.00%
0.00% 5.00% 10.00% 15.00% 20.00% 25.00% 30.00% 35.00%
Series1
Series2

HAZE
4. Analysis of our haze measurement results.• Analysis shows that the haze measurements are consistent only if the white standard
has the same reflectance factor as the sphere wall (Fred W. Billmeyer, Y. Chent, 1985).• This is the case in commercial hazemeters, but is unlikely to be true in the test with the
integrating sphere.• In the pivotable-sphere type instruments the reflectance is not changed in the measurements;
the light beam is merely moved with respect to exit port.• The reflectance factor can vary, among the standards in common use from 100% to 75%.• I measured the reflectance factor of our standard; it was 99%.• From visual observation, the inside surface of our integrating sphere appeared less reflective.• I tried to reduce the reflectance of our standard in order to match the reflectance of our
integrating sphere.• I first covered it with a piece of white printer paper with the reflectance of 77%. This
reduced the relative error of haze measurements to 5%.• Next we made aluminum plugs for the exit port of the integrating sphere and painted two
plugs with flat white primer paint. The reflectance of the first plug was 76.43%; the second was 81%.
• The haze measurements results improved, when we used the plug with reflectance factor of 76.43%. The average error of measurements was approximately 1%.
Haze
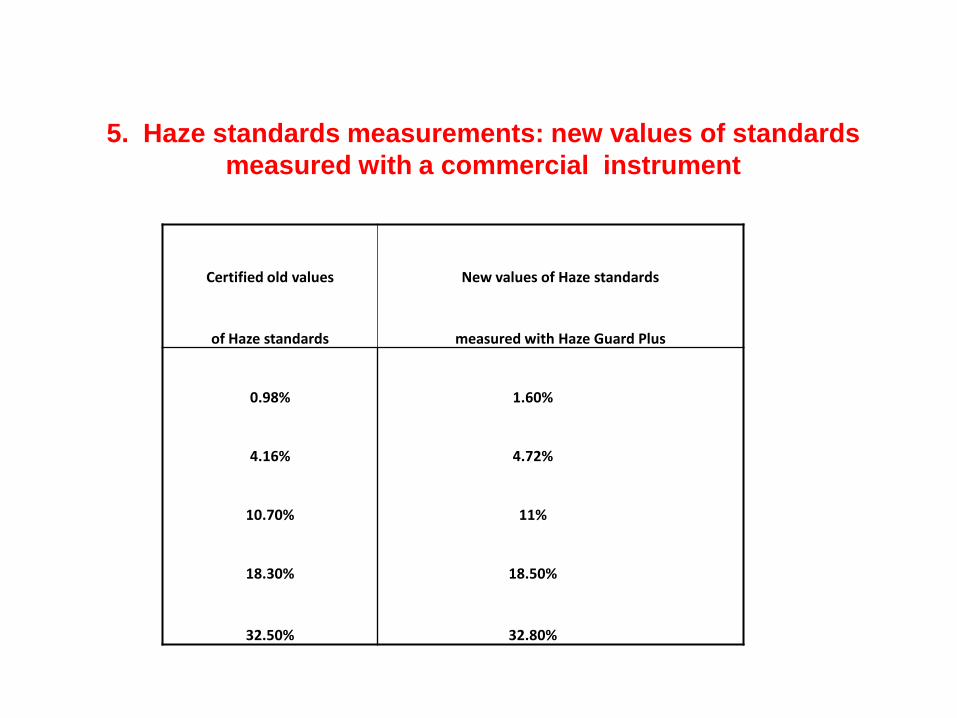
5. Haze standards measurements: new values of standards measured with a commercial instrument
Certified old values New values of Haze standards
of Haze standards measured with Haze Guard Plus
0.98% 1.60%
4.16% 4.72%
10.70% 11%
18.30% 18.50%
32.50% 32.80%
Haze
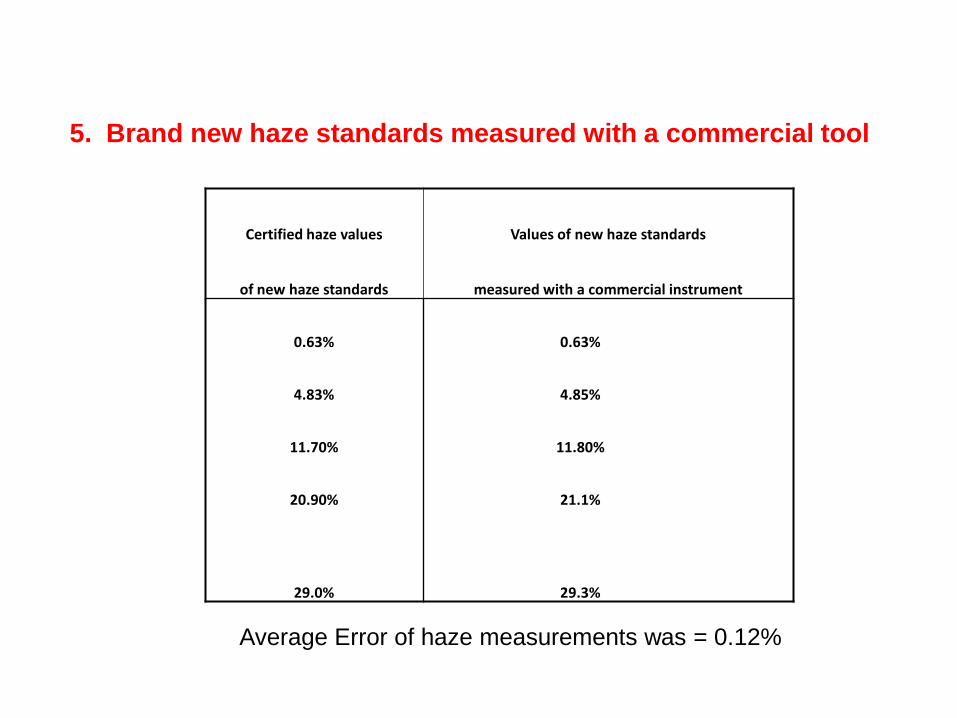
5. Brand new haze standards measured with a commercial tool
Certified haze values Values of new haze standards
of new haze standards measured with a commercial instrument
0.63% 0.63%
4.83% 4.85%
11.70% 11.80%
20.90% 21.1%
29.0% 29.3%
Average Error of haze measurements was = 0.12%
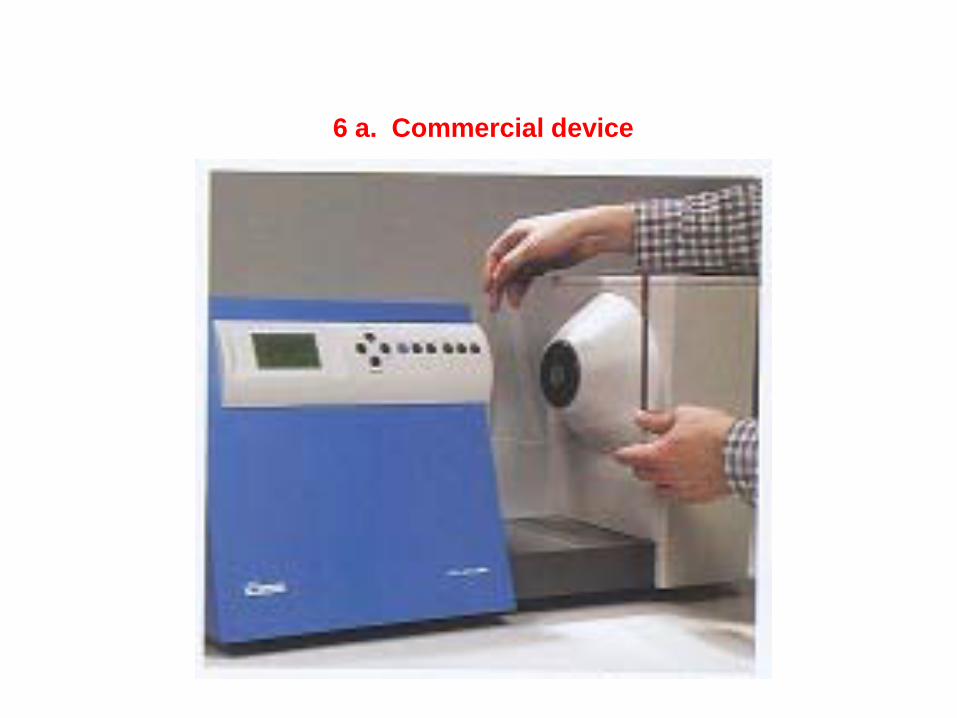
6 a. Commercial device
Haze

HAZE
6 b. Commercial device with abrasion holder
•Commercial device that was used demonstrated very high accuracy of haze measurements: +/–0.01%.•Commercial device that was used was capable of measuring values of haze that are above 30%. If a haze value is above 30, the sample is so strongly scattering, that it is beyond hazy. These types of materials are usually referred to as diffusive. If we report values of haze above 30%, we should footnote that this is beyond the generally accepted range of what is considered to be "haze".•The distance between the clarity and haze ports is about 5", which is sufficient for most transparent armor samples we have seen thus far. •Abrasion holder for the commercial instrument creates a 7 mm beam.
7. Comparison of a commercial device and haze measurements using integrating sphere
HAZE
7. Comparison of commercial device and haze measurements using integrating sphere (continued)
•With Abrasion Holder aperture in place, does the system still meet the ASTM requirements for beam size, divergence angle etc., -Yes to all; the system has to be re-calibrated with Abrasion Holder aperture in place.•We need to make sure that thick samples are normal to the beam to avoid measurement errors that can result from beam deviation.•Several fixtures are available to measure various samples. I am presently checking to determine if a fixture for thick and heavy samples is available to support the weight and not to deflect the bottom of the tool, which could deviate the optical axes of the sphere and the light source. We would need the fixture to make adjustments to ensure that the sample is inserted normal to the beam.•We saw that the haze, clarity and transparency values that were measured were strongly dependent upon the sample location. These values may be trusted for thin samples placed at the correct port during measurement, but can't be taken at face value without further interpretation for thick samples.•In the next phase of experiments, we’ll be looking at the influence of beam size, sample placement, etc. on each of the 4 individual readings that make up the haze value. •Commercial haze measurements devices provide results that are industry accepted, but the user needs to recognize its limitations (e.g. thin samples placed right at the appropriate port, etc.).
HAZE
Haze
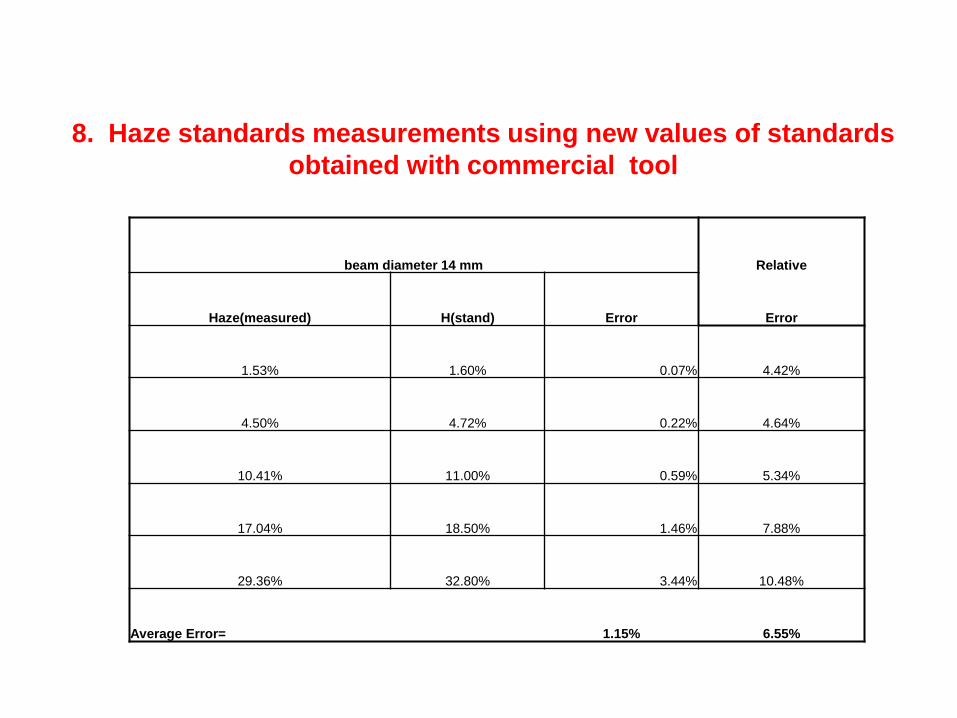
8. Haze standards measurements using new values of standards obtained with commercial tool
beam diameter 14 mm Relative
Haze(measured) H(stand) Error Error
1.53% 1.60% 0.07% 4.42%
4.50% 4.72% 0.22% 4.64%
10.41% 11.00% 0.59% 5.34%
17.04% 18.50% 1.46% 7.88%
29.36% 32.80% 3.44% 10.48%
Average Error= 1.15% 6.55%
0.00%
5.00%
10.00%
15.00%
20.00%
25.00%
30.00%
35.00%
0.00% 5.00% 10.00% 15.00% 20.00% 25.00% 30.00% 35.00%
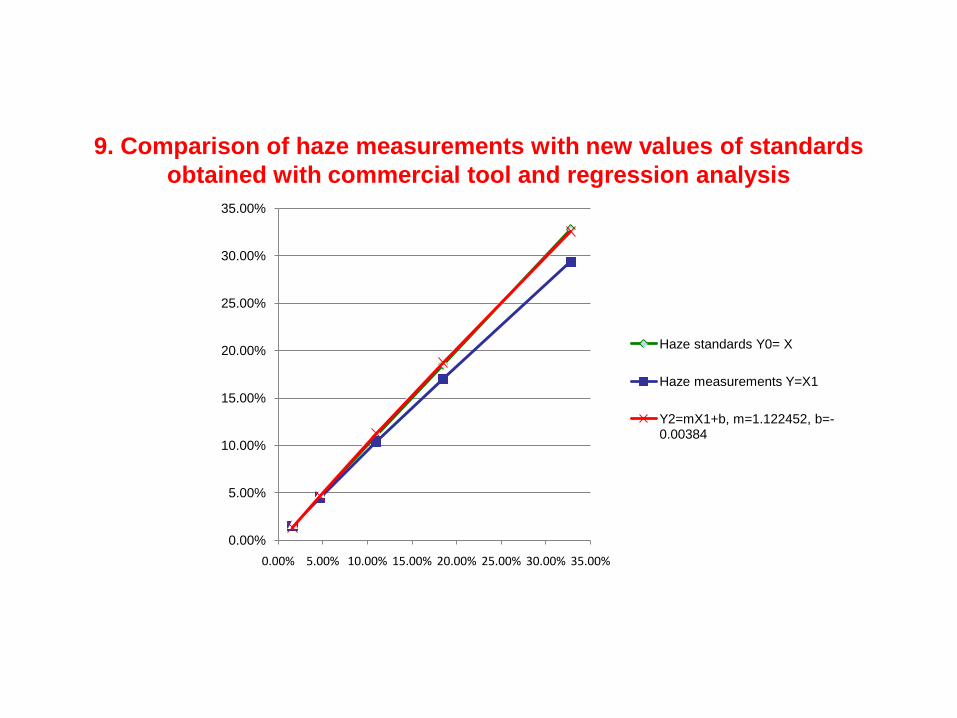
Haze standards Y0= X
Haze measurements Y=X1
Y2=mX1+b, m=1.122452, b=-0.00384
9. Comparison of haze measurements with new values of standards obtained with commercial tool and regression analysis
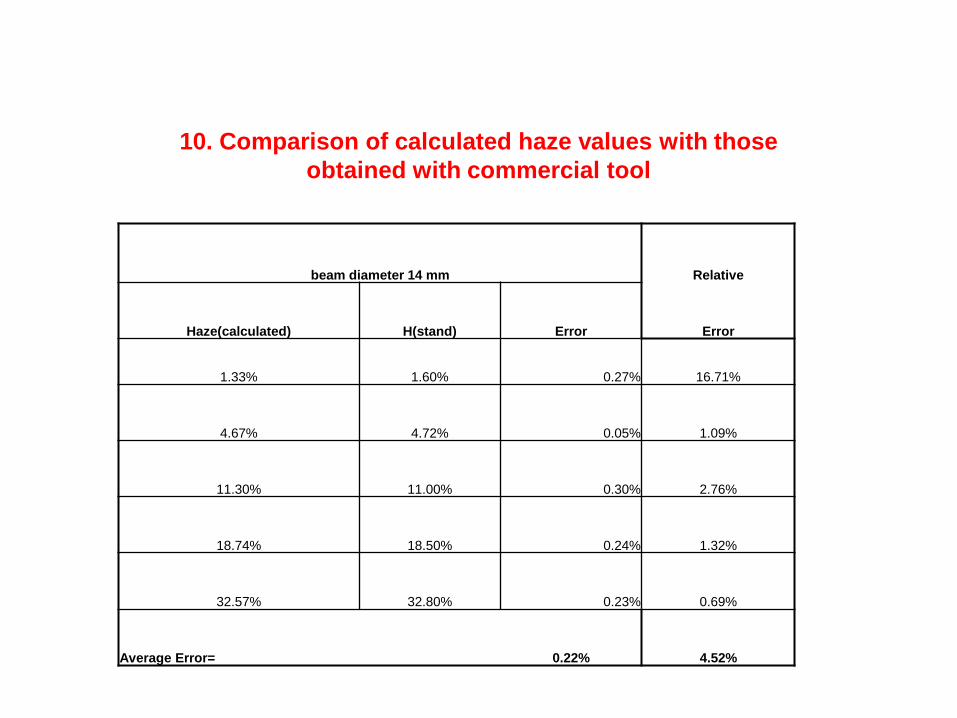
beam diameter 14 mm Relative
Haze(calculated) H(stand) Error Error
1.33% 1.60% 0.27% 16.71%
4.67% 4.72% 0.05% 1.09%
11.30% 11.00% 0.30% 2.76%
18.74% 18.50% 0.24% 1.32%
32.57% 32.80% 0.23% 0.69%
Average Error= 0.22% 4.52%
10. Comparison of calculated haze values with thoseobtained with commercial tool
0.00%
5.00%
10.00%
15.00%
20.00%
25.00%
30.00%
35.00%
0.00% 5.00% 10.00% 15.00% 20.00% 25.00% 30.00% 35.00%
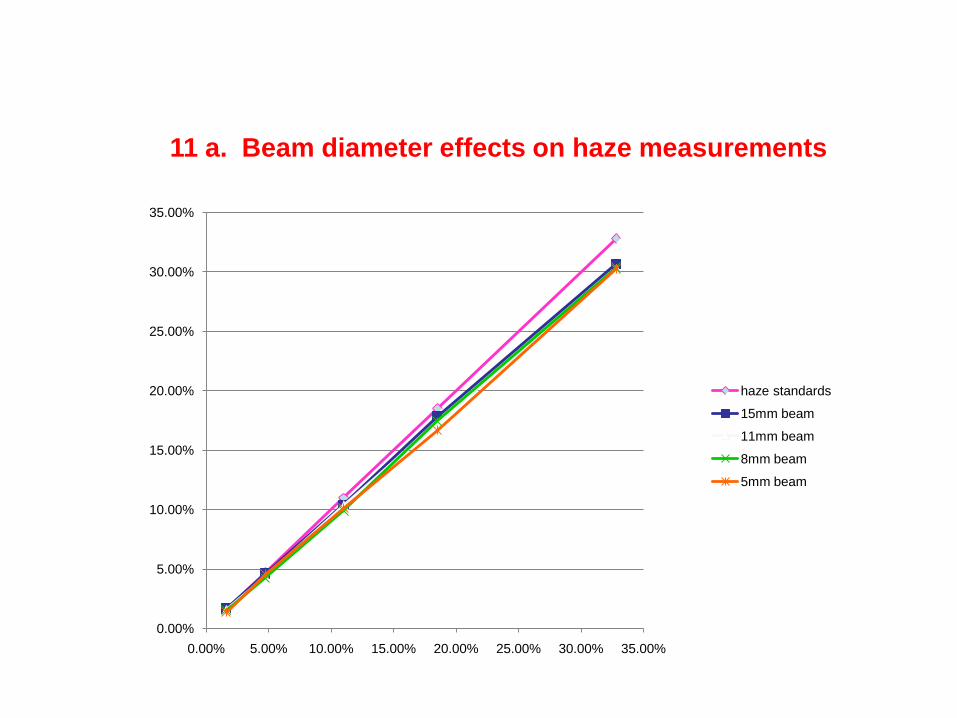
haze standards
15mm beam
11mm beam
8mm beam
5mm beam
11 a. Beam diameter effects on haze measurements
HAZE

Entrance beam d=15 mm, exit b. D=22 mm Entrance beam d=11 mm, exit b. D=17.5 mm
Haze(%) H(stand) Abs. error Reltv error Haze(%) H(stand) Abs. error Reltv error
1.68% 1.60% 0.08% 5.23% 1.58% 1.60% 0.02% 1.09%
4.63% 4.72% 0.09% 1.90% 4.36% 4.72% 0.36% 7.66%
10.40% 11.00% 0.60% 5.48% 10.35% 11.00% 0.65% 5.93%
17.85% 18.50% 0.65% 3.52% 17.24% 18.50% 1.26% 6.79%
30.67% 32.80% 2.13% 6.50% 30.22% 32.80% 2.58% 7.86%
Average Error= 0.71% 4.53% Average Error= 0.97% 5.86%
Entrance beam d=8 mm, exit b. D=13.5 mm Entrance beam d=5 mm, exit b. D=9 mm
Haze(%) H(stand) Abs. error Reltv error Haze(%) H(stand) Abs. error Reltv error
1.56% 1.60% 0.04% 2.43% 1.40% 1.60% 0.20% 12.67%
4.28% 4.72% 0.44% 9.32% 4.56% 4.72% 0.16% 3.42%
9.93% 11.00% 1.07% 9.77% 10.13% 11.00% 0.87% 7.88%
17.47% 18.50% 1.03% 5.57% 16.69% 18.50% 1.81% 9.80%
30.36% 32.80% 2.44% 7.45% 30.26% 32.80% 2.54% 7.73%
1.01% 6.91% 1.12% 8.30%
11 b. Beam diameter effects on haze measurements
HAZE
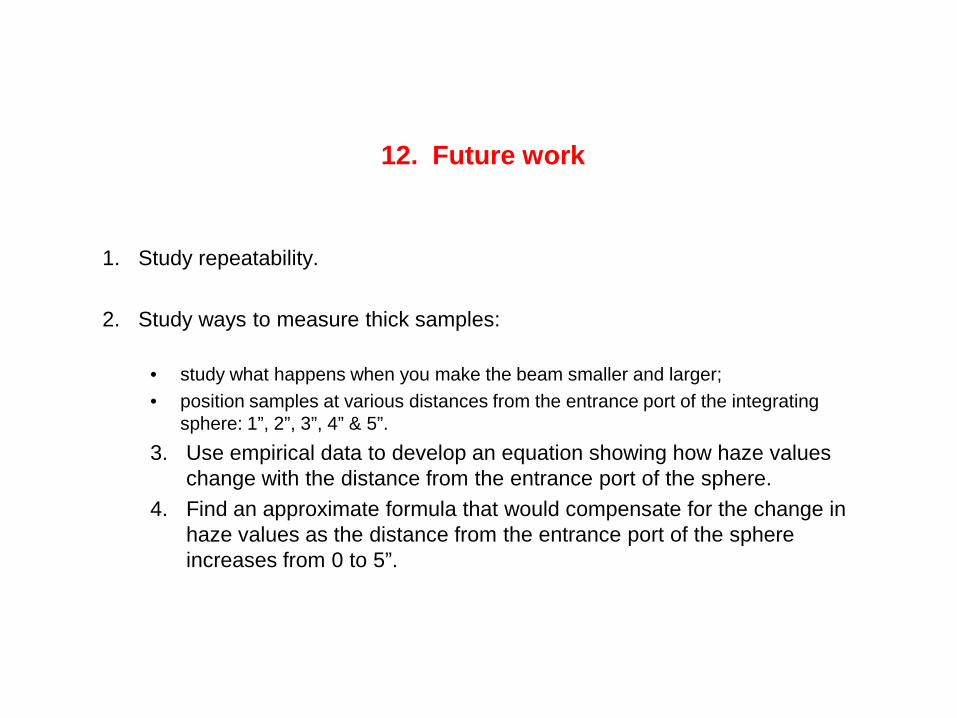
12. Future work
1. Study repeatability.
2. Study ways to measure thick samples:
• study what happens when you make the beam smaller and larger;• position samples at various distances from the entrance port of the integrating
sphere: 1”, 2”, 3”, 4” & 5”.3. Use empirical data to develop an equation showing how haze values
change with the distance from the entrance port of the sphere.4. Find an approximate formula that would compensate for the change in
haze values as the distance from the entrance port of the sphere increases from 0 to 5”.
0.00%
0.50%
1.00%
1.50%
2.00%
2.50%
3.00%
3.50%
4.00%
4.50%
5.00%
0 1 2 3 4 5 6
Series1
Series2
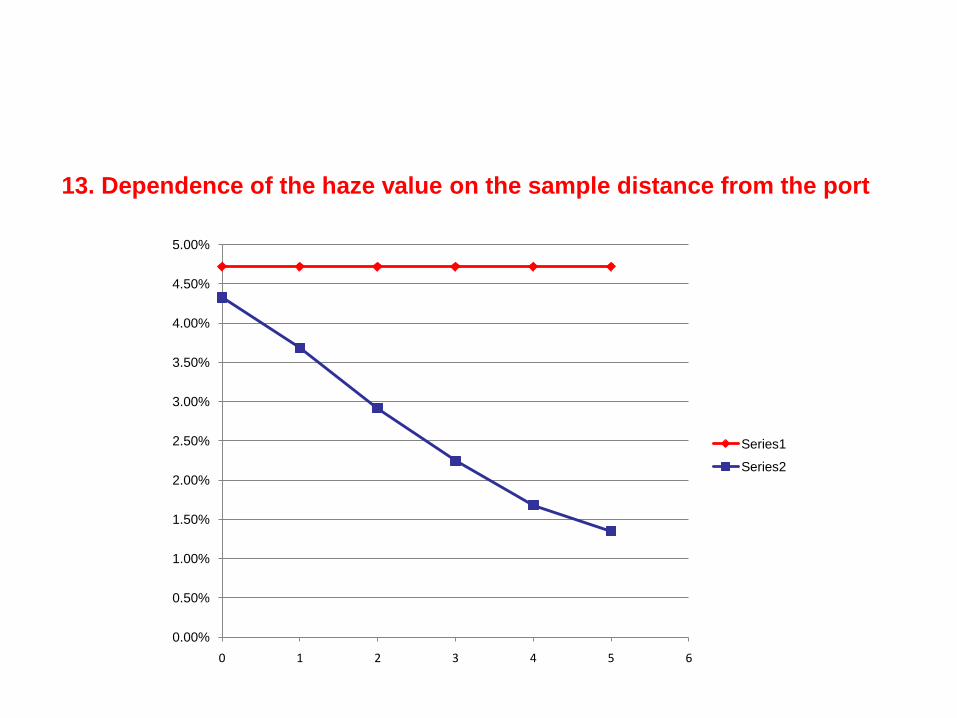
13. Dependence of the haze value on the sample distance from the port

SUMMARY OUTPUT
Regression Statistics
Multiple R 0.9997771
R Square 0.9995543
Adjusted R Sq. 0.9994058
Standard Error 0.0030402
Observations 5
ANOVA
df SS MS F Significance F
Regression 1 0.062191023 0.062191 6728.438062 3.99362E-06
Residual 3 2.7729E-05 9.243E-06
Total 4 0.062218752
Coefficients Standard Error t Stat P-value Lower 95% Upper 95%
Intercept -0.0038436 0.00219246 -1.753108 0.177866968 -0.010821004 0.003134
X Variable 1 1.122452 0.013683924 82.027057 3.99362E-06 1.078903634 1.166
14. Comparison of haze measurements with new values of standards obtained with the commercial tool and regression analysis
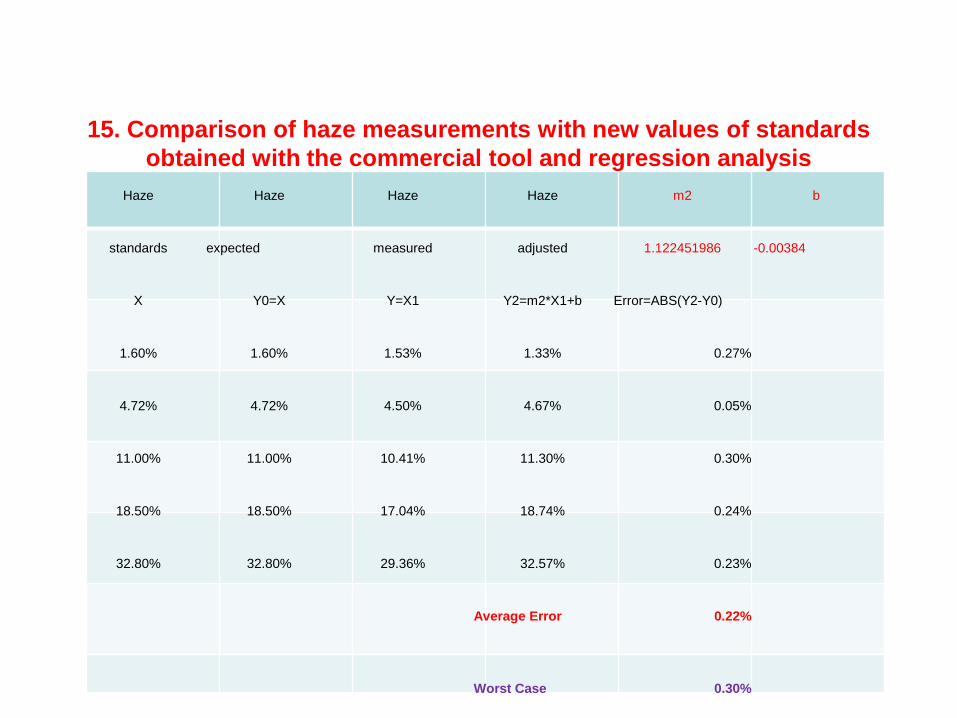
Haze Haze Haze Haze m2 b
standards expected measured adjusted 1.122451986 -0.00384
X Y0=X Y=X1 Y2=m2*X1+b Error=ABS(Y2-Y0)
1.60% 1.60% 1.53% 1.33% 0.27%
4.72% 4.72% 4.50% 4.67% 0.05%
11.00% 11.00% 10.41% 11.30% 0.30%
18.50% 18.50% 17.04% 18.74% 0.24%
32.80% 32.80% 29.36% 32.57% 0.23%
Average Error 0.22%
Worst Case 0.30%
15. Comparison of haze measurements with new values of standards obtained with the commercial tool and regression analysis
HAZE
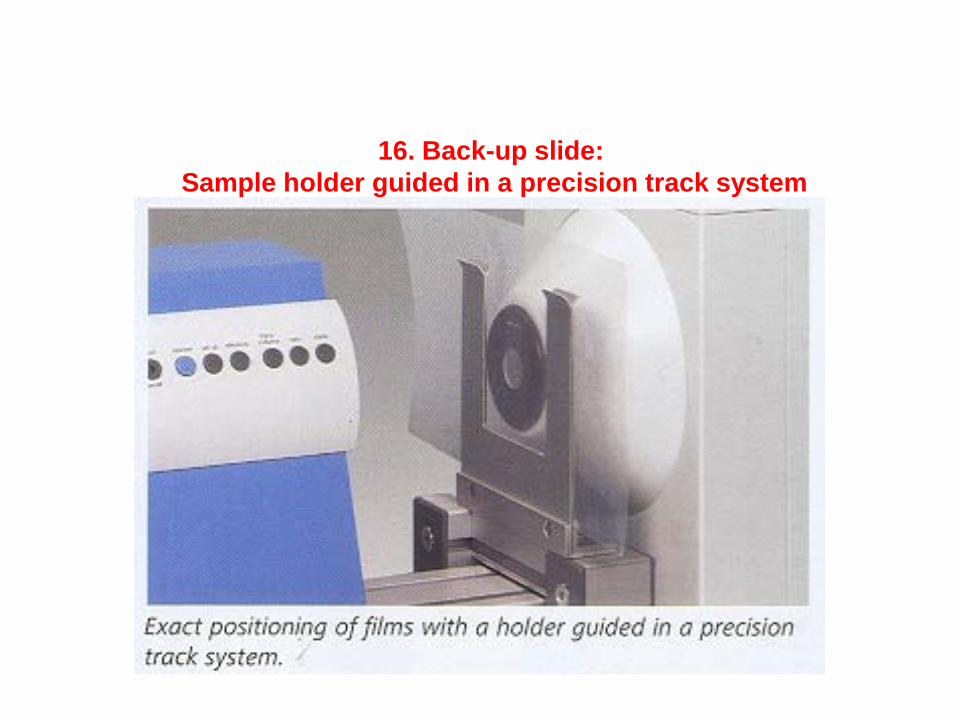
16. Back-up slide:Sample holder guided in a precision track system
HAZE
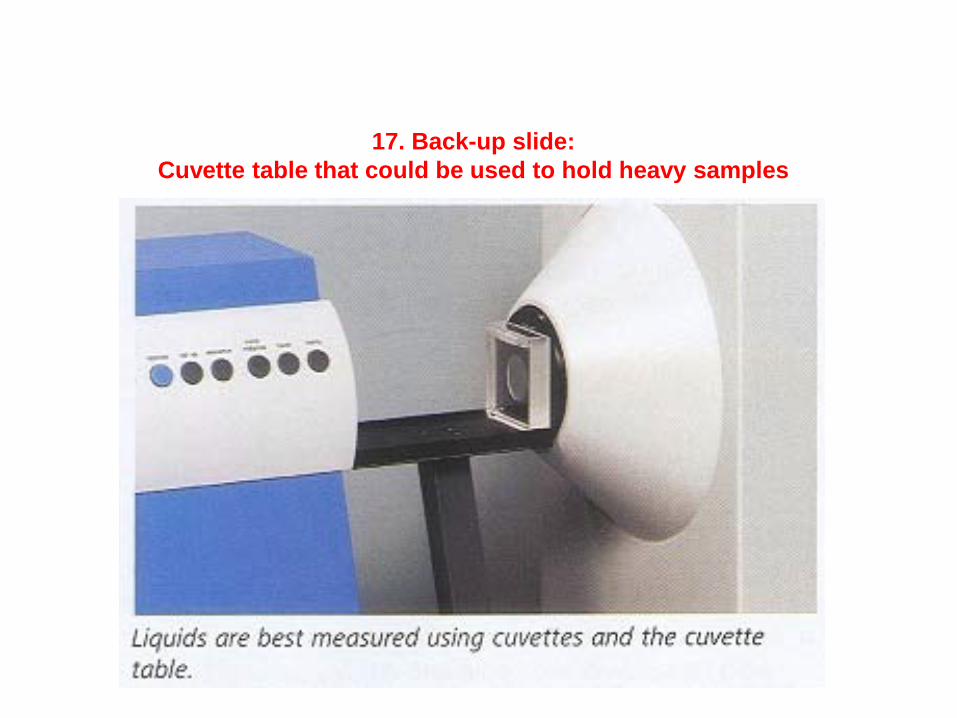
17. Back-up slide:Cuvette table that could be used to hold heavy samples