hawaii’s coffee industryhdoa.hawaii.gov/wp-content/uploads/2013/01/coffee-industry... · as land...
TRANSCRIPT
Mana K. Southichack, PhDEconomist
Hawaii Department of Agriculture Agricultural Development Division
HAWAII’S COFFEE INDUSTRY
Structural Change and Its Effects on Farm Operations
July 27, 2006 FINAL
Department of Agriculture
STATE OF HAWAII
Hawaii’s Coffee Industry: Structural Change and Its Effects on Farm Operations Hawaii Department of Agriculture
i
Acknowledgments
Appreciation is extended to the National Agricultural Statistics Services-Hawaii Field Office (formerly Hawaii Agricultural Statistics Service), particularly Ronald Nakamura, for having been extremely helpful in providing the needed data and clarifying certain issues; to Dr. Matthew K. Loke, Agricultural Development Division (ADD), Hawaii Department of Agriculture (HDOA), for helpful comments and suggestions; and to Jadeen Arakaki, ADD, HDOA, for editing. The cooperation of anonymous industry members in providing information and clarifying some issues are highly valuable. However, all errors and omissions are the author’s responsibility alone.
Disclaimer
The views and opinions expressed herein do not necessarily represent those of nor are they endorsed by the Hawaii Department of Agriculture.
Hawaii’s Coffee Industry: Structural Change and Its Effects on Farm Operations Hawaii Department of Agriculture
ii
EXECUTIVE SUMMARY A surge in world coffee price in 1975 ended a decade-and-a-half-long industry decline. A combination of growing demand for specialty coffee in the 1980s and technological advancements enabled an increasing number of small Kona Coffee farm operations to become fully integrated. This led to rapid growth in Hawaii’s coffee industry, with growing brand and commercial farm establishments across the Hawaiian Islands. The average Kona Coffee price began to diverge from the Colombian Mild Arabica (CMA) bean price in the international market since the late 1970s. High prices attracted counterfeiting operations, which played a major role in both of the Kona Coffee price crashes in the 1990s. The events encouraged a large number of Kona Coffee farms to leave the cooperative and become independent and fully integrated farms, marking a considerable change in the industry structure. In effect, it diversified the market of Kona Coffee, and its price became increasingly more independent of conditions in the world commodity market. Nevertheless, a substantial and lasting decline in the CMA bean price traded in the world commodity market still could influence the price of Hawaii-grown coffees. Competition grew from within Hawaii’s coffee industry, and from imported specialty coffees. Statistics hint that Hawaii’s internal industry competition, with an explosive 600% output growth of the Kauai Coffee brand between 1994 and 1998, may have partially contributed to the second Kona Coffee price crash in the late 1990s. The increase in average farm size in the Kona District since 1994, where 82% (2003) of Hawaii’s coffee farm operations were located, is an indication that economies of scale may be at work. The trend is expected to continue as competition increases in favor of relatively large operations. However, it is inconclusive in which direction the industry will evolve. If economies of scale is strong, only farms large enough to economize on input and marketing costs will have the capability to withstand the increasing competitive pressure and price fluctuations. However, if market differentiation (brand loyalty) is strong enough, outweighing the scale economies effect, numerous small and fully integrated farms will continue to thrive. In a highly competitive market, only small, independent commercial farms with a well-established niche market and a strong marketing system are likely to continue to exist as fully integrated farms. The future of small farms depends on their ability to develop and maintain a niche market, or band together in an effective cooperative or any business entity that could lower their production and distribution costs. The part-time, “gentlemen” farms will continue to exist as long as land cost remains relatively low. Cooperation between industry members to prevent oversupply and possibly destructive competition is necessary to assure economic viability of the industry. Uncontrolled counterfeit coffee operations can cause crises similar to those that occurred in the early and late 1990s. Inadequate enforcement of measures put in place to curtail counterfeiting operations could leave the industry vulnerable. The industry needs to be active in monitoring, while the government needs to have an adequate capacity to respond to reports and enforce the law to keep counterfeiting under control.
Hawaii’s Coffee Industry: Structural Change and Its Effects on Farm Operations Hawaii Department of Agriculture
iii
TABLE OF CONTENT
Page
1. Introduction 12. 3. 4.
The resurgence of Hawaii’s coffee industry Divergence from the world commodity market The 1990s price crashes, counterfeit, and structural change 4.1. The first crash (1990 – 1992) 4.2. The second crash (1998 – 2000)
Counterfeiting Industry internal competition Price plunge in the commodity market
23447778
5. The evolving Hawaii’s coffee industry 5.1. Processing boom and growing tradenames and trademarks 5.2. Farm activity expansion across islands with growing island brands 5.3. Blend coffees and competition 5.4. Localization and product differentiation
99
101112
6. Industry future trend Scenario 1: Larger farms dominate Scenario 2: Coexistence of large and small independent farms Scenario 3: Coexistence of large farms and cooperatives of small farms
13151515
7. Conclusion 16 References 18
Hawaii’s Coffee Industry: Structural Change and Its Effects on Farm Operations Hawaii Department of Agriculture
iv
LIST OF FIGURES PageFigure 1. Hawaii’s Coffee Farm Production: 1946 - 2003 2Figure 2. Per Acre Yield of Coffee Farms in Hawaii County: 1946 – 2003 3Figure 3. Price Comparison: Hawaii-Grown Versus Colombian Mild Arabica 5Figure 4. Hawaii County-Grown and HKM-Grown Coffees: Are They
Competitors? 8Figure 5. Kona Coffee: Tradename and Trademark Registration and Price
Changes: 1980 – 2003 9Figure 6. The Evolving Kona Coffee Farms: 1975 - 2003 14
LIST OF TABLES Table 1. An Incentive for Counterfeiting 6Table 2. Registered Coffee Businesses in Hawaii 11Table 3. Retail Price Comparison 13
Hawaii’s Coffee Industry: Structural Change and Its Effects on Farm Operations Hawaii Department of Agriculture
1
1. Introduction This paper analyzes major structural changes in Hawaii’s coffee industry since 1975, their main driving forces and how they affected farm practices, and forecasts the industry’s future. The analysis brings to light the complexity of the industry, problems associated with marketing farmers were facing. This paper also offers recommendations on the approach and methodology the industry and affected government agencies need to facilitate growth and sustain the economic viability of the industry. After a long industry decline following the 1957/58 harvesting season, Hawaii’s coffee industry reemerged in 1975 and, especially since the late 1980s, evolved rapidly. It has expanded beyond the Kona District of the Big Island (Island of Hawaii) to four other major Hawaiian Islands: Kauai, Oahu, Maui, and Molokai. Farms are highly diverse in size and operational methods, from a part-time family farm of less than two acres using the traditional handpicked harvesting method to one of the world’s largest corporate farms with a fully irrigated and mechanized harvesting method. Land used for plantation expanded from 2,400 acres in 1975 to 7,300 acres in 2003. This includes 3,600 acres in Hawaii County and 3,400 acres in Kauai County, with Honolulu and Maui counties making up the remaining acreage.1 Large farms are fully integrated in operations, from farming to processing, to selling the finished product to consumers. While an increasing number of relatively small farms have become fully integrated, a large number of part-time family farms complete their operation after the coffee cherries are harvested and sold to local processors. The high concentration of small family farms in the Kona region on the Big Island gives Hawaii’s coffee industry its special feature. Their number accounts for 82% of all commercial coffee farms in the state in 2004. The remainders are located outside of the Big Island, and are typically large and mechanized farms. Hawaii’s coffee industry has grown more complex structurally and operationally. Brand development grew rapidly, and counterfeit coffees have become a common problem to all of Hawaii’s coffee farmers since the late 1980s. Technological advancements in farming, processing, packaging, marketing and delivery have benefited both small and large farms thus far. However, recent developments and trends suggest that the benefits technological advancements have brought to small coffee farmers may be short-lived, and they may have to decide between becoming larger, becoming raw coffee suppliers to relatively large processing firms, joining a marketing cooperative, or leaving the industry altogether. What were the major changes occurring in Hawaii’s coffee industry in the past decades, and what were their driving forces? What are the trends that might determine what the industry is likely to evolve into? What are the existing problems that could determine the industry’s survival if not appropriately and diligently dealt with? Which group, large farms or small farms, is likely to be affected most by the evolving problems? What should be anticipated and how might problems be appropriately dealt with? These are the questions this paper seeks to answer.
1 Kauai acreage is obtained from Hawaii Coffee Association’s pamphlet.
Hawaii’s Coffee Industry: Structural Change and Its Effects on Farm Operations Hawaii Department of Agriculture
2
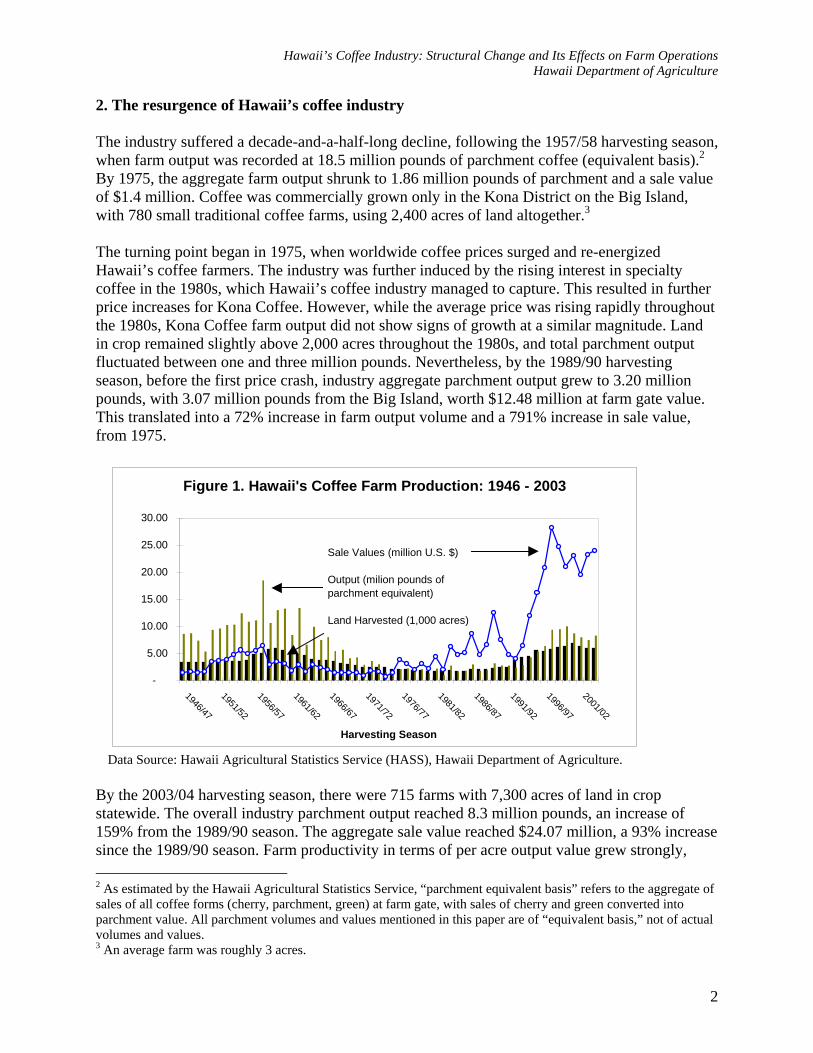
2. The resurgence of Hawaii’s coffee industry The industry suffered a decade-and-a-half-long decline, following the 1957/58 harvesting season, when farm output was recorded at 18.5 million pounds of parchment coffee (equivalent basis).2 By 1975, the aggregate farm output shrunk to 1.86 million pounds of parchment and a sale value of $1.4 million. Coffee was commercially grown only in the Kona District on the Big Island, with 780 small traditional coffee farms, using 2,400 acres of land altogether.3 The turning point began in 1975, when worldwide coffee prices surged and re-energized Hawaii’s coffee farmers. The industry was further induced by the rising interest in specialty coffee in the 1980s, which Hawaii’s coffee industry managed to capture. This resulted in further price increases for Kona Coffee. However, while the average price was rising rapidly throughout the 1980s, Kona Coffee farm output did not show signs of growth at a similar magnitude. Land in crop remained slightly above 2,000 acres throughout the 1980s, and total parchment output fluctuated between one and three million pounds. Nevertheless, by the 1989/90 harvesting season, before the first price crash, industry aggregate parchment output grew to 3.20 million pounds, with 3.07 million pounds from the Big Island, worth $12.48 million at farm gate value. This translated into a 72% increase in farm output volume and a 791% increase in sale value, from 1975.
Figure 1. Hawaii's Coffee Farm Production: 1946 - 2003
-
5.00
10.00
15.00
20.00
25.00
30.00
1946/47
1951/52
1956/57
1961/62
1966/67
1971/72
1976/77
1981/82
1986/87
1991/92
1996/97
2001/02
Harvesting Season
Sale Values (million U.S. $)
Output (milion pounds of parchment equivalent)
Land Harvested (1,000 acres)
Data Source: Hawaii Agricultural Statistics Service (HASS), Hawaii Department of Agriculture.
By the 2003/04 harvesting season, there were 715 farms with 7,300 acres of land in crop statewide. The overall industry parchment output reached 8.3 million pounds, an increase of 159% from the 1989/90 season. The aggregate sale value reached $24.07 million, a 93% increase since the 1989/90 season. Farm productivity in terms of per acre output value grew strongly, 2 As estimated by the Hawaii Agricultural Statistics Service, “parchment equivalent basis” refers to the aggregate of sales of all coffee forms (cherry, parchment, green) at farm gate, with sales of cherry and green converted into parchment value. All parchment volumes and values mentioned in this paper are of “equivalent basis,” not of actual volumes and values. 3 An average farm was roughly 3 acres.
Hawaii’s Coffee Industry: Structural Change and Its Effects on Farm Operations Hawaii Department of Agriculture
3
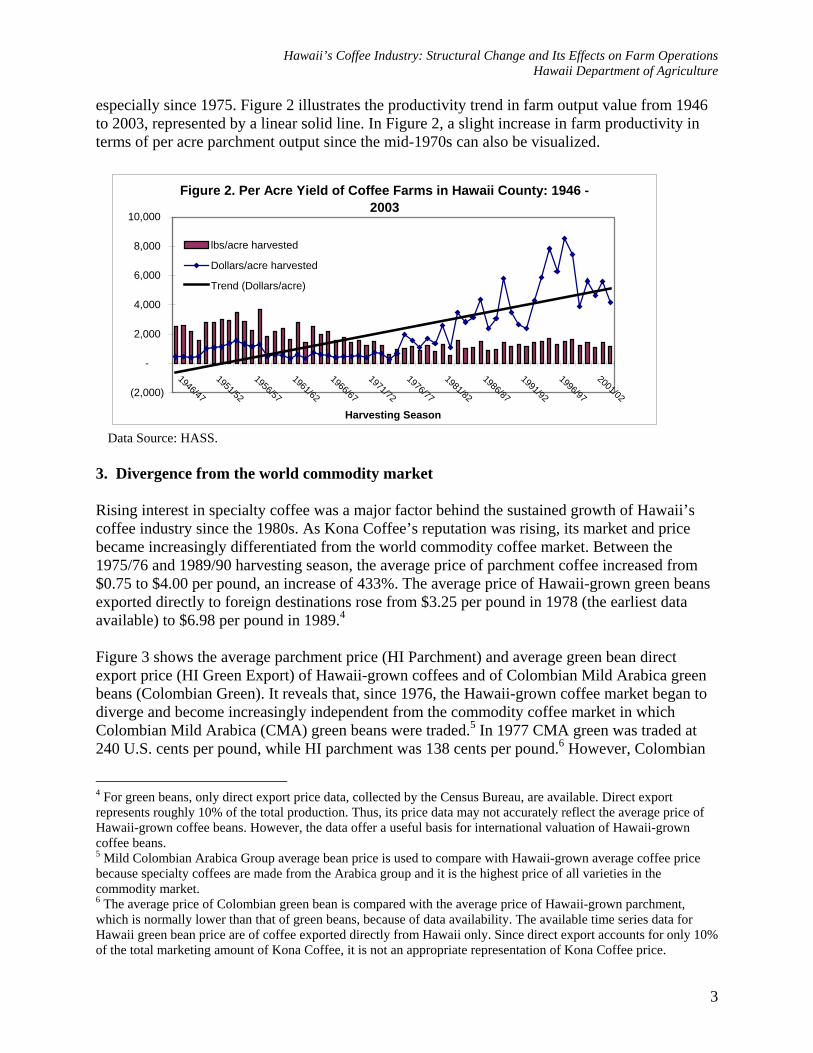
especially since 1975. Figure 2 illustrates the productivity trend in farm output value from 1946 to 2003, represented by a linear solid line. In Figure 2, a slight increase in farm productivity in terms of per acre parchment output since the mid-1970s can also be visualized.
Figure 2. Per Acre Yield of Coffee Farms in Hawaii County: 1946 - 2003
(2,000)
-
2,000
4,000
6,000
8,000
10,000
1946/47
1951/52
1956/57
1961/62
1966/67
1971/72
1976/77
1981/82
1986/87
1991/92
1996/97
2001/02
Harvesting Season
lbs/acre harvested
Dollars/acre harvested
Trend (Dollars/acre)
Data Source: HASS.
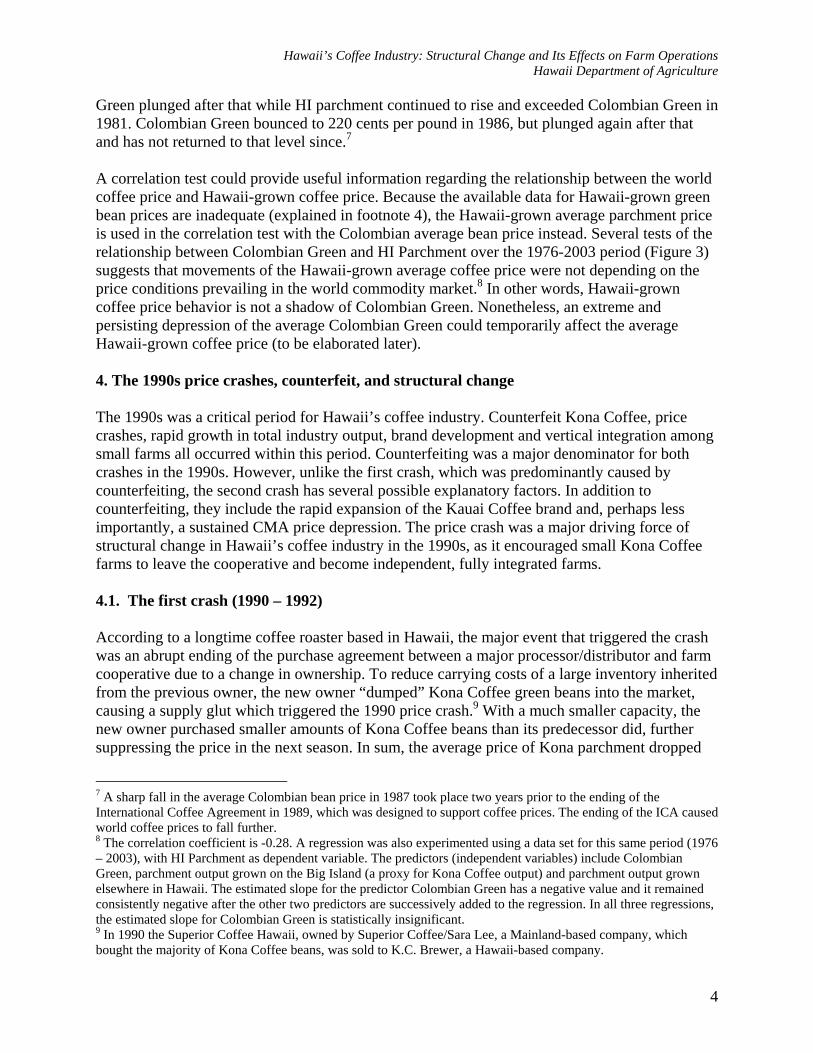
3. Divergence from the world commodity market Rising interest in specialty coffee was a major factor behind the sustained growth of Hawaii’s coffee industry since the 1980s. As Kona Coffee’s reputation was rising, its market and price became increasingly differentiated from the world commodity coffee market. Between the 1975/76 and 1989/90 harvesting season, the average price of parchment coffee increased from $0.75 to $4.00 per pound, an increase of 433%. The average price of Hawaii-grown green beans exported directly to foreign destinations rose from $3.25 per pound in 1978 (the earliest data available) to $6.98 per pound in 1989.4 Figure 3 shows the average parchment price (HI Parchment) and average green bean direct export price (HI Green Export) of Hawaii-grown coffees and of Colombian Mild Arabica green beans (Colombian Green). It reveals that, since 1976, the Hawaii-grown coffee market began to diverge and become increasingly independent from the commodity coffee market in which Colombian Mild Arabica (CMA) green beans were traded.5 In 1977 CMA green was traded at 240 U.S. cents per pound, while HI parchment was 138 cents per pound.6 However, Colombian
4 For green beans, only direct export price data, collected by the Census Bureau, are available. Direct export represents roughly 10% of the total production. Thus, its price data may not accurately reflect the average price of Hawaii-grown coffee beans. However, the data offer a useful basis for international valuation of Hawaii-grown coffee beans. 5 Mild Colombian Arabica Group average bean price is used to compare with Hawaii-grown average coffee price because specialty coffees are made from the Arabica group and it is the highest price of all varieties in the commodity market. 6 The average price of Colombian green bean is compared with the average price of Hawaii-grown parchment, which is normally lower than that of green beans, because of data availability. The available time series data for Hawaii green bean price are of coffee exported directly from Hawaii only. Since direct export accounts for only 10% of the total marketing amount of Kona Coffee, it is not an appropriate representation of Kona Coffee price.
Hawaii’s Coffee Industry: Structural Change and Its Effects on Farm Operations Hawaii Department of Agriculture
4
Green plunged after that while HI parchment continued to rise and exceeded Colombian Green in 1981. Colombian Green bounced to 220 cents per pound in 1986, but plunged again after that and has not returned to that level since.7 A correlation test could provide useful information regarding the relationship between the world coffee price and Hawaii-grown coffee price. Because the available data for Hawaii-grown green bean prices are inadequate (explained in footnote 4), the Hawaii-grown average parchment price is used in the correlation test with the Colombian average bean price instead. Several tests of the relationship between Colombian Green and HI Parchment over the 1976-2003 period (Figure 3) suggests that movements of the Hawaii-grown average coffee price were not depending on the price conditions prevailing in the world commodity market.8 In other words, Hawaii-grown coffee price behavior is not a shadow of Colombian Green. Nonetheless, an extreme and persisting depression of the average Colombian Green could temporarily affect the average Hawaii-grown coffee price (to be elaborated later). 4. The 1990s price crashes, counterfeit, and structural change The 1990s was a critical period for Hawaii’s coffee industry. Counterfeit Kona Coffee, price crashes, rapid growth in total industry output, brand development and vertical integration among small farms all occurred within this period. Counterfeiting was a major denominator for both crashes in the 1990s. However, unlike the first crash, which was predominantly caused by counterfeiting, the second crash has several possible explanatory factors. In addition to counterfeiting, they include the rapid expansion of the Kauai Coffee brand and, perhaps less importantly, a sustained CMA price depression. The price crash was a major driving force of structural change in Hawaii’s coffee industry in the 1990s, as it encouraged small Kona Coffee farms to leave the cooperative and become independent, fully integrated farms. 4.1. The first crash (1990 – 1992) According to a longtime coffee roaster based in Hawaii, the major event that triggered the crash was an abrupt ending of the purchase agreement between a major processor/distributor and farm cooperative due to a change in ownership. To reduce carrying costs of a large inventory inherited from the previous owner, the new owner “dumped” Kona Coffee green beans into the market, causing a supply glut which triggered the 1990 price crash.9 With a much smaller capacity, the new owner purchased smaller amounts of Kona Coffee beans than its predecessor did, further suppressing the price in the next season. In sum, the average price of Kona parchment dropped
7 A sharp fall in the average Colombian bean price in 1987 took place two years prior to the ending of the International Coffee Agreement in 1989, which was designed to support coffee prices. The ending of the ICA caused world coffee prices to fall further. 8 The correlation coefficient is -0.28. A regression was also experimented using a data set for this same period (1976 – 2003), with HI Parchment as dependent variable. The predictors (independent variables) include Colombian Green, parchment output grown on the Big Island (a proxy for Kona Coffee output) and parchment output grown elsewhere in Hawaii. The estimated slope for the predictor Colombian Green has a negative value and it remained consistently negative after the other two predictors are successively added to the regression. In all three regressions, the estimated slope for Colombian Green is statistically insignificant. 9 In 1990 the Superior Coffee Hawaii, owned by Superior Coffee/Sara Lee, a Mainland-based company, which bought the majority of Kona Coffee beans, was sold to K.C. Brewer, a Hawaii-based company.
Hawaii’s Coffee Industry: Structural Change and Its Effects on Farm Operations Hawaii Department of Agriculture
5
33% between the 1989/90 and 1990/91 harvesting season, from $4.00 to $2.70 per pound, and by another 27% the next harvesting season (see Figure 3). Figure 3.
Price Fluctuations: Hawaii's Parchment, Hawaii's Green Export, and Colombian Mild Arabica
-200400600800
1,0001,2001,4001,6001,8002,000
1965
/66
1967
/68
1969
/70
1971
/72
1973
/74
1975
/76
1977
/78
1979
/80
1981
/82
1983
/84
1985
/86
1987
/88
1989
/90
1991
/92
1993
/94
1995
/96
1997
/98
1999
/00
2001
/02
2003
/04
Cen
ts p
er L
b
HI ParchmentColumbian GreenHI Green Export
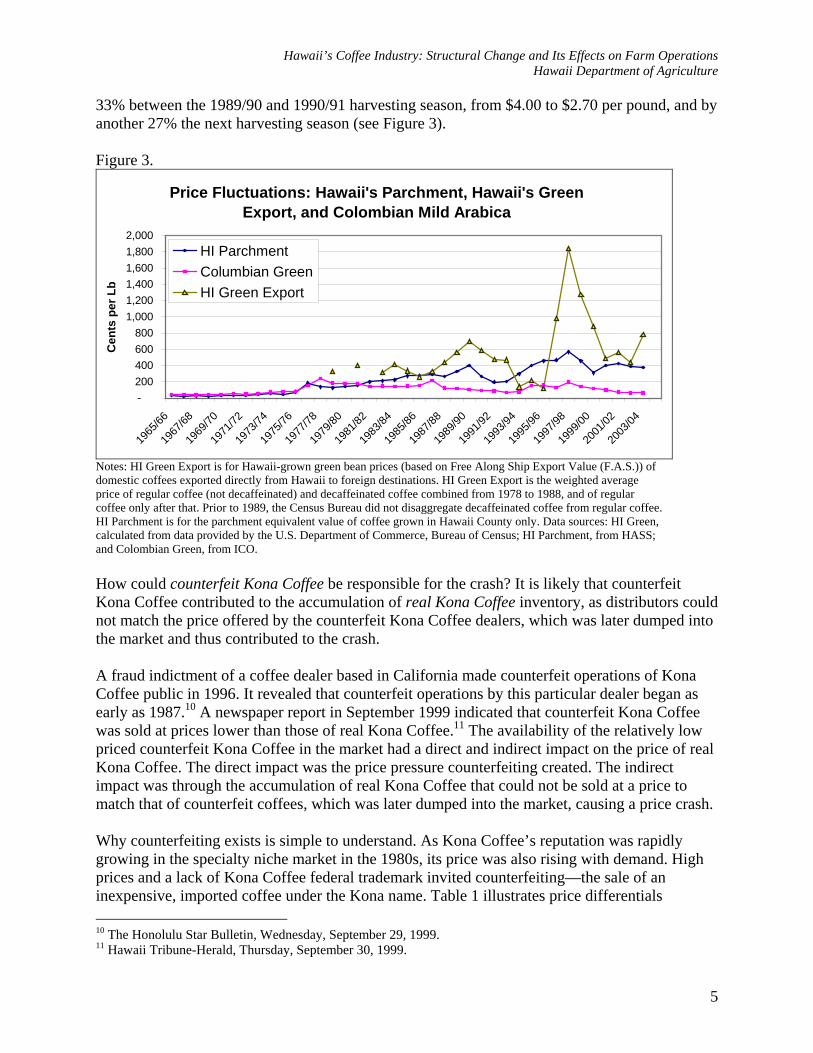
Notes: HI Green Export is for Hawaii-grown green bean prices (based on Free Along Ship Export Value (F.A.S.)) of domestic coffees exported directly from Hawaii to foreign destinations. HI Green Export is the weighted average price of regular coffee (not decaffeinated) and decaffeinated coffee combined from 1978 to 1988, and of regular coffee only after that. Prior to 1989, the Census Bureau did not disaggregate decaffeinated coffee from regular coffee. HI Parchment is for the parchment equivalent value of coffee grown in Hawaii County only. Data sources: HI Green, calculated from data provided by the U.S. Department of Commerce, Bureau of Census; HI Parchment, from HASS; and Colombian Green, from ICO. How could counterfeit Kona Coffee be responsible for the crash? It is likely that counterfeit Kona Coffee contributed to the accumulation of real Kona Coffee inventory, as distributors could not match the price offered by the counterfeit Kona Coffee dealers, which was later dumped into the market and thus contributed to the crash. A fraud indictment of a coffee dealer based in California made counterfeit operations of Kona Coffee public in 1996. It revealed that counterfeit operations by this particular dealer began as early as 1987.10 A newspaper report in September 1999 indicated that counterfeit Kona Coffee was sold at prices lower than those of real Kona Coffee.11 The availability of the relatively low priced counterfeit Kona Coffee in the market had a direct and indirect impact on the price of real Kona Coffee. The direct impact was the price pressure counterfeiting created. The indirect impact was through the accumulation of real Kona Coffee that could not be sold at a price to match that of counterfeit coffees, which was later dumped into the market, causing a price crash. Why counterfeiting exists is simple to understand. As Kona Coffee’s reputation was rapidly growing in the specialty niche market in the 1980s, its price was also rising with demand. High prices and a lack of Kona Coffee federal trademark invited counterfeiting—the sale of an inexpensive, imported coffee under the Kona name. Table 1 illustrates price differentials 10 The Honolulu Star Bulletin, Wednesday, September 29, 1999. 11 Hawaii Tribune-Herald, Thursday, September 30, 1999.
Hawaii’s Coffee Industry: Structural Change and Its Effects on Farm Operations Hawaii Department of Agriculture
6
between Kona green and Colombian Mild Arabica green and between roasted beans of various brands to reveal the continual incentive for counterfeiting. With the availability of cheap imported Arabica beans, the high price of Hawaii-grown green beans that roasters must pay is a strong incentive for counterfeiting. Table 1 An Incentive for Counterfeiting Brands Roasted Beans
($/lb as of August 2004)
Green Beans ($/lb, 2003 average)
Roasted-Green Price Ratio
1. Kona Coffee 22.35 7.82 2.9:1 2. Kauai Coffee 11.03 NA NA 3. Molokai Coffee 15.70 NA NA 4. Maui Coffee 11.73 NA NA 5. Peet’s Coffee 17.66 0.65 27.2:1 6. Seattle Best 12.25 0.65 18.8:1 7. Starbucks Colombia 12.96 0.65 19.9:1 8. Millstone 13.34 0.65 20.5:1 Notes: Prices of roasted beans are the un-weighted average retail prices prevailing in Hawaii as of August 2004; green bean prices for non-Hawaii-grown brands are whole-year average prices of Colombian Mild Arabica (CMA) coffee prevailing in international markets; Kona Coffee green bean price is the weighted average export price. The actual prices of green beans roasters of non-Hawaii-grown brands paid could be slightly higher than those in the table. Since specialty coffees are produced from Arabica varieties, the price of CMA green coffee, the highest among all coffees sold in the international market, is the closest base-price roasters would have to pay to obtain green beans.
Could CMA bean average price plunges have contributed to the 1990 crash? Price data do not show an immediate link between these two prices. In 1987, the CMA price dropped 53%, from $2.20 to $1.03 per pound, while the Kona Coffee price dropped only 7%. The CMA price dropped further in the next two consecutive years, but the Kona Coffee price rose 22% and 21% in the same years. Nonetheless, the Kona Coffee price crashed in 1990. The CMA price declined further the next two consecutive years and reached $0.68 per pound in 1992. Could a 50% increase in the industry’s total marketing amount of parchment, from 2.0 to 3.07 million pounds, between 1988 and 1989 have contributed to the 1990 price collapse? An increase of a greater magnitude in the marketing amount of parchment prior to that did not cause the price to fall as it did in 1990. Between 1982 and 1983, an increase of 183% in the industry’s total production, from 0.99 to 2.80 million pounds, did not cause the price to fall. Instead, the price increased continually until 1986. Similarly, a 62% increase in the industry’s total marketing amount, from 1.85 to 3.00 million pounds, between 1985 and 1986, did not cause the price to fall in that year. Thus, while a one-season increase in the marketing amount in 1989 may have produced a short run downward pressure on price, it could not have contributed to the crash. The export price of Hawaii green beans also plunged over the same period but was much more severe and lasted over a longer period than that of parchment, as illustrated in Figure 3. A spike in HI Green from $1.22 in 1995 to $18.41 per pound in 1997 is extremely unusual price
Hawaii’s Coffee Industry: Structural Change and Its Effects on Farm Operations Hawaii Department of Agriculture
7
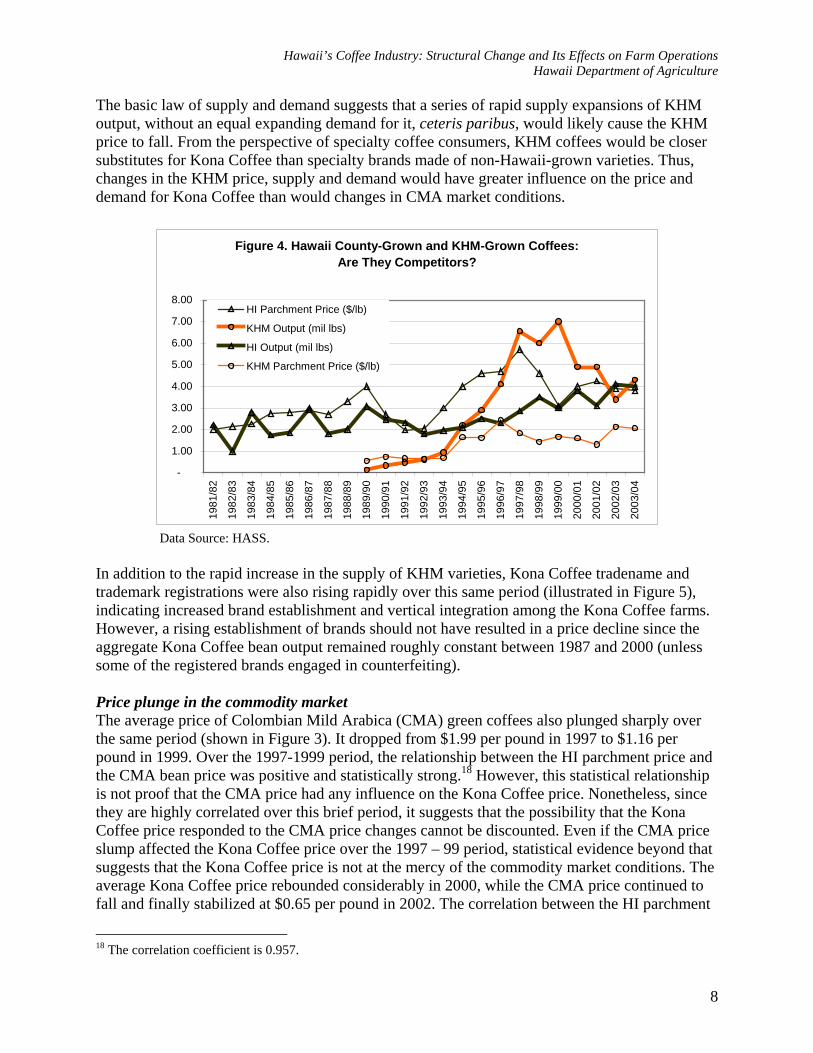
behavior.12 It was a direct result of a buying panic among processors and roasters (further explained in section 4.2).13 4.2. The second crash (1998 - 2000) The Kona Coffee price crashed again after the 1997/98 harvesting season. The price collapse lasted two years before it rebounded. The parchment price plunged from $5.70 in 1997/98 season to $4.60 and to $3.10 in the 1998/99 and 1999/2000 seasons, respectively. The explanation for this event is less obvious than for the early 1990 crash. Three possible contributors are identified: counterfeiting, increasing competition within Hawaii’s own industry, and a plunging CMA price. Counterfeiting Before the crash, there was a sudden parchment price jump by 21% between 1996 and 1997, from $4.70 to $5.70 per pound, when the Kona Coffee counterfeiting scandal was made public. The cause of the price jump, according to a major Hawaii-based roaster, was a buying-rush by major processors and roasters for fear that real Kona Coffee might be in short supply as a result of the lawsuit.14 However, the price spike reached the retail market beyond a level needed to clear the market and worked its way back towards the processors and roasters. For convenience, call this phenomenon a market-rush reversal effect. Consequently, the purchase of green beans and cherries froze in November of 1997, suppressing bean, parchment and cherry prices. The Kona Coffee price was further depressed as some major Kona Coffee buyers that were on the list of defendants in a counterfeiting lawsuit decided to halt their purchases in retaliation to a group of farmers who initiated the lawsuit.15 Thus, counterfeit Kona Coffee was clearly a contributing factor to the 1998 Kona Coffee price crash. Industry internal competition In Figure 4, the average parchment price of Hawaii coffees grown outside of the Kona region (KHM Parchment Price) plunged during the 1997/98 harvesting season, one season before the Kona Coffee price (HI Parchment Price) did.16 This took place after the KHM output exploded 600% over four harvesting seasons from 1993/94 to 1997/98, which inevitably depressed its own price. The KHM Parchment Price declined from 243 cents/lb in the 1996/97 harvesting season to 183 cents/lb in the 1997/98 harvesting season and, again, to 143 cents/lb the following harvesting season. The Kona Coffee price rebounded 29% in the 2000/01 harvesting season while the KHM Parchment Price fluctuated and bottomed at 131 cents/lb in the 2001/02 harvesting season.17
12 Export data shows a zero value for 1996. The 1996 value in Figure 3 is the average of $1.22 and $18.41, used to connect the line. 13 It is worth mentioning that, in 1996, the direct export volume of roasted beans jumped by more than 263%, from 60,094 in 1995 to 218,408 pounds, when data shows zero export of green beans. This was mainly due to a surge in export to Korea and China. Nevertheless, according to the Census Bureau data, export to Korea has slowed down since then, and export to China lasted five years only (1994-98). 14 Among them were Hawaii Coffee Company and Hawaiian Isles Kona Coffee Company. 15 Among them were the well-known Starbuck’s, First Colony Coffee & Tea, and Gloria Jean’s Coffee. 16 KHM price and output are for coffees grown in Kauai, Honolulu, and Maui counties. Molokai is included in Maui. 17 A correlation test shows that KHM output and Kona Coffe price are negatively related, but statistically weak. The correlation coefficients measuring the relationship between KHM output and KHM Parchment Price and between KHM output and HI Parchment Price are –0.433 and –0.339, respectively.
Hawaii’s Coffee Industry: Structural Change and Its Effects on Farm Operations Hawaii Department of Agriculture
8
The basic law of supply and demand suggests that a series of rapid supply expansions of KHM output, without an equal expanding demand for it, ceteris paribus, would likely cause the KHM price to fall. From the perspective of specialty coffee consumers, KHM coffees would be closer substitutes for Kona Coffee than specialty brands made of non-Hawaii-grown varieties. Thus, changes in the KHM price, supply and demand would have greater influence on the price and demand for Kona Coffee than would changes in CMA market conditions.
Figure 4. Hawaii County-Grown and KHM-Grown Coffees:Are They Competitors?
-
1.00
2.00
3.00
4.00
5.00
6.00
7.00
8.00
1981
/82
1982
/83
1983
/84
1984
/85
1985
/86
1986
/87
1987
/88
1988
/89
1989
/90
1990
/91
1991
/92
1992
/93
1993
/94
1994
/95
1995
/96
1996
/97
1997
/98
1998
/99
1999
/00
2000
/01
2001
/02
2002
/03
2003
/04
HI Parchment Price ($/lb)
KHM Output (mil lbs)
HI Output (mil lbs)
KHM Parchment Price ($/lb)
Data Source: HASS.
In addition to the rapid increase in the supply of KHM varieties, Kona Coffee tradename and trademark registrations were also rising rapidly over this same period (illustrated in Figure 5), indicating increased brand establishment and vertical integration among the Kona Coffee farms. However, a rising establishment of brands should not have resulted in a price decline since the aggregate Kona Coffee bean output remained roughly constant between 1987 and 2000 (unless some of the registered brands engaged in counterfeiting). Price plunge in the commodity market The average price of Colombian Mild Arabica (CMA) green coffees also plunged sharply over the same period (shown in Figure 3). It dropped from $1.99 per pound in 1997 to $1.16 per pound in 1999. Over the 1997-1999 period, the relationship between the HI parchment price and the CMA bean price was positive and statistically strong.18 However, this statistical relationship is not proof that the CMA price had any influence on the Kona Coffee price. Nonetheless, since they are highly correlated over this brief period, it suggests that the possibility that the Kona Coffee price responded to the CMA price changes cannot be discounted. Even if the CMA price slump affected the Kona Coffee price over the 1997 – 99 period, statistical evidence beyond that suggests that the Kona Coffee price is not at the mercy of the commodity market conditions. The average Kona Coffee price rebounded considerably in 2000, while the CMA price continued to fall and finally stabilized at $0.65 per pound in 2002. The correlation between the HI parchment
18 The correlation coefficient is 0.957.
Hawaii’s Coffee Industry: Structural Change and Its Effects on Farm Operations Hawaii Department of Agriculture
9
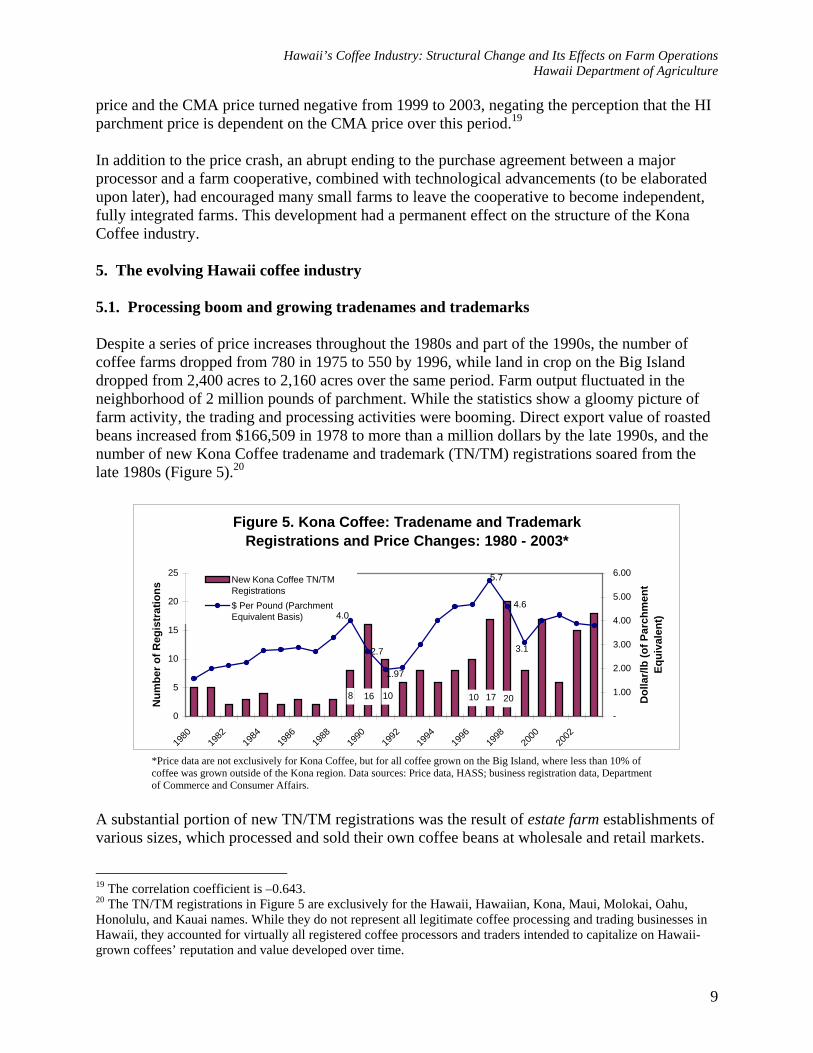
price and the CMA price turned negative from 1999 to 2003, negating the perception that the HI parchment price is dependent on the CMA price over this period.19 In addition to the price crash, an abrupt ending to the purchase agreement between a major processor and a farm cooperative, combined with technological advancements (to be elaborated upon later), had encouraged many small farms to leave the cooperative to become independent, fully integrated farms. This development had a permanent effect on the structure of the Kona Coffee industry. 5. The evolving Hawaii coffee industry 5.1. Processing boom and growing tradenames and trademarks Despite a series of price increases throughout the 1980s and part of the 1990s, the number of coffee farms dropped from 780 in 1975 to 550 by 1996, while land in crop on the Big Island dropped from 2,400 acres to 2,160 acres over the same period. Farm output fluctuated in the neighborhood of 2 million pounds of parchment. While the statistics show a gloomy picture of farm activity, the trading and processing activities were booming. Direct export value of roasted beans increased from $166,509 in 1978 to more than a million dollars by the late 1990s, and the number of new Kona Coffee tradename and trademark (TN/TM) registrations soared from the late 1980s (Figure 5).20
Figure 5. Kona Coffee: Tradename and Trademark Registrations and Price Changes: 1980 - 2003*
10 17 20108 16
4.6
3.1
5.7
1.97
2.7
4.0
0
5
10
15
20
25
1980
1982
1984
1986
1988
1990
1992
1994
1996
1998
2000
2002
Num
ber o
f Reg
istr
atio
ns
-
1.00
2.00
3.00
4.00
5.00
6.00
Dol
lar/l
b (o
f Par
chm
ent
Equi
vale
nt)
New Kona Coffee TN/TMRegistrations$ Per Pound (ParchmentEquivalent Basis)
*Price data are not exclusively for Kona Coffee, but for all coffee grown on the Big Island, where less than 10% of coffee was grown outside of the Kona region. Data sources: Price data, HASS; business registration data, Department of Commerce and Consumer Affairs.
A substantial portion of new TN/TM registrations was the result of estate farm establishments of various sizes, which processed and sold their own coffee beans at wholesale and retail markets.
19 The correlation coefficient is –0.643. 20 The TN/TM registrations in Figure 5 are exclusively for the Hawaii, Hawaiian, Kona, Maui, Molokai, Oahu, Honolulu, and Kauai names. While they do not represent all legitimate coffee processing and trading businesses in Hawaii, they accounted for virtually all registered coffee processors and traders intended to capitalize on Hawaii-grown coffees’ reputation and value developed over time.
Hawaii’s Coffee Industry: Structural Change and Its Effects on Farm Operations Hawaii Department of Agriculture
10
The relatively rapid increase in the number of TN/TM registrations in the 1990s (Figure 5) is a reflection of the growing number of small Kona Coffee farms becoming fully integrated in all stages of production. This was driven by several factors. In the late 1980s, the emergence of new technologies enabled small farmers to process, package, and mail deliver their own roasted beans to the final consumers. Furthermore, the abrupt ending of the purchase contract between a considerably large processor and a cooperative of Kona Coffee farms (as described in section 4.1) encouraged many Kona Coffee farmers to leave the cooperative and become independent. In all, Hawaii’s coffee industry was undergoing major structural changes. The industry was moving from an industry resembling a monopsony, comprised of a large number of producers/sellers and a single large buyer, to a monopolistic competition characterized by many producers/sellers emphasizing on product differentiation (in this case, brand development) as a method of competition. In effect, the marketing of Kona Coffee had become more diversified. 5.2. Farm activity expansion across islands with growing island brands While the processing business was booming, bean production on the Big Island did not grow to match the growing demand. Relatively large estate coffee farms thus emerged on the islands of Maui, Molokai, Oahu and Kauai to fill the supply gap. Planting in the new regions began in the late 1980s and grew rapidly. By 1990, land in crop in the new regions exceeded that of the Big Island. Significant farm output in the new region began in the 1994/95 harvesting season, when it surpassed that of the Big Island. Nevertheless, from 1997, farming activity and output on the Big Island grew as the number of farms and land in crop both grew. In the 2003/04 harvesting season, HASS estimated that aggregate farm output statewide was 8.3 million pounds of parchment coffee equivalent, with a combined sale value of approximately $24.07 million.21 Using HASS’s parchment estimate, the aggregate output values for green and roasted beans are estimated at $55.6 million (wholesale value) and $84.9 million (retail value), respectively.22 Although coffee grown on the Big Island, for which approximately 90% was Kona Coffee, made up 48% of the state’s total farm output, its parchment sale value accounted for more than 63% of the state’s aggregate. Brand names of Hawaii-grown coffee, which are associated with the location of origin, have grown rapidly since the late 1980s. In addition to the well-established name of Kona Coffee, which experienced rapid growth in TN/TM registration, the industry now has Kauai, Maui, Molokai, Oahu, Hawaii, Hawaiian, and Honolulu coffee brands. In July 2004 there were 110 TN/TM registrations with names indicating that beans were grown in Hawaii, which maintained an “active” status (Table 2). Among them, 67 TNs/TMs indicate Kona Coffee.23 Between 1980 and July 2004, there were in total 300 TN/TM-registered coffee processing and trading
21 These are HASS’s revised estimates. 22 Author’s rough estimates; they are the aggregate values of green and roasted beans of various bean grades (Pea berry-5%, Extra Fancy-20%, Fancy-30%, Number 1-30% and Prime-10%) and types (Kona Coffee and other Hawaii-grown varieties). Beans below Prime grade, 5% of total, are excluded from the estimation. Green and roasted bean volume estimations are respectively based on 20% and 17% weight loss after conversion at each stage. Prices used are the un-weighted average of prices for each grade and type surveyed in July 2004 from multi-sources. The average retail price includes discount prices. 23 The number of “active” registrations does not accurately reflect the number of businesses actually in operation, as some businesses remained in operation while their registrations appeared expired.
Hawaii’s Coffee Industry: Structural Change and Its Effects on Farm Operations Hawaii Department of Agriculture
11
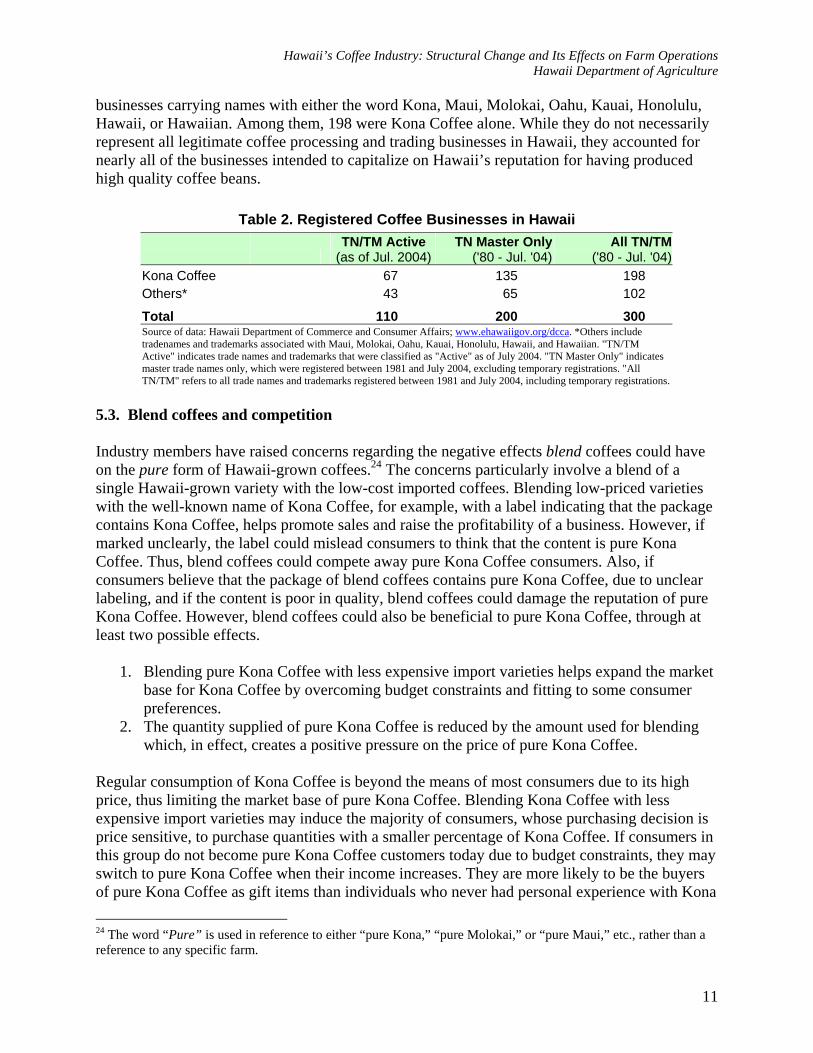
businesses carrying names with either the word Kona, Maui, Molokai, Oahu, Kauai, Honolulu, Hawaii, or Hawaiian. Among them, 198 were Kona Coffee alone. While they do not necessarily represent all legitimate coffee processing and trading businesses in Hawaii, they accounted for nearly all of the businesses intended to capitalize on Hawaii’s reputation for having produced high quality coffee beans.
Table 2. Registered Coffee Businesses in Hawaii
TN/TM Active
(as of Jul. 2004)TN Master Only
('80 - Jul. '04)All TN/TM
('80 - Jul. '04)Kona Coffee 67 135 198 Others* 43 65 102
Total 110 200 300 Source of data: Hawaii Department of Commerce and Consumer Affairs; www.ehawaiigov.org/dcca. *Others include tradenames and trademarks associated with Maui, Molokai, Oahu, Kauai, Honolulu, Hawaii, and Hawaiian. "TN/TM Active" indicates trade names and trademarks that were classified as "Active" as of July 2004. "TN Master Only" indicates master trade names only, which were registered between 1981 and July 2004, excluding temporary registrations. "All TN/TM" refers to all trade names and trademarks registered between 1981 and July 2004, including temporary registrations.
5.3. Blend coffees and competition Industry members have raised concerns regarding the negative effects blend coffees could have on the pure form of Hawaii-grown coffees.24 The concerns particularly involve a blend of a single Hawaii-grown variety with the low-cost imported coffees. Blending low-priced varieties with the well-known name of Kona Coffee, for example, with a label indicating that the package contains Kona Coffee, helps promote sales and raise the profitability of a business. However, if marked unclearly, the label could mislead consumers to think that the content is pure Kona Coffee. Thus, blend coffees could compete away pure Kona Coffee consumers. Also, if consumers believe that the package of blend coffees contains pure Kona Coffee, due to unclear labeling, and if the content is poor in quality, blend coffees could damage the reputation of pure Kona Coffee. However, blend coffees could also be beneficial to pure Kona Coffee, through at least two possible effects.
1. Blending pure Kona Coffee with less expensive import varieties helps expand the market base for Kona Coffee by overcoming budget constraints and fitting to some consumer preferences.
2. The quantity supplied of pure Kona Coffee is reduced by the amount used for blending which, in effect, creates a positive pressure on the price of pure Kona Coffee.
Regular consumption of Kona Coffee is beyond the means of most consumers due to its high price, thus limiting the market base of pure Kona Coffee. Blending Kona Coffee with less expensive import varieties may induce the majority of consumers, whose purchasing decision is price sensitive, to purchase quantities with a smaller percentage of Kona Coffee. If consumers in this group do not become pure Kona Coffee customers today due to budget constraints, they may switch to pure Kona Coffee when their income increases. They are more likely to be the buyers of pure Kona Coffee as gift items than individuals who never had personal experience with Kona 24 The word “Pure” is used in reference to either “pure Kona,” “pure Molokai,” or “pure Maui,” etc., rather than a reference to any specific farm.
Hawaii’s Coffee Industry: Structural Change and Its Effects on Farm Operations Hawaii Department of Agriculture
12
Coffee. In addition, as Nakamoto (1989) pointed out, due to the heterogeneous nature of consumer preferences, while some consumers may prefer pure Kona Coffee, others prefer the taste of a Kona blend. For these reasons, relatively inexpensive coffee varieties imported to Hawaii for blending purposes would be complimentary to rather than competitive to Hawaii-grown coffees. Less expensive import varieties would be competitors of Hawaii-grown coffees in a (lower price range) market segment in which consumers are price sensitive, but Hawaii-grown coffees are sold in a (higher price range) market segment in which consumers are less price sensitive. That is, even if foreign imports were prohibited, the average consumers would still not purchase Kona Coffee due to high price. They will simply purchase more tea or a product which gives a similar experience to drinking coffee. Coffee drinkers are attracted to buy a Kona blend coffee because of the high quality reputation of the pure Kona Coffee. Thus, it would be illogical for a consumer who experienced a bad Kona blend to conclude that the pure Kona Coffee is bad based on that experience. Hence, the poor quality of a Kona blend cannot hurt the reputation of the pure Kona Coffee. However, if the package label misleads the consumer to believe that a package contains pure Kona Coffee, a poor quality Kona blend could damage the reputation and/or businesses of pure Kona Coffee brands. The same logic applies to all of the Hawaii-grown coffee brands. In short, the real problem is with labeling and not with blending. 5.4. Localization and product differentiation Hawaii’s coffee industry is characterized by localization and product differentiation with brands indicating the location in which the coffee beans were grown. A high concentration of small farms in an area known as the “Kona Coffee belt,” which covers an area approximately 20 miles by 2 miles, is a unique feature of Hawaii’s coffee industry. Based on the 2003 count, of the 715 coffee farms in the state, 690 of them were located on the Big Island alone, of which 85% was located in the Kona Coffee belt. The remaining were relatively large farms, located on Oahu, Kauai, Maui, and Molokai. While farms in the new regions are relatively large and mechanized, most farms in the Kona Coffee Belt are small, rain-fed farms with several acres. In Kona, the small farm size and hilly terrain in which orchards are grown limit mechanization and irrigation. Thus, mechanization and irrigation are low, and farming is labor intensive. A small number of farms have land in crop of more than 20 acres. Although coffee farms on the Big Island accounted for 95% of the total number of coffee farms in the state in 2003, together they accounted for only 49% of all land used for coffee plantation. In contrast, the Kauai Coffee brand is produced in a farm that is one of the world’s largest and most mechanized. It alone accounted for about one half of the entire industry’s land usage. Brand name development grew rapidly since the late 1980s as illustrated in Figure 5. Growth in brand development was largely the result of a growing number of independent farms that became more vertically integrated. Technological advancements in processing and packaging, as well as improved (postal) delivery services, were the major factors making vertical integration possible in the late 1980s. Another round of growth in new TN/TM registrations began in the late 1990s. This was also the result of a technological advancement, the internet, that enabled individual
Hawaii’s Coffee Industry: Structural Change and Its Effects on Farm Operations Hawaii Department of Agriculture
13
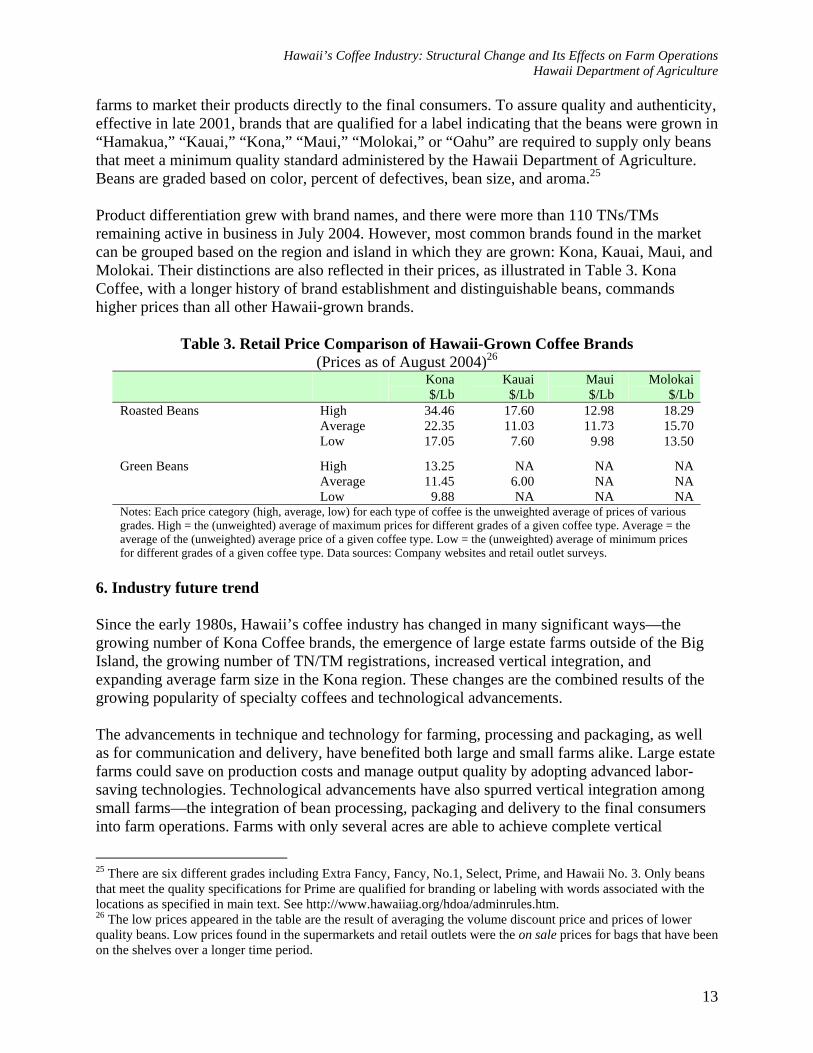
farms to market their products directly to the final consumers. To assure quality and authenticity, effective in late 2001, brands that are qualified for a label indicating that the beans were grown in “Hamakua,” “Kauai,” “Kona,” “Maui,” “Molokai,” or “Oahu” are required to supply only beans that meet a minimum quality standard administered by the Hawaii Department of Agriculture. Beans are graded based on color, percent of defectives, bean size, and aroma.25 Product differentiation grew with brand names, and there were more than 110 TNs/TMs remaining active in business in July 2004. However, most common brands found in the market can be grouped based on the region and island in which they are grown: Kona, Kauai, Maui, and Molokai. Their distinctions are also reflected in their prices, as illustrated in Table 3. Kona Coffee, with a longer history of brand establishment and distinguishable beans, commands higher prices than all other Hawaii-grown brands.
Table 3. Retail Price Comparison of Hawaii-Grown Coffee Brands (Prices as of August 2004)26
Kona $/Lb
Kauai $/Lb
Maui $/Lb
Molokai $/Lb
High 34.46 17.60 12.98 18.29 Average 22.35 11.03 11.73 15.70
Roasted Beans
Low 17.05 7.60 9.98 13.50
High 13.25 NA NA NA Average 11.45 6.00 NA NA
Green Beans
Low 9.88 NA NA NA Notes: Each price category (high, average, low) for each type of coffee is the unweighted average of prices of various grades. High = the (unweighted) average of maximum prices for different grades of a given coffee type. Average = the average of the (unweighted) average price of a given coffee type. Low = the (unweighted) average of minimum prices for different grades of a given coffee type. Data sources: Company websites and retail outlet surveys.
6. Industry future trend Since the early 1980s, Hawaii’s coffee industry has changed in many significant ways—the growing number of Kona Coffee brands, the emergence of large estate farms outside of the Big Island, the growing number of TN/TM registrations, increased vertical integration, and expanding average farm size in the Kona region. These changes are the combined results of the growing popularity of specialty coffees and technological advancements. The advancements in technique and technology for farming, processing and packaging, as well as for communication and delivery, have benefited both large and small farms alike. Large estate farms could save on production costs and manage output quality by adopting advanced labor-saving technologies. Technological advancements have also spurred vertical integration among small farms—the integration of bean processing, packaging and delivery to the final consumers into farm operations. Farms with only several acres are able to achieve complete vertical
25 There are six different grades including Extra Fancy, Fancy, No.1, Select, Prime, and Hawaii No. 3. Only beans that meet the quality specifications for Prime are qualified for branding or labeling with words associated with the locations as specified in main text. See http://www.hawaiiag.org/hdoa/adminrules.htm. 26 The low prices appeared in the table are the result of averaging the volume discount price and prices of lower quality beans. Low prices found in the supermarkets and retail outlets were the on sale prices for bags that have been on the shelves over a longer time period.
Hawaii’s Coffee Industry: Structural Change and Its Effects on Farm Operations Hawaii Department of Agriculture
14
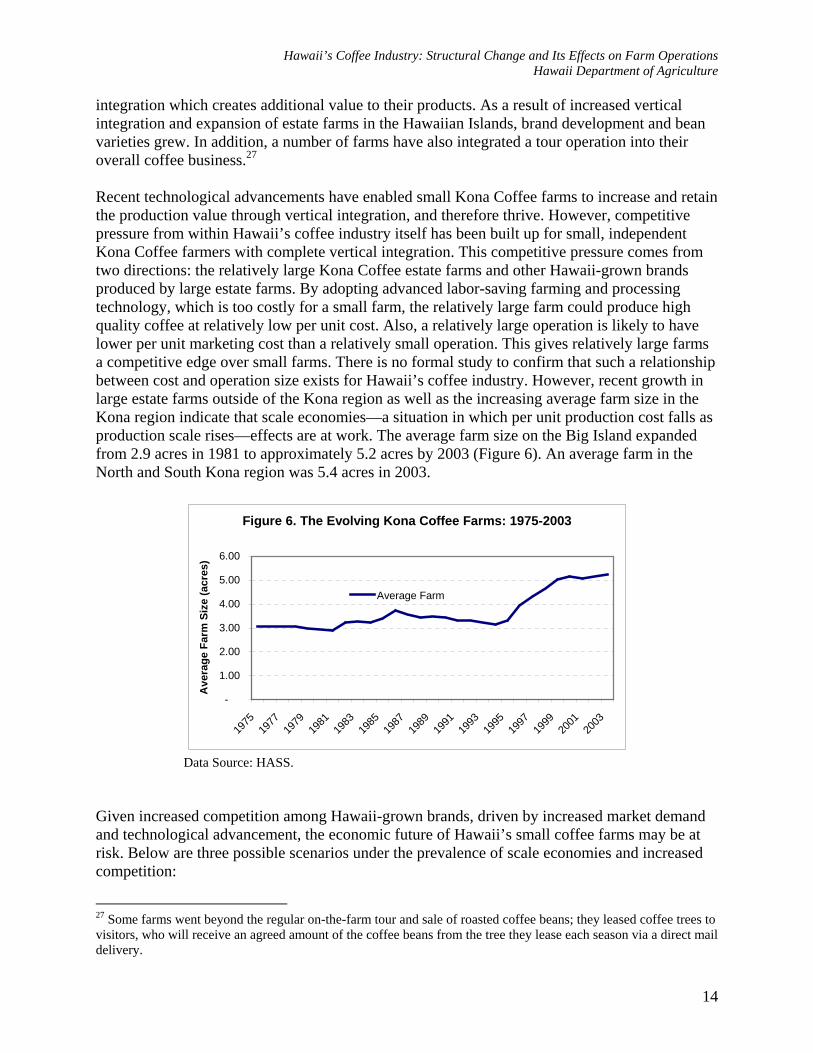
integration which creates additional value to their products. As a result of increased vertical integration and expansion of estate farms in the Hawaiian Islands, brand development and bean varieties grew. In addition, a number of farms have also integrated a tour operation into their overall coffee business.27 Recent technological advancements have enabled small Kona Coffee farms to increase and retain the production value through vertical integration, and therefore thrive. However, competitive pressure from within Hawaii’s coffee industry itself has been built up for small, independent Kona Coffee farmers with complete vertical integration. This competitive pressure comes from two directions: the relatively large Kona Coffee estate farms and other Hawaii-grown brands produced by large estate farms. By adopting advanced labor-saving farming and processing technology, which is too costly for a small farm, the relatively large farm could produce high quality coffee at relatively low per unit cost. Also, a relatively large operation is likely to have lower per unit marketing cost than a relatively small operation. This gives relatively large farms a competitive edge over small farms. There is no formal study to confirm that such a relationship between cost and operation size exists for Hawaii’s coffee industry. However, recent growth in large estate farms outside of the Kona region as well as the increasing average farm size in the Kona region indicate that scale economies—a situation in which per unit production cost falls as production scale rises—effects are at work. The average farm size on the Big Island expanded from 2.9 acres in 1981 to approximately 5.2 acres by 2003 (Figure 6). An average farm in the North and South Kona region was 5.4 acres in 2003.
Figure 6. The Evolving Kona Coffee Farms: 1975-2003
-
1.00
2.00
3.00
4.00
5.00
6.00
1975
1977
1979
1981
1983
1985
1987
1989
1991
1993
1995
1997
1999
2001
2003
Ave
rage
Far
m S
ize
(acr
es)
Average Farm
Data Source: HASS.
Given increased competition among Hawaii-grown brands, driven by increased market demand and technological advancement, the economic future of Hawaii’s small coffee farms may be at risk. Below are three possible scenarios under the prevalence of scale economies and increased competition:
27 Some farms went beyond the regular on-the-farm tour and sale of roasted coffee beans; they leased coffee trees to visitors, who will receive an agreed amount of the coffee beans from the tree they lease each season via a direct mail delivery.
Hawaii’s Coffee Industry: Structural Change and Its Effects on Farm Operations Hawaii Department of Agriculture
15
1. Larger farms dominate: With increased competition from foreign specialty coffees and
other Hawaii-grown brands, Kona Coffee estate farms are forced to lower their prices to a point below the breakeven point for small farms but still at a profitable level for relatively large Kona Coffee farms. Eventually, small farms with complete vertical integration would vanish, and a few large estate farms would gain more control of the supply of Kona Coffee. Two types of small farms may continue to exist. The first type is comprised of small farms that are able to retain niche markets. These are farms with well-established brands and strong marketing systems. The second type is made up of family farms, which do not operate purely based on business decisions and either sell cherry or parchment to large processing and marketing firms. However, the remaining small farms will remain vulnerable to market shocks. With larger financial reserves, large farms will be in a better position to withstand the recurrence of market shocks. Thus, there would be a tendency for the average size of the Kona Coffee farm to expand.
2. Coexistence of large and small independent farms: If competition is limited and if
incorporating small farms would not raise the total operation’s profit, large estate farms would not have the economic incentive to price small farms out of the market. Instead, there may be economic incentives for the relatively large Kona Coffee estate farms to maintain high prices and allow small, high-cost farms to be profitable. Without strong competitive pressure from other specialty coffee brands, it may be in the best interest of the relatively large Kona Coffee estate farms to maintain high prices and enjoy higher profit margins than small farms.
3. Coexistence of large farms and cooperatives of small farms: In response to competitive
pressure, small farms may band together in a cooperative to save on input costs from volume discounts for bulk purchases, processing and marketing costs. The success will depend on the efficiency in the cooperative management. Under this situation, small farms could improve their chance to withstand competitive pressures and possible market shocks.
Although the growing trend of average farm size is expected to continue as competition increases in favor of the relatively large operations, it is inconclusive how exactly the industry will evolve. If economies of scale is strong, only farms large enough to economize on input and marketing costs will have the capability to withstand the increasing competitive pressure and price fluctuations. However, if market differentiation (brand loyalty) is strong enough, outweighing the scale economies effect, numerous small and fully integrated farms will continue to thrive. Profitability per farm depends on per unit cost and the percentage distribution of high and low grades of coffee produced, since high-grade beans can be sold at a higher price than low-grade beans. Percent distribution of bean grades from the same orchard variety varies from farm to farm depending on a number of natural factors and farm practices. Thus, two farms with identical land quality and size producing the same amount of output in total weight may not be equally productive, in terms of total output value. If a small farm, which is more labor-intensive, produces a higher share of high-grade beans than a large farm, the relatively high cost small farm could still be competitive.
Hawaii’s Coffee Industry: Structural Change and Its Effects on Farm Operations Hawaii Department of Agriculture
16
A small, handpicked family farm, through closer supervision or owner’s care, could produce higher quality beans than a larger and more mechanized farm. However, the availability of a technology that can sort berries based on their color means that a machine can select quality berries instead of the traditional method of relying on human eyes. Although human eyes may still be able to do a better job in berry selection than machine could, this technology helps close the quality gap between coffee beans produced by small, handpicked farms and those produced by large, mechanized farms. While a coffee connoisseur may be able to taste the difference the coffee produced by a small, handpicked family farm from that of the same variety produced by a large and mechanized farm, an average coffee consumer is less likely to be able to tell the difference. Also, consumers are generally willing to trade off to a certain point between quality and savings. Thus, recent developments suggest that, to survive, small coffee farmers may need to either work hard to maintain a market niche or join the cooperative to economize on input, processing and marketing costs. To better envisage the future of Hawaii’s coffee farms, a low-cost survey using emails and faxes was attempted in August 2004, but the result was inconclusive due to a low number of responses.28 Nonetheless, aside from the questions asked in the form, the survey found an example of cost associated with processing, which put small farmers/processors at a disadvantage. Wet milling is a popular method for processing coffee cherries, but the milling process produces septic waste, which could cause environmental hazard. Currently, the Hawaii State Department of Health (DOH), the responsible state agency, does not have available standards for the design and construction of septic treatment facilities for coffee processing waste. Thus, each farm owner is required to come up with their own design to meet the DOH’s requirements, which could cost thousands of dollars in addition to the $1,000 filing fee. The problem that exists not only places more financial burden on small farms than large farms, it may encourage processing practices unsafe to the environment and human health. 7. Conclusion A surge in the world coffee price in 1975 ended a decade-and-a-half long industry decline. A combination of growing demand for specialty coffee in the 1980s and technological advancements enabled an increasing number of small Kona Coffee farm operations to become fully integrated. This led to rapid growth in Hawaii’s coffee industry, with a growing number of brands and commercial farm establishments across the Hawaiian Islands. Between 1975 and 1989, industry growth was dominated by price increases; sale value increased 791% while aggregate parchment output volume increased only 72%. However, from 1989 to 2003, growth was dominated by output increases, especially due to Kauai Coffee’s astronomical output expansion of 600% between 1994 and 1998. Over this period, aggregate sale value and aggregate parchment output volume increased 88% and 172%, respectively. Divergence of the Hawaii-grown coffee price from the world commodity price began in the late 1970s, with the average Kona Coffee price rising above the average Colombian Mild Arabica (CMA) price. Although the Kona Coffee price was set, through a negotiated agreement between 28 The survey was short as it was intended for use as supplemental data with the already available data from various sources for estimating operation cost of farms of various sizes producing the same coffee variety.
Hawaii’s Coffee Industry: Structural Change and Its Effects on Farm Operations Hawaii Department of Agriculture
17
a farmers’ cooperative and the processing firm, based on the CMA price prevailing in the world market, statistical results suggest that the average Kona Coffee price movements over 1976 and 2003 were not depending on the average CMA price changes. The rapid Kona Coffee price increase induced counterfeiting operations, which led to two price crashes in the 1990s, causing a large number of Kona Coffee farms to leave the cooperative and become independent, fully integrated farms. This marked a considerable change in the industry structure. In effect, the market of Kona Coffee became diversified, and its price became increasingly more independent of conditions in the world commodity market. Nevertheless, a substantial and lasting decline in the CMA bean price traded in the world commodity market still could influence the price of Hawaii-grown coffees. Competition has grown from within Hawaii’s coffee industry, as Hawaii-grown brands grew, and from imported specialty coffees. Statistics hint that Hawaii-internal industry competition, in particular an explosive 600% output growth of the Kauai Coffee brand between 1994 and 1998, may have partially contributed to the second Kona Coffee price crash in the late 1990s. The growing average farm size in the Kona District, where 82% (2003) of Hawaii’s coffee farm operations were located, most notably since 1994, is an indication that economies of scale may be at work. The trend is expected to continue as competition increases in favor of the relatively large operations. Nonetheless, it is inconclusive how exactly the industry will evolve. If economies of scale is strong, only farms large enough to economize on input and marketing costs will have the capability to withstand the increasing competitive pressure and price fluctuations. However, if market differentiation (brand loyalty) is strong enough, outweighing the scale economies effect, numerous small and fully integrated farms will continue to thrive. In a highly competitive market, only farms with a well-established niche market and a strong marketing system are likely to continue to exist as fully integrated farms. The future of small farms depends on their ability to develop and maintain a niche market, or band together in an effective cooperative or any business entity that could lower their production and distribution costs. The part-time, “gentlemen” farms will continue to exist as long as land cost remains relatively low. Cooperation between industry members in production and marketing to prevent oversupply and possibly destructive competition is necessary to assure the economic viability of the industry. Cooperation in marketing campaigns can be strengthened through the Hawaii Coffee Association. Production cooperation in order to prevent the too rapid expansion of any particular variety or brand (e.g., Kona, Kauai, Molokai, etc.) could also be possible through the existing cooperatives and professional coffee associations. Uncontrolled counterfeit coffee operations can cause crises similar to those that occurred in the early and late 1990s. Inadequate enforcement of measures put in place to curtail counterfeiting operations could leave the industry vulnerable. To strengthen the enforcement of laws meant to curtail counterfeiting operations, the industry needs to be active in monitoring, while government needs to have an adequate capacity to respond to reports and enforce the law.
Hawaii’s Coffee Industry: Structural Change and Its Effects on Farm Operations Hawaii Department of Agriculture
18
References HASS, Hawaii Coffee, a biannual report, various issues, Department of Agriculture, State of
Hawaii. HASS, Statistics of Hawaii Agriculture, various issues, Department of Agriculture, State of
Hawaii. Hawaii Department of Agriculture. http://www.hawaiiag.org/hdoa/adminrules.htm. Hawaii Department of Commerce and Consumer Affairs. www.ehawaiigov.org/dcca. Bittenbender, H. C., et al. (August 1990). “Coffee Industry Analysis Number 3,” Agricultural
Industry Analysis: The Status, Potential, and Problems of Hawaiian Crops. Submitted to the Governor’s Agriculture Coordinating Committee. College of Tropical Agriculture and Human Resources, University of Hawaii-Manoa.
International Coffee Organization. http://www.ico.org/. Nakamoto, T. Stuart, and John M. Halloran (July 1989). The Markets and Marketing Issues of
the Kona Coffee Industry. College of Tropical Agriculture and Human Resources, University of Hawaii.
Southichack, M. (September 2004). Hawaii’s Coffee Industry: Market Outlook. Hawaii Department of Agriculture.
Survey (Market Price, July 2004). Various company websites and retail outlets. U.S. Census Bureau. U.S. exports of coffee departing Customs district of Hawaii for years 1978
through 2003. Department of Commerce.