haves, halves, and have-nots: school libraries and student...
TRANSCRIPT
Haves, Halves, and Have-nots: School Libraries and
Student Achievement in California
D A htDoug AchtermanCSLA
Southern Section ConferenceSouthern Section ConferenceMarch, 2009
http://www.sbhsd.k12.ca.us/sbhslib/library.htm
http://caschoollibraries pbwiki comhttp://caschoollibraries.pbwiki.com

Self-reflection
What single2
What singleservice or activity ydo you perform h ibthat contributes
most to student most to student achievement?

Self-refection…
1. A program of curriculum integrated
3
5. Collaboration with h d l curriculum-integrated
information literacy instruction.
teachers to develop, implement, and evaluate student instruction.
2. Informally instruction in the use of resources.
evaluate student learning
6. Reference assistance
3. Workshops for teachers.
7. Reading, listening, and viewing guidance for
4. School curriculum committee
students.8. Instruction on Internet
searching and researchrecommendations searching and research
Evidence
What evidence can
4
What evidence can you provide to people outside your people outside your school community that shows how this that shows how this service makes a difference to student d e e ce to stude t achievement?

The Plan…
A little bit of history
5
A little bit of history
Review results from CA study
Select a ie “high impact” ser ices for more Select a view “high impact” services for more focus
l f h h iGenerate examples of what those services look like from school to school
Brainstorm measurements
Homework

Students per LMS
59656
5000
6000
4363 Utah
3000
4000
1650
1000
2000
312
0
North Utah California California D k t ( st) ( th) ( th) Dakota (1st) (49th) 2003 (50th) 2007
Everhart, 2003; CA Dept. of Education, 2007
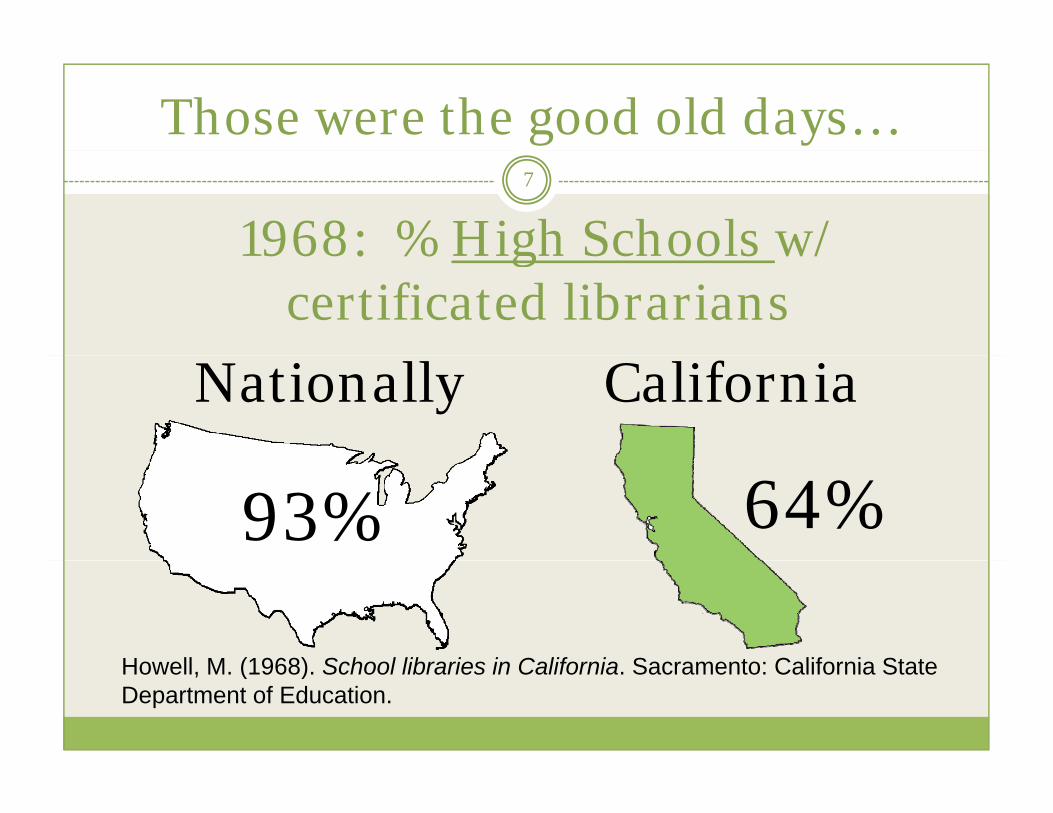
Those were the good old days…7
1968: % High Schools w/ 1968: % High Schools w/ certificated librarians
Nationally California
93% 64%
Howell M (1968) School libraries in California Sacramento: California StateHowell, M. (1968). School libraries in California. Sacramento: California State Department of Education.
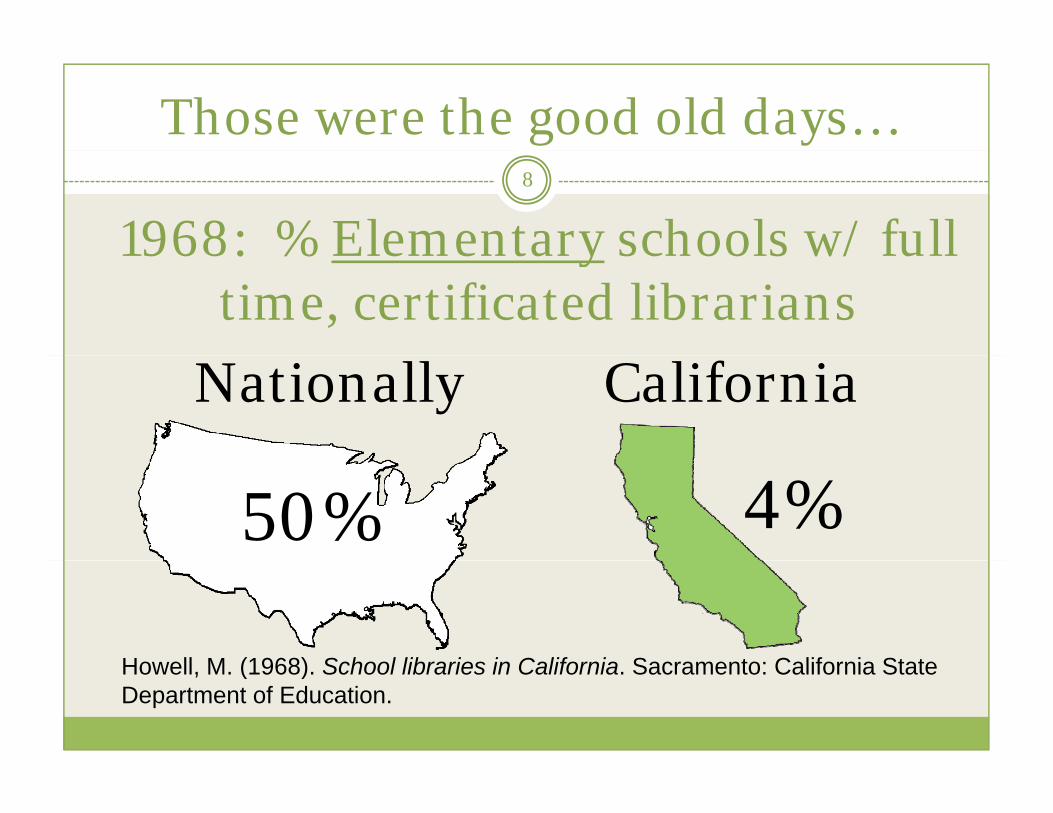
Those were the good old days…8
1968: % Elementary schools w/ full 1968: % Elementary schools w/ full time, certificated librarians
Nationally California
50% 4%
Howell M (1968) School libraries in California Sacramento: California StateHowell, M. (1968). School libraries in California. Sacramento: California State Department of Education.
Those were the good old days…9
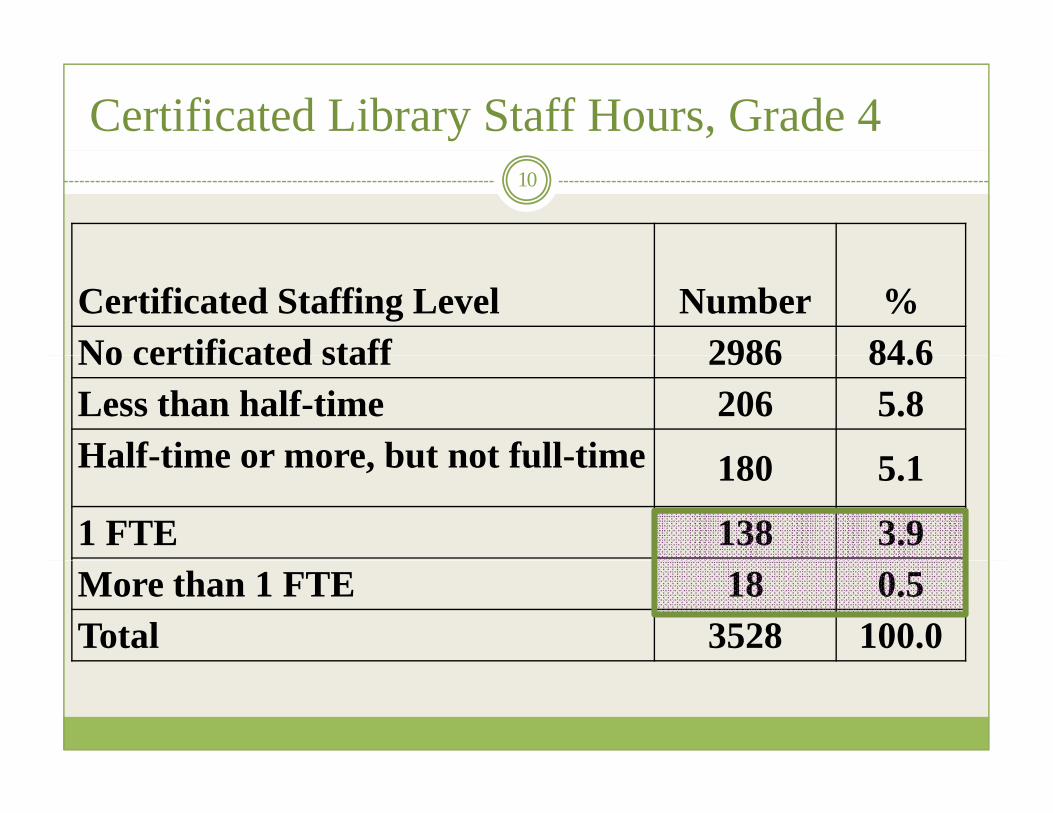
Certificated Library Staff Hours, Grade 4 10
Certificated Staffing Level Number %No certificated staff 2986 84 6No certificated staff 2986 84.6Less than half-time 206 5.8Half-time or more but not full-time 180 5 1Half-time or more, but not full-time 180 5.1
1 FTE 138 3.9More than 1 FTE 18 0.5Total 3528 100.0
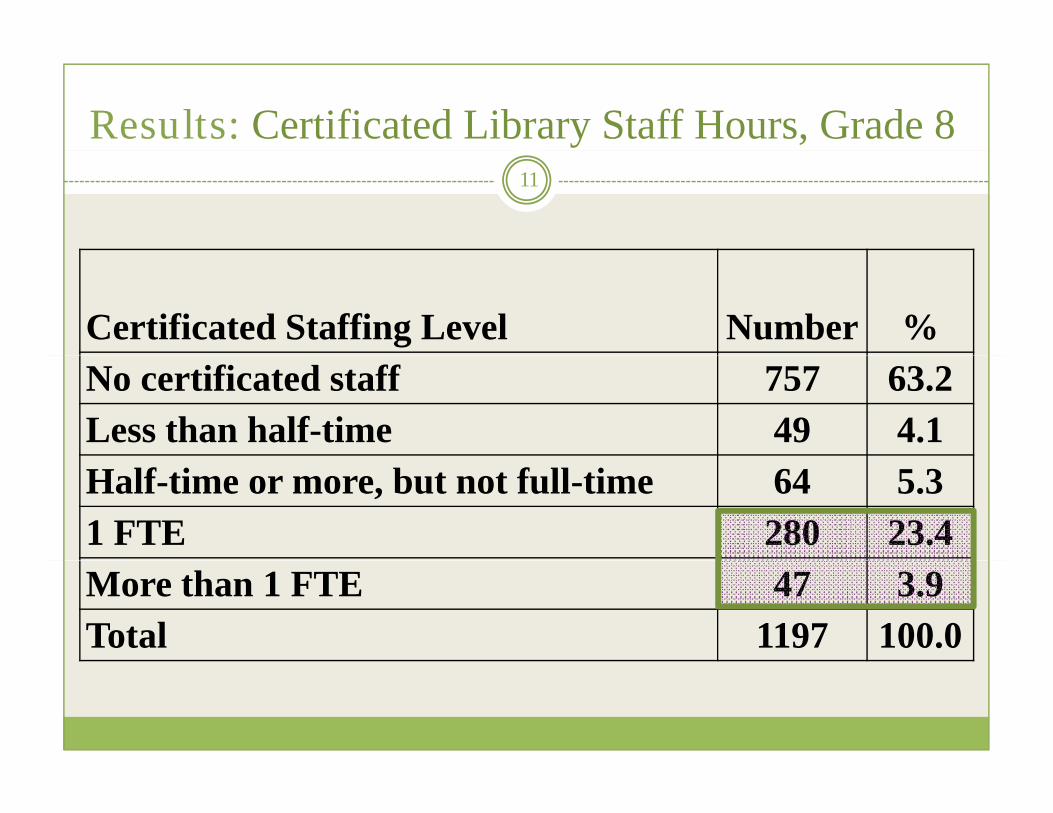
Results: Certificated Library Staff Hours, Grade 8 11
Certificated Staffing Level Number %No certificated staff 757 63.2Less than half-time 49 4.1Half-time or more, but not full-time 64 5.31 FTE 280 23.4More than 1 FTE 47 3.9Total 1197 100.0
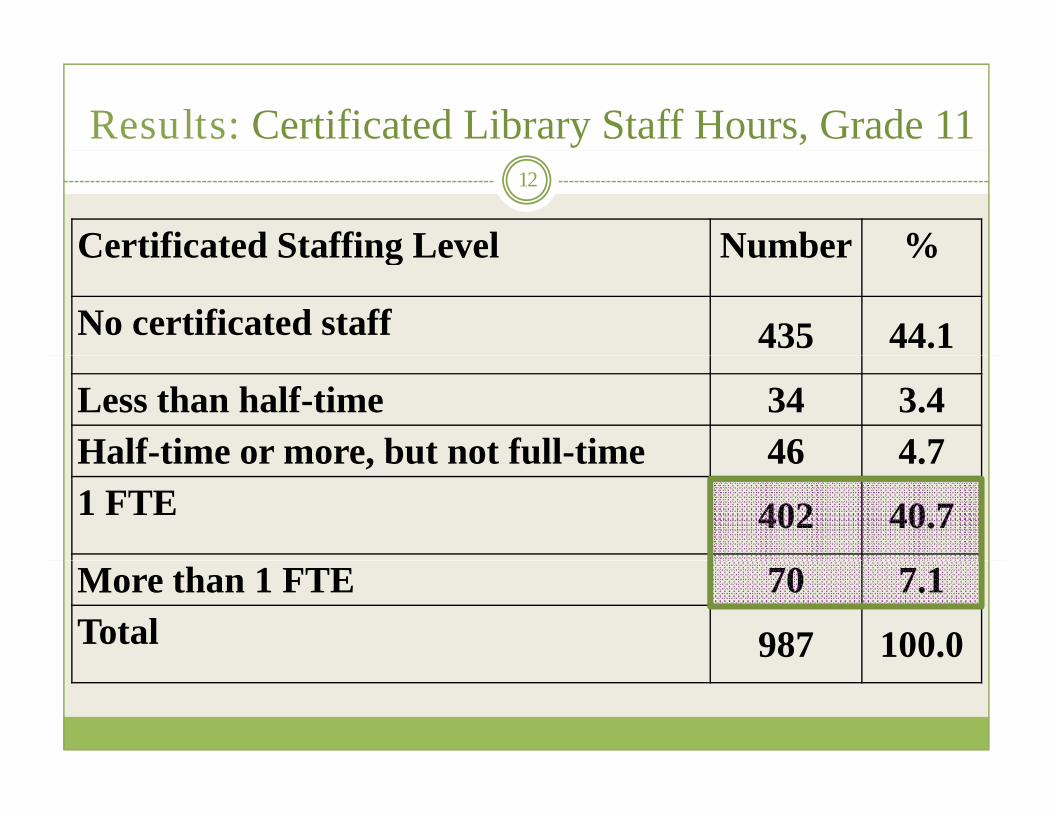
Results: Certificated Library Staff Hours, Grade 11
Certificated Staffing Level Number %
12
Certificated Staffing Level Number %
No certificated staff 435 44.1
Less than half-time 34 3.4Half-time or more, but not full-time 46 4.7Half time or more, but not full time 46 4.71 FTE 402 40.7
More than 1 FTE 70 7.1Total 987 100.0
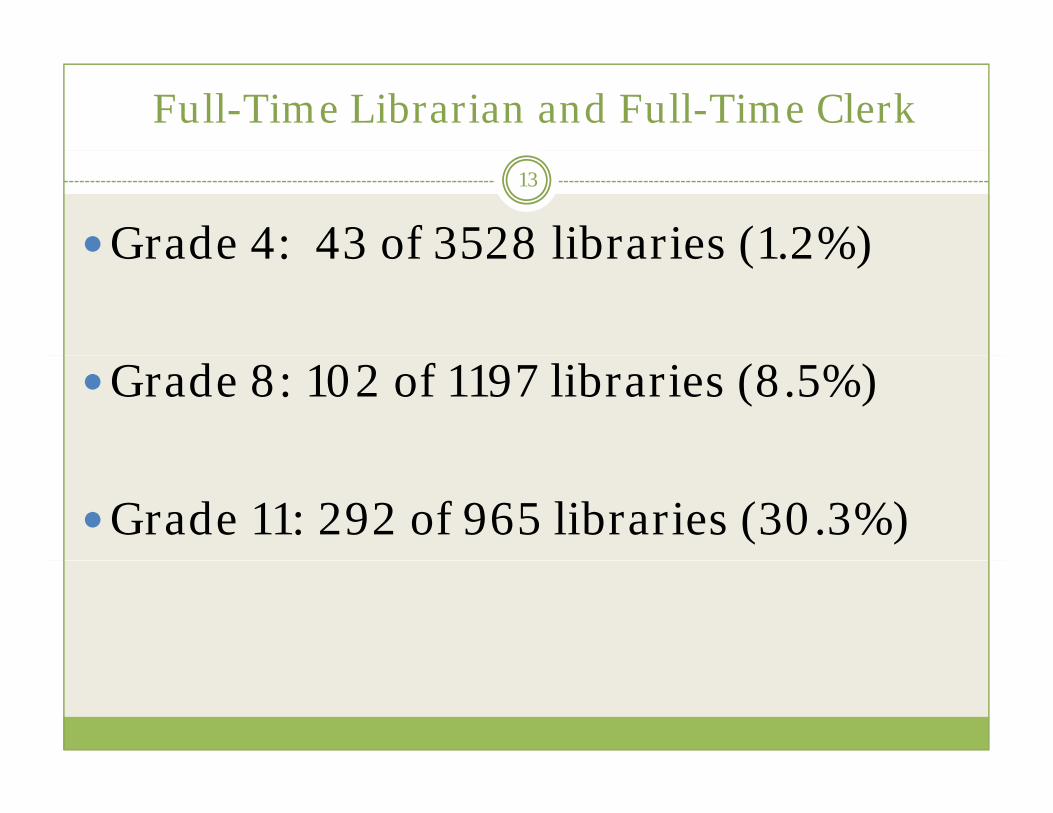
Full-Time Librarian and Full-Time Clerk
Grade 4: 43 of 3528 libraries (1.2%)
13
Grade 4: 43 of 3528 libraries (1.2%)
Grade 8: 102 of 1197 libraries (8.5%)
Grade 11: 292 of 965 libraries (30.3%)
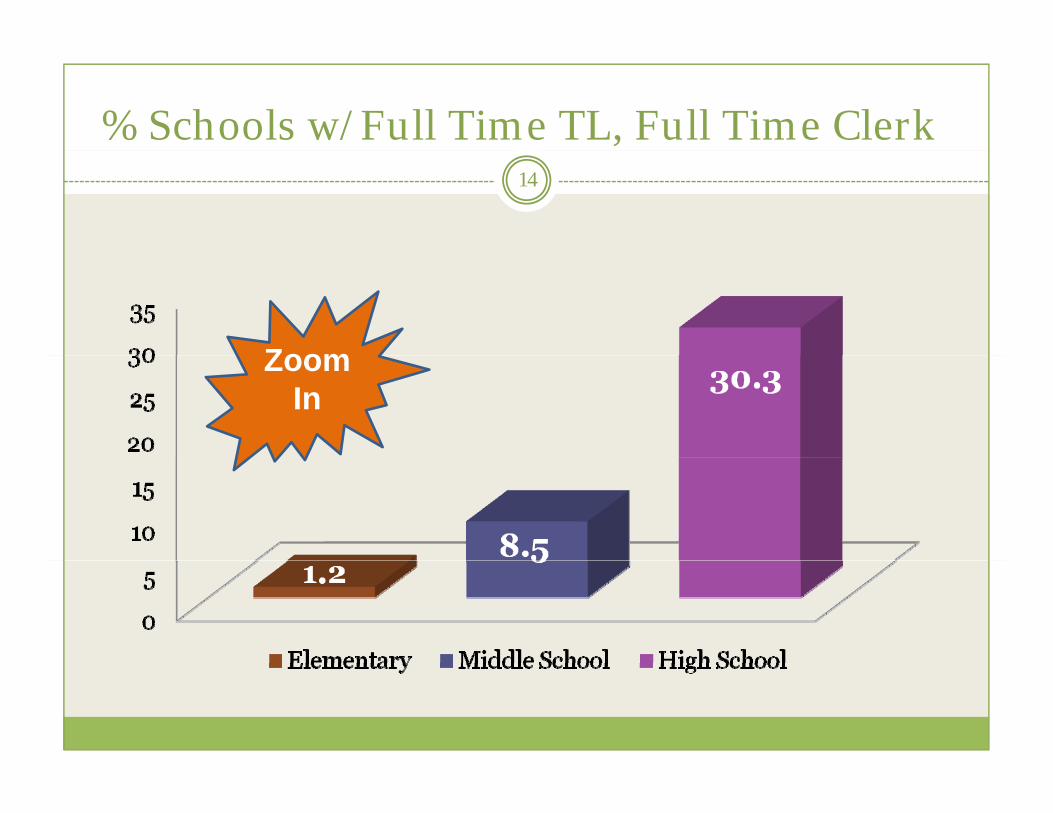
% Schools w/Full Time TL, Full Time Clerk14
ZoomZoom In

% Schools w/Full Time TL, Full Time Clerk15
ZZoom Out

CA Study: Haves, Halves and Have-Nots: School Libraries and Student Achievement in California
Student achievement measured by:
16
Student achievement measured by:
G d ELA C lif i St d d T t (CST)Grade 4 ELA California Standards Test (CST)
Grade 8 ELA CST, Social Studies CST
Grade 11 ELA CST, U.S. History CST
Library Data
California Department of Education
17
California Department of Education School Library Survey 2006-2007
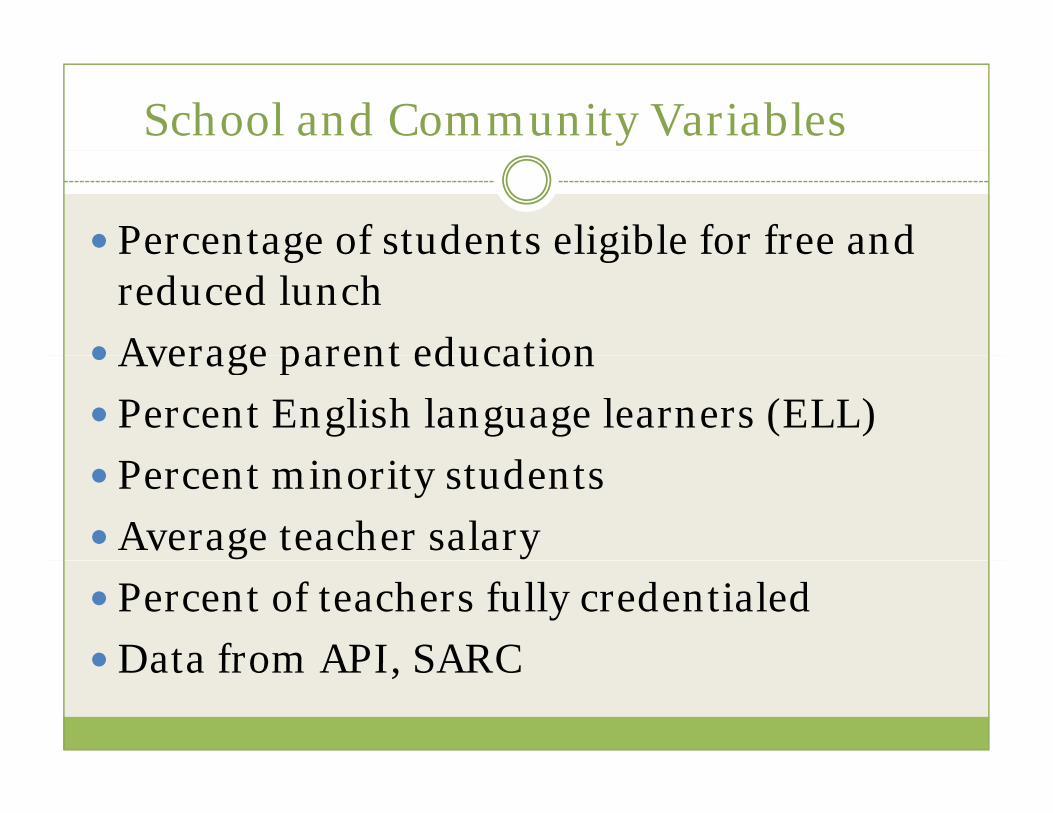
School and Community Variables
Percentage of students eligible for free and Percentage of students eligible for free and reduced lunch
Average parent educationAverage parent education
Percent English language learners (ELL)
i i dPercent minority students
Average teacher salary
Percent of teachers fully credentialed
Data from API SARCData from API, SARC
Data Sources
All data from 2006-2007 school year
19
All data from 2006 2007 school year
2006-2007: 5,442 out of 8,153 h i bli h l (6 %) comprehensive public schools (67%)
had data from all 4 sources.
About Correlation Statistics
“Pearson r” = strength of
20
Pearson r = strength of relationship between 2 variables
Scale: 0 to 1 (or -1 to 0)
0 = no relationship
( ) t t1 (or -1) = strongest
180
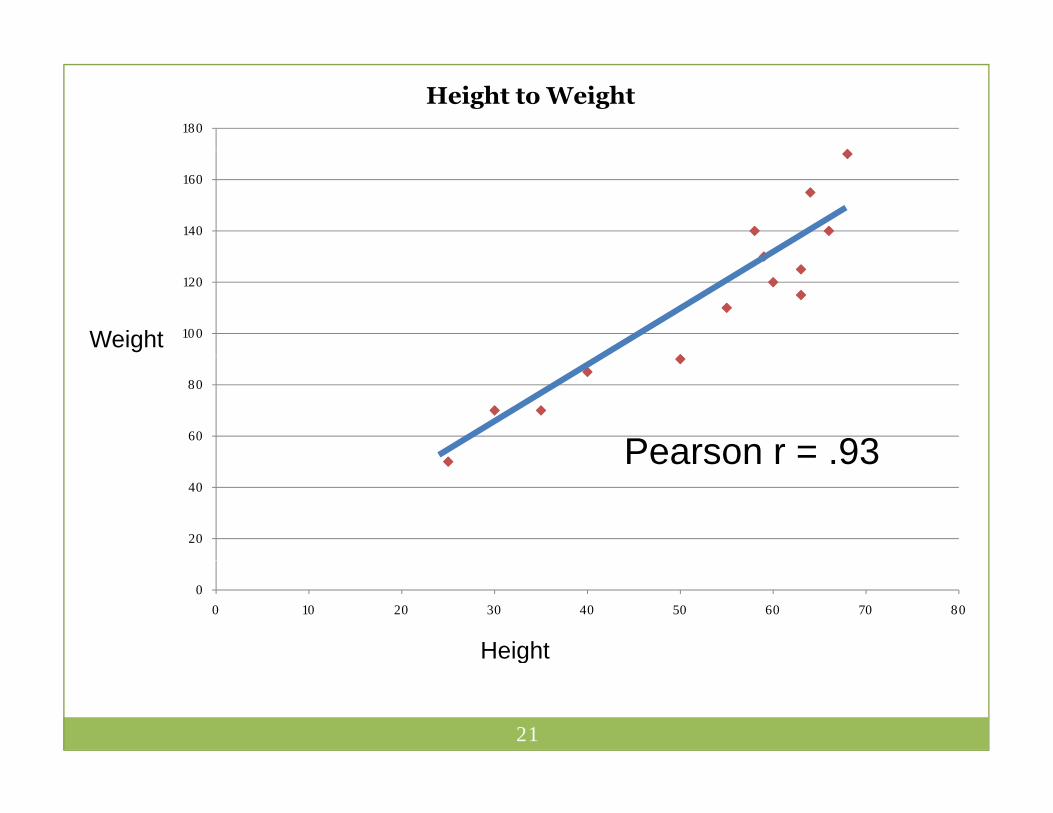
Height to Weight
140
160
100
120
Weight
60
80
Pearson r = 93
20
40
Pearson r .93
0
0 10 20 30 40 50 60 70 80
Height
21
g

180
Height to Weight
140
160
100
120
Weight
60
80Weight
20
40
Height
0
0 10 20 30 40 50 60 70 80
Pearson r = 93
22
g Pearson r = .93
8
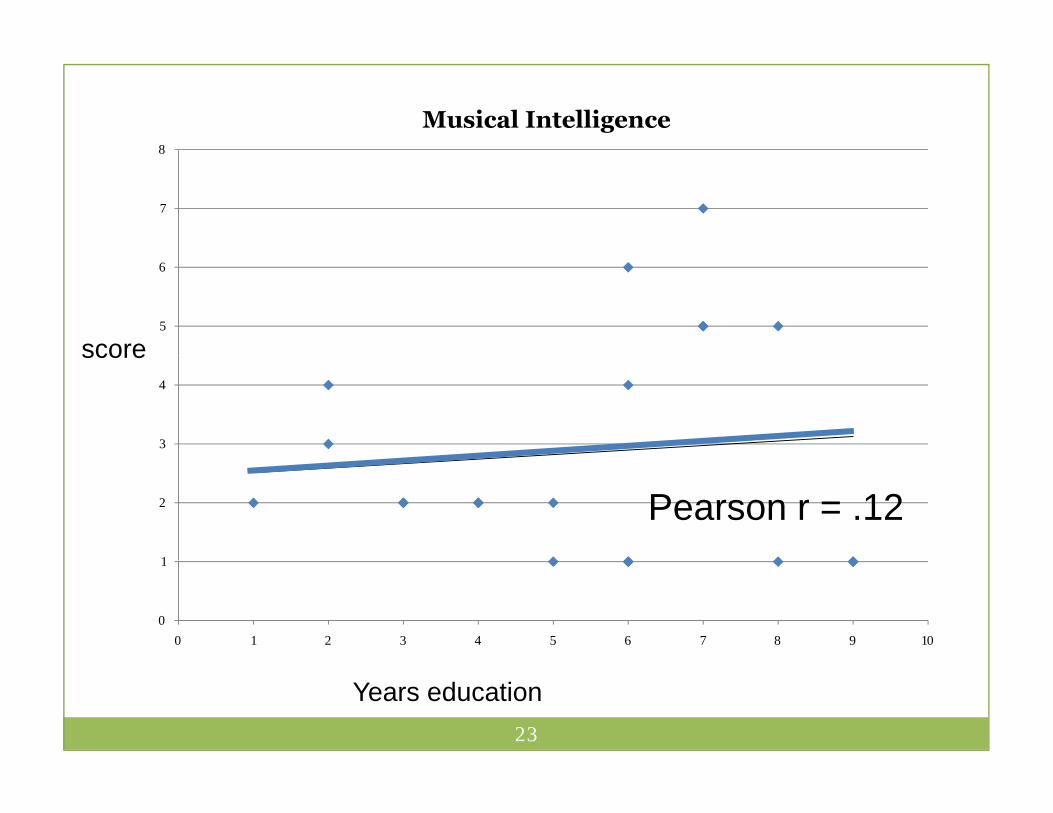
Musical Intelligence
7
8
5
6
score
3
4
score
1
2 Pearson r = .12
0
1
0 1 2 3 4 5 6 7 8 9 10
23
Years education
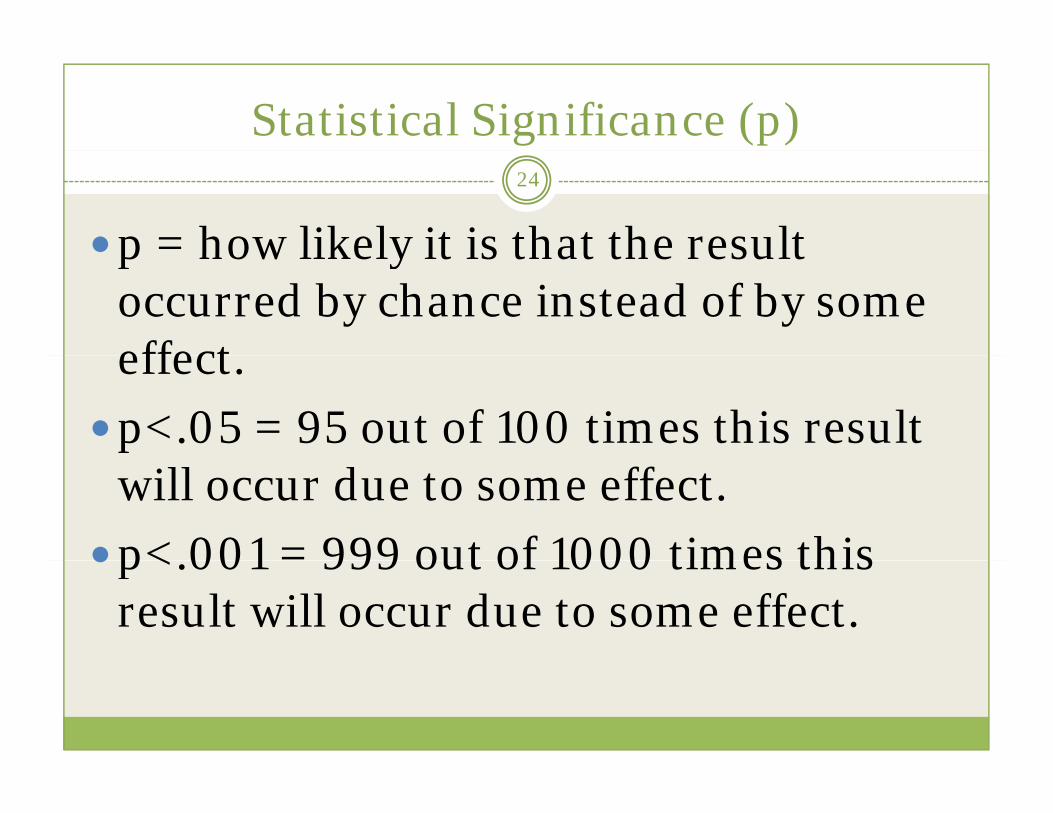
Statistical Significance (p)
p = how likely it is that the result
24
p how likely it is that the result occurred by chance instead of by some effecteffect.
p<.05 = 95 out of 100 times this result will occur due to some effect.
p< 001 = 999 out of 1000 times this p<.001 = 999 out of 1000 times this result will occur due to some effect.
What Correlations Do NOT Show
Cause and effect25
Cause and effect
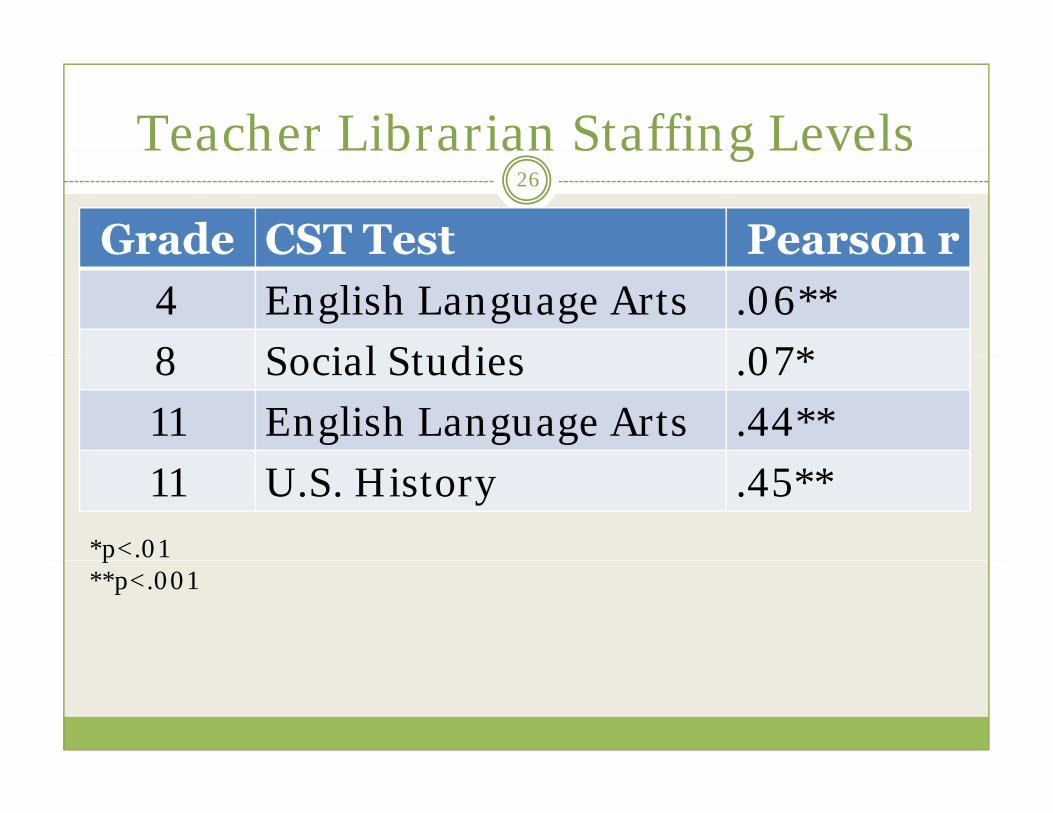
Teacher Librarian Staffing LevelsTeacher Librarian Staffing Levels
Grade CST Test Pearson r
26
Grade CST Test Pearson r
4 English Language Arts .06**
8 Social Studies 07*8 Social Studies .07*
11 English Language Arts .44**
11 U.S. History .45**
*p<.01p**p<.001
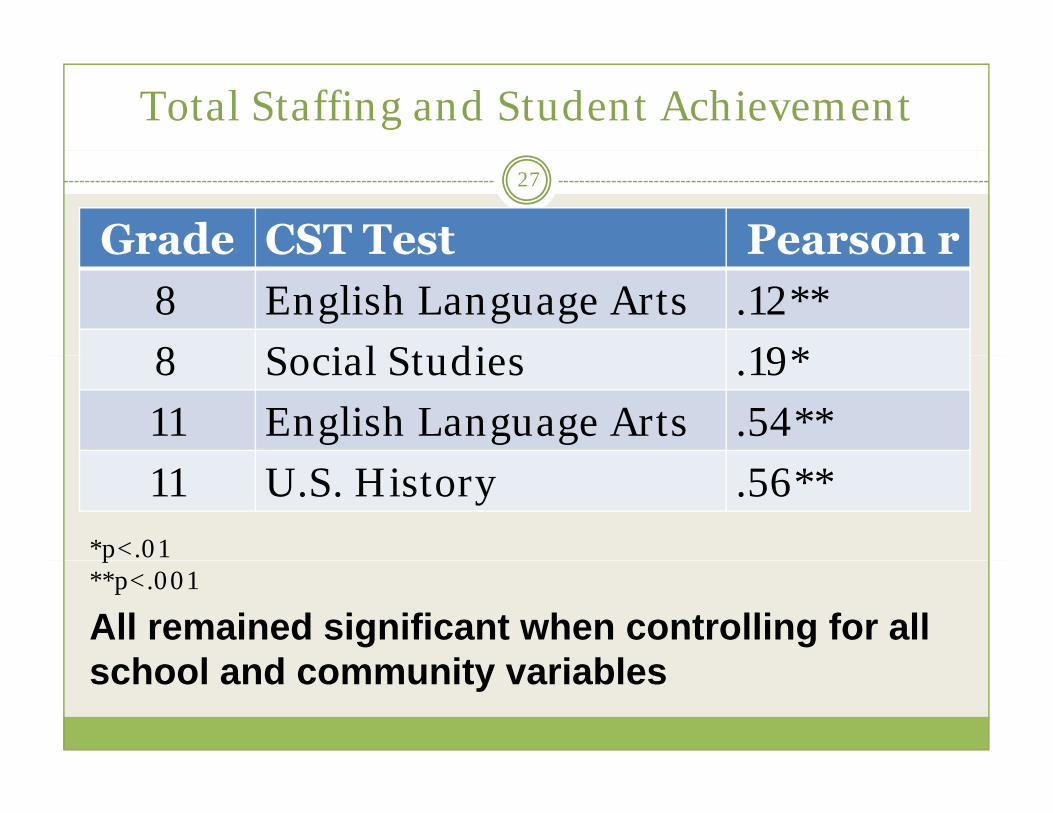
Total Staffing and Student Achievement
Grade CST Test Pearson r
27
Grade CST Test Pearson r
8 English Language Arts .12**
8 Social Studies 19*8 Social Studies .19*
11 English Language Arts .54**
11 U.S. History .56**
*p<.01p**p<.001
All remained significant when controlling for all h l d it i blschool and community variables

Library Services and Student Achievement
Offering a program of curriculum-28
Offering a program of curriculumintegrated information literacy instruction
Grade CST Test r4 ELA 12**4 ELA .12**8 Social Studies .14**11 U.S. History .39**
All remained significant when controlling for school and community variables
*p <.01, **p <.001
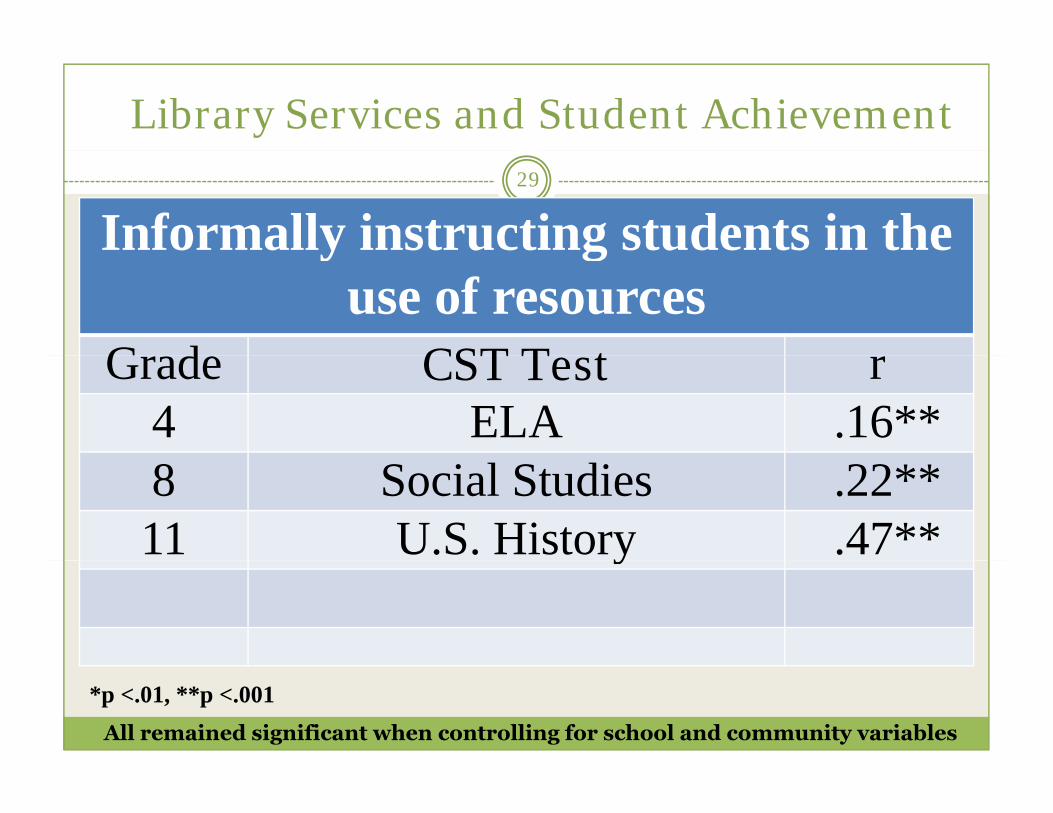
Library Services and Student Achievement
Informally instructing students in the 29
y guse of resources
G d CST T tGrade CST Test r4 ELA .16**8 Social Studies .22**11 U.S. History .47**y
All remained significant when controlling for school and community variables
*p <.01, **p <.001

Library Services and Student Achievement
Providing reference assistance to 30
gstudents and teachers
G d CST T tGrade CST Test r4 ELA .11**8 Social Studies .22**11 U.S. History .47**y
All remained significant when controlling for school and community variables
*p <.01, **p <.001

Library Services and Student Achievement
Collaborating with teachers to develop,31
g p,plan, implement, evaluate student learningG d CST T tGrade CST Test r
4 ELA --8 Social Studies .08**11 U.S. History .29**y
Correlations remained significant at grades 8, 11 when
**p <.001
controlling for school and community variables
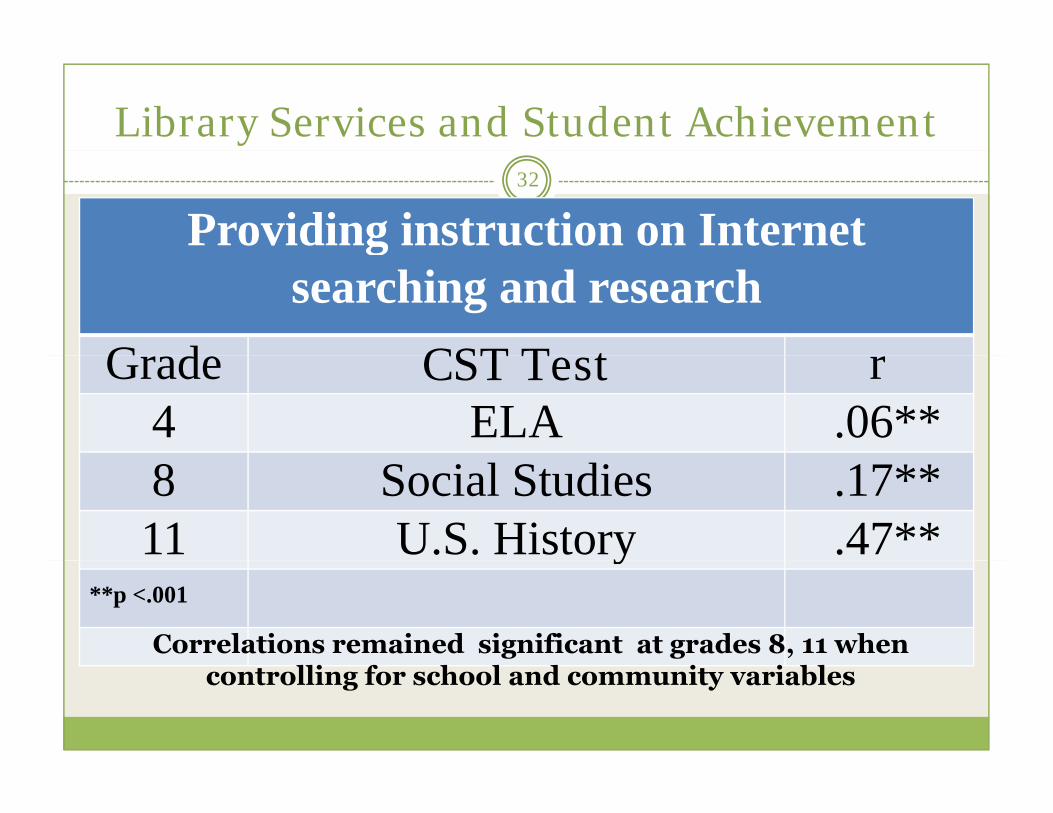
Library Services and Student Achievement
Providing instruction on Internet 32
gsearching and research
G d CST T tGrade CST Test r4 ELA .06**8 Social Studies .17**11 U.S. History .47**y
Correlations remained significant at grades 8, 11 when
**p <.001
controlling for school and community variables

Library Services and Student Achievement
Providing reading, listening and viewing 33
g g, g gguidance for students
G d CST T tGrade CST Test r4 ELA .09**8 Social Studies .14**11 U.S. History .35**y
Correlations remained significant at grades 8, 11 when
**p <.001
controlling for school and community variables

Library Services and Student Achievement
Communicating proactively with principal34
g p y p p
G d CST T tGrade CST Test r4 ELA .15**8 Social Studies .21**11 U.S. History .45**y
Correlations remained significant at grades 8, 11 when
**p <.001
controlling for school and community variables
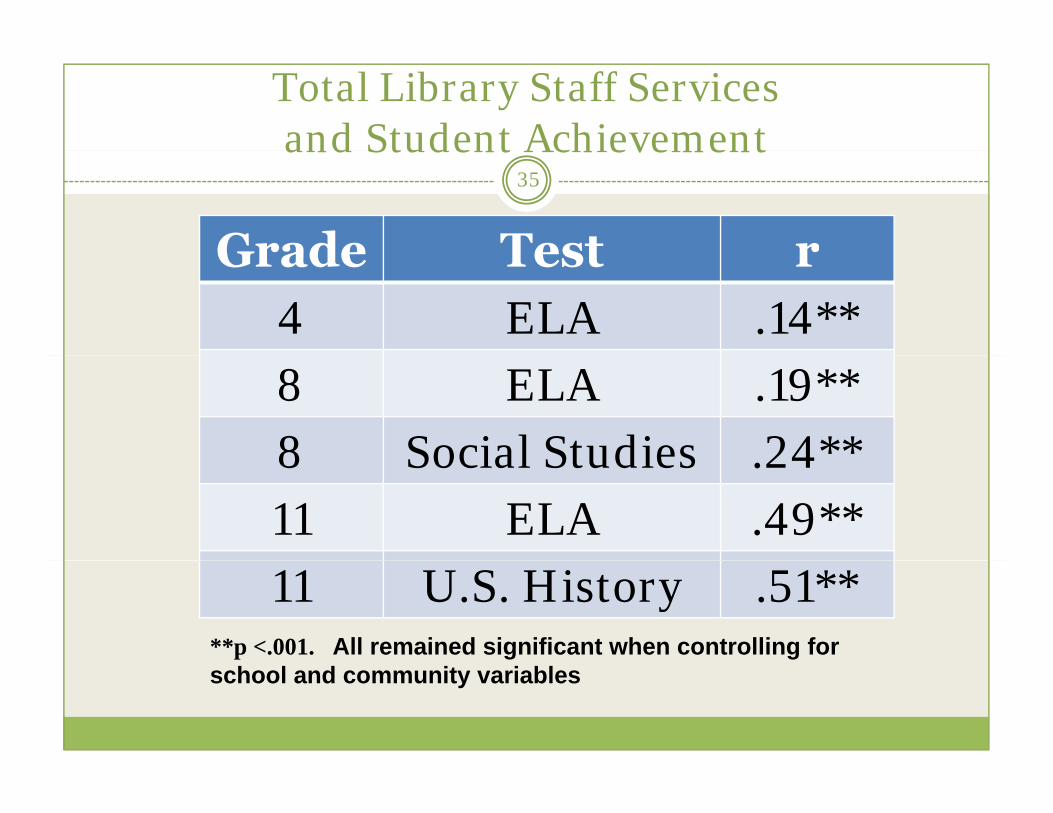
Total Library Staff Services and Student Achievementand Student Achievement
Grade Test r
35
Grade Test r4 ELA .14**8 ELA .19**8 Social Studies 24**8 Social Studies .2411 ELA .49**11 U.S. History .51**
**p <.001. All remained significant when controlling for school and community variables

Staffing and Total Library Services
Grade Certificated Total
36
Grade Certificated Staffing
Total Staffing
4 18** 38**4 .18 .38
8 .46** .59**
** **11 .70** .79****p <.001
As staffing increases, so do library services.As library services increase, so does student achievement.

So What?37
As staffing increasesAs staffing increases, so do library services
Grade Certificated Staffing
Total StaffingSta g Sta g
4 .18** .38**
8 46** 59**8 .46** .59**
11 .70** .79**
**p <.001
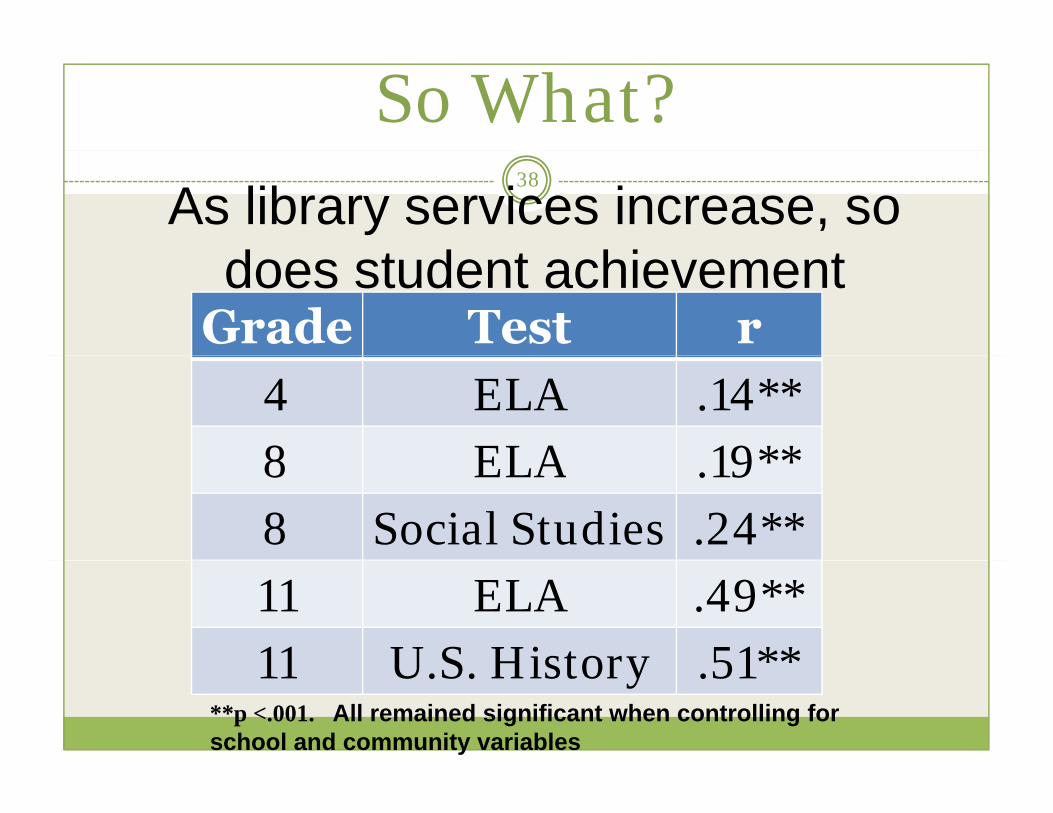
So What?38
As library services increase, so d t d t hi t
Grade Test rdoes student achievement
4 ELA .14**8 ELA 19**8 ELA .19**8 Social Studies .24**11 ELA .49**11 U S History 51**11 U.S. History .51
**p <.001. All remained significant when controlling for school and community variables

Instruction in Online Research and Staffing
Grade Certificated Total
39
Grade Certificated Staffing
Total Staffing
4 15** 27**4 .15 .27
8 .36** .48**
6 ** **11 .64** .71****p <.001
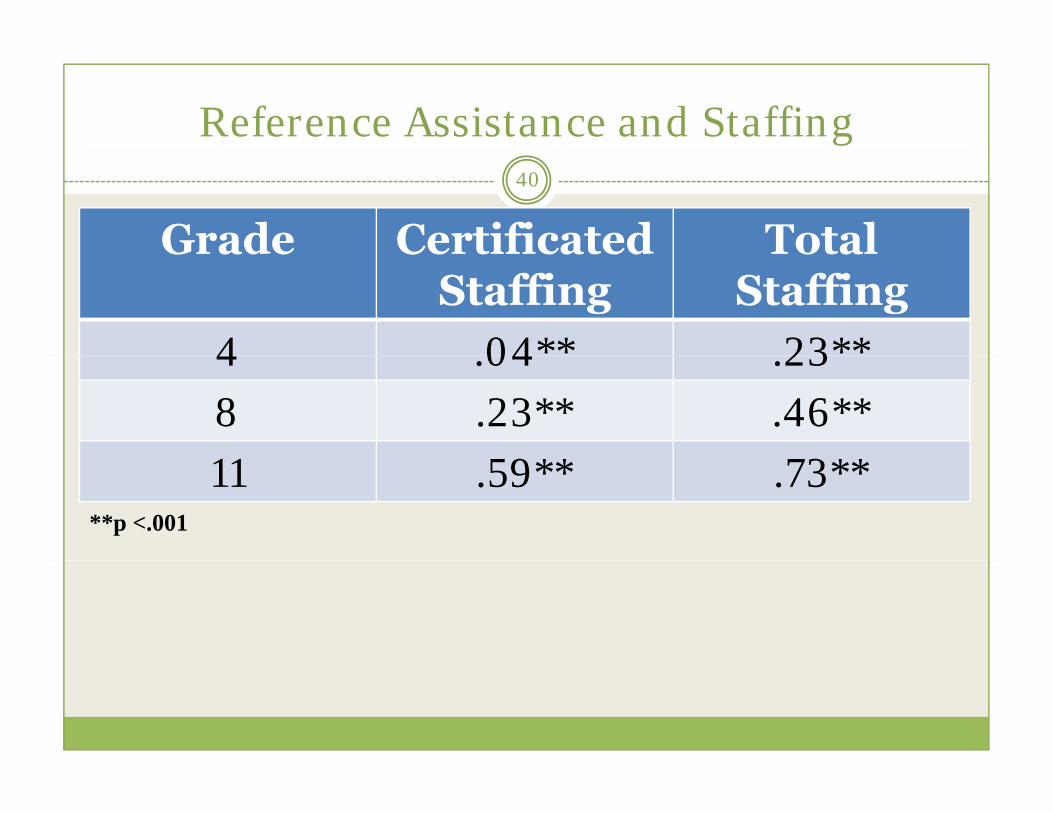
Reference Assistance and Staffing
Grade Certificated Total
40
Grade Certificated Staffing
Total Staffing
4 04** 23**4 .04 .23
8 .23** .46**
** **11 .59** .73****p <.001

Readers’ Advisory and Staffing
Grade Certificated Total
41
Grade Certificated Staffing
Total Staffing
4 07** 20**4 .07 .20
8 .27** .35**
** 6 **11 .54** .61****p <.001

Other Library Program Elements and Student Achievement: Hours OpenStudent Achievement: Hours Open
Grade Test r
42
Grade Test r
4 ELA .08**
8 ELA 16**8 ELA .16**
8 Social Studies .20**
ELA **11 ELA .52**
11 U.S. History .54****p < 001
Significance persisted when controlling for all school community variables
**p <.001
school, community variables.
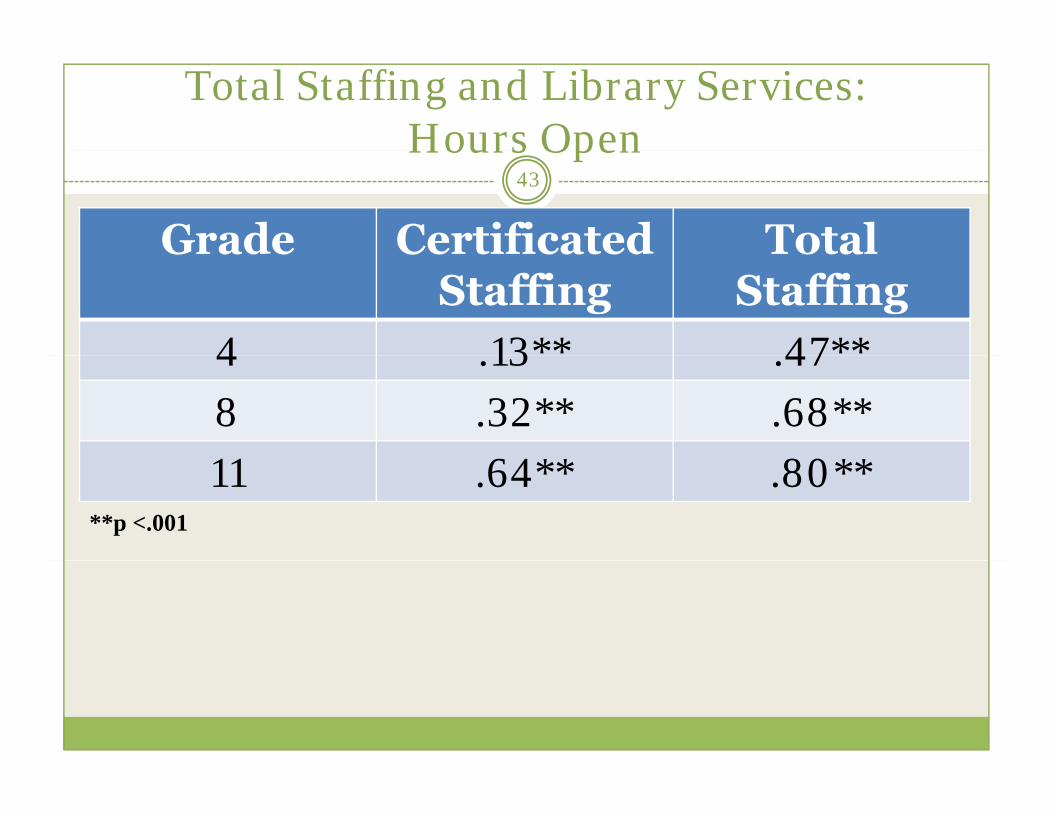
Total Staffing and Library Services: Hours OpenHours Open
43
Grade Certificated Total Grade Certificated Staffing
Total Staffing
4 13** 47**4 .13 .47
8 .32** .68**
6 ** 8 **11 .64** .80****p <.001
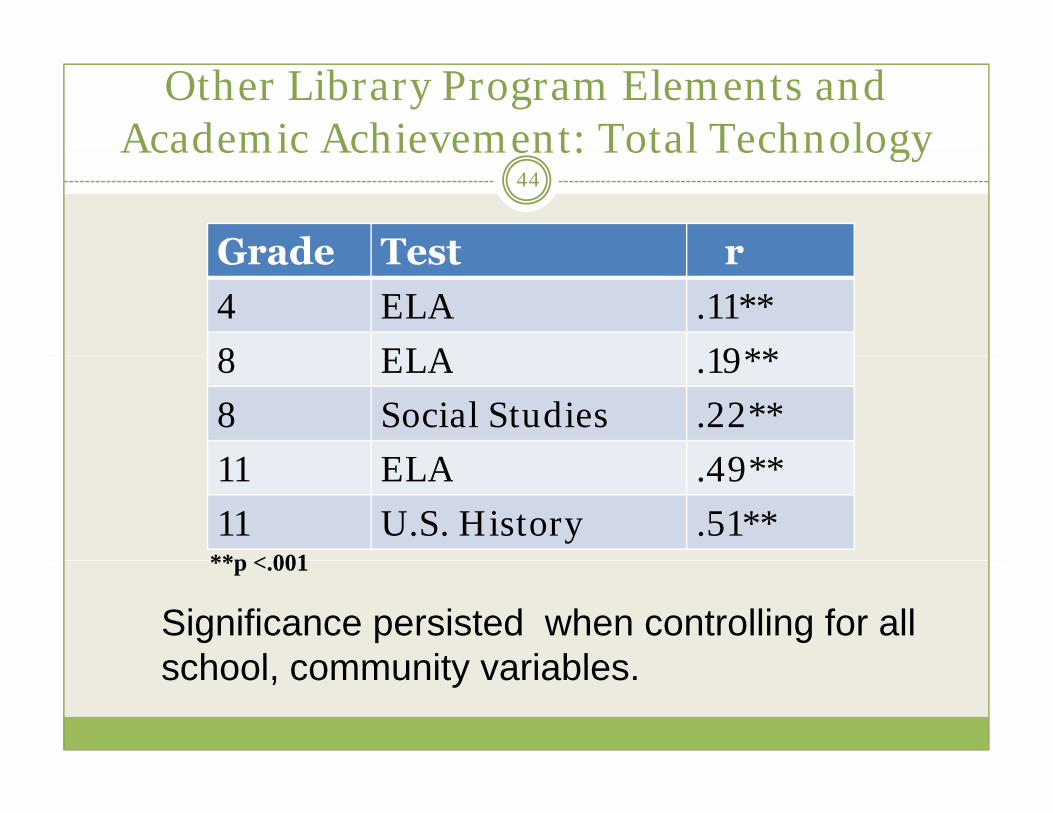
Other Library Program Elements and Academic Achievement: Total TechnologyAcademic Achievement: Total Technology
Grade Test r
44
Grade Test r
4 ELA .11**
8 ELA 19**8 ELA .19**
8 Social Studies .22**
ELA **11 ELA .49**
11 U.S. History .51****p < 001
Significance persisted when controlling for all school community variables
**p <.001
school, community variables.

Other Library Program Elements and Academic Achievement: Collection SizeAcademic Achievement: Collection Size
Grade Test r
45
Grade Test r
4 ELA .08**
8 ELA 05**8 ELA .05**
8 Social Studies .10**
ELA **11 ELA .44**
11 U.S. History .46****p < 001
Significance persisted when controlling for all school community variables
**p <.001
school, community variables.
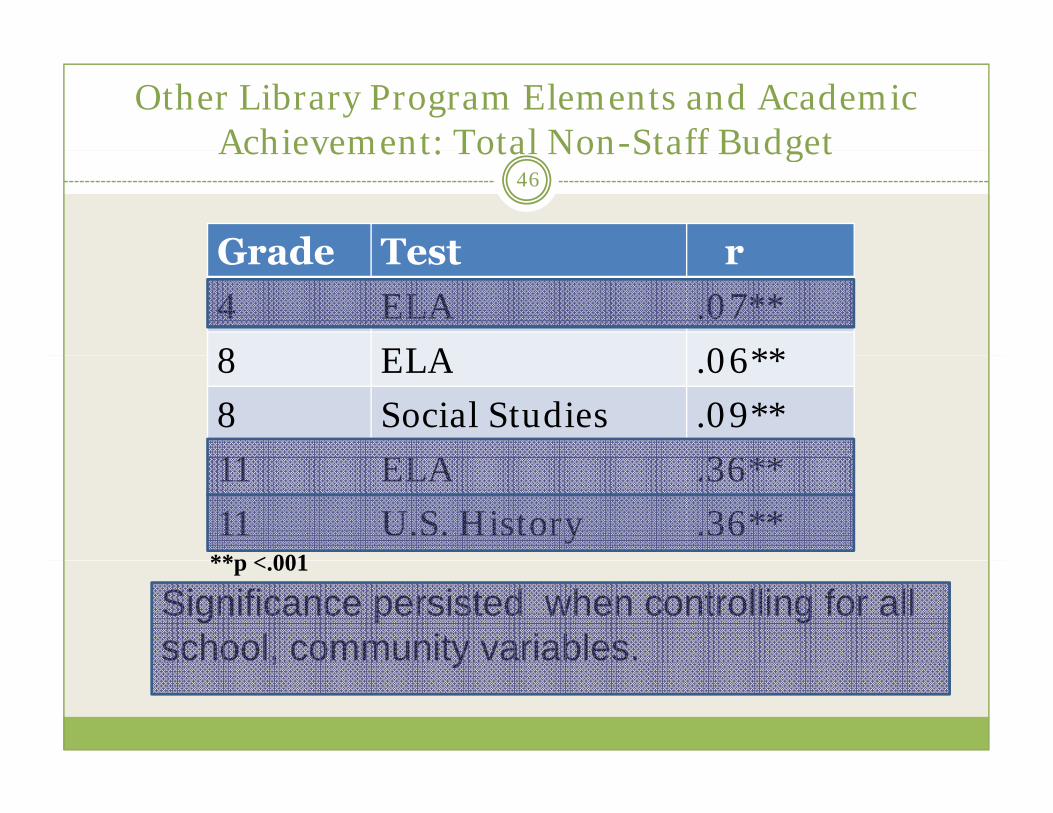
Other Library Program Elements and Academic Achievement: Total Non-Staff BudgetAchievement: Total Non Staff Budget
Grade Test r
46
Grade Test r
4 ELA .07**
8 ELA 06**8 ELA .06**
8 Social Studies .09**
ELA 6**11 ELA .36**
11 U.S. History .36****p < 001
Significance persisted when controlling for all school, community variables.
**p <.001
, y
Total Library Program as Predictor of Academic AchievementAcademic Achievement
47
Factor Analysis: 1 variable each forFactor Analysis: 1 variable each forSchool
Community Community
Library
Multiple regression Multiple regression
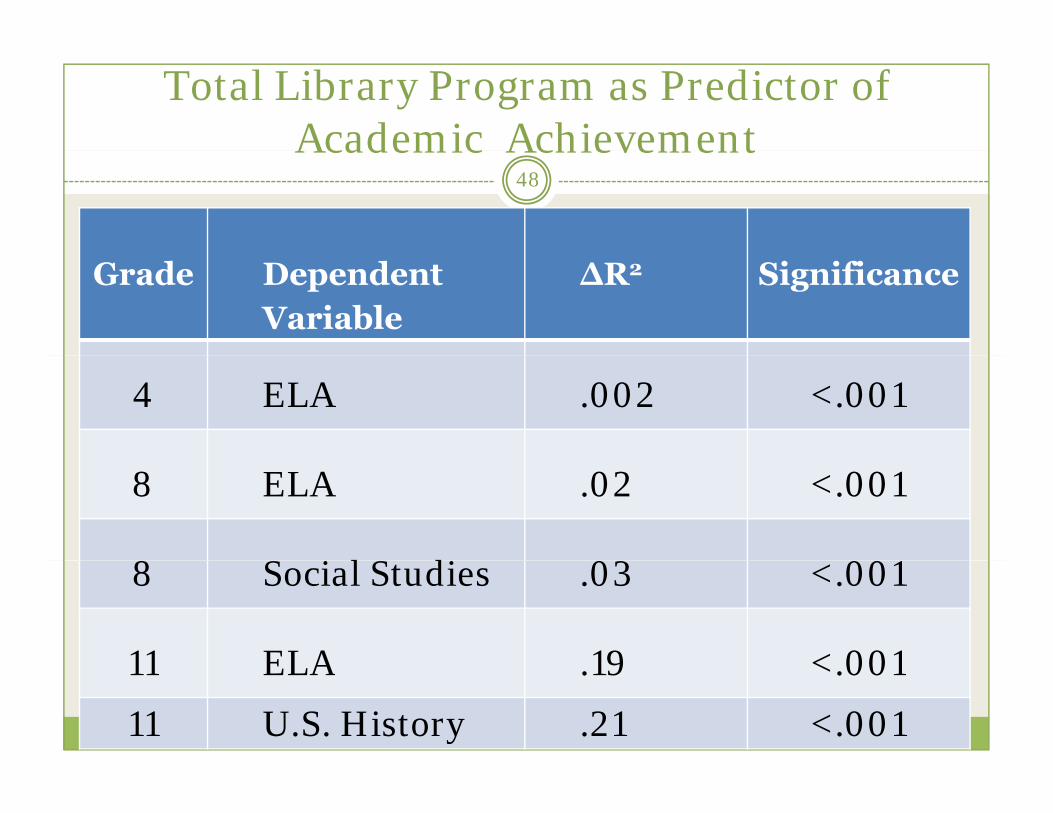
Total Library Program as Predictor of Academic AchievementAcademic Achievement
48
Grade Dependent Variable
∆R2 Significance
4 ELA .002 <.001
8 ELA .02 <.001
8 S i l S di8 Social Studies .03 <.001
11 ELA 19 < 00111 ELA .19 <.001
11 U.S. History .21 <.001

Best Predictors of Student Achievement
Middle school:
49
1. Community variables 2. School variables 3. Library variables
High School ELA1. Community variables 2. Library variables 3. School Variables
High School U.S. History:ib i bl C i i bl S h l i bl1. Library variables 2. Community variables 3. School variables
Implications
Certificated + Clerical Staffing =
50
Certificated + Clerical Staffing = More Services
More Services = Higher Student AchievementAchievement

Implications
Lack of equity in CA education
51
Lack of equity in CA education
90% of principals’ knowledge of what lib di i li t d f library media specialists do comes from their experience on the job (Lance, Rodney & Russell, 2007)
Staffing is keyStaffing is key
Standards Adoption Can Lead Way
What Next?52
What happens at the site level to What happens at the site level to explain the results of this study?
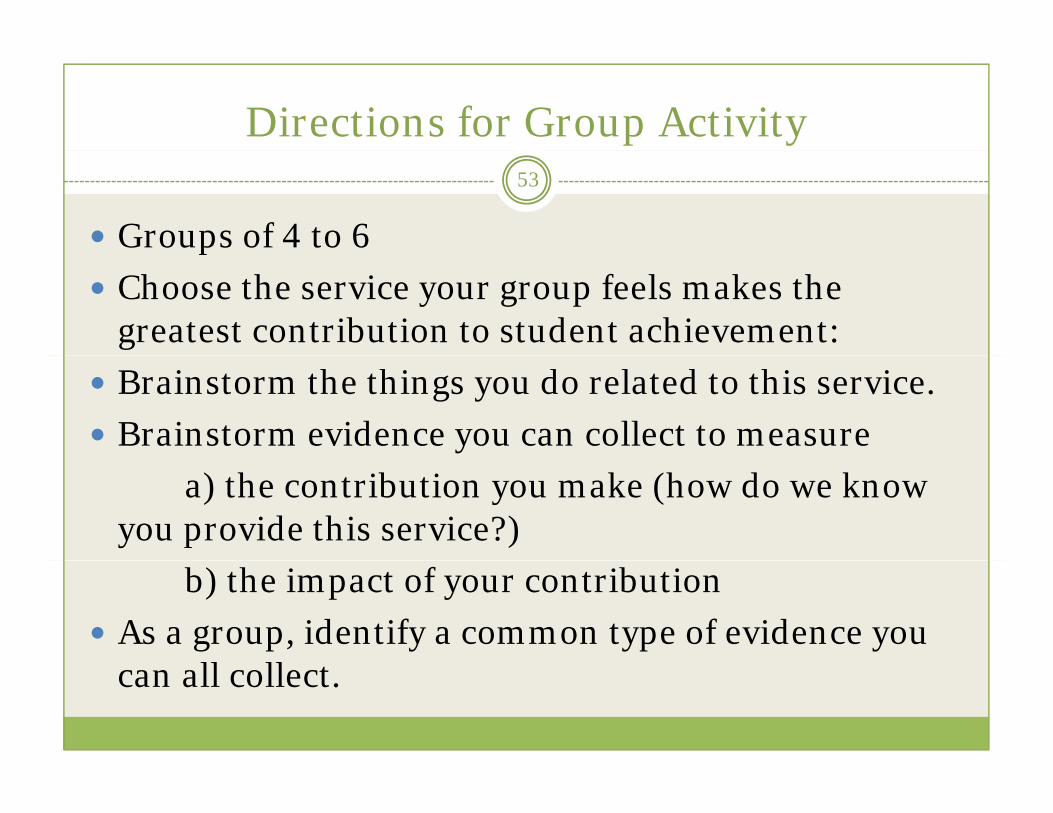
Directions for Group Activity
Groups of 4 to 6
53
p 4
Choose the service your group feels makes the greatest contribution to student achievement:
Brainstorm the things you do related to this service.
Brainstorm evidence you can collect to measure
a) the contribution you make (how do we know you provide this service?)
b) the impact of your contribution
As a group, identify a common type of evidence you ll llcan all collect.
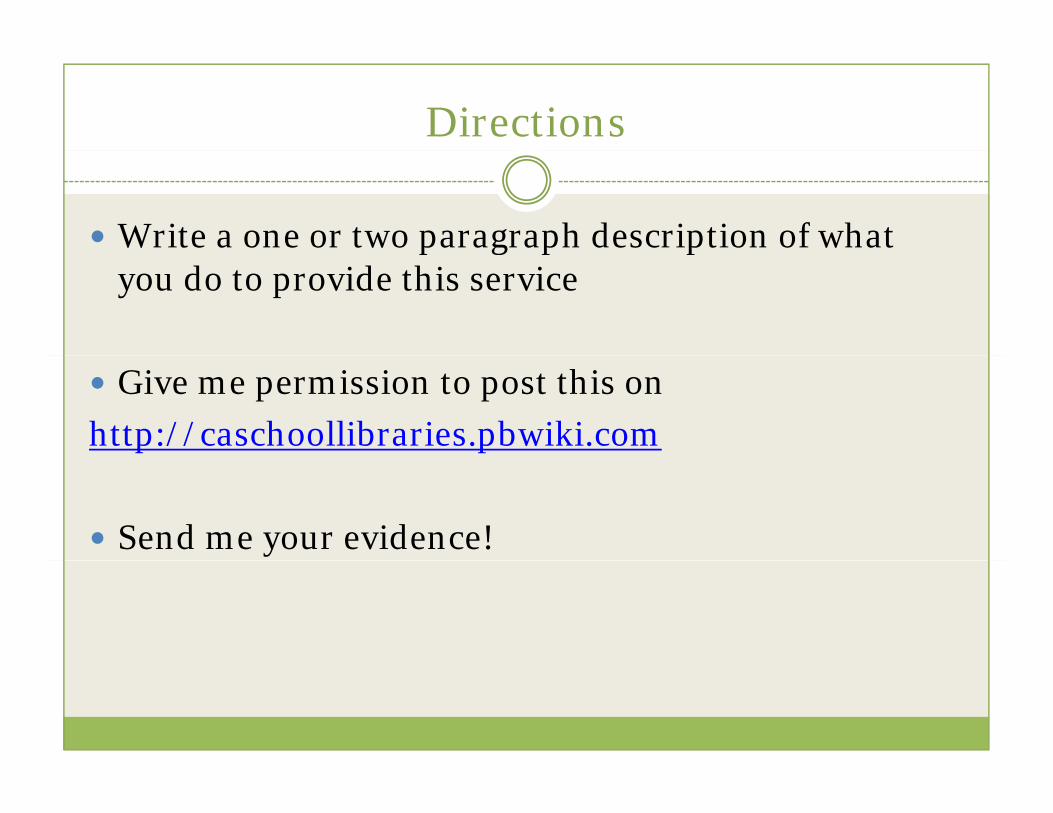
Directions
Write a one or two paragraph description of what p g p pyou do to provide this service
Give me permission to post this on
http://caschoollibraries.pbwiki.com
Send me your evidence!
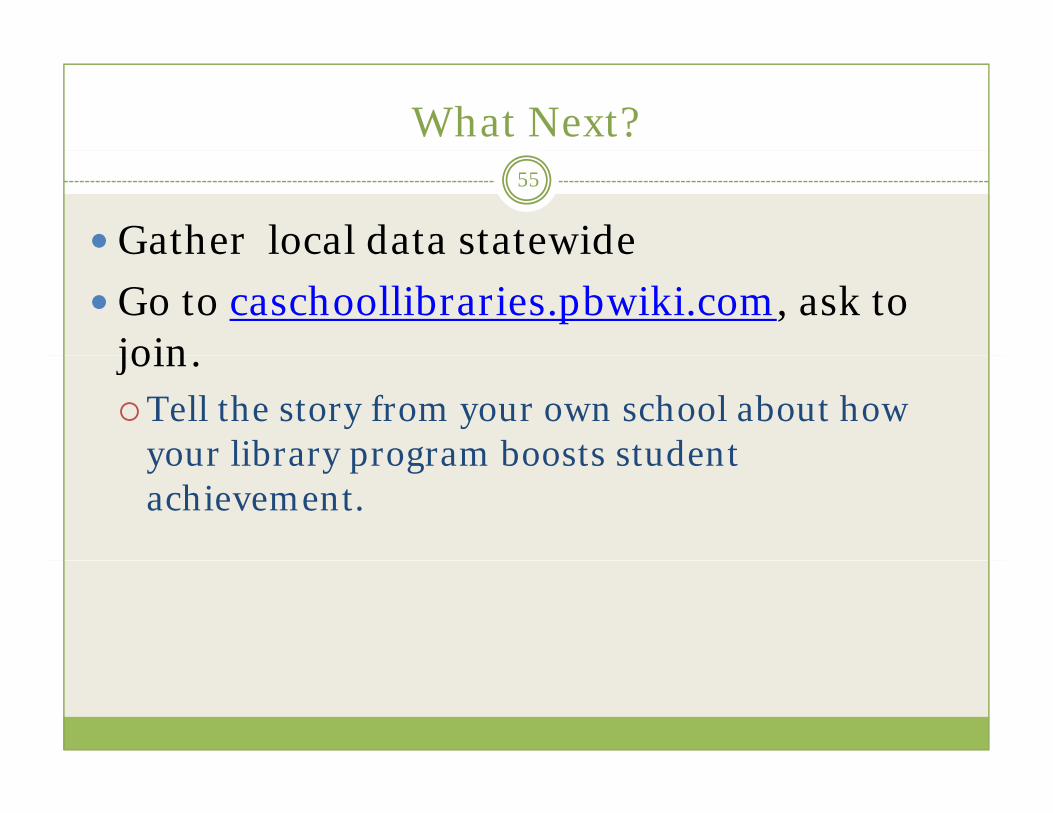
What Next?55
Gather local data statewide Gather local data statewide
Go to caschoollibraries.pbwiki.com, ask to joinjoin.
Tell the story from your own school about how your library program boosts student your library program boosts student achievement.

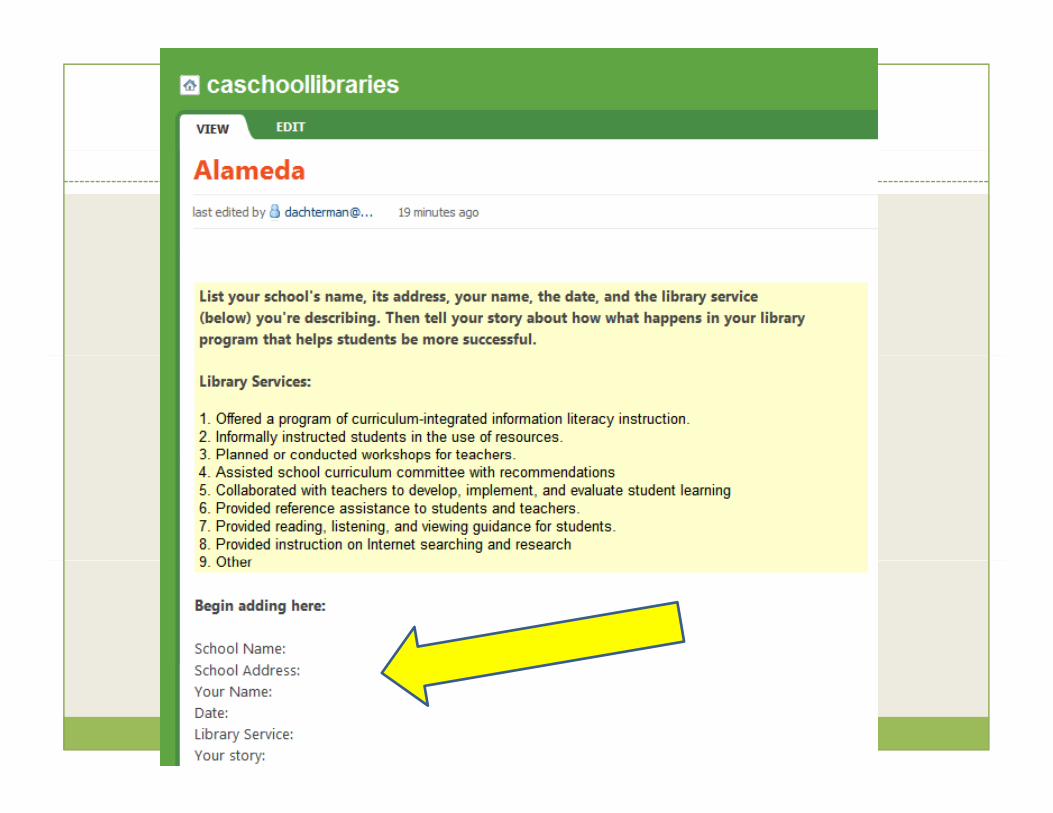
caschoollibraries.pbwiki.com
56
57
Yes, I’m almost done
Final thought:
58
Final thought:
Best advocacy for school libraries:
excellenceexcellenceMake yourself indispensabley p