happiness, hope, economic optimism€¦ · happiness, hope, economic optimism gallup international...
TRANSCRIPT
HAPPINESS, HOPE, ECONOMIC OPTIMISM
Gallup International Association opinion poll in 66 countries
across the globe
December, 2016
Disclaimer: Gallup International Association or its members are not related to Gallup Inc., headquartered in
Washington D.C which is no longer a member of Gallup International Association. Gallup International
Association does not accept responsibility for opinion polling other than its own. We require that our surveys
be credited fully as Gallup International (not Gallup or Gallup Poll).
HEADLINES
▪ 68% of the world said that they feel happy about their lives, an increase from 66% lastyear; 22% are neither happy nor unhappy, and 9% feel unhappy about their lives
▪ Net happiness (happy minus unhappy) globally is +59%; an increase from +56% last year
▪ Fiji and China are the happiest countries of the world (+89% and +80% net happinessrespectively), followed by Philippines, Vietnam, Panama, Indonesia and Paraguay whileIraq is the least happy for the third year in a row (less than +1% net happiness)
▪ 42% of the world is optimistic about the economic outlook for 2017; 22% are pessimisticand 31% believe the economy will remain the same. Net economic optimism is at +20%
▪ The most optimistic countries about economic prosperity in 2017 are Ghana (+68% netoptimistic) and Bangladesh (+67% net optimistic). In contrast, South Korea, Hong Kongand Greece are the most pessimistic (-62%, -56% and -53% respectively)
HAPPINESS: A HAPPIER WORLD ALBEIT WITH SOME STARK REGIONAL DIFFERENCES
Two in three (68%) citizens of the world report being happy, a figure which has risen 2%from twelve months ago, despite a year in which the world has seen considerable changeand a year of frequent and bloody terrorist attacks. Of the 66541 people surveyed, 9% saidthat they were unhappy, down from 10% at the end of 2015. Overall this means that theworld is +59% net happy (happiness minus unhappiness).
But regionally the story is very different with those in East Asia and Oceania significantlyhappier than those in the Middle East. For example, happiness in Fiji and China, the nethappiest countries of the world (net scores of +89% and +80% respectively) is in starkcontrast to happiness in Iraq, which rates as the unhappiest of all 66 countries surveyed (netscore of less than +1%).
The Beatles wrote “money can’t buy me love” – but the findings suggest it does howevercorrelate strongly with happiness – those in the bottom quintile of income record a nethappiness score of +33% compared with a score of +75% for those in the top quintile;irrespective of nations in which they reside.
ECONOMIC OPTIMISM: GLOBALLY HIGH BUT LOWER THAN LAST YEAR
When it comes to economic outlook despite much of the world largely remaining out ofrecession, economic optimism has declined from twelve months ago. The study shows that42% of the world is optimistic for the economic outlook in 2017, almost double (22%) ofthose who are pessimistic. Net optimism (the percentage of those saying next year will beone of economic prosperity minus the percentage who say next year will be one ofeconomic difficulty) has fallen from +23% to +20%.

ECONOMIC OPTIMISM: GLOBALLY HIGH BUT LOWER THAN LAST YEAR (CONT’D)
While globally just over two in five (42%) say next year will be one of economic prosperity,there are very significant differences across the globe. European citizens are significantly lessoptimistic than anywhere else in the world: EU Europe net score of -26% and Non-EUEurope net score of -20%. The challenges posed to the very future of the EU project in 2016may well have created economic doubt within the world’s largest economic bloc. WithinEurope, economic pessimism is most acutely felt in Italy (net score of -48%), the UK (netscore of -38%) and France (net score of -35%). Only Korea and Hong Kong, who havewitnessed a year of political and economic turmoil, are more pessimistic (net scores of -62%and -56%). The most optimistic nations when it comes to the economy were Ghana andBangladesh (+68% and +67% net optimism respectively). When it comes to a demographicbreakdown, young people prove to be considerably more optimistic than older generationswith 34% under 34 years of age net optimistic compared to -7% over the age of 55.
HOPE: HIGH AMONGST MIDDLE AND LOW INCOME NATIONS
As most of the world welcomes a New Year, we see a majority (52%) of the planet feelingthat overall 2017 will be better than 2016, although one in seven (15%) feel it will be worse(giving a net score of +37%, which represents a small drop of 2% points from a year ago).Those living in some of the fastest growing countries in the world (Bangladesh net +77%,Ghana net +76%, Ivory Cost +72%, Fiji +62%, China net +56%, India net +55% and Brazil net+51%) are the most hopeful for the year ahead. However, it is the economic superblocks ofthe EU (net score of 1%) and North America (net score of +11%) which show the leastoptimism for improvement. With Prime Minister Renzi losing a referendum this month andwith an economic recovery that does not take off, it is perhaps of no surprise that it is theItalians (net score of -42%) who are most concerned about the year ahead.
ANALYSIS: GLOBAL INCOME REDISTRIBUTION DRIVES NATIONAL OUTLOOKS ON ECONOMIC
OPTIMISM AND PESSIMISM
Polling data combined with World Bank Bigdata on Gross National Income (GNI) shows aclear link between economic outlook for the year 2017 and global redistribution of Income(GNI) during the last one decade.
During the recent 10 years (2005-15), the Tier One Rich Countries (30 nations with averageannual per capita income of 45,000 US dollars) lost 10% in their share in global economy.This Group in the opinion poll is at present the most pessimistic in their economic outlookfor 2017 (-17% Net Score). The Tier Two Middle Income Countries (12 nations with averageannual per capita income of 13,000 US dollars) gained 10% in their share in global economy.This group in the survey is at present the most optimistic in economic outlook for 2017(+30%). The Tier Three Low Income countries (175 nations with average annual per capitaincome of 7,000 US dollars) which retained its share in global economy during the lastdecade hangs in between the Tier One and Tier Two in terms of economic outlook (+26%).
Gallup International 2016 Survey data indicates that the world is witnessing changingincome distribution across nations. The old rich are losing while the new rich are gainingground. This transition is reflected in their outlooks on hope about 2017. Fortunately,happiness is becoming unrelated to views on economic outlook. The rich nations of theWestern World are happy despite their gloomy outlook on economic prospects. As a result,the global community as a whole reveals a happy majority, in fact slightly happier than ayear ago.
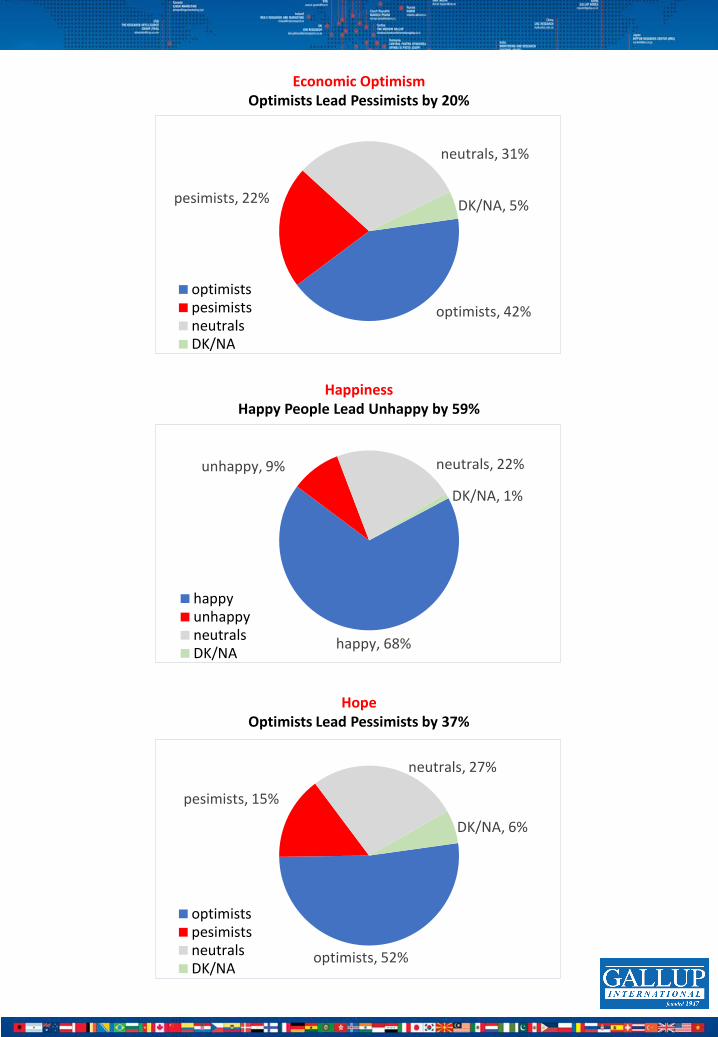
Economic OptimismOptimists Lead Pessimists by 20%
HappinessHappy People Lead Unhappy by 59%
HopeOptimists Lead Pessimists by 37%
optimists, 42%
pesimists, 22%
neutrals, 31%
DK/NA, 5%
optimistspesimistsneutralsDK/NA
happy, 68%
unhappy, 9% neutrals, 22%
DK/NA, 1%
happyunhappyneutralsDK/NA
optimists, 52%
pesimists, 15%
neutrals, 27%
DK/NA, 6%
optimistspesimistsneutralsDK/NA

TOP 10 OPTIMIST/HAPPY COUNTRIES Starting from most optimistic/happiest, showing positive minus negative
TOP 10 PESSIMIST/UNHAPPY COUNTRIES (Starting from most pessimistic/ unhappiest), showing positive minus negative
CountryHope
Index
Bangladesh +77%
Ghana +76%
Ivory Coast +72%
Fiji +62%
China +56%
India +55%
Brazil +51%
Philippines +48%
Vietnam +48%
Estonia +47%
Country
Economic
Optimism
Index
Ghana +68%
Bangladesh +67%
Ivory Coast +57%
India +55%
Vietnam +47%
Philippines +39%
Fiji +34%
China +34%
Papua New Guinea +31%
Pakistan +30%
CountryHappiness
Index
Fiji +89%
China +80%
Philippines +79%
Vietnam +78%
Panama +77%
Indonesia +77%
Papua New Guinea +76%
Paraguay +74%
Bangladesh +74%
Argentina +72%
CountryHope
Index
Italy -42%
Hong Kong -35%
Greece -30%
South Korea -30%
Mexico -29%
Bosnia & Herzegovina -14%
Bulgaria -5%
Belgium -4%
Austria -3%
Turkey -2%
Country
Economic
Optimism
Index
South Korea -62%
Hong Kong -56%
Greece -53%
Ukraine -49%
Mexico -48%
Italy -48%
Belgium -39%
Austria -39%
United Kingdom -38%
France -35%
CountryHappiness
Index
Iraq Below 1%
Hong Kong +14%
Greece +21%
Nigeria +29%
Turkey +30%
Afghanistan +31%
Bulgaria +33%
Romania +34%
Israel +35%
Albania +35%
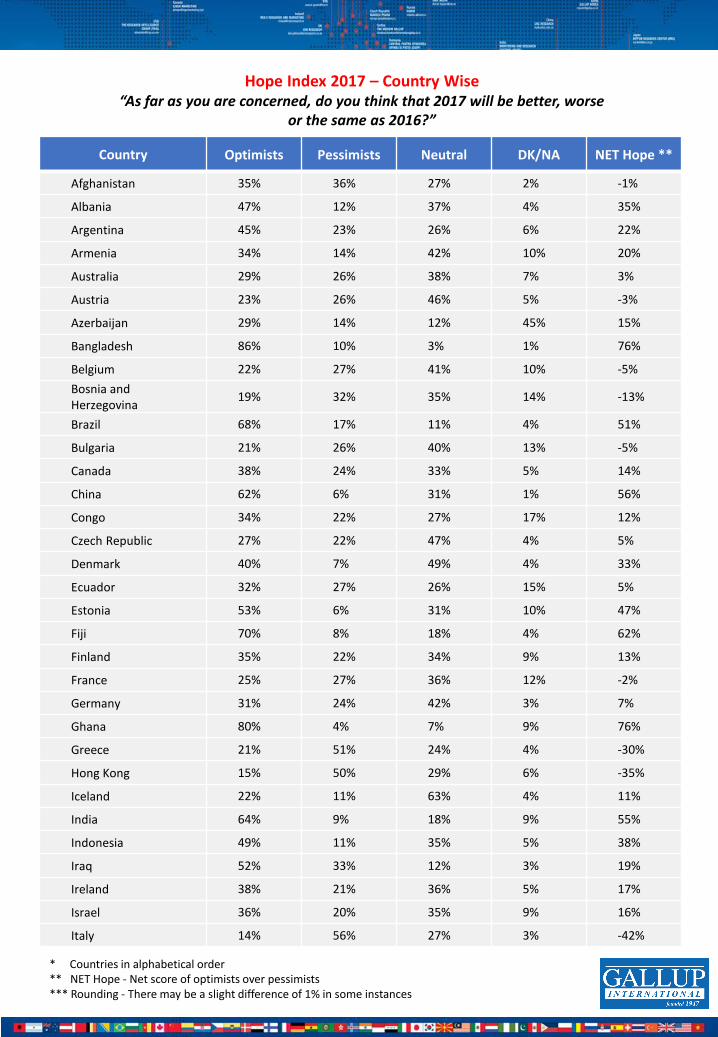
Hope Index 2017 – Country Wise“As far as you are concerned, do you think that 2017 will be better, worse
or the same as 2016?”
Country Optimists Pessimists Neutral DK/NA NET Hope **
Afghanistan 35% 36% 27% 2% -1%
Albania 47% 12% 37% 4% 35%
Argentina 45% 23% 26% 6% 22%
Armenia 34% 14% 42% 10% 20%
Australia 29% 26% 38% 7% 3%
Austria 23% 26% 46% 5% -3%
Azerbaijan 29% 14% 12% 45% 15%
Bangladesh 86% 10% 3% 1% 76%
Belgium 22% 27% 41% 10% -5%
Bosnia and Herzegovina
19% 32% 35% 14% -13%
Brazil 68% 17% 11% 4% 51%
Bulgaria 21% 26% 40% 13% -5%
Canada 38% 24% 33% 5% 14%
China 62% 6% 31% 1% 56%
Congo 34% 22% 27% 17% 12%
Czech Republic 27% 22% 47% 4% 5%
Denmark 40% 7% 49% 4% 33%
Ecuador 32% 27% 26% 15% 5%
Estonia 53% 6% 31% 10% 47%
Fiji 70% 8% 18% 4% 62%
Finland 35% 22% 34% 9% 13%
France 25% 27% 36% 12% -2%
Germany 31% 24% 42% 3% 7%
Ghana 80% 4% 7% 9% 76%
Greece 21% 51% 24% 4% -30%
Hong Kong 15% 50% 29% 6% -35%
Iceland 22% 11% 63% 4% 11%
India 64% 9% 18% 9% 55%
Indonesia 49% 11% 35% 5% 38%
Iraq 52% 33% 12% 3% 19%
Ireland 38% 21% 36% 5% 17%
Israel 36% 20% 35% 9% 16%
Italy 14% 56% 27% 3% -42%
* Countries in alphabetical order** NET Hope - Net score of optimists over pessimists *** Rounding - There may be a slight difference of 1% in some instances

Hope Index 2017 – Country Wise“As far as you are concerned, do you think that 2017 will be better, worse
or the same as 2016?”
Country Optimists Pessimists Neutral DK/NA NET Hope **
Ivory Coast 78% 6% 8% 8% 72%
Japan 20% 13% 41% 26% 7%
Korea, Rep (South) 11% 42% 45% 2% -31%
Kosovo 46% 13% 36% 5% 33%
Latvia 32% 22% 31% 15% 10%
Lebanon 43% 27% 27% 3% 16%
Lithuania 40% 18% 34% 8% 22%
Macedonia 39% 21% 31% 9% 18%
Mexico 17% 46% 35% 2% -29%
Mongolia 39% 22% 37% 2% 17%
Nigeria 66% 21% 9% 4% 45%
Norway 41% 15% 39% 5% 26%
Pakistan 53% 28% 17% 2% 25%
Panama 42% 23% 30% 5% 19%
Papua New Guinea 52% 16% 24% 8% 36%
Paraguay 43% 12% 39% 6% 31%
Peru 57% 12% 23% 8% 45%
Philippines 52% 4% 39% 5% 48%
Poland 26% 26% 39% 9% 0%
Portugal 45% 14% 38% 3% 31%
Romania 40% 25% 29% 6% 15%
Russian Federation 33% 19% 38% 10% 14%
Serbia 30% 31% 37% 2% -1%
Slovenia 35% 19% 41% 5% 16%
South Africa 56% 22% 14% 8% 34%
Spain 39% 22% 37% 2% 17%
Sweden 49% 10% 38% 3% 39%
Thailand 42% 13% 44% 1% 29%
Turkey 37% 39% 18% 6% -2%
Ukraine 37% 34% 28% 1% 3%
United Kingdom 33% 29% 31% 7% 4%
United States 36% 25% 26% 13% 11%
Vietnam 60% 12% 26% 2% 48%
* Countries in alphabetical order** NET Hope - Net score of optimists over pessimists *** Rounding - There may be a slight difference of 1% in some instances
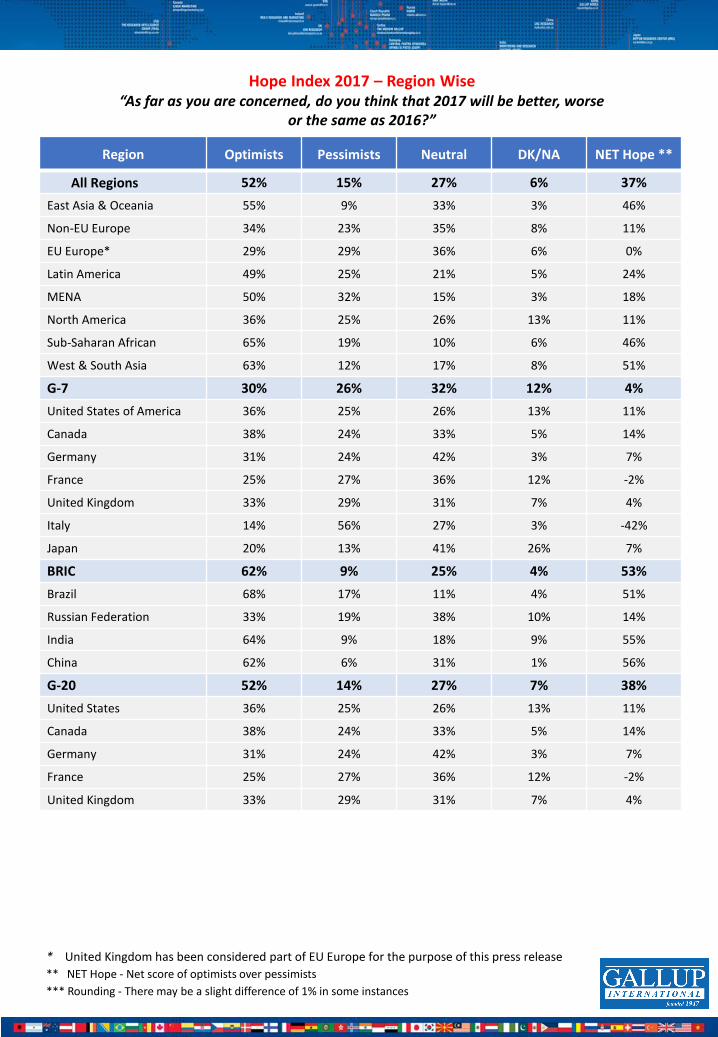
Hope Index 2017 – Region Wise“As far as you are concerned, do you think that 2017 will be better, worse
or the same as 2016?”
Region Optimists Pessimists Neutral DK/NA NET Hope **
All Regions 52% 15% 27% 6% 37%
East Asia & Oceania 55% 9% 33% 3% 46%
Non-EU Europe 34% 23% 35% 8% 11%
EU Europe* 29% 29% 36% 6% 0%
Latin America 49% 25% 21% 5% 24%
MENA 50% 32% 15% 3% 18%
North America 36% 25% 26% 13% 11%
Sub-Saharan African 65% 19% 10% 6% 46%
West & South Asia 63% 12% 17% 8% 51%
G-7 30% 26% 32% 12% 4%
United States of America 36% 25% 26% 13% 11%
Canada 38% 24% 33% 5% 14%
Germany 31% 24% 42% 3% 7%
France 25% 27% 36% 12% -2%
United Kingdom 33% 29% 31% 7% 4%
Italy 14% 56% 27% 3% -42%
Japan 20% 13% 41% 26% 7%
BRIC 62% 9% 25% 4% 53%
Brazil 68% 17% 11% 4% 51%
Russian Federation 33% 19% 38% 10% 14%
India 64% 9% 18% 9% 55%
China 62% 6% 31% 1% 56%
G-20 52% 14% 27% 7% 38%
United States 36% 25% 26% 13% 11%
Canada 38% 24% 33% 5% 14%
Germany 31% 24% 42% 3% 7%
France 25% 27% 36% 12% -2%
United Kingdom 33% 29% 31% 7% 4%
* United Kingdom has been considered part of EU Europe for the purpose of this press release
** NET Hope - Net score of optimists over pessimists
*** Rounding - There may be a slight difference of 1% in some instances
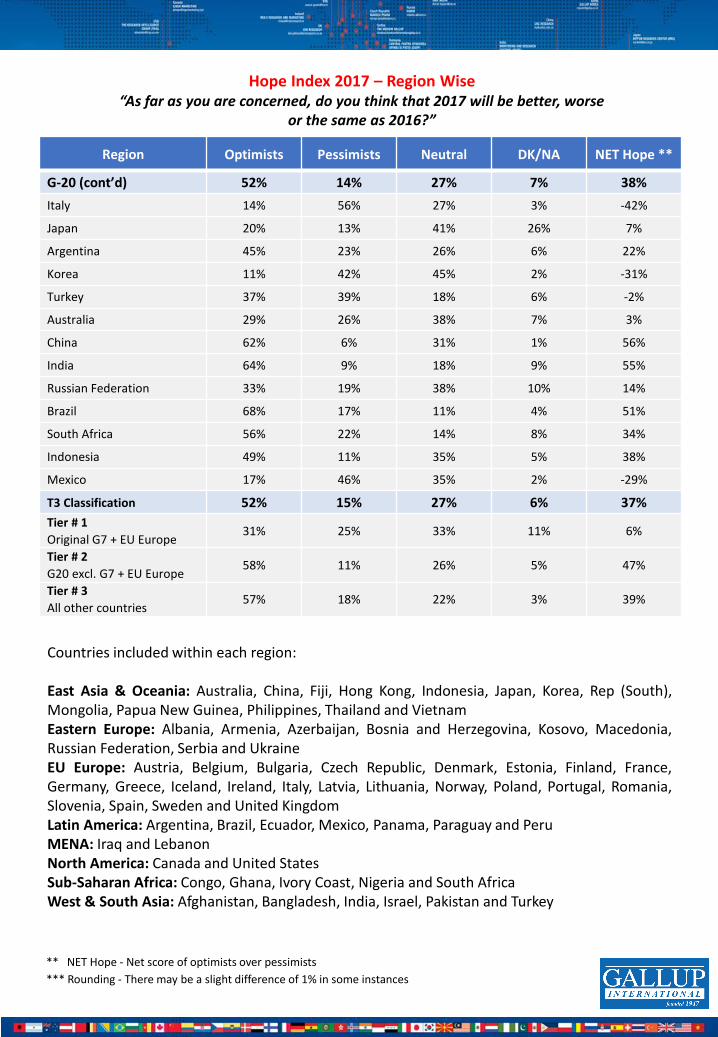
Hope Index 2017 – Region Wise“As far as you are concerned, do you think that 2017 will be better, worse
or the same as 2016?”
Region Optimists Pessimists Neutral DK/NA NET Hope **
G-20 (cont’d) 52% 14% 27% 7% 38%
Italy 14% 56% 27% 3% -42%
Japan 20% 13% 41% 26% 7%
Argentina 45% 23% 26% 6% 22%
Korea 11% 42% 45% 2% -31%
Turkey 37% 39% 18% 6% -2%
Australia 29% 26% 38% 7% 3%
China 62% 6% 31% 1% 56%
India 64% 9% 18% 9% 55%
Russian Federation 33% 19% 38% 10% 14%
Brazil 68% 17% 11% 4% 51%
South Africa 56% 22% 14% 8% 34%
Indonesia 49% 11% 35% 5% 38%
Mexico 17% 46% 35% 2% -29%
T3 Classification 52% 15% 27% 6% 37%
Tier # 1
Original G7 + EU Europe31% 25% 33% 11% 6%
Tier # 2
G20 excl. G7 + EU Europe58% 11% 26% 5% 47%
Tier # 3
All other countries57% 18% 22% 3% 39%
** NET Hope - Net score of optimists over pessimists
*** Rounding - There may be a slight difference of 1% in some instances
Countries included within each region:
East Asia & Oceania: Australia, China, Fiji, Hong Kong, Indonesia, Japan, Korea, Rep (South),Mongolia, Papua New Guinea, Philippines, Thailand and VietnamEastern Europe: Albania, Armenia, Azerbaijan, Bosnia and Herzegovina, Kosovo, Macedonia,Russian Federation, Serbia and UkraineEU Europe: Austria, Belgium, Bulgaria, Czech Republic, Denmark, Estonia, Finland, France,Germany, Greece, Iceland, Ireland, Italy, Latvia, Lithuania, Norway, Poland, Portugal, Romania,Slovenia, Spain, Sweden and United KingdomLatin America: Argentina, Brazil, Ecuador, Mexico, Panama, Paraguay and PeruMENA: Iraq and LebanonNorth America: Canada and United StatesSub-Saharan Africa: Congo, Ghana, Ivory Coast, Nigeria and South AfricaWest & South Asia: Afghanistan, Bangladesh, India, Israel, Pakistan and Turkey

Hope Index for 2017 - Demographic Wise“As far as you are concerned, do you think that 2017 will be better, worse
or the same as 2016?”
Demo Optimists Pessimists Neutrals DK/NA NET Hope *
Gender
Male 53% 15% 26% 5% 38%
Female 51% 15% 28% 6% 36%
Age Group
Under 34 60% 12% 23% 5% 48%
35 - 54 52% 16% 27% 5% 36%
55+ 35% 21% 36% 8% 14%
Monthly Household Income
Low
(Bottom quintile/20%)45% 20% 25% 10% 25%
Medium low
(Second quintile/20%)46% 16% 30% 7% 30%
Medium
(Third quintile/20%)49% 19% 27% 5% 30%
Medium high
(Fourth quintile/20%)55% 12% 29% 4% 42%
High
(Top quintile/20%)62% 11% 23% 3% 51%
I don't know / Prefer not
to answer50% 15% 22% 12% 35%
Education
No education/only basic
education58% 20% 15% 7% 38%
Completed primary 41% 23% 31% 6% 18%
Completed secondary
school46% 16% 32% 6% 29%
Completed High level
education (University)59% 12% 23% 5% 47%
Completed Higher level of
education (Masters, PHD,
etc.)
55% 16% 23% 6% 39%
I don't know / I prefer not
to answer33% 25% 25% 17% 7%
* NET Hope - Net score of optimists over pessimists
** Rounding - There may be a slight difference of 1% in some instances

Economic Optimism Index 2017 – Country Wise“Compared to this year, in your opinion, will next year be a year of economic prosperity,
economic difficulty or remain the same for your country?”
Country Optimists Pessimists Neutral DK/NANET Econ.
Optimism**
Afghanistan 25% 51% 22% 2% -26%
Albania 39% 29% 30% 2% 10%
Argentina 37% 31% 25% 7% 6%
Armenia 34% 20% 37% 9% 14%
Australia 12% 41% 39% 8% -29%
Austria 9% 47% 40% 4% -38%
Azerbaijan 20% 17% 16% 47% 3%
Bangladesh 81% 14% 5% 0% 67%
Belgium 10% 49% 26% 15% -39%
Bosnia and Herzegovina 18% 38% 41% 3% -20%
Brazil 41% 23% 31% 5% 18%
Bulgaria 12% 33% 41% 14% -21%
Canada 16% 35% 42% 7% -19%
China 44% 10% 45% 1% 34%
Congo 32% 27% 25% 16% 5%
Czech Republic 23% 24% 49% 4% -1%
Denmark 26% 18% 50% 6% 8%
Ecuador 29% 37% 26% 8% -8%
Estonia 11% 26% 54% 9% -15%
Fiji 49% 15% 33% 3% 34%
Finland 13% 27% 54% 6% -14%
France 13% 47% 30% 10% -34%
Germany 13% 37% 47% 3% -24%
Ghana 73% 6% 13% 8% 67%
Greece 6% 59% 30% 5% -53%
Hong Kong 8% 64% 24% 4% -56%
Iceland 19% 21% 43% 17% -2%
India 69% 15% 10% 6% 54%
Indonesia 35% 18% 39% 8% 17%
Iraq 35% 35% 27% 3% 0%
Ireland 22% 31% 42% 5% -9%
Israel 21% 33% 39% 7% -12%
Italy 9% 57% 31% 3% -48%
* Countries in alphabetical order** NET Economic Optimism - Net score of optimists over pessimists *** Rounding - There may be a slight difference of 1% in some instances

Economic Optimism Index – Country Wise“Compared to this year, in your opinion, will next year be a year of economic prosperity,
economic difficulty or remain the same for your country?”
Country Optimists Pessimists Neutral DK/NANET Econ.
Optimism**
Ivory Coast 69% 13% 12% 6% 56%
Japan 8% 25% 43% 24% -17%
Korea, Rep (South) 4% 66% 28% 2% -62%
Kosovo 37% 13% 40% 10% 24%
Latvia 8% 42% 40% 10% -34%
Lebanon 37% 30% 30% 3% 7%
Lithuania 18% 35% 42% 5% -17%
Macedonia 33% 27% 31% 9% 6%
Mexico 7% 56% 37% 0% -49%
Mongolia 35% 27% 37% 1% 8%
Nigeria 58% 28% 11% 3% 30%
Norway 26% 24% 43% 7% 2%
Pakistan 56% 26% 16% 2% 30%
Panama 23% 20% 54% 3% 3%
Papua New Guinea 53% 22% 21% 4% 31%
Paraguay 39% 14% 39% 8% 25%
Peru 49% 21% 23% 7% 28%
Philippines 48% 10% 39% 3% 38%
Poland 16% 36% 38% 10% -20%
Portugal 27% 22% 47% 4% 5%
Romania 22% 22% 51% 5% 0%
Russian Federation 17% 31% 40% 12% -14%
Serbia 23% 39% 35% 3% -16%
Slovenia 32% 23% 40% 5% 9%
South Africa 29% 43% 19% 9% -14%
Spain 27% 37% 34% 2% -10%
Sweden 10% 23% 64% 3% -13%
Thailand 28% 19% 51% 2% 9%
Turkey 23% 50% 23% 4% -27%
Ukraine 13% 62% 24% 1% -49%
United Kingdom 15% 53% 26% 6% -38%
United States 28% 30% 30% 12% -2%
Vietnam 60% 12% 25% 3% 48%
* Countries in alphabetical order** NET Economic Optimism - Net score of optimists over pessimists *** Rounding - There may be a slight difference of 1% in some instances

Economic Optimism Index – Region Wise“Compared to this year, in your opinion, will next year be a year of economic prosperity,
economic difficulty or remain the same for your country?”
Region Optimists Pessimists Neutral DK/NA
NET
Economic
Optimism **
All Regions 42% 22% 31% 5% 20%
East Asia & Oceania 39% 15% 43% 3% 24%
Non-EU Europe 17% 37% 36% 10% -20%
EU Europe* 15% 42% 37% 6% -27%
Latin America 31% 33% 32% 4% -2%
MENA 36% 34% 27% 3% 2%
North America 27% 30% 32% 11% -3%
Sub-Saharan African 52% 29% 13% 6% 23%
West & South Asia 66% 18% 11% 5% 48%
G-7 18% 36% 35% 11% -18%
United States of America 28% 30% 30% 12% -2%
Canada 16% 35% 42% 7% -19%
Germany 13% 37% 47% 3% -24%
France 13% 47% 30% 10% -34%
United Kingdom 15% 53% 26% 6% -38%
Italy 9% 57% 31% 3% -48%
Japan 8% 25% 43% 24% -17%
BRIC 52% 14% 31% 3% 38%
Brazil 41% 23% 31% 5% 18%
Russian Federation 17% 31% 40% 12% -14%
India 69% 15% 10% 6% 54%
China 44% 10% 45% 1% 34%
G-20 42% 21% 32% 5% 21%
United States 28% 30% 30% 12% -2%
Canada 16% 35% 42% 7% -19%
Germany 13% 37% 47% 3% -24%
France 13% 47% 30% 10% -34%
United Kingdom 15% 53% 26% 6% -38%
* United Kingdom has been considered part of EU Europe for the purpose of this press release.
** NET Economic Optimism - Net score of optimists over pessimists
*** Rounding - There may be a slight difference of 1% in some instances.
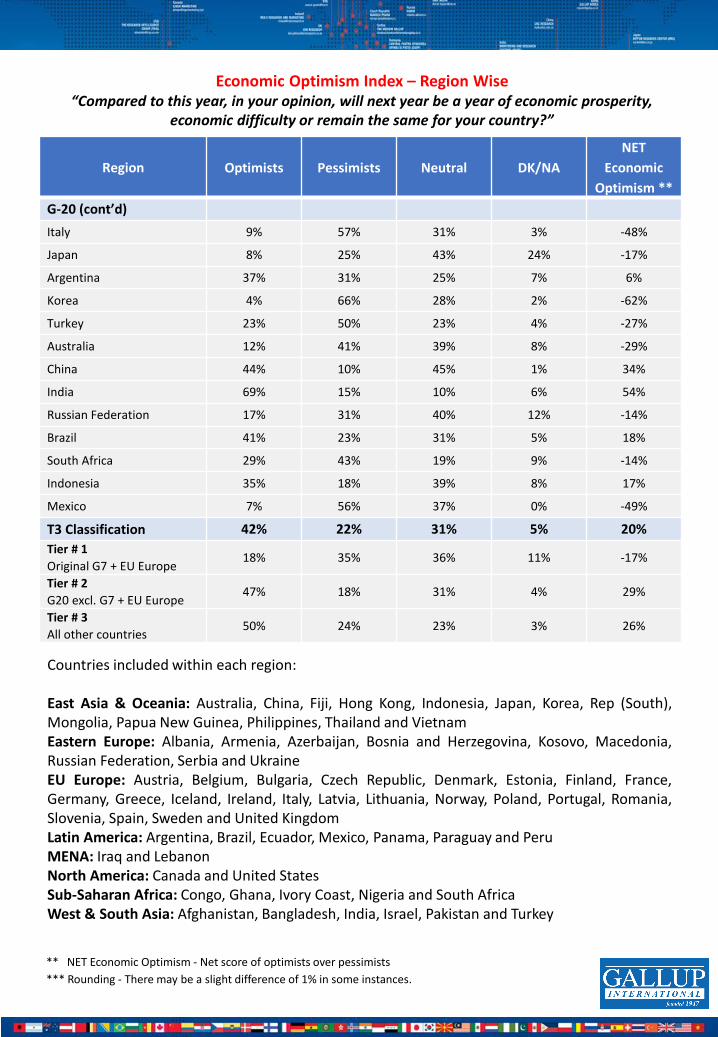
Economic Optimism Index – Region Wise“Compared to this year, in your opinion, will next year be a year of economic prosperity,
economic difficulty or remain the same for your country?”
Region Optimists Pessimists Neutral DK/NA
NET
Economic
Optimism **
G-20 (cont’d)
Italy 9% 57% 31% 3% -48%
Japan 8% 25% 43% 24% -17%
Argentina 37% 31% 25% 7% 6%
Korea 4% 66% 28% 2% -62%
Turkey 23% 50% 23% 4% -27%
Australia 12% 41% 39% 8% -29%
China 44% 10% 45% 1% 34%
India 69% 15% 10% 6% 54%
Russian Federation 17% 31% 40% 12% -14%
Brazil 41% 23% 31% 5% 18%
South Africa 29% 43% 19% 9% -14%
Indonesia 35% 18% 39% 8% 17%
Mexico 7% 56% 37% 0% -49%
T3 Classification 42% 22% 31% 5% 20%
Tier # 1
Original G7 + EU Europe18% 35% 36% 11% -17%
Tier # 2
G20 excl. G7 + EU Europe47% 18% 31% 4% 29%
Tier # 3
All other countries50% 24% 23% 3% 26%
Countries included within each region:
East Asia & Oceania: Australia, China, Fiji, Hong Kong, Indonesia, Japan, Korea, Rep (South),Mongolia, Papua New Guinea, Philippines, Thailand and VietnamEastern Europe: Albania, Armenia, Azerbaijan, Bosnia and Herzegovina, Kosovo, Macedonia,Russian Federation, Serbia and UkraineEU Europe: Austria, Belgium, Bulgaria, Czech Republic, Denmark, Estonia, Finland, France,Germany, Greece, Iceland, Ireland, Italy, Latvia, Lithuania, Norway, Poland, Portugal, Romania,Slovenia, Spain, Sweden and United KingdomLatin America: Argentina, Brazil, Ecuador, Mexico, Panama, Paraguay and PeruMENA: Iraq and LebanonNorth America: Canada and United StatesSub-Saharan Africa: Congo, Ghana, Ivory Coast, Nigeria and South AfricaWest & South Asia: Afghanistan, Bangladesh, India, Israel, Pakistan and Turkey
** NET Economic Optimism - Net score of optimists over pessimists
*** Rounding - There may be a slight difference of 1% in some instances.

Economic Optimism Index - Demographic Wise“Compared to this year, in your opinion, will next year be a year of economic prosperity,
economic difficulty or remain the same for your country?”
Demo Optimists Pessimists Neutrals DK/NA
NET
Economic
Optimism*
Gender
Male 43% 21% 31% 5% 22%
Female 40% 23% 31% 6% 17%
Age Group
Under 34 53% 19% 23% 5% 34%
35 - 54 39% 23% 34% 4% 16%
55+ 23% 29% 42% 6% -6%
Monthly Household Income
Low
(Bottom quintile/20%)38% 28% 26% 8% 10%
Medium low
(Second quintile/20%)47% 25% 24% 4% 22%
Medium
(Third quintile/20%)40% 26% 29% 5% 14%
Medium high
(Fourth quintile/20%)41% 18% 38% 3% 23%
High
(Top quintile/20%)43% 18% 35% 4% 25%
I don't know / Prefer not to
answer42% 22% 27% 9% 20%
Education
No education/only basic
education53% 23% 19% 5% 30%
Completed primary 33% 28% 33% 6% 5%
Completed secondary school 35% 24% 35% 6% 11%
Completed High level
education (University)47% 19% 29% 5% 28%
Completed Higher level of
education (Masters, PHD,
etc.)
50% 25% 22% 3% 25%
I don't know / I prefer not to
answer24% 28% 30% 18% -4%
* NET Economic Optimism - Net score of optimists over pessimists
** Rounding - There may be a slight difference of 1% in some instances.
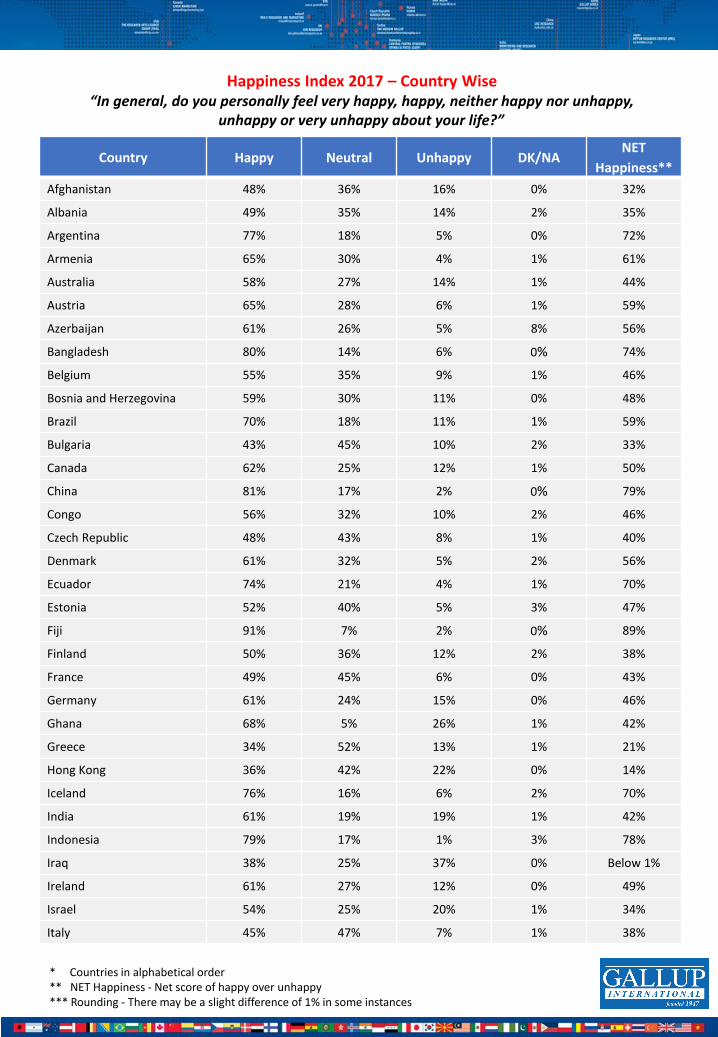
Happiness Index 2017 – Country Wise“In general, do you personally feel very happy, happy, neither happy nor unhappy,
unhappy or very unhappy about your life?”
Country Happy Neutral Unhappy DK/NANET
Happiness**
Afghanistan 48% 36% 16% 0% 32%
Albania 49% 35% 14% 2% 35%
Argentina 77% 18% 5% 0% 72%
Armenia 65% 30% 4% 1% 61%
Australia 58% 27% 14% 1% 44%
Austria 65% 28% 6% 1% 59%
Azerbaijan 61% 26% 5% 8% 56%
Bangladesh 80% 14% 6% 0% 74%
Belgium 55% 35% 9% 1% 46%
Bosnia and Herzegovina 59% 30% 11% 0% 48%
Brazil 70% 18% 11% 1% 59%
Bulgaria 43% 45% 10% 2% 33%
Canada 62% 25% 12% 1% 50%
China 81% 17% 2% 0% 79%
Congo 56% 32% 10% 2% 46%
Czech Republic 48% 43% 8% 1% 40%
Denmark 61% 32% 5% 2% 56%
Ecuador 74% 21% 4% 1% 70%
Estonia 52% 40% 5% 3% 47%
Fiji 91% 7% 2% 0% 89%
Finland 50% 36% 12% 2% 38%
France 49% 45% 6% 0% 43%
Germany 61% 24% 15% 0% 46%
Ghana 68% 5% 26% 1% 42%
Greece 34% 52% 13% 1% 21%
Hong Kong 36% 42% 22% 0% 14%
Iceland 76% 16% 6% 2% 70%
India 61% 19% 19% 1% 42%
Indonesia 79% 17% 1% 3% 78%
Iraq 38% 25% 37% 0% Below 1%
Ireland 61% 27% 12% 0% 49%
Israel 54% 25% 20% 1% 34%
Italy 45% 47% 7% 1% 38%
* Countries in alphabetical order** NET Happiness - Net score of happy over unhappy *** Rounding - There may be a slight difference of 1% in some instances

Happiness Index 2017 – Country Wise“In general, do you personally feel very happy, happy, neither happy nor unhappy,
unhappy or very unhappy about your life?”
Country Happy Neutral Unhappy DK/NANET
Happiness**
Ivory Coast 62% 18% 20% 0% 42%
Japan 59% 29% 4% 8% 55%
Korea, Rep (South) 49% 42% 9% 0% 40%
Kosovo 56% 30% 11% 3% 45%
Latvia 49% 38% 9% 4% 40%
Lebanon 63% 11% 26% 0% 37%
Lithuania 54% 36% 8% 2% 46%
Macedonia 52% 36% 10% 2% 42%
Mexico 76% 19% 4% 0.01% 72%
Mongolia 73% 24% 3% 0% 70%
Nigeria 59% 10% 30% 0.01% 29%
Norway 69% 17% 13% 1% 56%
Pakistan 77% 16% 6% 1% 71%
Panama 82% 12% 5% 1% 77%
Papua New Guinea 82% 13% 5% 0% 77%
Paraguay 77% 17% 3% 3% 74%
Peru 69% 26% 4% 1% 65%
Philippines 82% 15% 3% 0% 79%
Poland 67% 25% 7% 1% 60%
Portugal 57% 35% 7% 1% 50%
Romania 59% 16% 25% 0% 34%
Russian Federation 56% 33% 5% 6% 51%
Serbia 48% 42% 10% 0% 38%
Slovenia 59% 34% 6% 1% 53%
South Africa 56% 23% 19% 2% 37%
Spain 59% 30% 10% 1% 49%
Sweden 60% 33% 6% 1% 54%
Thailand 67% 28% 4% 0.01 63%
Turkey 46% 37% 16% 1% 30%
Ukraine 50% 43% 6% 1% 44%
United Kingdom 60% 27% 13% 0% 47%
United States 62% 24% 14% 0% 48%
Vietnam 79% 20% 1% 0% 78%
* Countries in alphabetical order** NET Happiness - Net score of happy over unhappy *** Rounding - There may be a slight difference of 1% in some instances

Happiness Index 2017 – Region Wise“In general, do you personally feel very happy, happy, neither happy nor unhappy,
unhappy or very unhappy about your life?”
Region Happy Neutral Unhappy DK/NANET
Happiness**
All Regions 68% 22% 9% 1% 59%
East Asia & Oceania 78% 19% 2% 1% 75%
Non-EU Europe 54% 35% 6% 5% 49%
EU Europe* 56% 33% 11% 1% 45%
Latin America 73% 19% 8% 1% 65%
MENA 43% 22% 35% 0% 8%
North America 62% 24% 14% 1% 48%
Sub-Saharan African 60% 14% 26% 1% 34%
West & South Asia 63% 19% 17% 0% 46%
G-7 59% 29% 11% 2% 48%
United States of America 62% 24% 14% 1% 48%
Canada 62% 25% 12% 1% 50%
Germany 61% 24% 15% 0% 46%
France 49% 45% 6% 0% 42%
United Kingdom 60% 27% 13% 1% 47%
Italy 45% 47% 7% 0% 38%
Japan 59% 29% 4% 7% 55%
BRIC 72% 19% 9% 1% 63%
Brazil 70% 18% 11% 1% 59%
Russian Federation 56% 33% 5% 6% 51%
India 61% 19% 19% 0% 42%
China 81% 17% 2% 0% 80%
G-20 69% 21% 9% 1% 60%
United States 62% 24% 14% 1% 48%
Canada 62% 25% 12% 1% 50%
Germany 61% 24% 15% 0% 46%
France 49% 45% 6% 0% 42%
United Kingdom 60% 27% 13% 1% 47%
* United Kingdom has been considered part of EU Europe for the purpose of this press release.
** NET Happiness - Net score of happy over unhappy
*** Rounding - There may be a slight difference of 1% in some instances.

Happiness Index 2017 – Region Wise“In general, do you personally feel very happy, happy, neither happy nor unhappy,
unhappy or very unhappy about your life?”
Region Happy Neutral Unhappy DK/NANET
Happiness*
G-20 (cont’d)
Italy 45% 47% 7% 0% 38%
Japan 59% 29% 4% 7% 55%
Argentina 77% 18% 5% 0% 72%
Korea 49% 42% 9% 0% 39%
Turkey 46% 37% 16% 0% 30%
Australia 58% 27% 14% 1% 44%
China 81% 17% 2% 0% 80%
India 61% 19% 19% 0% 42%
Russian Federation 56% 33% 5% 6% 51%
Brazil 70% 18% 11% 1% 59%
South Africa 56% 23% 19% 2% 37%
Indonesia 79% 17% 1% 3% 77%
Mexico 76% 19% 4% 1% 72%
T3 Classification 68% 22% 9% 1% 59%
Tier # 1
Original G7 + EU Europe58% 29% 11% 2% 48%
Tier # 2
G20 excl. G7 + EU Europe71% 19% 9% 1% 62%
Tier # 3
All other countries69% 20% 10% 0% 60%
Countries included within each region:
East Asia & Oceania: Australia, China, Fiji, Hong Kong, Indonesia, Japan, Korea, Rep (South),Mongolia, Papua New Guinea, Philippines, Thailand and VietnamEastern Europe: Albania, Armenia, Azerbaijan, Bosnia and Herzegovina, Kosovo, Macedonia,Russian Federation, Serbia and UkraineEU Europe: Austria, Belgium, Bulgaria, Czech Republic, Denmark, Estonia, Finland, France,Germany, Greece, Iceland, Ireland, Italy, Latvia, Lithuania, Norway, Poland, Portugal, Romania,Slovenia, Spain, Sweden and United KingdomLatin America: Argentina, Brazil, Ecuador, Mexico, Panama, Paraguay and PeruMENA: Iraq and LebanonNorth America: Canada and United StatesSub-Saharan Africa: Congo, Ghana, Ivory Coast, Nigeria and South AfricaWest & South Asia: Afghanistan, Bangladesh, India, Israel, Pakistan and Turkey
* NET Happiness - Net score of happy over unhappy
** Rounding - There may be a slight difference of 1% in some instances

Happiness Index 2017 – Region Wise“In general, do you personally feel very happy, happy, neither happy nor unhappy,
unhappy or very unhappy about your life?”
Demo Happy Neutral Unhappy DK/NANET
Happiness*
Gender
Male 67% 22% 10% 1% 57%
Female 69% 21% 9% 1% 60%
Age Group
Under 34 70% 20% 10% 0% 60%
35 - 54 69% 22% 9% 0% 60%
55+ 65% 25% 9% 1% 56%
Monthly Household Income
Low
(Bottom quintile/20%)52% 27% 19% 2% 33%
Medium low
(Second quintile/20%)61% 23% 16% 0% 45%
Medium
(Third quintile/20%)67% 23% 10% 0% 57%
Medium high
(Fourth quintile/20%)77% 19% 4% 0% 73%
High
(Top quintile/20%)78% 18% 3% 1% 75%
I don't know / Prefer not to
answer58% 25% 14% 3% 44%
Education
No education/only basic
education56% 20% 23% 1% 33%
Completed primary 63% 26% 10% 1% 53%
Completed secondary school 67% 21% 10% 2% 57%
Completed High level
education (University)71% 21% 7% 1% 64%
Completed Higher level of
education (Masters, PHD,
etc.)
70% 23% 7% 0% 63%
I don't know / I prefer not to
answer39% 41% 11% 9% 28%
* NET Happiness - Net score of happy over unhappy
** Rounding - There may be a slight difference of 1% in some instances

METHODOLOGY
The End of Year Survey is an annual tradition initiated by and designed under thechairmanship of Dr. George Gallup in 1977. It is conducted every year since then. This year itwas carried out by the Gallup International Association in 66 countries around the world.
A total of 66541 people were interviewed globally. In each country a representative sampleof around 1000 men and women was interviewed either face to face (25 countries;n=29211), via telephone (13 countries; n=10754), online (25 countries; n=23947) or throughmixed methods (3 countries; n=2629). The field work was conducted during October-December 2016. The margin of error for the survey is between +/-3-5% at 95% confidencelevel.
ABOUT GALLUP INTERNATIONAL ASSOCIATION
Gallup International was founded in May 1947 (Loxwood Hall, Sussex, England) by Dr.George Gallup together with 11 opinion research institutes from all over the world. It is theoldest and most known global polling organization, which fathers and mothers are amongthe people who established the key professional bodies of the market and opinion researchindustry: APOR, WAPOR and ESOMAR.
Gallup International Association (GIA) is registered in Zurich, Switzerland and is a nonprofitentity (verein). Currently the Association through its members, associates and partnerscovers more than 60 countries on all continents and about 80% of the global population.Our members/associates/partners are leading national institutes (only one per country) withprofound local knowledge of research methods and techniques, statistical data, custom andculture differences of its our country. GIA works on a daily basis to share knowledge, newresearch tools and to provide the most appropriate solutions to international researchprojects and service the client to the best of our abilities. The Association has an unique andrecognized experience and capacity to work all over the globe.
Gallup International Association is managed by five elected Board of Directors: JohnnyHeald, Michael Nitsche, Andrei Milekhin, Steven Kang and Kancho Stoychev. At the 70Annual Conference (May 2017) Kancho Stoychev was elected President and Michael NitscheExecutive Vice President.
Disclaimer: Gallup International Association or its members are not related to Gallup Inc., headquartered inWashington D.C which is no longer a member of Gallup International Association. Gallup InternationalAssociation does not accept responsibility for opinion polling other than its own. We require that oursurveys be credited fully as Gallup International (not Gallup or Gallup Poll).