half-year financial report - somfyservice.somfy.com/downloads/group/2015_half-year... · p6 –...
TRANSCRIPT
HALF-YEAR FINANCIAL REPORT at 30 June 2015

SOMFY - HALF-YEAR FINANCIAL REPORT / 20152
01 / 2015 HALF-YEAR businEss REpoRt . . . . . . . . . . . . . . . . . . . . . . . . . . . . . . . . . . . . . . . . . . . . . . . . . . . . . . . . . . . . . . . . . . . . . . . . P3– Sales . . . . . . . . . . . . . . . . . . . . . . . . . . . . . . . . . . . . . . . . . . . . . . . . . . . . . . . . . . . . . . . . . . . . . . . . . . . . . . . . . . . . . . . . . . . . . . . . . . . . . . . . . . . . . . . . . . . . . . . . . . . . . . . . . . . . . P3– Results . . . . . . . . . . . . . . . . . . . . . . . . . . . . . . . . . . . . . . . . . . . . . . . . . . . . . . . . . . . . . . . . . . . . . . . . . . . . . . . . . . . . . . . . . . . . . . . . . . . . . . . . . . . . . . . . . . . . . . . . . . . . . . . . . . . P3– Financial position . . . . . . . . . . . . . . . . . . . . . . . . . . . . . . . . . . . . . . . . . . . . . . . . . . . . . . . . . . . . . . . . . . . . . . . . . . . . . . . . . . . . . . . . . . . . . . . . . . . . . . . . . . . . . . . . . . . . . . . . P3– Seasonality . . . . . . . . . . . . . . . . . . . . . . . . . . . . . . . . . . . . . . . . . . . . . . . . . . . . . . . . . . . . . . . . . . . . . . . . . . . . . . . . . . . . . . . . . . . . . . . . . . . . . . . . . . . . . . . . . . . . . . . . . . . . . . P3– Highlights . . . . . . . . . . . . . . . . . . . . . . . . . . . . . . . . . . . . . . . . . . . . . . . . . . . . . . . . . . . . . . . . . . . . . . . . . . . . . . . . . . . . . . . . . . . . . . . . . . . . . . . . . . . . . . . . . . . . . . . . . . . . . . . . P3– Outlook . . . . . . . . . . . . . . . . . . . . . . . . . . . . . . . . . . . . . . . . . . . . . . . . . . . . . . . . . . . . . . . . . . . . . . . . . . . . . . . . . . . . . . . . . . . . . . . . . . . . . . . . . . . . . . . . . . . . . . . . . . . . . . . . . . P4
02 / 2015 condEnsEd consoLidAtEd intERim FinAnciAL stAtEmEnts . . . . . . . . . . . . . . . . . . P5– Consolidated income statement . . . . . . . . . . . . . . . . . . . . . . . . . . . . . . . . . . . . . . . . . . . . . . . . . . . . . . . . . . . . . . . . . . . . . . . . . . . . . . . . . . . . . . . . . . . . . . . . . . . . . . . P5– Consolidated statement of comprehensive income . . . . . . . . . . . . . . . . . . . . . . . . . . . . . . . . . . . . . . . . . . . . . . . . . . . . . . . . . . . . . . . . . . . . . . . . . . . . . . . . . . . . P6– Consolidated balance sheet - Assets . . . . . . . . . . . . . . . . . . . . . . . . . . . . . . . . . . . . . . . . . . . . . . . . . . . . . . . . . . . . . . . . . . . . . . . . . . . . . . . . . . . . . . . . . . . . . . . . . . . . P7– Consolidated balance sheet - Equity and liabilities . . . . . . . . . . . . . . . . . . . . . . . . . . . . . . . . . . . . . . . . . . . . . . . . . . . . . . . . . . . . . . . . . . . . . . . . . . . . . . . . . . . . . P8– Consolidated statement of changes in equity . . . . . . . . . . . . . . . . . . . . . . . . . . . . . . . . . . . . . . . . . . . . . . . . . . . . . . . . . . . . . . . . . . . . . . . . . . . . . . . . . . . . . . . . . . P9– Consolidated cash flow statement . . . . . . . . . . . . . . . . . . . . . . . . . . . . . . . . . . . . . . . . . . . . . . . . . . . . . . . . . . . . . . . . . . . . . . . . . . . . . . . . . . . . . . . . . . . . . . . . . . . . P11– Notes to the consolidated interim financial statements . . . . . . . . . . . . . . . . . . . . . . . . . . . . . . . . . . . . . . . . . . . . . . . . . . . . . . . . . . . . . . . . . . . . . . . . . . . . . . P12– Notes to the interim financial statements at 30 june 2015 . . . . . . . . . . . . . . . . . . . . . . . . . . . . . . . . . . . . . . . . . . . . . . . . . . . . . . . . . . . . . . . . . . . . . . . . . . . P15
03 / stAtutoRY AuditoRs’ REpoRt on tHE 2015 intERim FinAnciAL REpoRt . . . . . P35– Opinion on the financial statements . . . . . . . . . . . . . . . . . . . . . . . . . . . . . . . . . . . . . . . . . . . . . . . . . . . . . . . . . . . . . . . . . . . . . . . . . . . . . . . . . . . . . . . . . . . . . . . . . . .P35– Specific verification . . . . . . . . . . . . . . . . . . . . . . . . . . . . . . . . . . . . . . . . . . . . . . . . . . . . . . . . . . . . . . . . . . . . . . . . . . . . . . . . . . . . . . . . . . . . . . . . . . . . . . . . . . . . . . . . . . . . P35
04 / stAtEmEnt FRom tHE individuAL REsponsibLE FoR tHE 2015 HALF-YEAR FinAnciAL REpoRt . . . . . . . . . . . . . . . . . . . . . . . . . . . . . . . . . . . . . . . . . . . . . . . . . . . . . . . . . . . . . P36
/ contEnts
SOMFY SALimited company with share capital of €7,400,000
Registered office: 50 avenue du Nouveau Monde, 74300 Cluses, FranceRegistration number: 476 980 362 RCS Annecy
TEL. : +33 (0) 4 50 96 70 00www.somfy-group.com
SOMFY - HALF-YEAR FINANCIAL REPORT / 2015
SOMFY - HALF-YEAR FINANCIAL REPORT / 2015 3
01 /
20
15 h
al
f-y
ea
r b
us
ine
ss
re
po
rt
01/ 2015 hALF-yEAR businEss REpoRt
Consolidated data at end June (€ millions) 2015 2014 % change
Sales 547 .8 509.6 + 7.5%
Current operating result 96 .8 87.0 + 11.3%
Operating result 97 .4 69 .9 + 39.4%
Net profit 104.6 54 .3 + 92.5%
Cash flow 92 .2 81 .4 + 13.2%
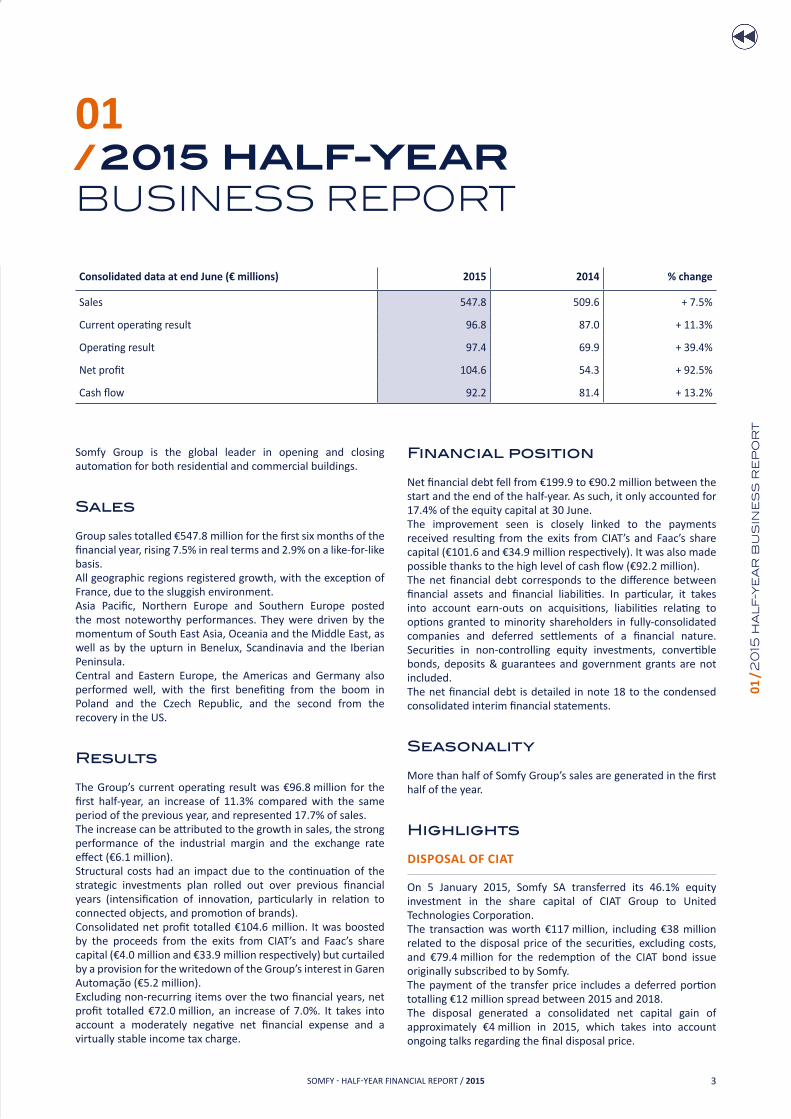
Financial position
Net financial debt fell from €199.9 to €90.2 million between the start and the end of the half-year. As such, it only accounted for 17.4% of the equity capital at 30 June.The improvement seen is closely linked to the payments received resulting from the exits from CIAT’s and Faac’s share capital (€101.6 and €34.9 million respectively). It was also made possible thanks to the high level of cash flow (€92.2 million).The net financial debt corresponds to the difference between financial assets and financial liabilities. In particular, it takes into account earn-outs on acquisitions, liabilities relating to options granted to minority shareholders in fully-consolidated companies and deferred settlements of a financial nature. Securities in non-controlling equity investments, convertible bonds, deposits & guarantees and government grants are not included .The net financial debt is detailed in note 18 to the condensed consolidated interim financial statements.
Seasonality
More than half of Somfy Group’s sales are generated in the first half of the year .
Highlights
DisPosal of CiaT
On 5 January 2015, Somfy SA transferred its 46.1% equity investment in the share capital of CIAT Group to United Technologies Corporation.The transaction was worth €117 million, including €38 million related to the disposal price of the securities, excluding costs, and €79.4 million for the redemption of the CIAT bond issue originally subscribed to by Somfy .The payment of the transfer price includes a deferred portion totalling €12 million spread between 2015 and 2018.The disposal generated a consolidated net capital gain of approximately €4 million in 2015, which takes into account ongoing talks regarding the final disposal price.
Somfy Group is the global leader in opening and closing automation for both residential and commercial buildings.
Sales
Group sales totalled €547.8 million for the first six months of the financial year, rising 7.5% in real terms and 2.9% on a like-for-like basis .All geographic regions registered growth, with the exception of France, due to the sluggish environment. Asia Pacific, Northern Europe and Southern Europe posted the most noteworthy performances. They were driven by the momentum of South East Asia, Oceania and the Middle East, as well as by the upturn in Benelux, Scandinavia and the Iberian Peninsula . Central and Eastern Europe, the Americas and Germany also performed well, with the first benefiting from the boom in Poland and the Czech Republic, and the second from the recovery in the US.
Results
The Group’s current operating result was €96.8 million for the first half-year, an increase of 11.3% compared with the same period of the previous year, and represented 17.7% of sales.The increase can be attributed to the growth in sales, the strong performance of the industrial margin and the exchange rate effect (€6.1 million).Structural costs had an impact due to the continuation of the strategic investments plan rolled out over previous financial years (intensification of innovation, particularly in relation to connected objects, and promotion of brands).Consolidated net profit totalled €104.6 million. It was boosted by the proceeds from the exits from CIAT’s and Faac’s share capital (€4.0 million and €33.9 million respectively) but curtailed by a provision for the writedown of the Group’s interest in Garen Automação (€5.2 million).Excluding non-recurring items over the two financial years, net profit totalled €72.0 million, an increase of 7.0%. It takes into account a moderately negative net financial expense and a virtually stable income tax charge.

SOMFY - HALF-YEAR FINANCIAL REPORT / 20154
01 /
20
15 h
al
f-y
ea
r b
us
ine
ss
re
po
rt
Pursuant to IFRS 5, the impact of the disposal on the income statement, the balance sheet and the cash flow statement has been highlighted in specific lines in 2014 and 2015.
CanCellaTion of faaC shares
Faac and Somfy Groups have concluded that there are no joint development projects and have therefore decided to undo the existing capital links (Somfy’s 34% holding in the share capital of Faac and Faac’s 7.3% stake in Somfy).The transaction to unwind their mutual equity interests involved the exercise of a statutory right to withdraw and thus gave rise to the cancellation of the Faac shares held by Somfy. This was offset on the Somfy side by the return of the 571,400 Somfy shares held by Faac and a balancing cash payment of €50.7 million, the payment of which includes a deferred portion totalling €13.2 million spread over 2016 and 2017.The cancellation of the Faac shares generated net financial income of €35.7 million. This transaction is reflected in the cash flow statement by the collection of €150.6 million related to the exit of the Faac securities and a movement of -€115.8 million involving Somfy SA treasury shares .
share CaPiTal
Following the transaction to cancel the Faac shares (see above), some of the returned Somfy shares (436,800 shares) have been cancelled to restrict the percentage of the share capital held by Somfy to 7.2%. As a result, the share capital of Somfy comprises 7,400,000 shares with a par value of €1 each, including 536,307 treasury shares at 30 June 2015.
Garen
During June, the Group decided to return the usufruct in the share capital of Garen automação without consideration. This transaction was unwound on 14 July 2015 from a legal perspective and as a result Somfy SA returned to its initial position of bondholder. The decision can be explained by the deterioration of the economic situation in Brazil and by the current difficulties of Garen automação’s owners.The financial statements of Garen automação at 30 June 2015 have been prepared in accordance with IFRS 5. The deconsolidation will take place in the course of the third quarter, leaving Somfy with the residual financial risk of non-collection of its financial receivables despite agreement on the rescheduling of repayment over a six-year period (2021). Accordingly and for reasons of prudence, the half-year financial statements include a writedown charge to cover the maximum risk, representing a financial expense of €12.2 million for the Group.Garen automação exiting the Group’s consolidation scope will also have an impact on second half-year sales and results .
Tax auDiTs
somfy sas was subject to a tax audit in 2012 in relation to the 2009 and 2010 financial years. The main adjustment resulting from this related to the transfer pricing policy implemented between a subsidiary of Somfy SA and Somfy SAS.The audit ended in 2014 with an agreement reached with the Tax Authorities and the financial impact has been recognised accordingly .As anticipated, a tax audit covering the 2013 financial year alone took place in the first half of 2015. The revised assessment of €1.9 million was notified and paid and was consistent with the provision established at the end of 2014.
ConTinGenT liabiliTies
somfy Mexico, the Group’s Mexican subsidiary, was subject to a tax audit in 2013 in relation to foreign trade matters. The proposed revised assessment amounted to €1.7 million and related to customs duties, VAT and penalties resulting from the lack of product certification. The company brought an action against the Tax Authorities in relation to the Customs Code that should be used for importing Somfy products to Mexico. At the end of 2014, the Group considered that the arguments put forward by the Tax Authorities were disputable and remained confident in the likelihood that this ruling would be overturned. As a result, the Group had qualified the risk as a contingent liability and no provision was recognised at 31 December 2014.In a decision made public in early July 2015, the Tax Court concluded that the revised assessment was invalid. The Tax Authorities may appeal the decision. The Group’s assessment of the risk has been confirmed and no provision for this contingent liability was recognised at 30 June 2015.
The dispute between somfy sa and the spirel employees is ongoing before the Albertville District Court . The employees seek annulment of the transfer of the Spirel securities, which took place in 2010, and to have Somfy SA ordered to pay them damages for the alleged deliberate bankruptcy of Spirel and non-material damage caused as a result of the anxiety, disappointment and vexation they claimed to have been victim of, for a total of approximately €9.7 million. In addition, in the course of July the employees also brought a case before the Albertville Labour Court, disputing the grounds for their dismissal and claiming damages of a substantially similar amount .Somfy SA disputes the arguments put forward by counsel for the Spirel employees, believes it has complied with its obligations and remains confident of its chances of receiving a favourable ruling. Therefore, the Group continues to qualify the risk as a contingent liability and no provision was recognised in relation to this dispute at 30 June 2015.
oTher ChanGes in GrouP sTruCTure
Apart from the transactions discussed above, the Group made no major acquisition during the first half of 2015.
Outlook
The second half will benefit from a more favourable base effect than the first, but should not record a notable acceleration on the whole since several markets – notably Brazil and China – are suffering from slowdowns in their respective economies, and others – such as France – are still facing an uncertain economic situation.The second part of the financial year will also be marked by the ongoing innovation and brand promotion effort, as well as by the deconsolidation of Garen Automação, a consequence of the recent return of the usufruct of the Company’s share capital.

SOMFY - HALF-YEAR FINANCIAL REPORT / 2015 5
02 /
20
15 c
on
de
ns
ed
co
ns
ol
ida
te
d in
te
rim
fin
an
cia
l s
tat
em
en
ts
02/ 2015 CONdENsEd CONsOLIdATEd intERim FinAnciAL stAtEmEnts
Consolidated income statement
€ thousandsnotes 30/06/15
6 months30/06/14*
6 months31/12/14*
fY
Sales (3) 547,810 509,642 981,731
Other operating income 6,309 5,577 15,944
Cost of sales – 195,822 – 184,223 – 360,903
Employee expenses – 157,531 – 146,292 – 286,902
External expenses – 84,844 – 80,310 – 163,131
ebiTDa 115,922 104,394 186,739
Amortisation and depreciation charges (10) & (11) – 17,815 – 15,958 – 32,825
Charges to/reversal of current provisions – 426 23 – 776
Gains and losses on disposal of non-current operating assets 598 85 – 279
ebiTa 98,278 88,544 152,860
Amortisation of allocated intangible assets (10) – 1,453 – 1,538 – 3,119
CurrenT oPeraTinG resulT 96,825 87,006 149,741
Other operating income and expenses (4) 580 227 424
Impairment of goodwill (9) – – 17,350 – 24,295
oPeraTinG resulT 97,405 69,884 125,870
– Financial income from investments 391 542 922
– Financial expenses related to borrowings – 2,631 – 2,103 – 4,831
Cost of net financial debt – 2,239 – 1,560 – 3,908
Other financial income and expenses 17,923 1,111 – 2,382
NET FINANCIAL INCOME/(EXPENSE) (5) 15,684 – 449 – 6,290
ProfiT before Tax 113,089 69,435 119,580
Income tax (6) – 12,582 – 18,958 – 27,288
Share of net profit/(loss) from associates (12) 111 – 545 – 428
neT ProfiT froM ConTinuinG oPeraTions 100,618 49,932 91,864
NET PROFIT/(LOSS) FROM OPERATIONS HELD FOR SALE OR DISTRIBUTION (8) 3,976 4,398 – 53,795
ConsoliDaTeD neT ProfiT 104,594 54,330 38,069
Attributable to: Group share 104,871 53,936 37,959
Attributable to: Non-controlling interests – 277 394 110
basic earnings per share (€) (7) 15.28 7.25 5.11
Diluted earnings per share (€) (7) 15.25 7.24 5.10
* The financial statements have been restated following the application of IFRIC 21 (see Accounting rules and methods).

SOMFY - HALF-YEAR FINANCIAL REPORT / 20156
02 /
20
15 c
on
de
ns
ed
co
ns
ol
ida
te
d in
te
rim
fin
an
cia
l s
tat
em
en
ts
Consolidated statement of comprehensive income
€ thousands 30/06/15 30/06/14*
Net profit for the period 104,594 54,330
Movement in gains and losses on translation of foreign currency 8,724 999
Movement in fair value of assets available for sale – 17,370 11,500
Movement in fair value of interest rate hedges – 258
Movement in fair value of foreign currency hedges – 579 – 146
Movement in tax on items that may be reclassified to profit or loss 6,063 – 1,036
Items that may be reclassified to profit or loss – 3,162 11,576
Movement in actuarial gains and losses – –
Movement in tax on items that will not be reclassified to profit or loss – –
Items that will not be reclassified to profit or loss – –
items of other comprehensive income directly recognised in equity – 3,162 11,576
Total comprehensive income for the period** 101,432 65,906
Attributable to: Group share 101,709 65,512
Attributable to: Non-controlling interests** – 277 394
* The financial statements have been restated following the application of IFRIC 21 (see Accounting rules and methods).** The difference in the net profit with the consolidated statement of changes in equity is due to the change in the value of put options granted to holders of non-controlling interests: -€0.2 million at 30 June 2015 and +€0.4 million at 30 June 2014.
SOMFY - HALF-YEAR FINANCIAL REPORT / 2015 7
02 /
20
15 c
on
de
ns
ed
co
ns
ol
ida
te
d in
te
rim
fin
an
cia
l s
tat
em
en
ts
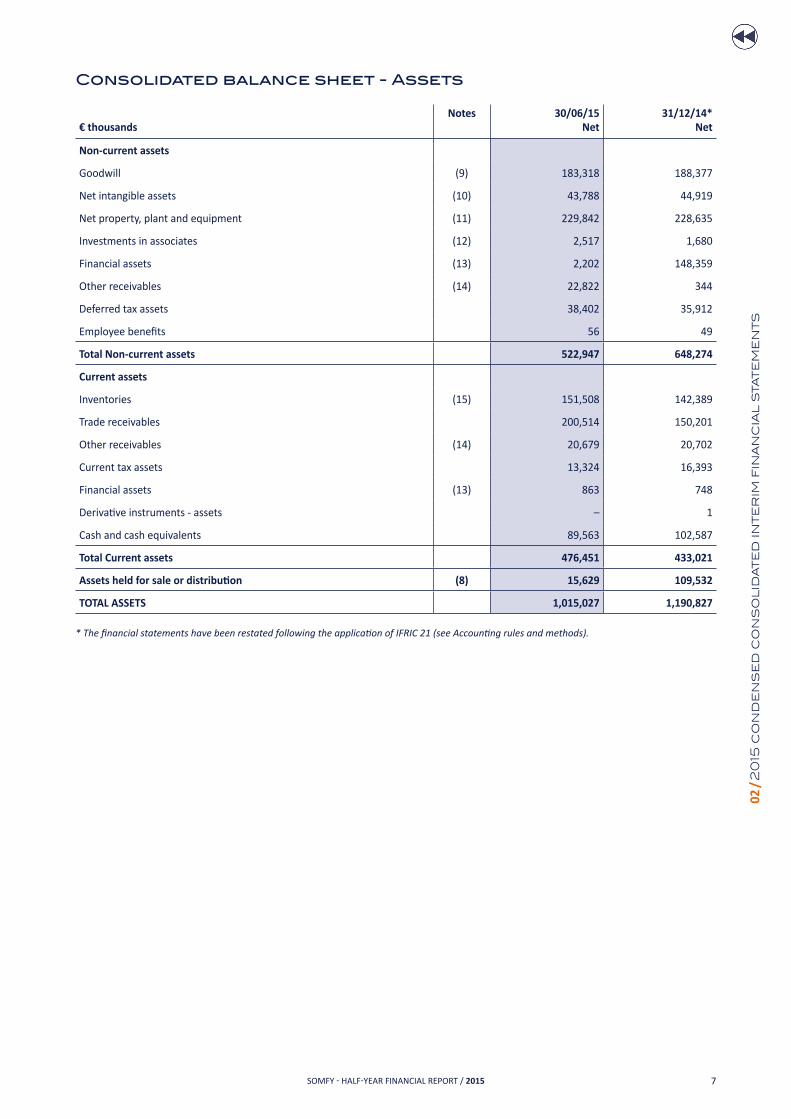
Consolidated balance sheet - Assets
€ thousandsnotes 30/06/15
net31/12/14*
net
non-current assets
Goodwill (9) 183,318 188,377
Net intangible assets (10) 43,788 44,919
Net property, plant and equipment (11) 229,842 228,635
Investments in associates (12) 2,517 1,680
Financial assets (13) 2,202 148,359
Other receivables (14) 22,822 344
Deferred tax assets 38,402 35,912
Employee benefits 56 49
Total non-current assets 522,947 648,274
Current assets
Inventories (15) 151,508 142,389
Trade receivables 200,514 150,201
Other receivables (14) 20,679 20,702
Current tax assets 13,324 16,393
Financial assets (13) 863 748
Derivative instruments - assets – 1
Cash and cash equivalents 89,563 102,587
Total Current assets 476,451 433,021
Assets held for sale or distribution (8) 15,629 109,532
ToTal asseTs 1,015,027 1,190,827
* The financial statements have been restated following the application of IFRIC 21 (see Accounting rules and methods).

SOMFY - HALF-YEAR FINANCIAL REPORT / 20158
02 /
20
15 c
on
de
ns
ed
co
ns
ol
ida
te
d in
te
rim
fin
an
cia
l s
tat
em
en
ts
Consolidated balance sheet - Equity and liabilities
€ thousands notes 30/06/15 31/12/14*
shareholders’ equity
Share capital 7,400 7,837
Share premium 1,866 1,866
Other reserves 404,005 522,966
Net profit for the period 104,871 37,959
Group share 518,143 570,629
Non-controlling interests 204 210
Total shareholders’ equity 518,347 570,839
Non-current liabilities
Non-current provisions (16) 14,404 21,640
Other financial liabilities (17) 65,855 63,127
Other liabilities 1,744 1,705
Employee benefits 20,623 20,180
Deferred tax liabilities 41,951 51,556
Total Non-current liabilities 144,576 158,208
Current liabilities
Current provisions (16) 8,617 7,869
Other financial liabilities (17) 114,371 240,297
Trade payables 117,261 91,754
Other liabilities 83,056 90,232
Tax liabilities 11,936 12,233
Derivative instruments - liabilities 1,235 255
Total Current liabilities 336,476 442,640
Liabilities related to assets held for sale or distribution (8) 15,629 19,140
ToTal eQuiTY anD liabiliTies 1,015,027 1,190,827
* The financial statements have been restated following the application of IFRIC 21 (see Accounting rules and methods).

SOMFY - HALF-YEAR FINANCIAL REPORT / 2015 9
02 /
20
15 c
on
de
ns
ed
co
ns
ol
ida
te
d in
te
rim
fin
an
cia
l s
tat
em
en
ts
Consolidated statement of changes in equity
aT 30 June 2015
€ thousands
share capital (1)
share premium
Treasury shares
Gain/loss on fair value of assets available
for sale
actuarial gains and
losses
interest rate hedges
foreign currency
hedges
at 31 December 2014 7,837 1,866 – 72,013 17,370 – 10,393 – – 220
Total comprehensive income for the period
– – – – 17,370 – – – 579
Treasury share transactions (2) – 437 – – 27,363 – – – –
Dividends – – – – – – –
Other movements (3) – – – – – – –
at 30 June 2015 7,400 1,866 – 99,376 – – 10,393 – – 799
expenses related to acquisitions
of non-controlling interests
Movements in put
options (4)
Deferred tax
Changes in foreign exchange
rates
Consolidated reserves
and net profit
Total shareholders’
equity
non-controlling interests
Total equity (Group share)
– 2,369 – 336 – 1,910 9,210 621,795 570,839 210 570,629
– – 6,063 8,724 104,822 101,660 – 49 101,709
– – – – – 87,881 – 115,681 – – 115,681
– – – – – 35,693 – 35,693 – – 35,693
– – 2,654 – 12 – – 112 – 2,778 43 – 2,821
– 2,369 – 2,990 4,142 17,934 602,931 518,347 204 518,143
(1) Share capital comprises 7,400,000 shares with a par value of €1 (see Note 1.3).(2) Cancellation of the 571,400 shares received as part of the Faac transaction (see Notes 1.2 and 1.3).(3) Changes in consolidation scope and foreign exchange gains and losses on equity transactions.(4) The subsequent fair values of liabilities related to put options granted to holders of non-controlling interests are recognised under equity.
SOMFY - HALF-YEAR FINANCIAL REPORT / 201510
02 /
20
15 c
on
de
ns
ed
co
ns
ol
ida
te
d in
te
rim
fin
an
cia
l s
tat
em
en
ts
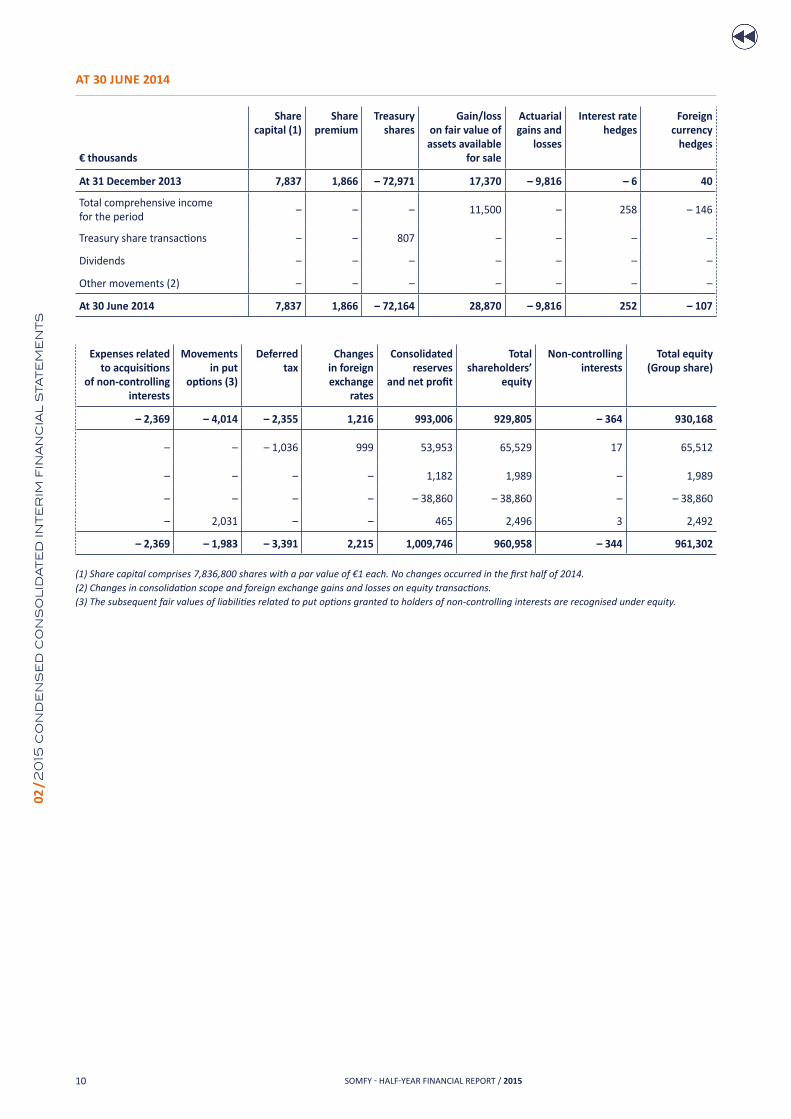
aT 30 June 2014
€ thousands
share capital (1)
share premium
Treasury shares
Gain/loss on fair value of assets available
for sale
actuarial gains and
losses
interest rate hedges
foreign currency
hedges
at 31 December 2013 7,837 1,866 – 72,971 17,370 – 9,816 – 6 40
Total comprehensive income for the period
– – – 11,500 – 258 – 146
Treasury share transactions – – 807 – – – –
Dividends – – – – – – –
Other movements (2) – – – – – – –
at 30 June 2014 7,837 1,866 – 72,164 28,870 – 9,816 252 – 107
expenses related to acquisitions
of non-controlling interests
Movements in put
options (3)
Deferred tax
Changes in foreign exchange
rates
Consolidated reserves
and net profit
Total shareholders’
equity
non-controlling interests
Total equity (Group share)
– 2,369 – 4,014 – 2,355 1,216 993,006 929,805 – 364 930,168
– – – 1,036 999 53,953 65,529 17 65,512
– – – – 1,182 1,989 – 1,989
– – – – – 38,860 – 38,860 – – 38,860
– 2,031 – – 465 2,496 3 2,492
– 2,369 – 1,983 – 3,391 2,215 1,009,746 960,958 – 344 961,302
(1) Share capital comprises 7,836,800 shares with a par value of €1 each. No changes occurred in the first half of 2014.(2) Changes in consolidation scope and foreign exchange gains and losses on equity transactions.(3) The subsequent fair values of liabilities related to put options granted to holders of non-controlling interests are recognised under equity.

SOMFY - HALF-YEAR FINANCIAL REPORT / 2015 11
02 /
20
15 c
on
de
ns
ed
co
ns
ol
ida
te
d in
te
rim
fin
an
cia
l s
tat
em
en
ts
Consolidated cash flow statement
€ thousandsnotes 30/06/15
6 months30/06/14*
6 months31/12/14*
fY
Consolidated net profit 104,594 54,330 38,069
Net profit from operations held for sale or distribution – 3,976 – 4,398 53,795
Net profit from continuing operations 100,618 49,932 91,864
Depreciation and amortisation of assets (excluding current assets) 31,497 35,125 60,025
Charges to/reversals of provisions for liabilities 284 784 677
Unrealised gains and losses related to fair value movements 401 26 – 32
Unrealised foreign exchange gains and losses – 358 – 583 – 330
Income and expenses related to stock options and employee benefits 1,511 1,284 3,584
Depreciation, amortisation, provisions and other non-cash items 33,335 36,637 63,924
Profit on disposal of assets and others – 36,266 – 59 272
Share of net profit/(loss) from associates – 111 545 428
Deferred tax expense – 5,356 – 5,622 – 8,111
Cash flow 92,220 81,433 148,378
Cost of net financial debt (excluding non-cash items) 2,239 1,560 3,908
Tax expense (excluding deferred tax) 17,979 24,580 35,399
Change in working capital requirements (21) – 40,164 – 50,171 – 16,315
Tax paid – 15,476 – 9,624 – 50,177
NET CASH FLOW FROM OPERATING ACTIVITIES (A) 56,798 47,778 121,192
Acquisition-related disbursements:
– intangible assets and property, plant and equipment – 27,504 – 23,149 – 45,982
– non-current financial assets – 113 – 285 – 603
Disposal-related proceeds:
– intangible assets and property, plant and equipment 1,746 441 519
– non-current financial assets** 150,620 1,402 1,686
Change in current financial assets 168 258 240
Acquisition of companies, net of cash acquired – 763 – 2,234 – 2,234
Dividends paid by non-consolidated companies – – 187
Interest received 411 476 511
NET CASH FLOW FROM INVESTING ACTIVITIES (B) 124,566 – 23,090 – 45,676
Increase in loans 1,749 10,154 218,135
Reimbursement of loans – 128,696 – 2,496 – 6,853
Net increase in shareholders' equity of subsidiaries – 18 – 1
Dividends and interim dividends paid – 35,693 – 38,666 – 38,666
Movement in treasury shares** – 115,772 1,837 1,879
Interest paid – 2,790 – 2,163 – 4,665
NET CASH FLOW FROM FINANCING ACTIVITIES (C) – 281,220 – 31,334 169,831
Net cash flow from operations held for sale or distribution (D) (8) 81,631 – 22,425 – 278,141
Impact of changes in foreign exchange rates on cash and cash equivalents (E) 3,558 1,202 2,313
NET CHANGE IN CASH AND CASH EQUIVALENTS (A + B + C + D + E) – 14,667 – 27,869 – 30,482
Cash anD Cash eQuiValenTs aT The sTarT of The PerioD (21) 100,175 130,657 130,657
Cash anD Cash eQuiValenTs aT The enD of The PerioD (21) 85,508 102,788 100,175
* The financial statements have been restated following the application of IFRIC 21 (see Accounting rules and methods).** Faac transaction: cancellation of Faac shares and return of Somfy SA shares (see Note 1.2).
SOMFY - HALF-YEAR FINANCIAL REPORT / 201512
02 /
20
15 c
on
de
ns
ed
co
ns
ol
ida
te
d in
te
rim
fin
an
cia
l s
tat
em
en
ts
Notes to the consolidated interim financial statements
1. aPProVal of finanCial sTaTeMenTs
somfy sa is a company governed by a Management Board and a Supervisory Board, listed on the Eurolist of Euronext Paris (Compartment A, ISIN code: FR 0000120495). Somfy Group is specialised in opening and closing automation and controls for both residential and commercial buildings (motors for blinds, shutters, curtains, screens, doors, gates, etc.). The head office is based in Cluses, in the Haute-Savoie district.The condensed consolidated financial statements of somfy Group at 30 June 2015 have been prepared by the Management Board on 28 August 2015. Total assets were €1,015,027 thousand and consolidated net profit €104,594 thousand (Group share: €104,871 thousand).
2. aCCounTinG rules anD MeThoDs
In application of European Regulation 1606/2002 of 19 July 2002, the Somfy Group’s condensed consolidated financial statements have been prepared in accordance with IFRS (International Financial Reporting Standards) published by the IASB (International Accounting Standards Board), as adopted by the European Union at 30 June 2015. These standards are available on the European Commission website at http://ec.europa.eu/finance/accounting/ias/index_en.htmThe half-year condensed consolidated financial statements have been prepared in accordance with the international financial reporting standard IAS 34 (“Interim financial reporting”). They do not contain all disclosures and notes included in the full-year financial statements. As a result, they must be read in conjunction with the Group’s consolidated financial statements at 31 December 2014.The Group’s consolidated financial statements for the year ended 31 December 2014 are available from the Group’s website www.somfyfinance.com and upon request from head office.
neW sTanDarDs anD inTerPreTaTions in forCe
Standards, amendments and interpretations applicable within the European Union with effect from annual periods beginning on or after 1 January 2015
The Group has applied the following standards, amendments and interpretations as of 1 January 2015 at the latest:
ifriC 21 – levies:This text specifies that the obligating event for the recognition of the liability related to the various taxes, duties and other levies that do not fall within the scope of IAS 12 depends on the provisions of the relevant legislation, irrespective of the calculation base period.The European Union has stated that this text must be applied to annual periods beginning on or after 17 June 2014 (resulting in it being applied by the Group as of 1 January 2015) as opposed to 1 January 2014 according to the IASB.Since the application of this interpretation is retrospective, the restatement of historical data is provided in Note 2 .
annual improvements to ifrs – 2010-2012 and 2011-2013 cycles: mandatory application for financial years starting on or after 1 February 2015 and 1 January 2015:In December 2013, the IASB published the Improvements to IFRS 2010-2012 and 2011-2013 as part of its annual process of reviewing and improving standards. The main amendments are as follows:
– IFRS 2 – Share-based payment: clarification of the notion of “vesting condition”,
– IFRS 3 – Business combinations: accounting for contingent consideration in a business combination,
– IFRS 8 – Operating segments: disclosures regarding the criteria for the aggregation of operating segments and the reconciliation of the total of the reportable segments’ assets to the entity’s assets,
– IFRS 13 – Fair value measurement: clarification of the notion of fair value concerning short-term receivables and payables,
– IAS 16 – Property, plant and equipment and IAS 38 – Intangible assets: application procedures for the revaluation method,
– IAS 24 – Related party disclosures: clarification of the notion of services performed by “key” management personnel,
– IFRS 3 – Business combinations: scope exceptions for joint ventures,
– IFRS 13 – Fair value measurement: offsetting possibilities for a portfolio of financial assets and liabilities,
– IAS 40 – Investment property: clarifying the interrelationship between IFRS 3 and IAS 40 to determine the extent to which the acquisition of a building can be analysed as a business combination within the meaning of IFRS 3.
Amendments to IAS 19 – Defined benefit plans: employee contributions:This amendment applies to contributions from employees or third parties to defined-benefit plans. The aim of the amendment is to simplify the recognition of contributions that are independent of the number of years of employee service, such as employee contributions calculated on the basis of a fixed percentage of salary. These contributions may be recognised as a reduction in service cost in the period in which the service is rendered, instead of being attributed to periods of service.
Apart from the application of IFRIC 21, these new standards have not had a material impact on the Group’s results and financial position.
Standards and interpretations not yet applicable in the european union
Subject to their being definitively adopted by the European Union, the standards and amendments to standards presented below apply on the following dates according to the IASB:
IFRS 9 – Financial instruments: classification and measurement and subsequent amendments to ifrs 9 and ifrs 7: applicable from 1 January 2018:This is the first of three parts of IFRS 9 – Financial instruments intended to replace IAS 39 – Financial instruments – Recognition and measurement. The first part concerns the classification and measurement of financial instruments. The effects of the application of this standard cannot be analysed independently of the other two parts that have not yet been published and which should address the impairment of financial assets and hedge accounting respectively.
ifrs 15 – revenue from contracts with customers: applicable from 1 January 2018:IFRS 15 replaces IAS 11 – Construction contracts and IAS 18 – Revenue, and the corresponding interpretations: IFRIC 13 – Customer loyalty programmes, IFRIC 15 – Agreements for the construction of real estate, IFRIC 18 – Transfers of assets from customers and SIC 31 – Revenue – Barter transactions involving advertising services.This standard sets out the principles for recognising revenue from contracts with customers (except contracts covered by specific standards such as leases, insurance contracts and financial instruments). The basic principle is that revenue recognition should describe the transfer of goods or services
SOMFY - HALF-YEAR FINANCIAL REPORT / 2015 13
02 /
20
15 c
on
de
ns
ed
co
ns
ol
ida
te
d in
te
rim
fin
an
cia
l s
tat
em
en
ts
to a customer, at an amount that reflects the payment that the entity expects to receive in return for those goods or services. The accounting standards setter has identified five stages for implementing this standard:– identifying the contract(s) with a customer,– identifying the performance obligations in the contract,– determining the transaction price,– allocating the transaction price to the performance obligations,– recognising revenue as the entity satisfies a performance
obligation.The new standard will also improve disclosures required in the notes, provide an application guide for transactions that were not fully dealt with before (e.g. revenue from services and contract adjustments) and improve the application arrangements for contracts with multiple elements.
Amendments to IFRS 11 – Accounting for acquisitions of interests in joint operations: applicable from 1 January 2016:This published amendment details how to recognise acquisitions of interests in a joint venture, the activity of which constitutes a business within the meaning of IFRS 3 – Business combinations.For these acquisitions, an entity must apply the accounting principles relating to business combinations under IFRS 3 and other IFRS that do not contradict the provisions of IFRS 11. It must also provide information required for business combinations in the notes. This applies at the time an interest is initially acquired, and at the time of any subsequent acquisitions.In such cases, the entity must:– determine the fair value of identifiable assets and liabilities;– expense acquisition-related costs in the period in which these
costs were incurred and the services received;– recognise deferred tax generated by the initial recognition of
assets and liabilities as required by IFRS 3 and IAS 12 (Income taxes) for business combinations (except for deferred tax resulting from the initial recognition of goodwill);
– recognise under goodwill any surplus in the consideration transferred relative to the amount of identifiable assets acquired or liabilities assumed on the acquisition date;
– perform an impairment test at least once per year on the cash generating units to which goodwill has been allocated.
Amendments to IAS 16 and IAS 38 – Clarification of acceptable methods of depreciation and amortisation: applicable from 1 January 2016:IAS 16 and IAS 38 both involve the principle whereby the basis for depreciation/amortisation corresponds to the consumption of the future economic benefits embodied in an asset. The IASB has stated that using a revenue-based method for depreciation/amortisation is not appropriate, since revenue generated by a business that includes the use of an asset involves factors other than the consumption of economic benefits embodied in that asset .The IASB has also stated that revenue is, in general, presumed to be an inappropriate basis for measuring the consumption of economic benefits embodied in an intangible asset. However, this presumption may be rebutted in certain limited circumstances.
annual improvements to ifrs - 2012-2014 cycles: Amendments affect the following standards:– IFRS 5 – Non-current assets held for sale and discontinued
operations: change in the disposal method,– IFRS 7 – Financial instruments: disclosures: i) servicing
contracts and ii) applicability to condensed interim financial statements of the amendments to IFRS 7 relating to the disclosure of offsetting,
– IAS 19 – Employee benefits: discount rate – regional market issue,
– IAS 34 – Interim financial reporting: disclosure of information “elsewhere in the interim financial report”.
The amendments will be effective for financial years beginning on or after 1 January 2016. Early application is permitted.
Amendment to IAS 27 – Equity method in separate financial statements: applicable from 1 January 2016:On 12 August 2014, the International Accounting Standards Board (IASB) published amendments to IAS 27 entitled “Equity method in separate financial statements”.Amendments to IAS 27 will make it possible for entities to use the equity method as set out in IAS 28 – Investments in associates and joint ventures to recognise their investments in subsidiaries, joint ventures and associates in their financial statements. To date, such investments were recognised either at cost or in accordance with IFRS 9.The amendments will encourage certain jurisdictions to adopt IFRS for separate financial statements by reducing compliance costs without reducing the information available to investors.The amendments are in response to submissions received by the IASB as part of its initial public consultation regarding its agenda.
amendments to ifrs 10, ifrs 12 and ias 28 – investment entities: applying the consolidation exception: applicable from 1 January 2016:On 18 December 2014, the IASB published amendments restricted to IFRS 10, IFRS 12 and IAS 28 entitled “Investment entities: applying the consolidation exception”. Amendments made to IFRS 10 – Consolidated financial statements are intended to provide clarification regarding the consolidation exemption rules applicable to investment entities: accordingly, if an investment entity has a subsidiary the sole purpose of which is to provide services related to investment activities, the latter must be consolidated unless it is an investment entity itself, in which case the subsidiary is measured at fair value through profit and loss.Amendments made to IAS 28 – Investments in associates and joint ventures specify that if an entity which is not an investment entity itself has an interest in an associate or joint venture which is an investment entity, this entity can retain, when applying the equity method, the fair value measurement applied by the associate or joint venture to the interests in its subsidiaries.According to the IASB, amendments will be applicable to financial years beginning on or after 1 January 2016. Early application is permitted. Amendment to IAS 1 – Presentation of financial statements: applicable from 1 January 2016:On 18 December 2014, the IASB published amendments to IAS 1 – Presentation of financial statements as part of its major initiative to improve the presentation and disclosure requirements in financial reports.The IASB initiative is comprised of a set of targeted actions and an extensive and ambitious review of provisions related to notes to the financial statements.The IAS 1 amendments published by the IASB are intended to clarify two aspects of these provisions:– applying the concept of materiality, specifying that it applies to
the financial statements and their notes and that the inclusion of non-material information can impair their understanding;
– applying professional judgment, marginally modifying certain formulations considered to be prescriptive and thus leaving no room for judgement.
Amendment to IFRS 10 and IAS 28 – Sale or contribution of assets between the Group and equity-accounted entities: applicable from 1 January 2016:On 11 September 2014, the IASB published limited amendments to IFRS 10 – Consolidated financial statements and IAS 28 – Investments in associates and joint ventures, entitled “Sale or contribution of assets between an investor and its associate or joint venture”.
SOMFY - HALF-YEAR FINANCIAL REPORT / 201514
02 /
20
15 c
on
de
ns
ed
co
ns
ol
ida
te
d in
te
rim
fin
an
cia
l s
tat
em
en
ts
The purpose of these amendments is to reduce discrepancies between the provisions of IFRS 10 and IAS 28 (2011) related to the sale or contribution of assets between an investor and an associate or joint venture.The main consequence of these amendments is that gains and losses on disposals must be fully recognised where the transaction involves a business as defined in IFRS 3 (whether the business is a subsidiary or not). Partial gains and losses are recognised where the transaction involves assets that do not constitute a business as defined in IFRS 3, including in the case of a subsidiary. In such cases, the gains or losses are only recognised in the investor’s financial statements to the extent of the unrelated investors’ interests in the associate or joint venture (in other words, the investor’s share of gains and losses resulting from the transactions is eliminated, offset by the book value of the investment in the associate or joint venture).Amendments will apply prospectively to annual periods beginning on or after 1 January 2016.
The Group did not opt for the early application of any of these standards and amendments and is currently assessing the impacts resulting from their initial application.
JuDGMenT anD esTiMaTes
The preparation of the consolidated financial statements requires Management to make a number of judgments, estimates and assumptions liable to affect the values of certain assets, liabilities, and income and expense items in the financial statements, and certain information provided in the notes to the financial statements. Due to the inherently uncertain nature of assumptions, actual results may differ from these estimates. The Group reviews its estimates and assessments on a regular basis to take past experience into account and incorporate factors considered relevant under current economic conditions.As part of the preparation of these consolidated interim financial statements, the main judgments made and the main assumptions used by Management have been updated with the latest indicators used for the closing of the accounts at 30 June 2015.At 30 June, Somfy Group reviews its performance indicators and, if necessary, carries out impairment tests if there is any indication that an asset may have been impaired.
NON-CURRENT ASSETS (OR GROUPS OF ASSETS) HELD FOR sale or DisTribuTion anD DisConTinueD oPeraTions
Pursuant to IFRS 5 – Non-current assets held for sale or distribution, a non-current asset or asset group must be classified in the balance sheet as held for sale if its book value will be recovered principally through a sale transaction rather than through continuing use. Within the meaning of the standard, “sale” includes sales, distributions and exchanges against other assets . The non-current asset or asset group held for sale must be available for immediate sale in their present condition subject only to terms that are usual and customary for sales of such assets and their sale must be highly probable . The following criteria must be taken into account when assessing whether the sale is highly probable:– the appropriate level of management must be committed to
a disposal plan; – an active programme to locate a buyer and complete the plan
must have been initiated; – the asset must be actively marketed for sale at a price that is
reasonable in relation to its current fair value;– the disposal must be reliably expected to be completed within
12 months from the reclassification of the assets as held for disposal or exchange;
– the actions required to complete the plan must indicate that it is unlikely that significant changes will be made or that the plan will be withdrawn.
Prior to their reclassification as “Assets held for sale or distribution”, the non-current asset or assets and liabilities of the disposal group are measured in accordance with their respective applicable standards. Following their reclassification as “Assets held for sale or distribution”, the non-current asset or group of assets is measured at the lower of its net book value and its fair value less costs to sell, an impairment loss being recognised where relevant. On reclassification of a non-current asset as held for sale or distribution, the depreciation/amortisation of this asset ceases. In the case of a disposal resulting in a loss of control, the assets and liabilities of the entire subsidiary are classified as assets and liabilities “held for sale” in the “Assets held for sale or distribution” and “Liabilities related to assets held for sale or distribution” balance sheet items, as soon as the disposal meets the classification criteria of IFRS 5.Pursuant to the application of IFRS 5: – Balance sheet items are classified as assets and liabilities held
for sale or distribution without restatement of the comparative year;
– Income statement and cash flow items related to these operations held for sale or distribution are presented separately in the financial statements for all reported periods;
– Income statement and cash flow statement items relating to the individual assets held for sale are not restated .
IFRIC 21 – LEVIES
The IFRIC 21 interpretation – Levies specifies that the recognition date of levies as an expense is the date of the event triggering the obligation to pay the levies. Regarding the Group, the levies concerned by this interpretation are property taxes and the C3S contribution, which are now fully accounted for as expenses at 1 January of each financial year, since spreading them is no longer permitted.Since the application of this interpretation is retrospective, the restatement of historical data is provided in Note 2 .
IFRS 8 – SEGMENT REPORTING
Due to the demerger of Somfy Activities and Somfy Participations at the end of 2014, the disposal of the CIAT equity investment early in 2015 and the unwinding of cross-shareholdings with Faac, the Group has revised the presentation of its segment reporting.Somfy includes entities the business of which comes under the “Home & Building”, “Access” and “Home Automation” applications and is structured in two geographic regions. For 2015, the geographic location of assets was used as sole segment reporting criterion. Management makes its decisions based on this strategic focus using reporting by geographic region as its key analysis tool .The two geographic regions are:– Europe, Middle East and Africa (EMEA), and– Asia and Americas (A&A).

SOMFY - HALF-YEAR FINANCIAL REPORT / 2015 15
02 /
20
15 c
on
de
ns
ed
co
ns
ol
ida
te
d in
te
rim
fin
an
cia
l s
tat
em
en
ts
Notes to the interim financial statements at 30 june 2015
noTe 1: hiGhliGhTs
noTe 1.1: DisPosal of CiaT
On 5 January 2015, Somfy SA transferred its 46.1% equity investment in the share capital of CIAT Group to United Technologies Corporation.The transaction was worth €117 million, including €38 million related to the disposal price of the securities, excluding costs, and €79.4 million for the redemption of the CIAT bond issue originally subscribed to by Somfy .The payment of the transfer price includes a deferred portion totalling €12 million spread between 2015 and 2018.The disposal generated a consolidated net capital gain of approximately €4 million in 2015, which takes into account ongoing talks regarding the final disposal price. Pursuant to IFRS 5, the impact of the disposal on the income statement, the balance sheet and the cash flow statement has been highlighted in specific lines in 2014 and 2015.
noTe 1.2: CanCellaTion of faaC shares
Faac and Somfy Groups have concluded that there are no joint development projects and have therefore decided to undo the existing capital links (Somfy’s 34% holding in the share capital of Faac and Faac’s 7.3% stake in Somfy).The transaction to unwind their mutual equity interests involved the exercise of a statutory right to withdraw and thus gave rise to the cancellation of the Faac shares held by Somfy. This was offset on the Somfy side by the return of the 571,400 Somfy shares held by Faac and a balancing cash payment of €50.7 million, the payment of which includes a deferred portion totalling €13.2 million spread over 2016 and 2017.The cancellation of the Faac shares generated net financial income of €35.7 million. This transaction is reflected in the cash flow statement by the collection of €150.6 million related to the exit of the Faac securities and a movement of -€115.8 million involving Somfy SA treasury shares .
noTe 1.3: share CaPiTal
Following the transaction to cancel the Faac shares (see Note 1.2), some of the returned Somfy shares (436,800 shares) have been cancelled to restrict the percentage of the share capital held by Somfy to 7.2%. As a result, the share capital of Somfy comprises 7,400,000 shares with a par value of €1 each, including 536,307 treasury shares at 30 June 2015.
noTe 1.4: Garen
During June, the Group decided to return the usufruct in the share capital of Garen automação without consideration. This transaction was unwound on 14 July 2015 from a legal perspective and as a result Somfy SA returned to its initial position of bondholder. The decision can be explained by the deterioration of the economic situation in Brazil and by the current difficulties of Garen automação’s owners.The financial statements of Garen automação at 30 June 2015 have been prepared in accordance with IFRS 5. The deconsolidation will take place in the course of the third quarter, leaving Somfy with the residual financial risk of non-collection of its financial receivables despite agreement on the rescheduling of repayment over a six-year period (2021). Accordingly and for reasons of prudence, the half-year financial statements include
a writedown charge to cover the maximum risk, representing a financial expense of €12.2 million for the Group. Garen automação exiting the Group’s consolidation scope will also have an impact on second half-year sales and results .
noTe 1.5: Tax auDiTs
somfy sas was subject to a tax audit in 2012 in relation to the 2009 and 2010 financial years. The main adjustment resulting from this related to the transfer pricing policy implemented between a subsidiary of Somfy SA and Somfy SAS.The audit ended in 2014 with an agreement reached with the Tax Authorities and the financial impact has been recognised accordingly .As anticipated, a tax audit covering the 2013 financial year alone took place in the first half of 2015. The revised assessment of €1.9 million was notified and paid and was consistent with the provision established at the end of 2014.
noTe 1.6: ConTinGenT liabiliTies
somfy Mexico, the Group’s Mexican subsidiary, was subject to a tax audit in 2013 in relation to foreign trade matters. The proposed revised assessment amounted to €1.7 million and related to customs duties, VAT and penalties resulting from the lack of product certification. The company brought an action against the Tax Authorities in relation to the Customs Code that should be used for importing Somfy products to Mexico. At the end of 2014, the Group considered that the arguments put forward by the Tax Authorities were disputable and remained confident in the likelihood that this ruling would be overturned. As a result, the Group had qualified the risk as a contingent liability and no provision was recognised at 31 December 2014.In a decision made public in early July 2015, the Tax Court concluded that the revised assessment was invalid. The Tax Authorities may appeal the decision. The Group’s assessment of the risk has been confirmed and no provision for this contingent liability was recognised at 30 June 2015.
The dispute between somfy sa and the spirel employees is ongoing before the Albertville District Court . The employees seek annulment of the transfer of the Spirel securities, which took place in 2010, and to have Somfy SA ordered to pay them damages for the alleged deliberate bankruptcy of Spirel and non-material damage caused as a result of the anxiety, disappointment and vexation they claimed to have been victim of, for a total of approximately €9.7 million. In addition, in the course of July the employees also brought a case before the Albertville Labour Court, disputing the grounds for their dismissal and claiming damages of a substantially similar amount .Somfy SA disputes the arguments put forward by counsel for the Spirel employees, believes it has complied with its obligations and remains confident of its chances of receiving a favourable ruling. Therefore, the Group continues to qualify the risk as a contingent liability and no provision was recognised in relation to this dispute at 30 June 2015.
noTe 1.7: oTher ChanGes in GrouP sTruCTure
Apart from the transactions discussed above, the Group made no major acquisition during the first half of 2015.
SOMFY - HALF-YEAR FINANCIAL REPORT / 201516
02 /
20
15 c
on
de
ns
ed
co
ns
ol
ida
te
d in
te
rim
fin
an
cia
l s
tat
em
en
ts
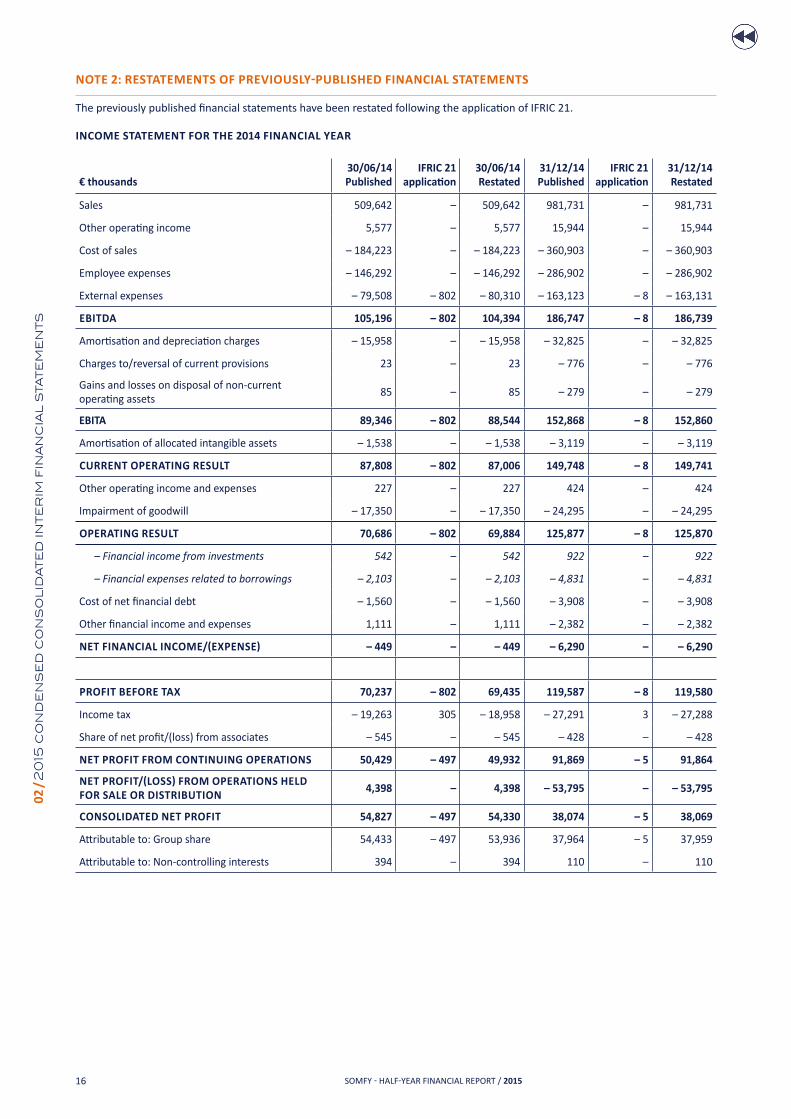
NOTE 2: RESTATEMENTS OF PREVIOUSLY-PUBLISHED FINANCIAL STATEMENTS
The previously published financial statements have been restated following the application of IFRIC 21.
inCoMe sTaTeMenT for The 2014 finanCial Year
€ thousands30/06/14Published
ifriC 21 application
30/06/14restated
31/12/14Published
ifriC 21 application
31/12/14restated
Sales 509,642 – 509,642 981,731 – 981,731
Other operating income 5,577 – 5,577 15,944 – 15,944
Cost of sales – 184,223 – – 184,223 – 360,903 – – 360,903
Employee expenses – 146,292 – – 146,292 – 286,902 – – 286,902
External expenses – 79,508 – 802 – 80,310 – 163,123 – 8 – 163,131
ebiTDa 105,196 – 802 104,394 186,747 – 8 186,739
Amortisation and depreciation charges – 15,958 – – 15,958 – 32,825 – – 32,825
Charges to/reversal of current provisions 23 – 23 – 776 – – 776
Gains and losses on disposal of non-current operating assets
85 – 85 – 279 – – 279
ebiTa 89,346 – 802 88,544 152,868 – 8 152,860
Amortisation of allocated intangible assets – 1,538 – – 1,538 – 3,119 – – 3,119
CurrenT oPeraTinG resulT 87,808 – 802 87,006 149,748 – 8 149,741
Other operating income and expenses 227 – 227 424 – 424
Impairment of goodwill – 17,350 – – 17,350 – 24,295 – – 24,295
oPeraTinG resulT 70,686 – 802 69,884 125,877 – 8 125,870
– Financial income from investments 542 – 542 922 – 922
– Financial expenses related to borrowings – 2,103 – – 2,103 – 4,831 – – 4,831
Cost of net financial debt – 1,560 – – 1,560 – 3,908 – – 3,908
Other financial income and expenses 1,111 – 1,111 – 2,382 – – 2,382
NET FINANCIAL INCOME/(EXPENSE) – 449 – – 449 – 6,290 – – 6,290
ProfiT before Tax 70,237 – 802 69,435 119,587 – 8 119,580
Income tax – 19,263 305 – 18,958 – 27,291 3 – 27,288
Share of net profit/(loss) from associates – 545 – – 545 – 428 – – 428
neT ProfiT froM ConTinuinG oPeraTions 50,429 – 497 49,932 91,869 – 5 91,864
NET PROFIT/(LOSS) FROM OPERATIONS HELD for sale or DisTribuTion
4,398 – 4,398 – 53,795 – – 53,795
ConsoliDaTeD neT ProfiT 54,827 – 497 54,330 38,074 – 5 38,069
Attributable to: Group share 54,433 – 497 53,936 37,964 – 5 37,959
Attributable to: Non-controlling interests 394 – 394 110 – 110

SOMFY - HALF-YEAR FINANCIAL REPORT / 2015 17
02 /
20
15 c
on
de
ns
ed
co
ns
ol
ida
te
d in
te
rim
fin
an
cia
l s
tat
em
en
ts
balanCe sheeT for The 2014 finanCial Year
assets
€ thousands
31/12/14Published net
ifriC 21 application
31/12/14restated
net
non-current assets
Goodwill 188,377 – 188,377
Net intangible assets 44,919 – 44,919
Net property, plant and equipment 228,635 – 228,635
Investments in associates 1,680 – 1,680
Financial assets 148,359 – 148,359
Other receivables 344 – 344
Deferred tax assets 36,203 – 291 35,912
Employee benefits 49 – 49
Total non-current assets 648,565 – 291 648,274
Current assets
Inventories 142,389 – 142,389
Trade receivables 150,201 – 150,201
Other receivables 20,702 – 20,702
Current tax assets 16,393 – 16,393
Financial assets 748 – 748
Derivative instruments - assets 1 – 1
Cash and cash equivalents 102,587 – 102,587
Total Current assets 433,021 – 433,021
Assets held for sale or distribution 109,532 – 109,532
ToTal asseTs 1,191,118 – 291 1,190,827
SOMFY - HALF-YEAR FINANCIAL REPORT / 201518
02 /
20
15 c
on
de
ns
ed
co
ns
ol
ida
te
d in
te
rim
fin
an
cia
l s
tat
em
en
ts
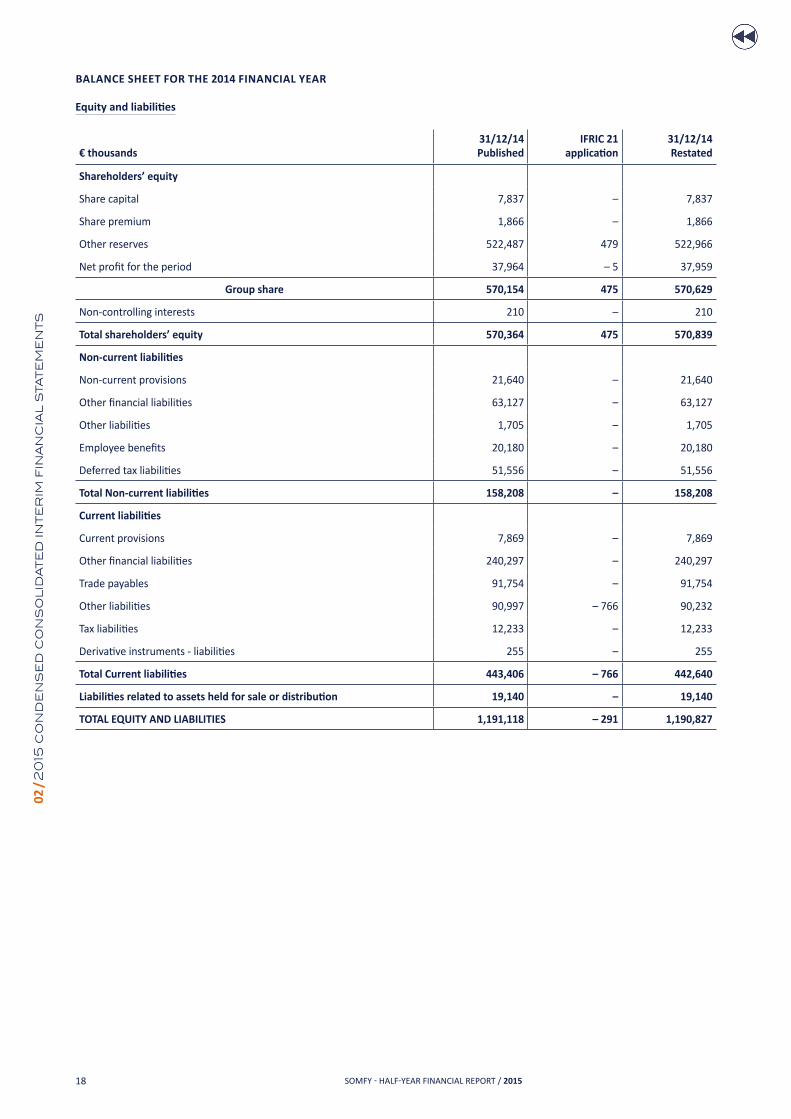
balanCe sheeT for The 2014 finanCial Year
Equity and liabilities
€ thousands31/12/14Published
ifriC 21 application
31/12/14restated
shareholders’ equity
Share capital 7,837 – 7,837
Share premium 1,866 – 1,866
Other reserves 522,487 479 522,966
Net profit for the period 37,964 – 5 37,959
Group share 570,154 475 570,629
Non-controlling interests 210 – 210
Total shareholders’ equity 570,364 475 570,839
Non-current liabilities
Non-current provisions 21,640 – 21,640
Other financial liabilities 63,127 – 63,127
Other liabilities 1,705 – 1,705
Employee benefits 20,180 – 20,180
Deferred tax liabilities 51,556 – 51,556
Total Non-current liabilities 158,208 – 158,208
Current liabilities
Current provisions 7,869 – 7,869
Other financial liabilities 240,297 – 240,297
Trade payables 91,754 – 91,754
Other liabilities 90,997 – 766 90,232
Tax liabilities 12,233 – 12,233
Derivative instruments - liabilities 255 – 255
Total Current liabilities 443,406 – 766 442,640
Liabilities related to assets held for sale or distribution 19,140 – 19,140
ToTal eQuiTY anD liabiliTies 1,191,118 – 291 1,190,827

SOMFY - HALF-YEAR FINANCIAL REPORT / 2015 19
02 /
20
15 c
on
de
ns
ed
co
ns
ol
ida
te
d in
te
rim
fin
an
cia
l s
tat
em
en
ts
Cash floW sTaTeMenT for The 2014 finanCial Year
€ thousands30/06/14Published
ifriC 21 application
30/06/14restated
31/12/14Published
ifriC 21 application
31/12/14restated
Consolidated net profit 54,827 – 497 54,330 38,074 – 5 38,069
Net profit from operations held for sale or distribution – 4,398 – – 4,398 53,795 – 53,795
Net profit from continuing operations 50,429 – 497 49,932 91,869 – 5 91,864
Depreciation and amortisation of assets (excluding current assets)
35,125 – 35,125 60,025 – 60,025
Charges to/reversals of provisions for liabilities 784 – 784 677 – 677
Unrealised gains and losses related to fair value movements
26 – 26 – 32 – – 32
Unrealised foreign exchange gains and losses – 583 – – 583 – 330 – – 330
Income and expenses related to stock options and employee benefits
1,284 – 1,284 3,584 – 3,584
Depreciation, amortisation, provisions and other non-cash items
36,637 – 36,637 63,924 – 63,924
Profit on disposal of assets and others – 59 – – 59 272 – 272
Share of net profit/(loss) from associates 545 – 545 428 – 428
Deferred tax expense – 5,317 – 305 – 5,622 – 8,108 – 3 – 8,111
Cash flow 82,235 – 802 81,433 148,386 – 8 148,378
Cost of net financial debt (excluding non-cash items) 1,560 – 1,560 3,908 – 3,908
Tax expense (excluding deferred tax) 24,580 – 24,580 35,399 – 35,399
Change in working capital requirements – 50,973 802 – 50,171 – 16,323 8 – 16,315
Tax paid – 9,624 – – 9,624 – 50,177 – – 50,177
NET CASH FLOW FROM OPERATING ACTIVITIES (A) 47,778 – 47,778 121,192 – 121,192
Acquisition-related disbursements:
– intangible assets and property, plant and equipment – 23,149 – – 23,149 – 45,982 – – 45,982
– non-current financial assets – 285 – – 285 – 603 – – 603
Disposal-related proceeds:
– intangible assets and property, plant and equipment 441 – 441 519 – 519
– non-current financial assets 1,402 – 1,402 1,686 – 1,686
Change in current financial assets 258 – 258 240 – 240
Acquisition of companies, net of cash acquired – 2,234 – – 2,234 – 2,234 – – 2,234
Dividends paid by non-consolidated companies – – – 187 – 187
Interest received 476 – 476 511 – 511
NET CASH FLOW FROM INVESTING ACTIVITIES (B) – 23,090 – – 23,090 – 45,676 – – 45,676
Increase in loans 10,154 – 10,154 218,135 – 218,135
Reimbursement of loans – 2,496 – – 2,496 – 6,853 – – 6,853
Dividends and interim dividends paid – 38,666 – – 38,666 – 38,666 – – 38,666
Movement in treasury shares 1,837 – 1,837 1,879 – 1,879
Interest paid – 2,163 – – 2,163 – 4,665 – – 4,665
neT Cash floW froM finanCinG anD CaPiTal ACTIVITIES (C)
– 31,334 – – 31,334 169,831 – 169,831
Net cash flow from operations held for sale or distribution (D)
– 22,425 – – 22,425 – 278,141 – – 278,141
Impact of changes in foreign exchange rates on cash and cash equivalents (E)
1,202 – 1,202 2,313 – 2,313
neT ChanGe in Cash anD Cash eQuiValenTs (A + B + C + D + E)
– 27,869 – – 27,869 – 30,482 – – 30,482
Cash anD Cash eQuiValenTs aT The sTarT of The PerioD
130,657 – 130,657 130,657 – 130,657
Cash anD Cash eQuiValenTs aT The enD of The PerioD
102,788 – 102,788 100,175 – 100,175

SOMFY - HALF-YEAR FINANCIAL REPORT / 201520
02 /
20
15 c
on
de
ns
ed
co
ns
ol
ida
te
d in
te
rim
fin
an
cia
l s
tat
em
en
ts
noTe 3: seGMenT rePorTinG
The Group is structured in two geographic regions (see Accounting rules and methods): – Europe, Middle East and Africa (EMEA), and– Asia and Americas (A&A).
aT 30 June 2015
€ thousandseurope, Middle east and africa
asia & americas
intra-regional eliminations
Consolidated
Segment sales 421,909 161,179 – 35,278 547,810
Intra-segment sales – 23,755 – 11,523 35,278 –
Segment sales - Contribution to sales 398,154 149,656 – 547,810
Segment performance (Current Operating Result) 67,065 29,761 – 96,825
Net profit/(loss) from operations sold or held for sale (IFRS 5) 3,976 – – 3,976
Share of net profit/(loss) from associates – 111 – 111
Cash flow 83,782 8,438 – 92,220
Net investments in intangible assets and PPE 19,994 5,764 – 25,758
Goodwill 86,769 96,549 – 183,318
Net intangible assets and PPE 211,097 62,532 – 273,630
Non-controlling equity investments 181 – – 181
Investments in associates 612 1,905 – 2,517
Net assets held for sale (IFRS 5) – – – –
aT 30 June 2014
€ thousandseurope, Middle east and africa
asia & americas
intra-regional eliminations
Consolidated
Segment sales 408,622 135,199 – 34,178 509,642
Intra-segment sales – 27,112 – 7,066 34,178 –
Segment sales - Contribution to sales 381,510 128,133 – 509,642
Segment performance (Current Operating Result) 56,910 30,096 – 87,006
Net profit/(loss) from operations sold or held for sale (IFRS 5) 4,398 – – 4,398
Share of net profit/(loss) from associates – – 545 – – 545
Cash flow 73,378 8,055 – 81,433
Net investments in intangible assets and PPE 18,623 4,084 – 22,708
Goodwill 86,528 99,309 – 185,837
Net intangible assets and PPE 202,361 65,325 – 267,686
Non-controlling equity investments 157,183 – – 157,183
Investments in associates – 1,675 – 1,675
Net assets held for sale (IFRS 5) 260,339 – – 260,339
SOMFY - HALF-YEAR FINANCIAL REPORT / 2015 21
02 /
20
15 c
on
de
ns
ed
co
ns
ol
ida
te
d in
te
rim
fin
an
cia
l s
tat
em
en
ts
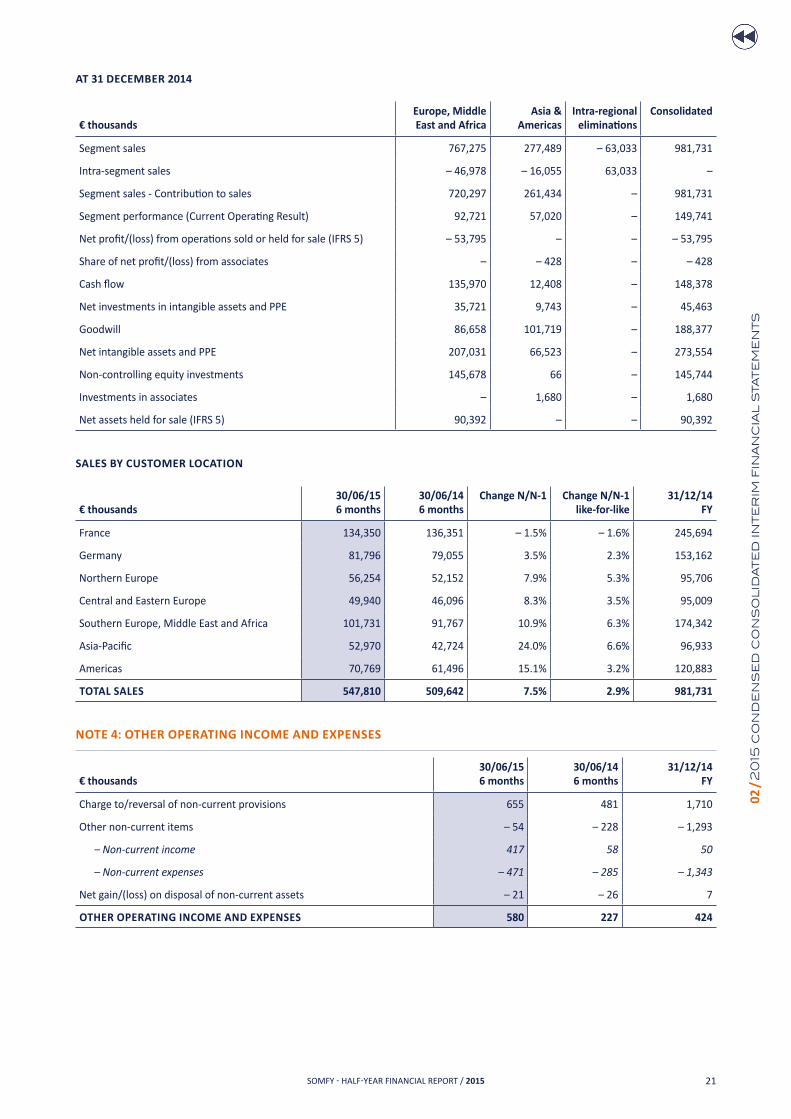
aT 31 DeCeMber 2014
€ thousandseurope, Middle east and africa
asia & americas
intra-regional eliminations
Consolidated
Segment sales 767,275 277,489 – 63,033 981,731
Intra-segment sales – 46,978 – 16,055 63,033 –
Segment sales - Contribution to sales 720,297 261,434 – 981,731
Segment performance (Current Operating Result) 92,721 57,020 – 149,741
Net profit/(loss) from operations sold or held for sale (IFRS 5) – 53,795 – – – 53,795
Share of net profit/(loss) from associates – – 428 – – 428
Cash flow 135,970 12,408 – 148,378
Net investments in intangible assets and PPE 35,721 9,743 – 45,463
Goodwill 86,658 101,719 – 188,377
Net intangible assets and PPE 207,031 66,523 – 273,554
Non-controlling equity investments 145,678 66 – 145,744
Investments in associates – 1,680 – 1,680
Net assets held for sale (IFRS 5) 90,392 – – 90,392
sales bY CusToMer loCaTion
€ thousands30/06/156 months
30/06/146 months
Change n/n-1 Change n/n-1 like-for-like
31/12/14fY
France 134,350 136,351 – 1.5% – 1.6% 245,694
Germany 81,796 79,055 3.5% 2.3% 153,162
Northern Europe 56,254 52,152 7.9% 5.3% 95,706
Central and Eastern Europe 49,940 46,096 8.3% 3.5% 95,009
Southern Europe, Middle East and Africa 101,731 91,767 10.9% 6.3% 174,342
Asia-Pacific 52,970 42,724 24.0% 6.6% 96,933
Americas 70,769 61,496 15.1% 3.2% 120,883
ToTal sales 547,810 509,642 7.5% 2.9% 981,731
noTe 4: oTher oPeraTinG inCoMe anD exPenses
€ thousands30/06/156 months
30/06/146 months
31/12/14fY
Charge to/reversal of non-current provisions 655 481 1,710
Other non-current items – 54 – 228 – 1,293
– Non-current income 417 58 50
– Non-current expenses – 471 – 285 – 1,343
Net gain/(loss) on disposal of non-current assets – 21 – 26 7
oTher oPeraTinG inCoMe anD exPenses 580 227 424

SOMFY - HALF-YEAR FINANCIAL REPORT / 201522
02 /
20
15 c
on
de
ns
ed
co
ns
ol
ida
te
d in
te
rim
fin
an
cia
l s
tat
em
en
ts
NOTE 5: NET FINANCIAL INCOME/(EXPENSE)
€ thousands30/06/156 months
30/06/146 months
31/12/14fY
Cost of net financial debt – 2,239 – 1,560 – 3,908
– Financial income from investments 391 542 922
– Financial expenses related to borrowings – 2,631 – 2,103 – 4,831
Effect of foreign currency translation – 3,703 1,248 – 2,126
Other* 21,626 – 136 – 256
NET FINANCIAL INCOME/(EXPENSE) 15,684 – 449 – 6,290
* Including income of €35.7 million after expenses on the cancellation of Faac shares (see Note 1.2) and €12.2 million provision for Garen Automação liabilities (see Note 1.4).
noTe 6: inCoMe Tax
€ thousands30/06/156 months
30/06/14*6 months
31/12/14*fY
Profit before tax from continuing operations 113,089 69,435 119,580
Share of expenses on dividends 8,202 5,166 841
Dividends of non-consolidated companies – 38,339 – –
Goodwill impairment – 17,350 20,542
Reclassification of CVAE to Income tax – 1,512 – 1,593 – 3,194
Reclassification of CICE to Employee expenses – 986 – – 1,964
Reclassification of CIR to Other operating income – 1,693 – – 3,509
Other – 7,463 1,488 – 60
Permanent differences – 41,791 22,411 12,656
Net profit taxed at reduced rate** – 12,924 – 12,419 – 21,981
Net profit taxable at standard rate 58,374 79,427 110,255
Tax rate in France 38.00% 38.00% 38.00%
Tax charge recalculated at the French standard rate 22,182 30,182 41,897
Tax at reduced rate** 2,210 2,124 3,759
Difference in standard rate in foreign countries*** – 14,773 – 14,575 – 22,642
Tax losses for the year, unrecognised in previous periods, deficits used 1,140 974 1,315
Effect of the rate difference – 13,633 – 13,601 – 21,327
Tax credits**** – 1,678 – 2,432 – 4,518
Other taxes and miscellaneous***** 3,501 2,685 7,477
Group tax 12,582 18,958 27,288
Effective rate 11.13% 27.30% 22.82%
* The financial statements have been restated following the application of IFRIC 21 (see Accounting rules and methods).** Royalties taxed at reduced rate (17.1%). *** At 30 June 2015, the main contributing countries were Tunisia (€9.8 million) where the tax rate was nil, Germany (€0.5 million), other European countries (€2.1 million) and countries of the Middle East (€1.2 million). **** Including the SOPEM tax credit of -€1.5 million at 30 June 2015. ***** Including the CVAE of €1.5 million and the 3% contribution on dividends of €1.1 million for the period ended 30 June 2015.
SOMFY - HALF-YEAR FINANCIAL REPORT / 2015 23
02 /
20
15 c
on
de
ns
ed
co
ns
ol
ida
te
d in
te
rim
fin
an
cia
l s
tat
em
en
ts
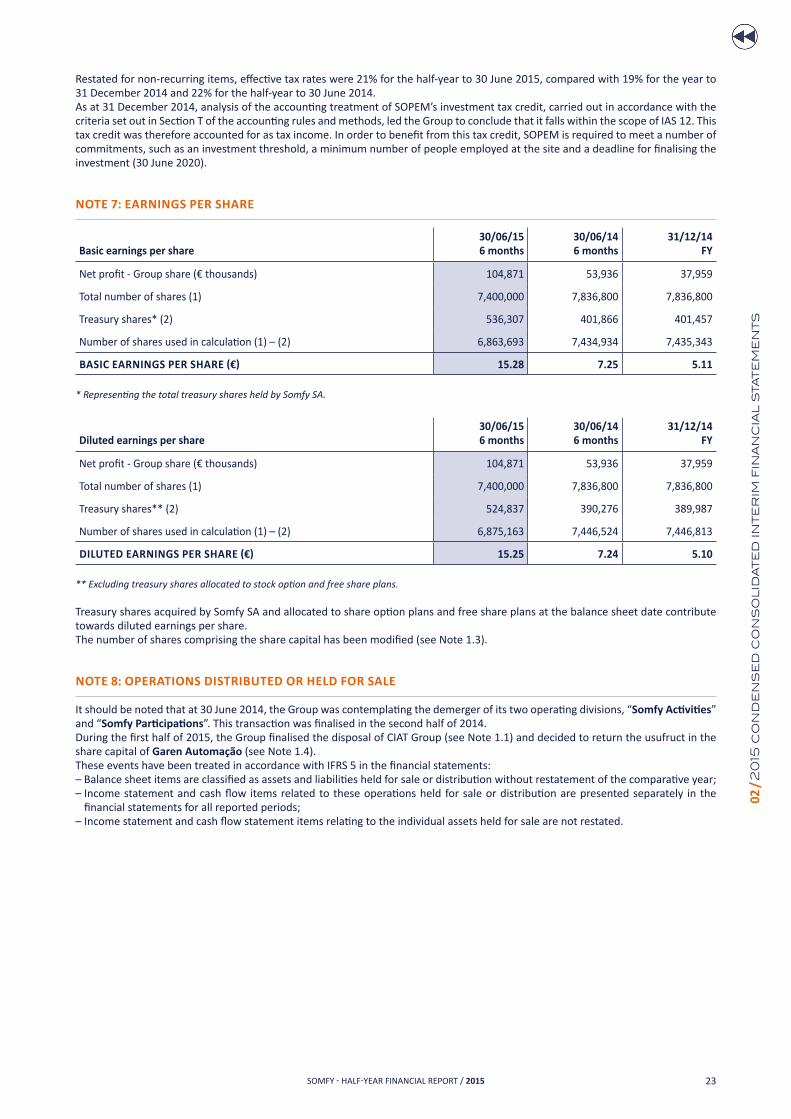
Restated for non-recurring items, effective tax rates were 21% for the half-year to 30 June 2015, compared with 19% for the year to 31 December 2014 and 22% for the half-year to 30 June 2014. As at 31 December 2014, analysis of the accounting treatment of SOPEM’s investment tax credit, carried out in accordance with the criteria set out in Section T of the accounting rules and methods, led the Group to conclude that it falls within the scope of IAS 12. This tax credit was therefore accounted for as tax income. In order to benefit from this tax credit, SOPEM is required to meet a number of commitments, such as an investment threshold, a minimum number of people employed at the site and a deadline for finalising the investment (30 June 2020).
noTe 7: earninGs Per share
basic earnings per share30/06/156 months
30/06/146 months
31/12/14fY
Net profit - Group share (€ thousands) 104,871 53,936 37,959
Total number of shares (1) 7,400,000 7,836,800 7,836,800
Treasury shares* (2) 536,307 401,866 401,457
Number of shares used in calculation (1) – (2) 6,863,693 7,434,934 7,435,343
BASIC EARNINGS PER SHARE (€) 15.28 7.25 5.11 * Representing the total treasury shares held by Somfy SA.
Diluted earnings per share30/06/156 months
30/06/146 months
31/12/14fY
Net profit - Group share (€ thousands) 104,871 53,936 37,959
Total number of shares (1) 7,400,000 7,836,800 7,836,800
Treasury shares** (2) 524,837 390,276 389,987
Number of shares used in calculation (1) – (2) 6,875,163 7,446,524 7,446,813
DILUTED EARNINGS PER SHARE (€) 15.25 7.24 5.10
** Excluding treasury shares allocated to stock option and free share plans.
Treasury shares acquired by Somfy SA and allocated to share option plans and free share plans at the balance sheet date contribute towards diluted earnings per share.The number of shares comprising the share capital has been modified (see Note 1.3).
noTe 8: oPeraTions DisTribuTeD or helD for sale
It should be noted that at 30 June 2014, the Group was contemplating the demerger of its two operating divisions, “Somfy Activities” and “Somfy Participations”. This transaction was finalised in the second half of 2014.During the first half of 2015, the Group finalised the disposal of CIAT Group (see Note 1.1) and decided to return the usufruct in the share capital of Garen automação (see Note 1.4).These events have been treated in accordance with IFRS 5 in the financial statements: – Balance sheet items are classified as assets and liabilities held for sale or distribution without restatement of the comparative year;– Income statement and cash flow items related to these operations held for sale or distribution are presented separately in the
financial statements for all reported periods;– Income statement and cash flow statement items relating to the individual assets held for sale are not restated.
SOMFY - HALF-YEAR FINANCIAL REPORT / 201524
02 /
20
15 c
on
de
ns
ed
co
ns
ol
ida
te
d in
te
rim
fin
an
cia
l s
tat
em
en
ts
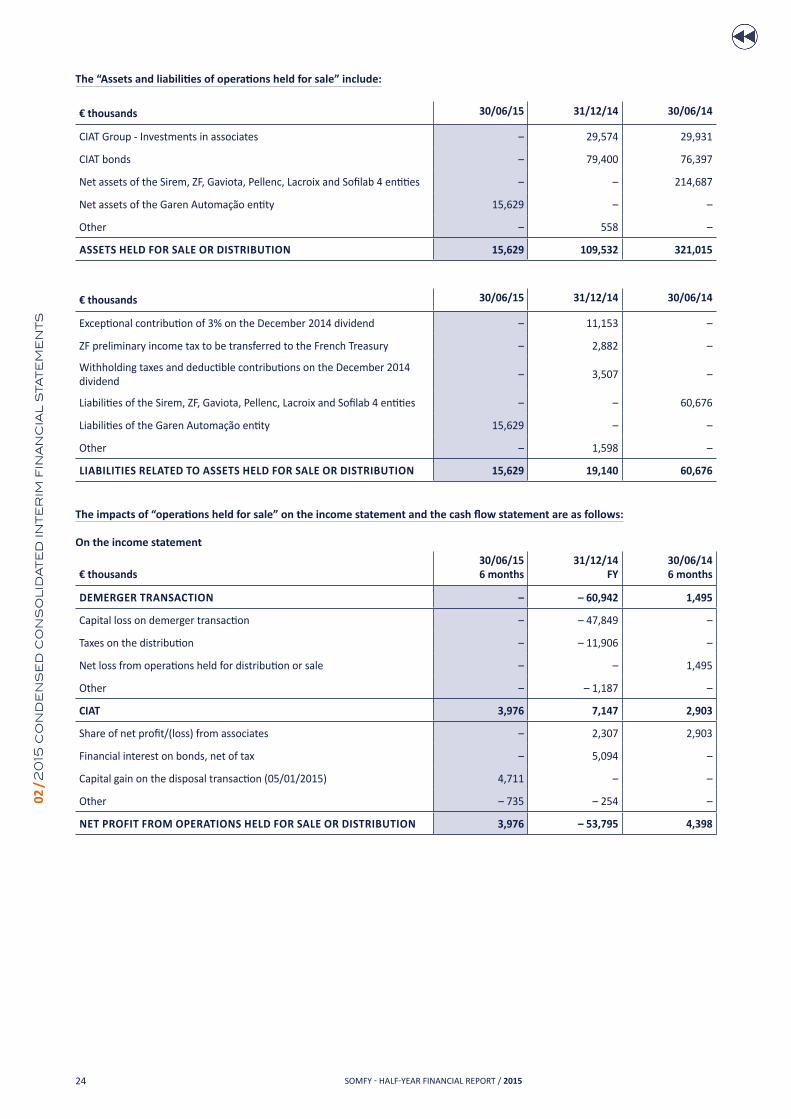
The “Assets and liabilities of operations held for sale” include:
€ thousands 30/06/15 31/12/14 30/06/14
CIAT Group - Investments in associates – 29,574 29,931
CIAT bonds – 79,400 76,397
Net assets of the Sirem, ZF, Gaviota, Pellenc, Lacroix and Sofilab 4 entities – – 214,687
Net assets of the Garen Automação entity 15,629 – –
Other – 558 –
asseTs helD for sale or DisTribuTion 15,629 109,532 321,015
€ thousands 30/06/15 31/12/14 30/06/14
Exceptional contribution of 3% on the December 2014 dividend – 11,153 –
ZF preliminary income tax to be transferred to the French Treasury – 2,882 –
Withholding taxes and deductible contributions on the December 2014 dividend
– 3,507 –
Liabilities of the Sirem, ZF, Gaviota, Pellenc, Lacroix and Sofilab 4 entities – – 60,676
Liabilities of the Garen Automação entity 15,629 – –
Other – 1,598 –
liabiliTies relaTeD To asseTs helD for sale or DisTribuTion 15,629 19,140 60,676
The impacts of “operations held for sale” on the income statement and the cash flow statement are as follows:
on the income statement
€ thousands30/06/156 months
31/12/14fY
30/06/146 months
DeMerGer TransaCTion – – 60,942 1,495
Capital loss on demerger transaction – – 47,849 –
Taxes on the distribution – – 11,906 –
Net loss from operations held for distribution or sale – – 1,495
Other – – 1,187 –
CiaT 3,976 7,147 2,903
Share of net profit/(loss) from associates – 2,307 2,903
Financial interest on bonds, net of tax – 5,094 –
Capital gain on the disposal transaction (05/01/2015) 4,711 – –
Other – 735 – 254 –
neT ProfiT froM oPeraTions helD for sale or DisTribuTion 3,976 – 53,795 4,398

SOMFY - HALF-YEAR FINANCIAL REPORT / 2015 25
02 /
20
15 c
on
de
ns
ed
co
ns
ol
ida
te
d in
te
rim
fin
an
cia
l s
tat
em
en
ts
On the cash flow statement
€ thousands30/06/156 months
31/12/14fY
30/06/146 months
neT Cash floW before DeMerGer – – 149,403 – 7,030
Acquisition of securities during the financial year (UMV, Lacroix, etc.) – – 20,254 – 7,030
Acquisition of Pellenc (51.36%) – – 82,000 –
Edify cash capital increase – – 50,031 –
Preliminary income tax received from ZF as part of the tax consolidation (to be returned in 2015)
– 2,882 –
neT Cash floW froM DeMerGer TransaCTion – 18,582 – 128,738 – 15,395
Cash and cash equivalents of companies that have exited the consolidation scope - opening balance
– – 11,489 – 11,489
Cash dividend – – 118,746 –
Withholding taxes and social contributions (paid in 2015) – 3,507 3,507 –
Exceptional contribution of 3% on the December 2014 dividend (paid in 2015)
– 11,153 – –
ZF preliminary income tax to be transferred to the French Treasury (paid in 2015)
– 2,882 – –
Other – 1,040 – 2,010 – 3,906
neT Cash floW froM CiaT DisPosal 101,563 – –
Collection of CIAT disposal price (Somfy SA share) 22,163 – –
Redemption of bonds receivable 79,400 – –
Other – – –
Garen auToMa�o Cash anD Cash eQuiValenTs AT END OF PERIOD (IFRS 5 RECLASSIFICATION)
– 1,350 – –
neT Cash floW froM oPeraTions solD 81,631 – 278,141 – 22,425
noTe 9: GooDWill anD iMPairMenT TesT
noTe 9.1: GooDWill
€ thousands Value
aT 1 JanuarY 2015 188,377
Changes in scope of consolidation –
Changes in foreign exchange rates 3,543
Other movements –
Charge for impairment –
Reclassification related to assets held for sale – 8,602
aT 30 June 2015 183,318
noTe 9.2: iMPairMenT TesT
At 30 June 2015, as part of its review of significant intangible assets, the Group did not identify any indications of impairment that would require impairment testing. Despite the economic environment in China, the forecasts of the Chinese subsidiary Dooya are not being called into question at this stage.At 30 June 2014, the goodwill of bfT Group, Giga and Garen automação had been written down by a total of €17.4 million.
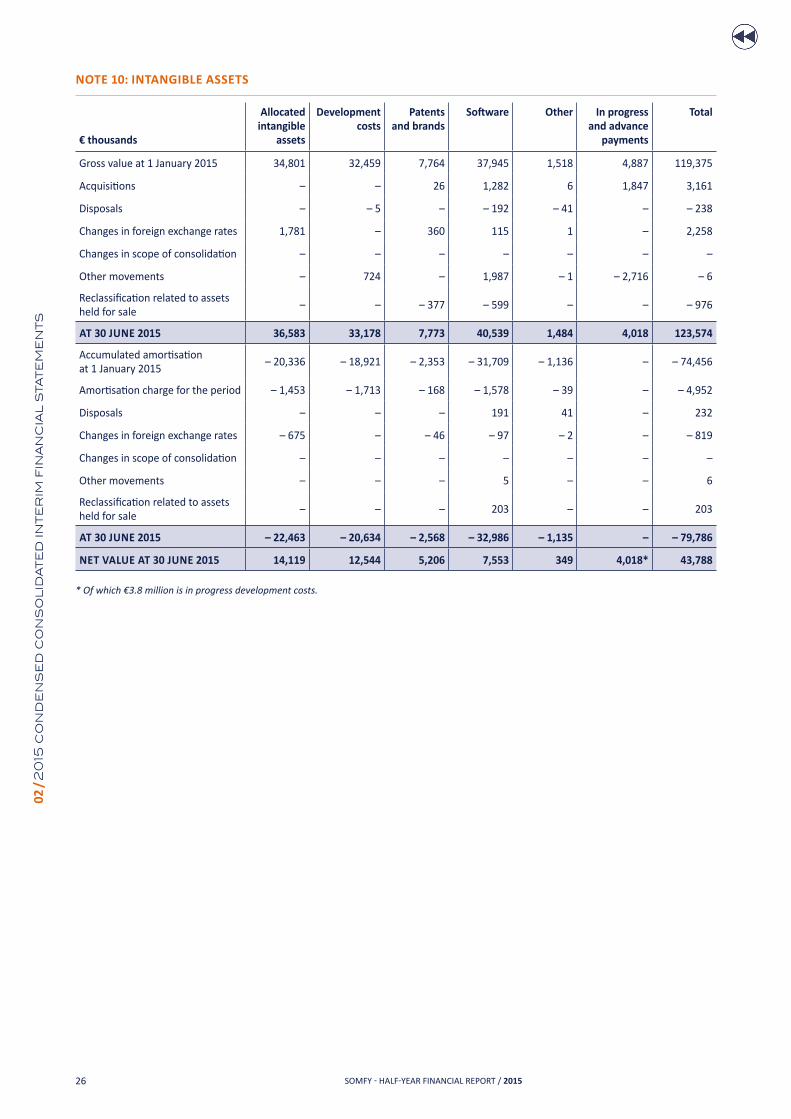
SOMFY - HALF-YEAR FINANCIAL REPORT / 201526
02 /
20
15 c
on
de
ns
ed
co
ns
ol
ida
te
d in
te
rim
fin
an
cia
l s
tat
em
en
ts
noTe 10: inTanGible asseTs
€ thousands
allocated intangible
assets
Development costs
Patents and brands
Software other in progress and advance
payments
Total
Gross value at 1 January 2015 34,801 32,459 7,764 37,945 1,518 4,887 119,375
Acquisitions – – 26 1,282 6 1,847 3,161
Disposals – – 5 – – 192 – 41 – – 238
Changes in foreign exchange rates 1,781 – 360 115 1 – 2,258
Changes in scope of consolidation – – – – – – –
Other movements – 724 – 1,987 – 1 – 2,716 – 6
Reclassification related to assets held for sale
– – – 377 – 599 – – – 976
aT 30 June 2015 36,583 33,178 7,773 40,539 1,484 4,018 123,574
Accumulated amortisation at 1 January 2015
– 20,336 – 18,921 – 2,353 – 31,709 – 1,136 – – 74,456
Amortisation charge for the period – 1,453 – 1,713 – 168 – 1,578 – 39 – – 4,952
Disposals – – – 191 41 – 232
Changes in foreign exchange rates – 675 – – 46 – 97 – 2 – – 819
Changes in scope of consolidation – – – – – – –
Other movements – – – 5 – – 6
Reclassification related to assets held for sale
– – – 203 – – 203
aT 30 June 2015 – 22,463 – 20,634 – 2,568 – 32,986 – 1,135 – – 79,786
neT Value aT 30 June 2015 14,119 12,544 5,206 7,553 349 4,018* 43,788
* Of which €3.8 million is in progress development costs.

SOMFY - HALF-YEAR FINANCIAL REPORT / 2015 27
02 /
20
15 c
on
de
ns
ed
co
ns
ol
ida
te
d in
te
rim
fin
an
cia
l s
tat
em
en
ts
noTe 11: ProPerTY, PlanT anD eQuiPMenT
€ thousands
land buildings Plant, machinery and tools
other in progress and advance
payments
Total
Gross value at 1 January 2015 22,625 160,782 217,472 56,363 15,354 472,597
Acquisitions 3 459 2,987 5,406 12,389 21,243
Disposals – 174 – 943 – 2,091 – 2,081 – – 5,289
Changes in foreign exchange rates 108 2,661 1,676 1,196 206 5,847
Changes in scope of consolidation – – – 307 – 307
Other movements – 446 6,559 272 – 7,276 –
Reclassification related to assets held for sale
– 1,390 – 3,050 – 5,946 – 559 – 155 – 11,100
aT 30 June 2015 21,172 160,355 220,657 60,904 20,517 483,606
Accumulated depreciation at 1 January 2015
– 345 – 61,113 – 141,446 – 41,057 – – 243,962
Depreciation charge for the period – 64 – 3,352 – 8,049 – 2,853 – – 14,317
Disposals – 547 1,735 1,845 – 4,126
Changes in foreign exchange rates – 1 – 419 – 944 – 788 – – 2,152
Changes in scope of consolidation – – – – 23 – – 23
Other movements – – – 23 23 – –
Reclassification related to assets held for sale
– 206 2,118 240 – 2,565
aT 30 June 2015 – 410 – 64,338 – 148,728 – 42,852 – – 253,763
neT Value aT 30 June 2015 20,762 96,017 71,929 18,052 20,517 229,842
noTe 12: inVesTMenTs in assoCiaTes
€ thousands 30/06/15 31/12/14
Investments in associates at the beginning of the year 1,680 109,881
Change in scope of consolidation and other* 871 – 80,750
Share of profit/(loss) from associates** 111 – 428
Net loss from operations held for sale – 2,308
Dividends paid – –
Changes in foreign exchange rates – 144 242
Reclassification related to assets held for sale – – 29,574
inVesTMenTs in assoCiaTes aT The enD of The PerioD 2,517 1,680 * In 2014: including impact of the exit of distributed entities.
In 2015: including additional acquisition of 10% of Neocontrol.** In 2014: the investment in Neocontrol was impaired by €0.5 million (this impairment is included in share of profit/(loss) from associates).
“Investments in associates” consists of investments in Neocontrol and Arve Finance.
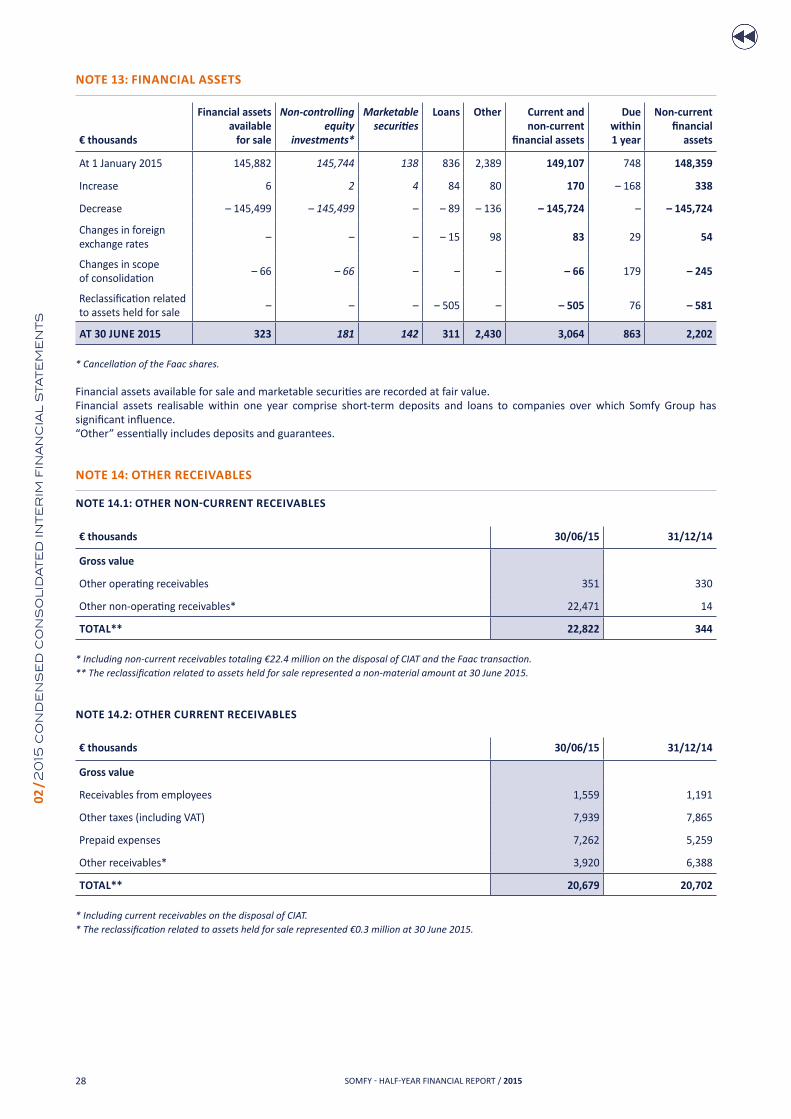
SOMFY - HALF-YEAR FINANCIAL REPORT / 201528
02 /
20
15 c
on
de
ns
ed
co
ns
ol
ida
te
d in
te
rim
fin
an
cia
l s
tat
em
en
ts
noTe 13: finanCial asseTs
€ thousands
financial assets available
for sale
Non-controlling equity
investments*
Marketable securities
loans other Current and non-current
financial assets
Due within 1 year
non-current financial
assets
At 1 January 2015 145,882 145,744 138 836 2,389 149,107 748 148,359
Increase 6 2 4 84 80 170 – 168 338
Decrease – 145,499 – 145,499 – – 89 – 136 – 145,724 – – 145,724
Changes in foreign exchange rates
– – – – 15 98 83 29 54
Changes in scope of consolidation
– 66 – 66 – – – – 66 179 – 245
Reclassification related to assets held for sale
– – – – 505 – – 505 76 – 581
aT 30 June 2015 323 181 142 311 2,430 3,064 863 2,202
* Cancellation of the Faac shares.
Financial assets available for sale and marketable securities are recorded at fair value.Financial assets realisable within one year comprise short-term deposits and loans to companies over which Somfy Group has significant influence.“Other” essentially includes deposits and guarantees.
noTe 14: oTher reCeiVables
NOTE 14.1: OTHER NON-CURRENT RECEIVABLES
€ thousands 30/06/15 31/12/14
Gross value
Other operating receivables 351 330
Other non-operating receivables* 22,471 14
ToTal** 22,822 344 * Including non-current receivables totaling €22.4 million on the disposal of CIAT and the Faac transaction.** The reclassification related to assets held for sale represented a non-material amount at 30 June 2015.
noTe 14.2: oTher CurrenT reCeiVables
€ thousands 30/06/15 31/12/14
Gross value
Receivables from employees 1,559 1,191
Other taxes (including VAT) 7,939 7,865
Prepaid expenses 7,262 5,259
Other receivables* 3,920 6,388
ToTal** 20,679 20,702
* Including current receivables on the disposal of CIAT.* The reclassification related to assets held for sale represented €0.3 million at 30 June 2015.

SOMFY - HALF-YEAR FINANCIAL REPORT / 2015 29
02 /
20
15 c
on
de
ns
ed
co
ns
ol
ida
te
d in
te
rim
fin
an
cia
l s
tat
em
en
ts
noTe 15: inVenTorY
€ thousands 30/06/15 31/12/14
Gross value
Raw materials and other supplies 58,907 53,385
Finished goods and merchandise 104,383 100,196
Total 163,290 153,581
Provisions – 11,783 – 11,191
neT Value* 151,508 142,389
* The reclassification related to assets held for sale represented €2.9 million at 30 June 2015.
€ thousandsValue
31/12/14 net
chargesexchange rate
movementsother
movements Value
30/06/15
Inventory provisions – 11,191 – 498 – 197 104 – 11,783
noTe 16: ProVisions
NOTE 16.1: NON-CURRENT PROVISIONS
€ thousands
Provisions for guarantees
Provisions for litigation
Provision for employee
liability
Provisions for liabilities and charges
Total 2015
At 1 January 2015 5,458 3,584 504 12,094 21,640
Charges 196 129 27 1,996 2,348
Used reversals – – 1,024 – – 25 – 1,049
Unused reversals – – 381 – – 635 – 1,016
Impact of foreign exchange rates 135 – – – 414 – 279
Change in consolidation scope – – – – –
Other movements – 36 – – – – 36
Reclassification related to assets held for sale – – – – 7,205 –
aT 30 June 2015 5,753 2,308 531 5,811 14,404
noTe 16.2: CurrenT ProVisions
€ thousands
Provisions for guarantees
Provisions for litigation
Provisions for liabilities and charges
Total 2015
At 1 January 2015 4,484 840 2,545 7,869
Charges 142 584 434 1,161
Used reversals – – 66 – 354 – 420
Unused reversals – – 141 – 28 – 169
Impact of foreign exchange rates 121 – 20 141
Change in consolidation scope – – – –
Other movements 36 – – 36
Reclassification related to assets held for sale – – – –
aT 30 June 2015 4,783 1,217 2,617 8,617

SOMFY - HALF-YEAR FINANCIAL REPORT / 201530
02 /
20
15 c
on
de
ns
ed
co
ns
ol
ida
te
d in
te
rim
fin
an
cia
l s
tat
em
en
ts
noTe 17: finanCial liabiliTies
€ thousands
borrowings from credit institutions
lease commitments
other borrowings
and financial liabilities*
bank overdrafts
Current and non-current
financial liabilities
Due within 1 year
non-current financial liabilities
At 1 January 2015 236,568 12,846 51,597 2,413 303,424 240,297 63,127
New/repayment of borrowings – 126,119 – 1,340 511 1,738 – 125,210 – 125,576 366
Impact of the revaluation of put options
– – 2,654 – 2,654 – 2,654
Changes in foreign exchange rates 1,599 3 3,703 – 95 5,210 1,398 3,811
Changes in scope of consolidation – – – 600 – – 600 – 600 –
Other movements – – – – – 2,414 – 2,414
Reclassification related to assets held for sale
– 3,667 – 145 – 1,441 – – 5,253 – 3,563 – 1,690
aT 30 June 2015 108,381 11,365 56,424 4,056 180,226 114,371 65,855
* Including liabilities related to put options granted to holders of non-controlling interests and earn-out of €50.4 million at 30 June 2015 and €45.9 million at 31 December 2014 as well as deferred settlements of €5.9 million at 30 June 2015 and €5.5 million at 31 December 2014. The main amount relates to the put option granted to minority interests in Dooya of €49.2 million at 30 June 2015, compared with €42.6 million at 31 December 2014, which may be exercised as of the end of 2015. The subsequent fair values of liabilities related to put options granted to holders of non-controlling interests are recognised under equity.
noTe 18: analYsis of neT finanCial DebT
The net financial debt corresponds to the difference between financial assets and financial liabilities. In particular, it takes into account earn-outs on acquisitions, liabilities relating to options granted to minority shareholders in fully-consolidated companies and deferred settlements of a financial nature. Securities in non-controlling equity investments, convertible bonds, deposits & guarantees and government grants are not included .
€ thousands 30/06/15 31/12/14
Financial liabilities included in net financial debt calculation* 180,225 303,423
Financial assets included in net financial debt calculation 453 974
– Marketable securities 142 138
– Loans 311 836
Cash and cash equivalents 89,563 102,587
neT finanCial DebT 90,209 199,862
(–) Net financial surplus.
* Including liabilities related to put options granted to holders of non-controlling interests and earn-out of €50.4 million at 30 June 2015 and €45.9 million at 31 December 2014 as well as deferred settlements of €5.9 million at 30 June 2015 and €5.5 million at 31 December 2014. The reclassification related to assets held for sale represented debt of €12.1 million at 30 June 2015.
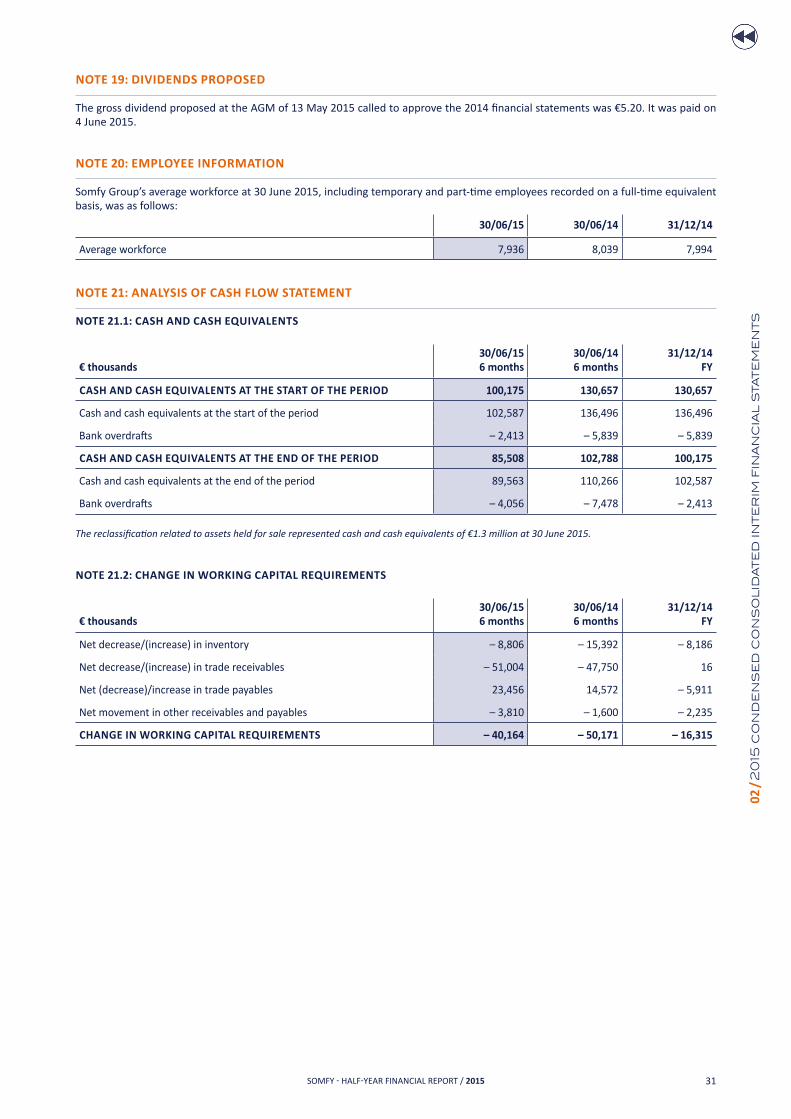
SOMFY - HALF-YEAR FINANCIAL REPORT / 2015 31
02 /
20
15 c
on
de
ns
ed
co
ns
ol
ida
te
d in
te
rim
fin
an
cia
l s
tat
em
en
ts
noTe 19: DiViDenDs ProPoseD The gross dividend proposed at the AGM of 13 May 2015 called to approve the 2014 financial statements was €5.20. It was paid on 4 June 2015.
noTe 20: eMPloYee inforMaTion Somfy Group’s average workforce at 30 June 2015, including temporary and part-time employees recorded on a full-time equivalent basis, was as follows:
30/06/15 30/06/14 31/12/14
Average workforce 7,936 8,039 7,994
noTe 21: analYsis of Cash floW sTaTeMenT
noTe 21.1: Cash anD Cash eQuiValenTs
€ thousands30/06/156 months
30/06/146 months
31/12/14fY
Cash anD Cash eQuiValenTs aT The sTarT of The PerioD 100,175 130,657 130,657
Cash and cash equivalents at the start of the period 102,587 136,496 136,496
Bank overdrafts – 2,413 – 5,839 – 5,839
Cash anD Cash eQuiValenTs aT The enD of The PerioD 85,508 102,788 100,175
Cash and cash equivalents at the end of the period 89,563 110,266 102,587
Bank overdrafts – 4,056 – 7,478 – 2,413 The reclassification related to assets held for sale represented cash and cash equivalents of €1.3 million at 30 June 2015.
noTe 21.2: ChanGe in WorKinG CaPiTal reQuireMenTs
€ thousands 30/06/156 months
30/06/146 months
31/12/14fY
Net decrease/(increase) in inventory – 8,806 – 15,392 – 8,186
Net decrease/(increase) in trade receivables – 51,004 – 47,750 16
Net (decrease)/increase in trade payables 23,456 14,572 – 5,911
Net movement in other receivables and payables – 3,810 – 1,600 – 2,235
ChanGe in WorKinG CaPiTal reQuireMenTs – 40,164 – 50,171 – 16,315

SOMFY - HALF-YEAR FINANCIAL REPORT / 201532
02 /
20
15 c
on
de
ns
ed
co
ns
ol
ida
te
d in
te
rim
fin
an
cia
l s
tat
em
en
ts
noTe 22: ConsoliDaTion sCoPe
Company name Head office % control30/06/15
% interest30/06/15
% interest31/12/14
Somfy SA 74300 Cluses (France)(parent
company)(parent
company)(parent
company)
fully-consolidated companies
Somfy SAS Cluses (France) 100.00 100.00 100.00
CMC EURL Cluses (France) 100.00 100.00 100.00
Somfybat SNC Cluses (France) 100.00 100.00 100.00
Domis SA Rumilly (France) 100.00 100.00 100.00
Stor’m Saint Clair de la Tour (France) 100.00 100.00 100.00
SITEM SARL Zaghouan (Tunisia) 100.00 100.00 100.00
SITEM Services Zaghouan (Tunisia) 100.00 100.00 100.00
SOPEM Krakow (Poland) 100.00 100.00 100.00
Somfy Ltd Yeadon (UK) 100.00 100.00 100.00
Yorkshire Technology Bradford (UK) 100.00 100.00 100.00
Somfy PTY Ltd Rydalmere (Australia) 100.00 100.00 100.00
Somfy Automation Services PTY Rydalmere (Australia) 100.00 100.00 100.00
NV Somfy SA Zaventem (Belgium) 100.00 100.00 100.00
Somfy Brazil LTDA Sao Paulo (Brazil) 100.00 100.00 100.00
Somfy Columbia SAS Bogota (Colombia) 100.00 100.00 100.00
Somfy Chili Chile 100.00 100.00 100.00
Giga Indústria e Comércio de Produtos de Segurança Eletrônica S .A .
Santa Rita do Sapucaí (Brazil) 51.00 51.00 51.00
GABR Participações LTDA Sao Paulo (Brazil) 100.00 100.00 100.00
Garen Automação S/A Garça (Brazil) 100.00 100.00 100.00
Somfy GmbH Rottenburg (Germany) 100.00 100.00 100.00
DomoCES GmbH Rottenburg (Germany) 100.00 100.00 100.00
HIMOTION BV Leiden (Netherlands) 100.00 100.00 100.00
Somfy GmbH Elsbethen-Glasenbach (Austria) 100.00 100.00 100.00
Somfy KFT Budapest (Hungary) 100.00 100.00 100.00
Somfy Sp zoo Warsaw (Poland) 100.00 100.00 100.00
Somfy Spol sro Prague (Czech Republic) 100.00 100.00 100.00
SC Somfy SRL Brasov (Romania) 100.00 100.00 100.00
Somfy LLC Moscow (Russia) 100.00 100.00 100.00
Somfy SIA Riga (Latvia) 100.00 100.00 100.00
Somfy LLC Kiev (Ukraine) 100.00 100.00 100.00
Somfy Bulgaria AD Sofia (Bulgaria) 100.00 100.00 100.00
Somfy Joo Seoul (Korea) 100.00 100.00 100.00
Somfy Italia SRL Milan (Italy) 100.00 100.00 100.00
Somfy BV Hoofddorp (Netherlands) 100.00 100.00 100.00
Somfy España SA Barcelona (Spain) 100.00 100.00 100.00
Automatismos Pujol SL Barcelona (Spain) 100.00 100.00 100.00
Pujol Redutores de Velocidade LDA Esmoriz (Portugal) 100.00 100.00 100.00

SOMFY - HALF-YEAR FINANCIAL REPORT / 2015 33
02 /
20
15 c
on
de
ns
ed
co
ns
ol
ida
te
d in
te
rim
fin
an
cia
l s
tat
em
en
ts
Company name Head office % control30/06/15
% interest30/06/15
% interest31/12/14
Sistemi Automatici Pujol SRL Pavona (Italy) 100.00 100.00 100.00
Somfy Systems Inc. Cranbury NJ (US) 100.00 100.00 100.00
Somfy AG Bassersdorf (Switzerland) 100.00 100.00 100.00
Somfy Nordic AB Limhamn (Sweden) 100.00 100.00 100.00
Somfy Norway AS Skedsmokorset (Norway) 100.00 100.00 –
Somfy PTE Ltd Singapore 100.00 100.00 100.00
Somfy Thailand Bangkok (Thailand) 100.00 100.00 100.00
Somfy Taiwan Co Ltd Taipei (Taiwan) 100.00 100.00 100.00
Asian Capital International LTD Hong Kong 100.00 100.00 100.00
Sino Global International Holdings LTD Hong Kong 100.00 100.00 100.00
Sino Link Trading LTD Hong Kong 100.00 100.00 100.00
Hong Kong CTLT Trade Co . LTD Hong Kong 70.00 70.00 70.00
Dooya China Ningbo (China) 70.00 70.00 70.00
New Unity LTD Hong Kong 70.00 70.00 70.00
Ningbo Sleepwell Co Ltd Ningbo (China) 70.00 70.00 70.00
Somfy Co Ltd Hong Kong 100.00 100.00 100.00
Somfy China Co Ltd Shanghai (China) 100.00 100.00 100.00
Lian Da Zhejiang (China) 95.00 95.00 95.00
Baixing Co Ltd Ningbo (China) 70.00 70.00 70.00
Herzborg Technology Ningbo (China) 70.00 70.00 70.00
Shanghaï Goodnight Ningbo (China) 70.00 70.00 –
Somfy Middle East Co Ltd Limassol (Republic of Cyprus) 100.00 100.00 100.00
Somfy Egypt Cairo (Egypt) 100.00 100.00 100.00
Sisa Home Automatisation Ltd Rishone Le Zion (Israel) 100.00 100.00 100.00
Somfy Maroc SARL Casablanca (Morocco) 100.00 100.00 100.00
Somfy Hellas SA Acharnae (Greece) 100.00 100.00 100.00
Somfy Ev Otomasyon Sistemleri Ticaret Ltd Sti
Istanbul (Turkey) 100.00 100.00 100.00
Somfy South Africa (PTY) Limited Durban (South Africa) 100.00 100.00 100.00
Somfy Tunisie Tunis (Tunisia) 100.00 100.00 100.00
Somfy Tunisie Services Tunis (Tunisia) 50.00 50.00 50.00
Somfy Mexico SA DE CV Tlalnepantla (Mexico) 100.00 100.00 100.00
Somfy K .K . Yokohama (Japan) 100.00 100.00 100.00
Somfy India Pvt Ltd New Dehli (India) 100.00 100.00 100.00
PROMOFI BV Hoofddorp (Netherlands) 100.00 100.00 100.00
FIGEST BV Leiden (Netherlands) 100.00 100.00 100.00
Somfy ULC Halifax (Canada) 100.00 100.00 100.00
Harmonic Design Poway (US) 100.00 100.00 100.00
Energy Eye Poway (US) 100.00 100.00 100.00
Simu SAS Gray (France) 100.00 100.00 100.00
Simu GmbH Iserlohn (Germany) 100.00 100.00 100.00
WAY SRL Galliera (Italy) 100.00 100.00 100.00
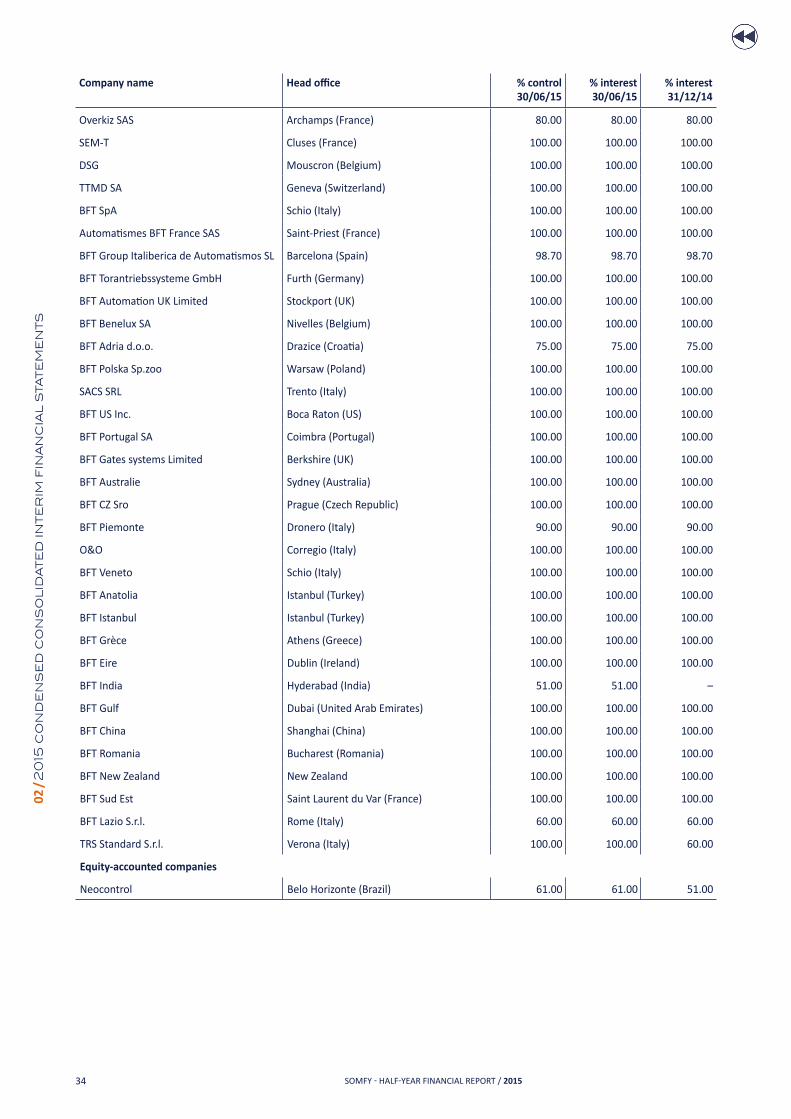
SOMFY - HALF-YEAR FINANCIAL REPORT / 201534
02 /
20
15 c
on
de
ns
ed
co
ns
ol
ida
te
d in
te
rim
fin
an
cia
l s
tat
em
en
ts
Company name Head office % control30/06/15
% interest30/06/15
% interest31/12/14
Overkiz SAS Archamps (France) 80.00 80.00 80.00
SEM-T Cluses (France) 100.00 100.00 100.00
DSG Mouscron (Belgium) 100.00 100.00 100.00
TTMD SA Geneva (Switzerland) 100.00 100.00 100.00
BFT SpA Schio (Italy) 100.00 100.00 100.00
Automatismes BFT France SAS Saint-Priest (France) 100.00 100.00 100.00
BFT Group Italiberica de Automatismos SL Barcelona (Spain) 98.70 98.70 98.70
BFT Torantriebssysteme GmbH Furth (Germany) 100.00 100.00 100.00
BFT Automation UK Limited Stockport (UK) 100.00 100.00 100.00
BFT Benelux SA Nivelles (Belgium) 100.00 100.00 100.00
BFT Adria d.o.o. Drazice (Croatia) 75.00 75.00 75.00
BFT Polska Sp.zoo Warsaw (Poland) 100.00 100.00 100.00
SACS SRL Trento (Italy) 100.00 100.00 100.00
BFT US Inc. Boca Raton (US) 100.00 100.00 100.00
BFT Portugal SA Coimbra (Portugal) 100.00 100.00 100.00
BFT Gates systems Limited Berkshire (UK) 100.00 100.00 100.00
BFT Australie Sydney (Australia) 100.00 100.00 100.00
BFT CZ Sro Prague (Czech Republic) 100.00 100.00 100.00
BFT Piemonte Dronero (Italy) 90.00 90.00 90.00
O&O Corregio (Italy) 100.00 100.00 100.00
BFT Veneto Schio (Italy) 100.00 100.00 100.00
BFT Anatolia Istanbul (Turkey) 100.00 100.00 100.00
BFT Istanbul Istanbul (Turkey) 100.00 100.00 100.00
BFT Grèce Athens (Greece) 100.00 100.00 100.00
BFT Eire Dublin (Ireland) 100.00 100.00 100.00
BFT India Hyderabad (India) 51.00 51.00 –
BFT Gulf Dubai (United Arab Emirates) 100.00 100.00 100.00
BFT China Shanghai (China) 100.00 100.00 100.00
BFT Romania Bucharest (Romania) 100.00 100.00 100.00
BFT New Zealand New Zealand 100.00 100.00 100.00
BFT Sud Est Saint Laurent du Var (France) 100.00 100.00 100.00
BFT Lazio S.r.l. Rome (Italy) 60.00 60.00 60.00
TRS Standard S .r .l . Verona (Italy) 100.00 100.00 60.00
equity-accounted companies
Neocontrol Belo Horizonte (Brazil) 61.00 61.00 51.00

SOMFY - HALF-YEAR FINANCIAL REPORT / 2015 35
03 /
Sta
tu
to
ry
Au
dit
or
s’ r
ep
or
t o
n t
he
20
15 in
te
rim
fin
an
cia
l r
ep
or
t
03/ sTATuTORy AudITORs’ REPORT on tHE 2015 intERim FinAnciAL REpoRt
To the Shareholders,
In compliance with the assignment entrusted to us by your General Meeting and pursuant to Article L. 451-1-2 III of the Monetary and Financial Code, we have proceeded with:– A limited review of the accompanying condensed consolidated
interim financial statements of the company Somfy SA, for the period from 1 January to 30 June 2015;
– A review of the information disclosed in the half-year business report .
The Management Board is responsible for the preparation of the condensed consolidated interim financial statements. It is our responsibility to express an opinion on these financial statements on the basis of our limited review.
Opinion on the financial statements
We have conducted our limited review in accordance with professional auditing standards applicable in France. A limited review consists principally of making inquiries of persons responsible for financial and accounting matters and applying analytical procedures. The scope is substantially less than an audit conducted in accordance with professional auditing standards applicable in France. Consequently, this review can only provide reasonable assurance, to a lesser degree than an audit, as to whether the interim financial statements are free of material misstatements .
Based on our limited review, nothing has come to our attention that would challenge the compliance of the condensed consolidated interim financial statements with IAS 34 – a standard of the IFRS framework relating to interim financial reporting as adopted within the European Union.Without qualifying the above opinion, we draw your attention to the notes to the condensed consolidated interim financial statements “IFRIC 21 – Levies” in the Section “Accounting rules and methods” and Note 2 “Restatements of previously-published financial statements”, which disclose the effects of the initial application of the IFRIC 21 interpretation by your company .
Specific verification
We have also verified the information disclosed in the half-year business report commenting on the condensed consolidated interim financial statements, which were the subject of our limited review.We have no observation to make with regard to the fairness of such information and its consistency with the condensed consolidated interim financial statements.
Paris and Lyon, 2 September 2015The Statutory Auditors
LEDOUBLE SAS ERNST & YOUNG et Autres Agnès Piniot Lionel Denjean

SOMFY - HALF-YEAR FINANCIAL REPORT / 201536
04 /
Sta
te
me
nt
fr
om
th
e in
div
idu
al
re
sp
on
sib
le
fo
r t
he
20
15 h
al
f-y
ea
r fi
na
nc
ial
re
po
rt
04/ sTATEmENT FROm ThE INdIvIduAL REsPONsIbLE FoR tHE 2015 HALF-YEAR FinAnciAL REpoRt
I certify that, to the best of my knowledge, the condensed consolidated interim financial statements have been prepared in accordance with applicable accounting standards and give a true and fair view of the net equity position, financial position and financial performance of the company and all companies included in the consolidation, and that the half-year business report gives a true and fair view of the significant events that occurred during the first six months of the financial year, their impact on the financial statements, the main transactions carried out between related parties, as well as a description of the major risks and uncertainties for the remaining six months of the financial year. Cluses, 2 September 2015
Pierre ribeiro Group CFO