h2first hydrogen contaminant detector task - nrel · h2first hydrogen contaminant detector task ......
TRANSCRIPT
NREL is a national laboratory of the U.S. Department of Energy, Office of Energy Efficiency & Renewable Energy, operated by the Alliance for Sustainable Energy, LLC.
H2FIRST Hydrogen Contaminant Detector Task Requirements Document and Market Survey Danny Terlip, Chris Ainscough, William Buttner National Renewable Energy Laboratory
Scott McWhorter Savannah River National Laboratory
NREL is a national laboratory of the U.S. Department of Energy, Office of Energy Efficiency & Renewable Energy, operated by the Alliance for Sustainable Energy, LLC, under contract DE-AC36-08GO28308.
Sandia National Laboratories is a multi-program laboratory managed and operated by Sandia Corporation, a wholly owned subsidiary of Lockheed Martin Corporation, for the U.S. Department of Energy's National Nuclear Security Administration under contract DE-AC04-94AL85000.
Technical Report NREL/TP-5400-64063 April 2015

National Renewable Energy Laboratory 15013 Denver West Parkway Golden, Colorado 80401 303-275-3000 • www.nrel.gov
Sandia National Laboratories Albuquerque, New Mexico 87185 Livermore, California 94550 www.sandia.gov
H2FIRST Hydrogen Contaminant Detector Task Requirements Document and Market Survey Danny Terlip, Chris Ainscough, William Buttner National Renewable Energy Laboratory
Scott McWhorter Savannah River National Laboratory
NREL is a national laboratory of the U.S. Department of Energy, Office of Energy Efficiency & Renewable Energy, operated by the Alliance for Sustainable Energy, LLC, under contract DE-AC36-08GO28308.
Sandia National Laboratories is a multi-program laboratory managed and operated by Sandia Corporation, a wholly owned subsidiary of Lockheed Martin Corporation, for the U.S. Department of Energy's National Nuclear Security Administration under contract DE-AC04-94AL85000.
Technical Report NREL/TP-5400-64063 April 2015

NOTICE
This report was prepared as an account of work sponsored by an agency of the United States government. Neither the United States government nor any agency thereof, nor any of their employees, makes any warranty, express or implied, or assumes any legal liability or responsibility for the accuracy, completeness, or usefulness of any information, apparatus, product, or process disclosed, or represents that its use would not infringe privately owned rights. Reference herein to any specific commercial product, process, or service by trade name, trademark, manufacturer, or otherwise does not necessarily constitute or imply its endorsement, recommendation, or favoring by the United States government or any agency thereof. The views and opinions of authors expressed herein do not necessarily state or reflect those of the United States government or any agency thereof.
This report is available at no cost from the National Renewable Energy Laboratory (NREL) at www.nrel.gov/publications.
Available electronically at http://www.osti.gov/scitech
Available for a processing fee to U.S. Department of Energy and its contractors, in paper, from:
U.S. Department of Energy Office of Scientific and Technical Information P.O. Box 62 Oak Ridge, TN 37831-0062 phone: 865.576.8401 fax: 865.576.5728 email: mailto:[email protected]
Available for sale to the public, in paper, from:
U.S. Department of Commerce National Technical Information Service 5285 Port Royal Road Springfield, VA 22161 phone: 800.553.6847 fax: 703.605.6900 email: [email protected] online ordering: http://www.ntis.gov/help/ordermethods.aspx
NREL prints on paper that contains recycled content.

iii
Acknowledgments This work is funded by the U.S. Department of Energy (DOE) Fuel Cell Technologies Office in the Office of Energy Efficiency and Renewable Energy.
The Hydrogen Fueling Infrastructure Research and Station Technology Project (H2FIRST) is a DOE project executed by Sandia National Laboratories and the National Renewable Energy Laboratory. The objective of H2FIRST is to ensure that fuel cell electric vehicle customers have a positive fueling experience relative to conventional gasoline/diesel stations as vehicles are introduced (2015–2017) and transition to advanced refueling technology beyond 2017.
DOE’s Fuel Cell Technologies Office established H2FIRST directly in support of H2USA, a public-private partnership co-launched by DOE and industry in 2013 to address the key challenges of hydrogen infrastructure.
In addition to DOE, the team wishes to thank Mike Kashuba from the California Air Resources Board.

iv
Nomenclature ASTM ASTM International CARB California Air Resources Board CDFA DMS California Department of Food and Agriculture
Division of Measurement Standards CGA Compressed Gas Association CRDS cavity ring down spectroscopy CW continuous wave DOE U.S. Department of Energy ECD electron capture detector FCEV fuel cell electric vehicle FID flame ionization detector FTIR Fourier transform infrared spectroscopy GC gas chromatography HCD hydrogen contaminant detector HFSWG H2USA Hydrogen Fueling Station Working Group K thousand M million MDL minimum detection limit MEA membrane electrode assembly MS mass spectrometer NDIR non-dispersive infrared NREL National Renewable Energy Laboratory OEM original equipment manufacturer PDHID pulsed discharge helium ionization detector PEM polymer electrolyte membrane PFPD pulsed flame photometric detector ppb parts per billion ppm parts per million ppbv parts per billion by volume ppmv parts per million by volume QA/QC quality assurance and control SAE SAE International SMR steam methane reformation TCD thermal conductivity detector TDL tunable diode laser

v
Executive Summary The rollout of hydrogen fueling stations, and the fuel cell electric vehicles (FCEV) they support, requires the assurance of high quality hydrogen at the dispensing point. Automotive fuel cells are sensitive to a number of chemicals that can be introduced into the dispensed fuel at multiple points. Quality assurance and quality control methods are employed by the industry to ensure product quality, but they are not completely comprehensive and can fail at various points in the hydrogen pathway from production to dispensing. This reality leaves open the possibility of a station unknowingly dispensing harmful contaminants to a FCEV which, depending on the contaminant, may not be discovered until the FCEV is irreparably damaged. This situation is unacceptable.
A hydrogen contaminant detector (HCD), defined as a combination of a gas analyzer and the components necessary for fuel stream integration, installed at hydrogen stations is one method for preventing poor quality gas from reaching an FCEV. This document identifies the characteristics required of such a device by industry and compares those requirements with the current state of commercially available gas analysis technology.
Near term engineering requirements are presented. The requirements, developed with input from a wide array of stakeholders, specify a device with capital and operating expenditures costing less than 1% of total station costs, capable of detecting carbon monoxide, water, ammonia, and sulfur at one order of magnitude above SAE International (SAE) J2719 levels (ppbv–ppmv range). It is impractical to expect a near term HCD to be able to detect all contaminants listed in SAE J2719. Device capital cost should be less than $5,000 at high volumes (>1,000 units) and annual operating costs should be less than $1,000. The device should be integrated just upstream of the dispenser to include the greatest number of contaminant sources possible. Because the pressure used in stations is up to 900 bar, the HCD must employ a pressure reducer and slip stream for sampling. Gas analysis and reporting should occur within the time of a fill and the results should indicate to a station operator whether the gas is of the required quality or not. Routine maintenance and operation of the device should not require a highly specialized technician, and any routine maintenance should not be required more frequently than every 6 months.
The market survey incorporated responses from 10 companies that manufacture analytical equipment to an HCD survey developed for this project with information from previous studies and international workshops related to hydrogen quality. Gas chromatography, mass spectrometry, Fourier transform infrared spectroscopy, non-dispersive infrared spectroscopy, laser absorption, continuous wave cavity ring down spectroscopy, and concentrator technologies were investigated for detection abilities, cost, availability, and ambient and sampling requirements. Survey responses indicated that current technology is capable of detecting contaminants at lower levels than the requirements specified in SAE J2719. Capital costs ranged from $10,000 to $90,000, while operating costs ranged from $0 to $4,000. The required maintenance varied from annually with the cavity ring down technology to daily with the Fourier transform infrared technology. The cavity ring down technology specified a sampling and analysis time of 1 second, which was the fastest response time identified in this survey. The concentrator coupled with mass spectrometry specified the longest at 15 minutes.

vi
The gaps between what is currently available and what is required are identified. A House of Quality diagram is provided showing comparisons between the most promising technologies and correlations between customer requests and engineering requirements. As observed, no current technology meets all of the requirements for an HCD, as defined here. The largest gaps are costs, robustness, skill level needed to operate HCDs, and field validation. This is expected, as the need for such a device is evolving and existing gas analysis technologies are generally designed for a laboratory setting that requires specially trained operators. Research into a promising non-traditional gas analysis technology is currently underway at the Los Alamos National Laboratory, where an HCD based on a surrogate fuel cell is being developed. This device has the potential to indicate the presence of impurities in a hydrogen stream, but it is not yet ready for commercial deployment.

vii
Table of Contents List of Figures .......................................................................................................................................... viii List of Tables ............................................................................................................................................ viii 1 Introduction ........................................................................................................................................... 1 2 Hydrogen Contaminant Detector Requirements ............................................................................... 2
2.1 Environmental Requirements ........................................................................................................... 4 2.2 Performance Requirements .............................................................................................................. 6 2.3 Cost Requirements ......................................................................................................................... 12 2.4 Requirements Conclusion .............................................................................................................. 14
3 Market Survey ..................................................................................................................................... 15 3.1 Market Survey Conclusion and Gap Analysis ............................................................................... 20
4 Path Forward for Success ................................................................................................................. 24 References ................................................................................................................................................. 25 Appendix .................................................................................................................................................... 26

viii
List of Figures Figure 1. Possible locations for integration of a hydrogen contaminant detector at a typical station.
Possible contaminants from each component are listed. .......................................................... 4 Figure 2. Sampling location preferences from the H2USA Hydrogen Fueling Station Working Group ..... 5 Figure 3. Contaminant sources from various production methods (SAE J2719/1) ...................................... 9 Figure 5. Contaminant impact and difficulty to measure plotted against each other .................................. 10 Figure 6. HCD response time desired by the HFSWG ............................................................................... 12 Figure 7. HCD sampling frequency desired by the HFSWG ...................................................................... 12 Figure 8. HCD installed cost desired by the HFSWG ................................................................................ 13 Figure 9. HCD annual operating and maintenance cost desired by the HFSWG ....................................... 13 Figure 10. HCD gap analysis summary ...................................................................................................... 20 Figure 11. House of Quality diagram comparing the most promising HCD technologies ......................... 23
List of Tables Table 1. Impurities and Concentration Limits for Various Fuel Quality Standards ..................................... 3 Table 2. Environmental Requirments for an HCD Integrated at Three Locations within a Station ............. 6 Table 3. Near Term Station Configuration for California Hydrogen Stations Provided by CARB .............. 7 Table 4. Contaminant Sources for SAE J2719 Contaminants [6] ................................................................. 8 Table 5. Contaminant and Concentration Detection Performance Requirements for an HCD ................... 11 Table 7. HCD Engineering Requirements .................................................................................................. 14 Table 8. Gas Analyzer Technologies and Their Target Analytes ............................................................... 17 Table 9. Minimum Detection Limits Compared to SAE J2719 Requirements for Various Analytes and the
Detection Methods [4] ........................................................................................................... 19

1
1 Introduction It is critical that stations deliver high purity hydrogen to fuel cell electric vehicle (FCEV) customers to prevent negative impacts on the vehicles. The equipment along the production and dispensing pathway can affect the purity of automotive fuel cell grade hydrogen. Potential contaminant sources include production equipment, transportation equipment, storage tanks, compressors, chillers, station piping, and the dispensing hose. Each of these sources can introduce different contaminants into the fuel stream. Each station may be subject to different contaminant sources depending on the configuration and fuel source. The types of contaminants and concentration in the dispensed hydrogen have drastically different effects on fuel cell performance. While there may be individual contracts between gas suppliers and station owners, there is no overall agreement on who is responsible for fuel quality throughout the production to dispensing pathway. All of these elements combine to make it challenging to guarantee high purity fuel is dispensed to customers.
Published standards, such as Compressed Gas Association (CGA) G-5.3 Commodity Specification for Hydrogen [1] and SAE J2719—Hydrogen Fuel Quality for Fuel Cell Vehicles [2], specify contaminant type and maximum concentration requirements for both gaseous and liquid hydrogen. The current regulation in California [3] specifies testing dispensed hydrogen to SAE International (SAE) standard J2719 but does not specify any frequency. Quality assurance and control (QA/QC) measures and fuel sample analysis can mitigate contaminant introduction to a point. QA/QC measures include filters, temperature sensors, pressure swing adsorption, and dew point sensors. As of the writing of this report, there is no standard for quality assurance or control measures at hydrogen stations, creating uncertainty in practices for each station. Testing performed by the California Department of Food and Agriculture Division of Measurement Standards (CDFA DMS) requires a site visit by state personnel to take a sample and then perform an advanced laboratory analysis of the sample to meet SAE J2719 levels.
The equipment used to validate fuel quality to SAE J2719 levels must be sophisticated. They must be able to function in a hydrogen matrix and detect and quantify regulated contaminants present at ppmv–ppbv concentrations. ASTM International methods for measuring these contaminants at the required levels (e.g., D7649, D7652, D5466) do exist currently, though this analysis is further complicated when more than one contaminant is present. Detecting and quantifying all of the regulated contaminants requires multiple gas analysis technologies. Techniques such as mass spectrometry, gas chromatography, and Fourier transform infrared spectroscopy are used to measure contaminants in hydrogen to SAE J2719 levels. This equipment is expensive, must be operated in a controlled laboratory setting, and requires specially trained operators and frequent calibration and maintenance [4].
The current fuel quality verification process, based on sporadic collection of gas samples using ASTM methods (i.e., D7650 and D7606) and remote analysis at a testing laboratory, leaves a significant gap during which poor quality fuel could be dispensed to an FCEV and possibly irreparably damage the fuel cell stack. Currently, fuel quality tests on California stations are performed upon station commissioning, in the event of a dispute, or as mandated by the State. Fuel quality analysis results for a number of stations are collected anonymously through the National Renewable Energy Laboratory’s (NREL’s) National Fuel Cell Technology Evaluation Center. The data show that contaminated hydrogen has been detected numerous times through
2
sampling. In more than one instance, contaminated hydrogen was identified after it was dispensed to FCEVs. Reduced performance in specific FCEVs was used to trace the contaminated fuel to a specific station.
The current contamination and prevention strategy must be improved to a more robust method. More frequent sampling and well-defined QA/QC measures are necessary to protect FCEV customers from fuel contaminants. A hydrogen contaminant detector (HCD) that monitors conditions of the fuel stream on a per-fill frequency and alerts station operators when poor quality hydrogen is detected is a good solution for preventing exposure of the FCEV to contaminants. However, in the near term, integrating an HCD into a station faces the barriers of technology availability, system integration, cost, and performance.
This document defines an initial set of engineering requirements for such an HCD using input from station operators, gas producers, state agencies, and vehicle manufacturers. The H2USA Hydrogen Fueling Station Working Group (HFSWG) was asked to provide input to requirements for the HCD as well. Installation of an HCD in variable station configurations is considered, target contaminants are identified from the larger SAE J2719 list, and a cost target is provided. The results of the market survey of currently available gas analysis technologies are provided next. Finally, gaps are identified between what is required and what is currently available.
2 Hydrogen Contaminant Detector Requirements The requirements developed in this document are not meant for a device that certifies or validates fuel quality compliance set forth by the State of California or SAE J2719. The intention is to define requirements for an onsite device that can prevent poor quality fuel (such as from a process upset) from being delivered to an FCEV customer. This is critical to maintaining a positive experience for FCEV customers, vehicle original equipment manufacturers (OEMs), and station owners.
Table 1 lists contaminants and their concentration limits specified by SAE J2719 and by two other applicable fuel quality standards: CGA 5.3 Commodity Specification for Hydrogen and ISO 14687-2 Hydrogen fuel – Product specification – Part 2: Proton exchange membrane fuel cell applications for road vehicles. SAE J2719 applies in the United States and has been harmonized with ISO 14687-2. An onsite HCD that detects all contaminants listed in at the required levels is not feasible in the near term. Verification of contaminant concentration levels specified at these levels requires expensive laboratory gas analysis techniques and specialized equipment that are not easily operated or transported into the field. To reduce costs and improve ease of integration, an HCD for the near term needs to target a subset of these contaminants or conditions based on their impacts and likelihood considering production and delivery pathways.

3
Table 1. Impurities and Concentration Limits for Various Fuel Quality Standards
Standard CGA 5.3 Table 1 - Directory of Limiting Characteristics (ppmv)
ISO14687-2 (ppmv) SAE J2719 (ppmv)
Limiting Characteristic Gaseous Liquid Gaseous Liquid Hydrogen min % 99.999 99.999 99.97 99.97 99.97 Total non-hydrogena - - 100 100 100 Argon - - 100 100 100 Carbon dioxide 2 2 2 2 2 Carbon monoxide 2 2 0.2 0.2 0.2 Helium - - 300 300 300 Formic acid 0.2 0.2 0.2 Formaldehyde 0.01 0.01 0.01 Ammonia 0.1 0.1 0.1 Total sulfurb 0.004 0.004 0.004 Nitrogen 2 2 100 100 100 Oxygen 1 1 5 5 5 Permanent particulates (mg/kg)
TBD TBD 1 1 1
Total halogenated compoundsc
0.05 0.05 0.05
Total hydrocarbon contentd 1 1 2 2 2 Water 3.5 3.5 5 5 5
a Total allowable non-hydrogen, non-helium, non-particulate constituents listed below. b Includes, for example, hydrogen sulfide (H2S), carbonyl sulfide (COS), carbon disulfide (CS2), and mercaptans. c Includes, for example, hydrogen bromide (HBr), hydrogen chloride (HCl), chlorine (Cl2), and organic halides (R-X). d Includes, for example, ethylene, propylene, acetylene, benzene, phenol (paraffins, olefins, aromatic compounds, alcohols, aldehydes). Total hydrocarbon content may exceed 2 micromoles per mole due only to the presence of methane, in which case the summation of methane, nitrogen, and argon is not to exceed 100 ppm. A U.S. Department of Energy (DOE) Hydrogen Contamination Detector workshop in June 2014 [5] brought together vehicle manufacturers, gas companies, station builders/operators, and a select group of gas analyzer manufacturers. The participants expressed great interest in a near term (0–2 years) solution for an onsite HCD that can alert station operators if poor quality hydrogen is present in the station, but they emphasized that it should be part of a larger fuel quality system that includes QA/QC measures. Further input from these groups, as well as from experts at national laboratories and hydrogen producers, was used to refine the requirements for an HCD to three categories: (1) environmental, (2) performance, and (3) cost.
Environmental requirements are ambient conditions and gas sample conditions, such as pressure and temperature, in which the HCD must reliably perform. Performance requirements specify which contaminants are detected, at what concentrations, how often sampling is done, and how a positive detection is handled. Lastly, cost requirements reflect the capital and operational costs as

4
well as time and personnel required to operate the device successfully. Each of these categories offers a set of trade-offs that must be evaluated on a case-by-case basis.
2.1 Environmental Requirements Environmental requirements are primarily driven by the HCD’s sampling location within a station. Three locations were identified where an HCD could most effectively sample and analyze hydrogen: (1) immediately downstream of the gas source, (2) in between some system components, and (3) immediately upstream of the fueling nozzle. Figure 1 illustrates the possible locations that have been identified for HCD integration. Ideally, an HCD would be located downstream of the fueling nozzle to verify the presence of any contaminant source at the fueling station. Locating the detector here would require modifying the fueling nozzle or putting the detector in an FCEV, both of which, when reviewed by stakeholders in the hydrogen community, were deemed unfeasible in the near term. A survey of the HFSWG of H2USA (results shown in Figure 2) reflects a more realistic preference just upstream of the dispenser. The responses from the HFSWG represent the opinions of vehicle OEMs, station providers, independent gas companys (IGCs), and national laboratory researchers. Additional responses from the H2FIRST HCD group, which consists of California state agency representatives and additional industry members, corroborate these results.
Figure 1. Possible locations for integration of a hydrogen contaminant detector at a typical
station. Possible contaminants from each component are listed. Courtesy of Spencer Quong, Quong and Associates

5
Figure 2. Sampling location preferences from the H2USA Hydrogen Fueling Station Working
Group
Location 3 An HCD installed directly upstream of the dispenser (Location 3) would capture contaminants from all system components except the dispenser piping, hose, and fueling nozzle. Location 3 is especially beneficial because station configurations vary. Locating the HCD downstream of most of the major components allows for nearly comprehensive detection before fuel is dispensed to an FCEV regardless of station configuration. Detection of poor quality fuel would necessitate further investigation by the station operator as any of the upstream components may be responsible. The extreme pressure and temperatures of hydrogen at this point necessitate a robust detector, as gas pressures can reach 900 bar and temperatures can be −40°C under normal conditions.
Location 2 The temperature requirement could be relaxed if the HCD were installed between upstream station components. In general, two choices exist: before the chiller and after the compressor. An HCD installed before the chiller (condensing unit and heat exchanger) at Location 2 would not significantly compromise contaminant detection because the chiller is a closed loop system where the hydrogen is constantly isolated from the refrigerant and therefore not a high risk component for fuel stream contamination. The detection of any contaminant would still require looking into most of the station components to identify the source. Installing the HCD immediately after the compressor discharge would allow for detection as gas is put into storage. This could be potentially beneficial if storage banks are filled individually (positive contaminant detection would only require purging the current bank instead of all storage). It would also limit

6
the possible contaminant sources to the compressor and gas source. Compressor discharge gas may be subject to pressure spikes and high temperatures imposing an extra burden on HCD integration.
Location 1 Another option is to install the detector just downstream of the gas source at Location 1. The gas source could be from onsite hydrogen production, pipeline, or truck delivery.1 An HCD installed at Location 1 would be subject to relaxed pressure and temperature requirements. It would detect contaminants in the hydrogen as it is produced or delivered, but it would not detect any contaminants introduced by other system components such as storage or compression. Upfront detection is beneficial because hydrogen will be distributed from the source to a larger onsite storage vessel of presumably pure hydrogen where any contaminants, if present, will be diluted. If the contaminants are detected early enough, it is possible that the rest of the hydrogen stored onsite will still be of high enough purity. Some participants in the DOE HCD workshop expressed that Location 1 was the most preferred because it minimizes the chance of false positive detections, though it is unclear how this would be the case.
Ambient temperature requirements for a near term HCD are dictated by climate. A detector installed in a Southern California location, such as San Bernardino, will experience ambient temperatures of up to 43°C, while a detector installed at a station in Lake Tahoe will experience temperatures down to −34°C. These maximum and minimum temperatures are highly variable depending on the location. An overall range is provided, but a reduced range is more likely once the location is identified. The environmental requirements for detectors in these locations are given in Table 2.
Table 2. Environmental Requirments for an HCD Integrated at Three Locations within a Station
Parameter Nominal Specification Location 1 Location 2 Location 3
Process pressure (bar) <300 <900 <900 Process temperature (°C) −20 < T < 100 −20 < T < 100 −40 < T Ambient temperature (°C) −35 < T < 45
2.2 Performance Requirements The purpose of an HCD is to monitor for poor quality hydrogen and alert the station operator. The performance requirements of the HCD are two-fold: (1) quantify what constitutes poor quality hydrogen and (2) alert the station operator in a reasonable time. Input from industry stakeholders was solicited for this section. All feedback was considered, but vehicle OEMs and gas producers were targeted for feedback on prioritized contaminants and their concentrations and frequency of analysis. Station operators were targeted for feedback on station integration and operator interface. It is impractical to expect a near term HCD to be able to detect all contaminants listed in SAE J2719. To our knowledge, only two labs in the world are currently capable of a full SAE J2719 analysis. Narrowing down the SAE list of contaminants using a risk- 1 Delivered hydrogen is typically certified to meet the quality standards CGA G-5.3 and a detector at Location 1 would provide a level of redundancy for fuel quality certifications. Quality specifications for major gas providers are provided in the appendix.
7
based approach is critical to defining an achievable device. This section explains the process undertaken in defining the performance requirements for a near term HCD.
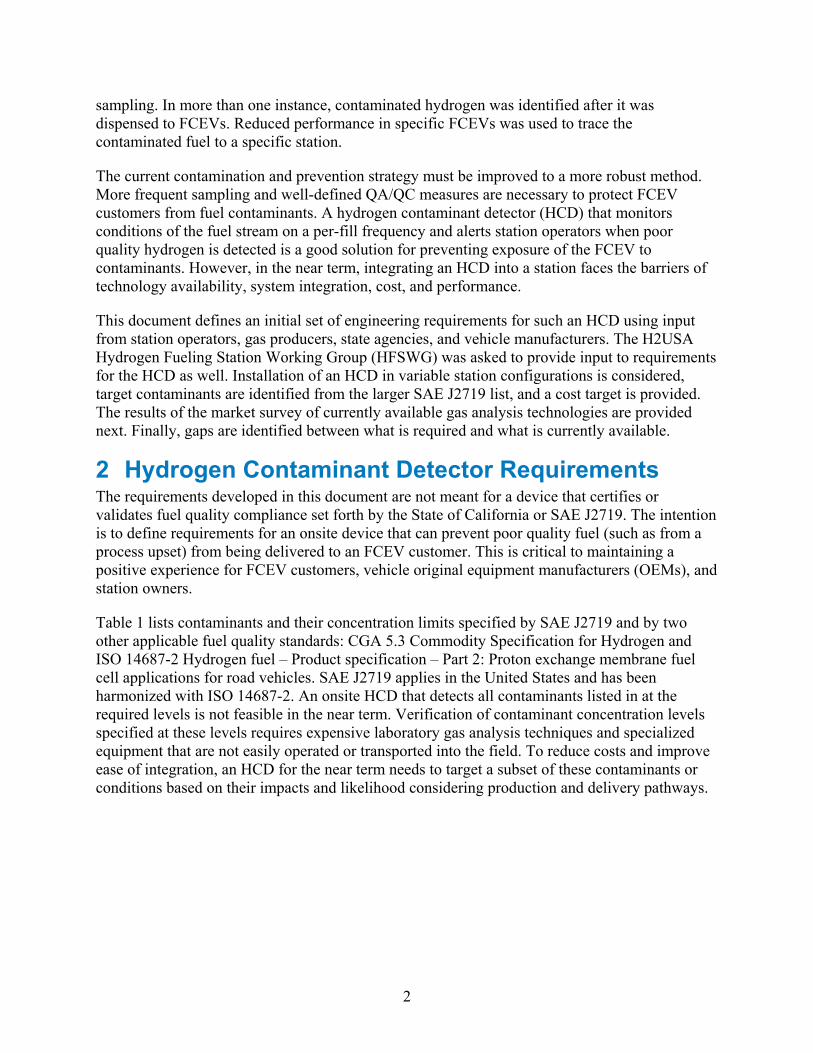
The hydrogen source (i.e., method of production) plays a major role in determining which contaminants are present. Therefore, the contaminants required to be detected are, to a large extent, specific to station configuration. Input from the California Air Resources Board (CARB), CDFA DMS, SAE J2719 Committee members, vehicle OEMs, and national labs was used to narrow the focus of a near term HCD to the top four hydrogen pathways and top four contaminants. The top four pathways constitute 96% of near term station construction in California. Near term station configurations provided by CARB on hydrogen pathways for the 53-station network expected in 2016, provided in Table 3, show that delivered hydrogen is the most common, followed by onsite production via polymer electrolyte membrane (PEM) electrolysis, and onsite production via steam methane reformation (SMR).
Table 3. Near Term Station Configuration for California Hydrogen Stations Provided by CARB
Hydrogen Pathway Number of Stations Considered? Delivered gaseous 35 Yes Delivered liquid 7 Yes Onsite PEM electrolysis 6 Yes Onsite SMR 3 Yes Pipeline, SMR source, onsite purification 1 No Onsite high temperature fuel cell 1 No
For the considered stations, delivered and onsite production of hydrogen will be produced from one of two processes, SMR or PEM electrolysis. The likelihood of contamination and the types of contaminants present differ based on the method of production. SMR involves heating hydrocarbons in the presence of a catalyst, then using a water-gas shift reaction and pressure swing adsorption or palladium separation on the process stream. Each stage must be monitored for abnormal conditions that may increase the possibility of likely contaminants (e.g., carbon monoxide, carbon dioxide, and sulfur). PEM electrolysis uses water as a feedstock and electrochemically separates the hydrogen and oxygen using a membrane. The hydrogen product stream must be monitored for the most likely contaminant, water.
Delivered hydrogen and hydrogen produced onsite should also be considered separately. Delivered hydrogen will typically be produced from a large industrial SMR process with current production facilities having well-established QA/QC practices. Gaseous hydrogen is delivered to the station to a certification specified by the gas delivery company (e.g., CGA G-5.3). Liquid hydrogen is considered the least likely to be contaminated as the process of converting the hydrogen to cryogenic temperatures removes a large portion of the contaminants. Hydrogen produced onsite relies on small scale process controls and the knowledge of the individual station operator to prevent process upsets and maintain good quality hydrogen.
A basic understanding of the possible contaminants and their sources can be seen in Table 4, which was reproduced from a scientific review of PEM contaminants [6].

8
Table 4. Contaminant Sources for SAE J2719 Contaminants [6]
Impurity Source Typical Contaminant
Air N2, NOx (NO, NO2), SOx (SO2, SO3), NH3, O3
Reformate hydrogen CO, CO2, H2S, NH3, CH4 Bipolar metal plates (end plates) Fe3+, Ni2+, Cu2+, Cr3+ Membranes (Nafion) Na+, Ca2+ Sealing gasket Si Coolants, DI water Si, Al, S, K, Fe, Cu, Cl, V, Cr Battlefield pollutants SO2, NO2, CO, propane, benzene Compressors Oils
The SAE J2719 Committee is currently developing J2719/1, an addition to the J2719 standard that includes tables identifying which contaminants could potentially come from certain production techniques, process upsets, and maintenance activities, the first of which is shown below in Figure 3. This and the other tables in SAE J2719/1 are a work in progress and shared here only for reference purposes.

9
Table 4.1 Hydrogen Quality vs Station Impurity Matrix Fuel Dispensed at Station Compressed Gas (CG) Liquid Fuel Stored at Station Compressed Gas (CG) Liquid/CG Liquid Process/Purification Electrolysis/Dehydration Reformation/PSA Liquefied Hydrogen Feed Stock Alkaline PEM Chloralkali Natural Gas Methanol Ethanol Gasoline Not Necessary to Specify
Impurity Constituents Water H20 X X X X X X X X n/a Potassium Ions K+ (3) n/a n/a n/a n/a n/a n/a n/a n/a Sodium Ions Na+ n/a n/a (3) n/a n/a n/a n/a n/a n/a Total Hydrocarbons THC X X X X X X X X n/a Oxygen O2 X n/a n/a (1) (1) (1) (1) n/a n/a Helium He n/a n/a n/a (1) (1) (1) (1) n/a (1) Nitrogen, Argon N2, Ar (2) (2) (2) (2) (2) (2) (2) (2) (2) Carbon Dioxide CO2 (2) (2) (2) (1),(2) (1),(2) (1),(2) (1),(2) (2) (2) Carbon Monoxide CO n/a n/a n/a (1) (1) n/a n/a n/a n/a Sulfur S X X X X X X X X n/a Formaldehyde HCHO n/a n/a n/a n/a (1) n/a n/a n/a n/a Formic Acid HCOOH n/a n/a n/a n/a (1) n/a n/a n/a n/a Ammonia NH3 n/a n/a n/a (1) (1) n/a n/a n/a n/a Total Halogenates n/a n/a X n/a n/a n/a n/a n/a n/a Particulates X X X X X X X X n/a Notes: X Likely to occur if there is a fault or contamination, should always be tested. (1) These contaminants need not be tested if compliance data/documentation is available for the output of the purification stage or with a product delivery. (2) Contamination is likely to occur after commissioning/maintenance and is expected to diminish with use. (3) These contaminants need to be tested if the water limit is not exceeded.
Figure 3. Contaminant sources from various production methods (SAE J2719/1)

10
The likelihood of a particular contaminant’s presence and system impact must be considered together when identifying which contaminants to target for the HCD. As shown in Figure 3, water, total hydrocarbons, nitrogen, carbon dioxide, sulfur, and hydrocarbons are a risk in all gaseous scenarios, though the impact of these impurities on a fuel cell varies. Electrode kinetics, conductivity, and mass transfer are three fundamental mechanisms of PEM fuel cell membrane electrode assembly operation affected by contaminants [6]. Some contaminants, such as water and nitrogen, have temporary effects on fuel cell performance that can be reversed. Others such as hydrocarbons and sulfur permanently modify the chemistry of the fuel cell and may necessitate a replacement stack. Figure 4 categorizes select contaminants according to their impact and ease of detection.
Figure 4. Contaminant impact and difficulty to measure plotted against each other
The top five contaminants were chosen from information regarding contaminant likelihood from SAE J2719/1 and field data collected through NREL’s National Fuel Cell Technology Evaluation Center, combined with information from scientific literature [6, 7] on contaminant impacts on fuel cells and vehicle OEM feedback.
Two detector categories are defined for delivered hydrogen: (1) hydrogen produced from onsite natural gas SMR and (2) hydrogen produced from onsite PEM water electrolysis. The contaminants chosen, shown in Table 5, do not necessarily address all possible contaminants, such as those from compression or storage. They are a prioritized set extracted from SAE J2719 based on input from stakeholders and literature. Prioritization was driven by the impact of the contaminants on the fuel cell and the likelihood of contaminant presence based on feedback from hydrogen producers, station developers, and discussions with the SAE J2719 Committee. In Table 5, a dash implies that the indicated contaminant is unlikely to be present for hydrogen produced by the indicated method.

11
Table 5. Contaminant and Concentration Detection Performance Requirements for an HCD
Contaminant Detection Level Requirements (ppmv) HCD 1 (SMR) HCD 2 (H20 electrolysis)
Water 50 50 Carbon monoxide 2 – Total sulfur 0.04 – Ammonia 1 – Total hydrocarbons (as C1) 20 20
Water, due to its ubiquitous presence, was chosen as a critical contaminant for both SMR and water electrolysis. Water can affect the fuel cell anode negatively by blocking reaction sites on the catalyst. This can lead to corrosion of the anode catalyst support and a permanent reduction in fuel cell performance and lifetime. The concentration level of water specified here is one order of magnitude above SAE J2719 limits. Appendix B of SAE J2719 indicates that PEM fuel cells can tolerate excessive water (>500 ppm), but other elements of the system, such as valves and sensors, may suffer due to freezing effects. The combination of an HCD that monitors for 50 ppm water and QC for commercial electrolysis equipment that monitors the hydrogen product to 5 ppm for onsite equipment will provide protection to both the station and FCEVs from water contamination.
Carbon monoxide, sulfur, and ammonia were chosen for SMR stations because they are the most likely to result from a process upset and have extreme, often irreversible impacts on PEM fuel cells. The concentration levels specified are one order of magnitude above SAE J2719 levels. The levels for these three contaminants are the lowest in the specification and thus present a significant detection challenge, yet their effects on PEM fuel cell performance and lifetime are so detrimental that this level of detection is necessary.
Hydrocarbons were specifically mentioned by an industry representative as important. They could be present in any type of station and could result from multiple station components. The effects of simple hydrocarbons have been shown to be minor when compared with carbon monoxide, sulfur, and ammonia [7]. More complex molecules, such as formic acid or formaldehyde, show larger impacts, yet they are not as likely to be present as simple hydrocarbons such as methane.
The remaining contaminants in SAE J2719 are critical to fuel quality and should not be totally neglected. They were not included in this initial set of requirements for the HCD because of their low likelihood of occurrence or less harmful impact on fuel cell performance and lifetime. Detection time, composed of the time to take a sample, perform analysis, and report the results, is another critical characteristic of an HCD. When operating, the detector should sample, analyze, and report rapidly, though the location of installation will dictate the operating time requirements. A detector installed at Location 1 will only detect contaminants introduced by the delivered gas or gas produced onsite and therefore should only operate when either of these actions is taking place. A detector between station components at Location 2 should operate when the station element it is monitoring, a compressor for instance, is operating. If the detector is installed at Location 3, it should provide analysis on a per-fill basis because there are multiple

12
elements that could introduce contaminants each time gas flows and the gas is being directly distributed to a vehicle. This detector could be required to provide results greater than 40 times per day on near term stations. The HFSWG of H2USA was polled on general operating time requirements. The desired response times and operating frequency from the HFSWG are summarized in Figure 5 and Figure 6.
Figure 5. HCD response time desired by the HFSWG
Figure 6. HCD sampling frequency desired by the HFSWG
2.3 Cost Requirements There are two elements to consider in the cost of an HCD: (1) the capital cost required to purchase the device and (2) the operational costs required to keep the device performing to specification. Due to the nature of current gas analysis technology, operational cost could make up a considerable portion of the overall costs. System calibration, maintenance, and troubleshooting can require a lot of time and resources. Often specialty items, such as ultra-pure

13
calibration gas, are necessary. A trained technician may be required to operate and maintain the device as it currently exists. The HFSWG was surveyed for allowable installed and annual operating costs of an HCD. The results are shown in Figure 7 and Figure 8.
Figure 7. HCD installed cost desired by the HFSWG
Figure 8. HCD annual operating and maintenance cost desired by the HFSWG
An overall device cost, including capital and operational expenditures, of less than 1% of total station costs was concluded from the DOE HCD workshop. If a station is assumed to cost between $1 million and $2 million, then an HCD is required to cost between $10,000 and $20,000 over its lifetime. However, this cost may not be achievable until economies of scale for sensor devices (>1,000 annually) are reached. The capital costs should be less than $1000 at these volumes. Initial HCD costs are expected to be 2–3 times higher.

14
2.4 Requirements Conclusion Once the application has been defined, a full set of requirements for a single device can be made from a combination of the environmental requirements listed in Table 2 and the performance requirements. The required characteristics will depend heavily on the sampling location. There are trade-offs for detector robustness and scope of the station covered by the detector. Station owners will have to determine a balance between QA/QC measures and HCD costs and integration.
Using the quality function deployment approach,2 customer needs were mapped into engineering requirements. These requirements are shown in Table 6. The full diagram is shown in Figure 10.
Table 6. HCD Engineering Requirements
Requirements Installed cost under $5,000 Annual operating cost <$1,000 Detect water, CO, sulfur, ammonia, and hydrocarbons Sample, analyze, and report within 1 minute Withstand pressures up to 900 bar Withstand ambient temperatures between −20°C and 45°C Calibration interval no more than twice yearly Sampling frequency at least every fill event Detect contaminants at 1 order of mag. above SAE J2719 levels Available in 18 months 1 ft3 in volume Draw samples from the dispenser input Visual output Digital output (RS485, CAN) Operable by skilled technician3
2 http://asq.org/learn-about-quality/qfd-quality-function-deployment/overview/overview.html 3 A skilled technician is understood to have training in either mechanical or electrical fields beyond a general laborer, but less advanced than a BS degree.

15
3 Market Survey Gas analysis technology is mature and used in many applications. The most widely used techniques can be divided into three broad categories: gas chromatography, mass spectrometry, and optical. In gas chromatography (GC), gas samples are injected into specialized columns where individual constituents are separated and then passed to a detector. The detector analyzes property changes to provide a quantitative result for constituent concentration. The detector can be a number of different technologies such as a thermal conductivity detector (TCD), electron capture detector (ECD), flame ionization detector (FID), pulsed flame photometric detector (PFPD), or pulsed discharge helium ionization detector (PDHID). Most GC columns are optimized for a specific class of chemicals. It is likely that multiple columns will be required for the analysis of multiple contaminants by a single GC, which adds cost and complexity.
A mass spectrometer (MS) can also be used as a stand-alone detector or with a GC if separation of components is necessary for accurate analysis, as is common in complex mixtures. In an MS, a gas is ionized to form particles that are accelerated through a magnetic field. The ratio of the charge of the particles to their mass causes them to change course in the presence of the magnetic field, which can be quantified and used to distinguish the type of particle and its concentration. A stand-alone MS is considerably faster than a GC analysis.
Optical techniques commonly involve applying a radiation source (e.g., a light source) through a gas sample and measuring the transmission or absorption of the radiation. Optical methods are based upon the fact that most gas species absorb radiation at very specific wavelengths and the magnitude of this absorption is proportional to the concentration. Fourier transform infrared (FTIR) spectroscopy is a very common optical technique that can provide both qualitative and quantitative analysis of constituents. Traditional Michaelson FTIR spectrometers use an incoherent broadband thermal emitter as a radiation source and require the use of an interferometer to separate the frequency components of the light into a spectrum. The interferometers typically require more frequent calibration that could significantly increase operation and maintenance costs for this type of technique. Newer laser-based techniques, such as continuous wave cavity ring down spectroscopy (CW CRDS) or tunable diode laser (TDL) spectroscopy, use coherent light sources, whose line widths can be ultra-narrow, overcoming the need for a spectrometer or interferometer and allowing for smaller and more affordable analyzers. The conventional method to perform sensitive laser-based absorption spectroscopy measurements is to increase optical path length by using an optical multipass gas cell. However, such an approach can be difficult to implement in field applications requiring a compact gas sensor system. For example, a typical commercial 100 meter effective path length multipass gas cell has a volume of 3.5 L [10]. An alternative spectroscopic technique to obtain a long optical path is to make the light bounce along the same path between two ultralow-loss dielectric mirrors forming a high finesse optical resonator that behaves as a ring down cavity (RDC). However, all of these infrared (IR) techniques are especially useful because hydrogen does not absorb in the infrared spectrum as it contains no dipole moment, thus it will not create an interfering background.
Knowledge of the current state of the market is critical when considering an HCD for station installation. A study was undertaken by DOE, NREL, Savannah River National Laboratory, and MKS Instruments in 2009 to find technologies capable of analyzing carbon monoxide, hydrogen

16
sulfide, ammonia, carbon dioxide, water, nitrogen, oxygen, and hydrocarbons at ISO CD 14687-2 levels (fully harmonized to SAE J2719) with an allowable error of +/− 10% [8]. The study reached out to GC, MS, and optical companies and asked them to either identify currently available technology or propose how new technology could be developed to meet these requirements.
Equipment proposed ranged from $10,000 to $140,000 with the capacity to measure one contaminant up to all eight. The study showed that no current technology could satisfy the requirements and even future technology would cost more than $40,000 and would be vehicle transportable, meeting only 90% of the requirements. The most promising technology was the prototype hand portable tunable diode laser from Physical Sciences Inc. with a specific contaminant module cost of less than $10,000 achievable in a mature market. The device was specified to measure carbon monoxide, ammonia, carbon dioxide, and water at ISO CD 14687-2 levels.
A study conducted by the CDFA DMS [4] in 2014 analyzed the gaps between the concentration levels required by SAE J2719 and current testing methods and technologies. CDFA DMS attempted to measure all contaminants in hydrogen samples to SAE J2719 levels using numerous GC techniques, ion chromatography, and FTIR spectroscopy technologies. The study found that, due to the stringency of SAE J2719, multiple pieces of technology are necessary to test for all contaminants and “current test methods generally do not have sufficient sensitivity and robustness for the analysis of hydrogen for fuel cells. Therefore, they cannot support regulatory enforcement by the Division. In other cases, there are no existing methods for the analysis of J2719 contaminants in hydrogen gas.”
General performance characteristics were accumulated from the CDFA DMS report [4], the NREL report [8], and this survey to show typical detector types and their applications, shown in Table 7.

17
Table 7. Gas Analyzer Technologies and Their Target Analytes
Type of Detector Target Analytes GC - MS Universal GC - FID Carbon dioxide, carbon monoxide,
formaldehyde, hydrocarbons GC - TCD Universal GC - ECD Halogenated hydrocarbons, oxygen GC - PFPD Sulfur GC - PDHID Oxygen, nitrogen, methane, argon, carbon
monoxide and carbon dioxide GC - pulsed discharge ionization detector Carbon monoxide, hydrogen sulfide, ammonia,
carbon dioxide, nitrogen, oxygen, hydrocarbons Ion chromatography Formaldehyde, formic acid, ammonia FTIR Water, hydrocarbons, carbon dioxide, carbon
monoxide, hydrogen sulfide, sulfur dioxide, formaldehyde, formic acid, ammonia and halogenates
Non-dispersive near-IR (NDIR) absorbance Water, hydrocarbons, carbon dioxide, carbon monoxide, hydrogen sulfide, sulfur dioxide, formaldehyde, formic acid, ammonia and halogenates
TDL absorbance (mid-IR) Carbon dioxide, carbon monoxide, water, ammonia, hydrogen sulfide, sulfur dioxide, hydrocarbons, formaldehyde, formic acid, halogenates
Cavity ring down (mid-IR) Water, ammonia, carbon dioxide, carbon monoxide, formaldehyde, hydrocarbons
Information from both of the NREL and CDFA DMS studies was used to craft a questionnaire to identify possible technologies that could satisfy the requirements of an onsite HCD. A deeper investigation into some of the previously identified technologies was conducted and more companies were included. The questionnaire was distributed to 18 relevant manufacturers regarding their equipment’s ability to meet the requirements of an onsite HCD. Information was sought regarding station integration, contaminant detection, availability, and cost. Responses were evaluated and the top candidates were contacted again to obtain quotes for specific pieces of equipment. The questionnaire and responses obtained are provided in the appendix.
Companies that provided responses to the questionnaire and their respective technologies are:
• Daylight Solutions—TDL
• Hiden Analytical—quadrupole MS (HPR-20)
• California Analytical Instruments—NDIR, FTIR, photo-acoustic, chemiluminescence, paramagnetic
• Power + Energy—GC, concentrator and quadrupole MS (HEMS-M)
• JASCO—FTIR, Raman with multipass optical cell

18
• CIC Photonics—FTIR/multipass optical cell (Scout, 4Runner, Ranger, CRV)
• Applied Analytics—FTIR, TDL
• Physical Sciences Inc.—TDL
• HORIBA International Corporation—NDIR
• Tiger Optics—CW CRDS
• Aeris Technologies, Inc.—TDL/compact multipass optical cell.
Overall the required process conditions for the analyzers are consistent with a laboratory environment with one exception. The CIC Photonics CRV FTIR unit specifies a maximum pressure of up to 2,000 psig. The maximum pressure requirement for other analysis equipment is less than 500 psig. Typically only a maximum value was specified for process gas temperatures with most technologies listing 40°C. Only the JASCO units specified the ability to handle cryogenic temperatures.
Ambient condition specifications were mostly consistent. Lower temperature specifications ranged from −5°C to 10°C. Upper temperature specifications ranged from 30°C to 50°C. As most of these units are intended for laboratory use, they would need to be equipped with a weatherproof enclosure if located outdoors at a station.
The surveyed analyzers all report results within a 5 minute window, with the exception of the Power + Energy HEMS-M, which specifies a 15 minute analysis time. Results are logged internally and displayed on a local screen. The HEMS-M device has the added benefit of dry contacts for easier interfacing into larger alarm systems; however, this should not be difficult to implement into other devices. All of the technologies, with the possible exception of the CW CRDS (depending on the line width of the laser), will be subject to the effects of multiple contaminants in the process stream. This problem is handled using software to de-convolute the spectral overlaps.
Analyzer accuracy varies for different technologies. Table 8, reproduced from the CDFA DMS report [4], shows the experimentally determined minimum detection limit (MDL) of certain contaminants using certain technologies.

19
Table 8. Minimum Detection Limits Compared to SAE J2719 Requirements for Various Analytes and the Detection Methods [4]
a J2719 does not include a separate specification for methane. Up to 100 μmol/mol of methane is allowed if no other hydrocarbon is present. If any other hydrocarbon is present, the combined total hydrocarbon limit of 2 μmol/mol applies. b As listed in Table 12 (of the reference DMS study [4]), each sulfur compound tested had a different MDL. The SAE J2719 maximum concentration of 0.004 ppm is ambiguous since it does not specify a reference compound or response factor to be used in MDL calculations. Therefore, the range of values listed in Table 12 is reported here. These results will be presented to SAE for use in revising the sulfur contaminant specification in J2719. c Because of time limitations, MDL studies for all of the halogenates were not completed. However, the sensitivity of the GC/MS analysis is expected to be adequate to meet the specifications of SAE J2719 for all compounds.
Gas analyzer costs vary significantly. Capital costs for analyzers without integration systems for higher pressures cost from $10,000 to $140,000 largely based on the number of analytes detectable. Often modules can be added for an additional cost to increase the number of analytes the device is capable of detecting. Routine operation of the surveyed technologies will be a significant burden on a station operator. Calibration typically requires a special calibration gas and is either accomplished manually by a trained technician or automatically by special hardware. Many of the technologies require per-fill or daily calibration. Others, such as the Hiden HPR-20 or JASCO FTIR, require monthly calibration, based on manufacturer specifications. The Power + Energy HEMS-M device specifies a calibration interval of every other month, while the Tiger Optics CW CRDS requires no calibration, though a monthly internal self-check routine is recommended. Routine operational costs for all devices surveyed were estimated between $300 and $12,000 per year, depending on the age of the device.
The availability of these technologies was determined. Because 51 stations are open and 49 are in development [9], the intention of this market survey is to identify technology available today. Vendor responses ranged from “no applicable technology” to “we have a device ready to ship Q1 of 2015 that is intended to test fuel quality at a station”. Vendors were asked about future plans for applicable technology. Some plan to develop diode laser technologies further, while most are watching the market before developing anything specific to the HCD application.
Analyte Analytical Method SAE J2719 Limit (ppm)
CDFA DMS MDL (ppm)
Total hydrocarbonsa GC-FID (System 2) and FTIR 2 0.012 Helium GC-TCD (System 2) 300 20 Nitrogen GC-PDHID (System 2) 100 11 Argon GC-PDHID (System 2) 100 11 Carbon dioxide GC-FID (System 2) and FTIR 2 0.23 (FID)
0.011 (FTIR) Carbon monoxide FTIR 0.2 0.020 Sulfur compounds GC-PFPD (System 1) 0.004 0.0106–0.0071b Total halogenates GC/MS (System 1) 0.05 c

20
3.1 Market Survey Conclusion and Gap Analysis Large deficiencies remain between the requirements for an onsite HCD and the capabilities of technologies identified in the NREL study, the CDFA DMS study, and this survey. None of the technologies evaluated could fully meet the requirements of an HCD. The main deficiency in the equipment surveyed in the CDFA DMS study and here is the station integration component. Almost all of the gas analyzers with the necessary accuracy that are available today are intended for laboratory use and thus lack the robustness and interface to meet the application. Technology presented in the previous NREL study [8] was at the idea or prototype stage. Follow-up calls were made to three of the most responsive companies at the time, Agilent, Applied Analytics, and Physical Sciences Inc., regarding their responses to the NREL study. None had any current technology that is applicable to an HCD application and thus they are not included in this market survey. Agilent did not indicate that any more developments have been made on the microGC. Applied Analytics stated that their experience from the field has shown that “this technology is not a good fit for our company right now.” Physical Sciences Inc. did not believe this application was appropriate for their TDL technology and stated that they were watching the market before deciding on any future developments.
The engineering requirements developed in the quality function deployment (Table 6) were compared to the status of the detectors surveyed, and the results are summarized in Figure 9. Target requirements are shown as blue diamonds, while the ranges of specifications from the market survey are shown as gray bars. The requirement is met by at least one of the technologies where the blue diamond lies inside of the gray bars. If the blue diamond lies outside of the gray bar, then a gap exists between the requirement and the current state of technology. The distance between the edge of the gray bar and the blue diamond indicates the magnitude of the deficiency.
Figure 9. HCD gap analysis summary

21
Inlet pressure specifications for analyzers are well below what is required at most points in current stations. The only point within a station where gas pressure meets typical analyzer specifications is Location 1 at onsite production (either SMR or electrolysis) stations. If a sample of hydrogen is taken with the surveyed technologies, a pressure regulator, possibly with multiple stages, would be needed. Ambient conditions are also a concern. Electrical systems and housing are not rated for an outdoor station environment. A more robust enclosure could be developed to house the analyzer for additional costs.
The performance characteristics of gas analyzers surveyed were adequate in some cases. TDL-based techniques can detect all of the analytes listed in Table 5 at the required concentration levels. Additionally, FTIR coupled with a multi-pass gas cell and MS with a pre-concentration technique can detect all analytes at the specified concentrations as well. Detection of sulfur and water at the required levels is a problem for most technologies, though the laser-based techniques are able to detect water at much lower levels (ppbv).
Most manufacturers specified response times that meet the requirements of an HCD. Reporting methods and the user interface are a concern though. Many of the technologies have a front panel display that would require a station operator to constantly monitor the device as it operates. Some technologies are accessible via serial or Ethernet connections, but data must be extracted and analyzed. This presents an unacceptable burden on station operators and may also result in a delay in identifying when an out-of-normal situation is detected. The Power + Energy HEMS-M device offers the best solution with dry contacts that actuate in the event of an alarm and could be easily integrated into a station control system, but as mentioned before, this is not a technical challenge and all of the technologies could simply add this feature if specified for the application.
Calibration requirements are another potential burden. The CIC Photonics FTIR units require calibration every time there is a reduction in throughput through the gas cell. Other devices, such as the Tiger Optics CW CRDS, require no calibration, but instead include self-verification capability. This unit could require annual, or more frequent, cleaning or replacement of the cavity optics if the gas stream is contaminated. Additionally, most devices require a reference gas that will need to be obtained and replaced.
None of the technologies surveyed meet the cost requirements for an HCD. Analyzers can be obtained within the $10,000–$90,000 range, yet the operating costs, including training a station operator to use and maintain a device, will exceed the requirement over the life of the device.
The most complete commercial-off-the-shelf technologies that could be used in an HCD application are the Power + Energy HEMS-M device and the Tiger Optics CW CRDS. Neither can meet the environmental requirements of Location 3. Both devices would require the use of a pressure regulator for station integration but could not handle the temperature of gas coming out of the chiller. They are both well suited for the application because of their ability to meet the performance requirements of an HCD for both hydrogen production pathways. These devices are specified to target the required contaminants (with the exception of sulfur for the CW CRDS) and measure at SAE J2719 levels. Operational expenses are low due to self-calibration methods and no required maintenance. The HEMS-M device does not meet the detection time requirement of 1 minute. The CW CRDS can perform one reading per second and thus is a good

22
fit for continuous monitoring. Unfortunately, there is not much available field data validating these technologies in such a setting, although there is an effort (i.e., proposed revision) within the ASTM Committee on Gaseous Fuels, D03, to perform an inter-laboratory study to validate claims for CW CRDS (ASTM D7941-WK47249). Results from field testing these technologies at a station would be highly valuable to the hydrogen industry.
One device that is currently used in the field is the HORIBA GA-360E. Inlet pressure specifications are near atmospheric pressure. It is specified to detect carbon monoxide, carbon dioxide, and methane at the 0.01 ppm level, though it can only measure two of the contaminants per unit.4 The detection time is less than 3 minutes and alarm levels can be set for concentration levels. The unit does require weekly calibration with a reference gas. The capital cost is not prohibitive at $15,000 per unit, though operating expenses are not known at this time.
A House of Quality diagram (Figure 10) was constructed to succinctly compare the most promising technologies: CW CRDS, MS, MS with concentrator, FTIR, NDIR, and TDL-compact multipass. Customer requirements were matched with engineering requirements to show correlation. The technologies were ranked according to their ability to meet the customer requirements.
4 This photoacoustic technology is subject to differentiation problems among multiple contaminants (i.e., ammonia, water, and hydrocarbons) in the near-infrared. More research is needed to determine whether the use of chemometric techniques could circumvent these problems.

23
Figure 10. House of Quality diagram comparing the most promising HCD technologies

24
4 Path Forward for Success This document is intended to be a living set of requirements. As more information becomes available, the set of requirements could change. Important work is currently being undertaken by the SAE J2719/1 Committee to revise the contaminant tables. The industry would benefit greatly from validation tests with the best-suited pre-commercial and commercial technology. It is recommended that DOE and the H2FIRST team work with potential HCD manufacturers to test, validate, and further develop systems for this new application to encourage the rapid deployment of an HCD.

25
References 1. Compressed Gas Association Commodity Specification for Hydrogen, G-5.3, 2011.
2. SAE Hydrogen Fuel Quality for Fuel Cell Vehicles, J2719, 2011.
3. Specifications for Hydrogen Gas Used in Internal Combustion Engines and Fuel Cells. California Code of Regulations, Title 4, Division 9, Chapter 6, Article 8, 2014.
4. Mough J.; Schnepp K.; Fitch P.; Ingram R.N.; Ferris S. Measurements and Standards Requirements for Hydrogen and Biodiesel. Prepared for the California Energy Commission by the California Department of Food and Agriculture Division of Measurement Standards. Sacramento, CA: California Energy Commission, 2015.
5. “Hydrogen Contamination Detector Workshop.” U.S. Department of Energy Fuel Cell Technologies Office. Accessed April 3, 2015: http://energy.gov/eere/fuelcells/downloads/hydrogen-contamination-detector-workshop.
6. Cheng, X.; Shi Z.; Glass, N.; Zhang, L.; Zhang, J.; Song, D.; Liu, Z.S.; Wang, H.; Shen, J. “A review of PEM hydrogen fuel cell contamination: Impacts, mechanisms, and mitigation.” Journal of Power Sources (165), 2007; pp. 739-756.
7. Moulter, T.M. “Effects of Impurities on Fuel Cell Performance and Durability.” DOE Hydrogen and Fuel Cells Program 2011 Annual Progress Report. Washington, DC: U.S. Department of Energy, 2011.
8. Ohi, J.; Buttner, W.; Post, M.; McWhorter, S.; Marshik, B. Fuel Quality Field Instrumentation. Golden, CO: National Renewable Energy Laboratory, 2009 (internal only).
9. “Hydrogen Fueling Station Locations.” Alternative Fuels Data Center, U.S. Department of Energy Office of Energy Efficiency and Renewable Energy. Accessed December 7, 2014: http://www.afdc.energy.gov/fuels/hydrogen_locations.html.
10. Curl, R.F.; Capasso, F.; Gmachl, C.; Kosterev, A.A.; McManus, B.; Lewicki, R.; Pusharsky, M.; Wysocki, G.; Tittel, F.K. “Quantum cascade lasers in chemical physics.” Chemical Physics Letters (487), 2010; pp. 1-18.

Appendix Gas Provider Hydrogen Purity Specifications (see CGA 5.3 Commodity Specification for Hydrogen)
Maximum Concentration of Constituents in Delivered Gas (ppm)
IGC Linde Praxair Air
Products Air Liquide
Product HiQ Hydrogen
5.0 HiQ Hydrogen 5.0
Zero 5.0 Methanizer
FID Ultra High
Purity Liquid Ultra High
Purity Electronic UHP/ Zero
H20 3 3 3 3 200 2 1 3.5 O2 2 2 1 1 - 1 0.5 5 THC 0.5 0.2 0.5 0.5 - 0.5 0.2 0.5 N2 5 5 3 - - 5 5 - CO - 1 0.0005 - - 1 1 - CO2 - 1 0.0005 - - 1 0.5 - Ar - - - - - - 2 -
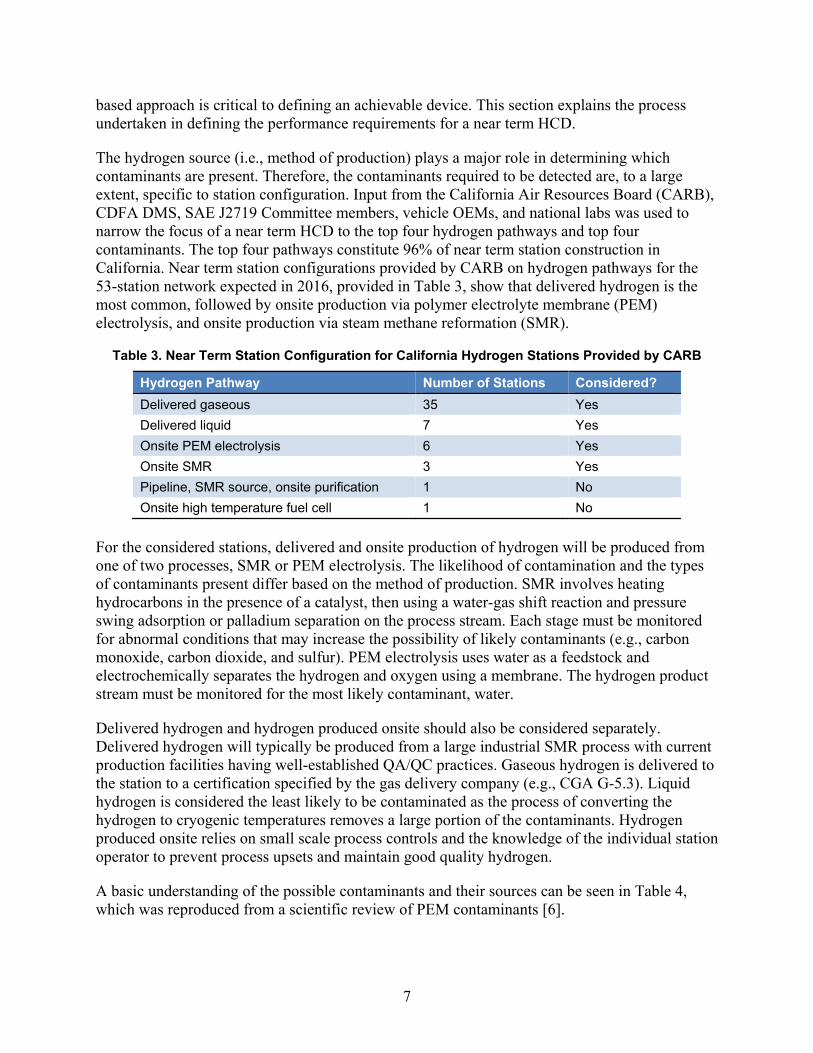
H2FIRST HCD Market Survey – Manufacturer Survey H2FIRST is a partnership of private industry, federal labs, and the U.S. Department of Energy that seeks to address the most important technological barriers impeding the deployment of hydrogen infrastructure for fuel cell electric vehicles (FCEV). The Hydrogen Contaminant Detector (HCD) project seeks to develop an inline fuel quality monitor to be installed at stations that will prevent damage to FCEVs from contaminants in the fuel at the ppm or ppb level including, but not limited to, carbon monoxide, carbon dioxide, sulfur, water, and ammonium. Currently the project team is gathering data on gas analysis technologies, distinguishing which technologies would best apply to this application, identifying gaps, and defining a set of engineering requirements for an HCD. Reference documents include SAE J2719 and CGA G5.3.
1. General a. What types of analyzer/concentrator/sensor does your company manufacture? b. Which of these technologies are hydrogen compatible?
2. Station integration a. Over what pressure range (for the sample gas) can it operate? b. Over what temperature range (for the sample gas) can it operate?
i. Over what ambient temperature range can it operate? c. How often is calibration required? d. How is calibration performed? e. What level of technical expertise is required to operate the device? f. How are results reported?
3. Contaminant/chemical detection a. Which chemicals are targeted by the technology? b. At what concentration in hydrogen can the technology detect these contaminants? c. Are there effects of a mixture of contaminants in the gas stream? d. How long does it take to analyze a sample? e. How much gas is required in a sample?
4. Availability a. Current technology b. Future technology development?
5. Cost a. Capital (purchase price) b. Operational

28
Market Survey Responses Station Integration General Station Integration
Company Hydrogen Technologies
Pressure Range
Temperature Range
Ambient Temp Range
Calibration Frequency
Method of Calibration
Technical Expertise Reporting Method
Daylight Solutions
tunable mid-infrared lasers n/a n/a n/a n/a n/a n/a n/a
HIDEN quadrupole mass spec HPR-20
100 mbar, 30 b
ambient to 1,000°C w/ interface
5°C, 40°C 4–6 weeks auto, calibration gas
trained operator
ASCII/OPC, extract through socket
CAI NDIR, FTIR, PAC, CLD, paramagnetic
use regulator up to 50°C -5°C, 40°C 24 hours zero/span gas technician locally and remote
Power + Energy HEMS-M (GC-TCD) 100–125
psig flexible, non condensable 10°F, 120°F bi-monthly
auto—internal, man—calibration gas
can be auto, maintenance requires training
front panel, Ethernet, dry contacts for alarms
JASCO FTIR, Raman few bar cryo to >800°C 10°C, 40°C weekly to monthly
FTIR (novice), Raman (expert)
CIC Photonics FTIR systems
up to 300 psig for Scout (2–15 cm), 4Runner (4–6 m), and Ranger (9.6m); up to 2,000 psig for CRV (5 mm–5 cm)
up to 200°C up to 30°C
every time there is a reduction in throughput through the gas cell
span gas
technician level with minimal training
local screen display, stored locally

29
General Station Integration
Company Hydrogen Technologies
Pressure Range
Temperature Range
Ambient Temp Range
Calibration Frequency
Method of Calibration
Technical Expertise Reporting Method
HORIBA NDIR (GA-360E) 50–100 kPa reference gas measured value, range, alarm
Tiger Optics CW CRDS (Prismatic, HALO)
10–125 psig 10°–40°C up to 50°C not necessary
self verification monthly, laser accuracy annually
none stored locally, Ethernet, serial, 4–20 mA
Agilent microGC - - - - - - - AERIS Technology
TDL (MIR) multipass - - - - - -
Contaminant Detection General Contaminant Detection
Company Hydrogen Technologies Target Analytes Concentration Limits Mixture Effects Analysis
Duration Gas Requirement
Daylight Solutions tunable mid-infrared lasers dipoles (CO, CO2, H20) n/a n/a n/a n/a
HIDEN quadrupole mass spec HPR-20 1–200 amu (opt for greater) 5 ppb, subject to spectral
overlaps software to de-convolute overlaps >sub-seconds >1 sccm, 20 sccm standard
CAI NDIR, FTIR, PAC, CLD, paramagnetic any gas that absorbs IR ppb up to 100% yes 2 s to minutes most is continuous, fixed >5L
Power + Energy HEMS-M (GC-TCD) N2, CO2, CO, THC (CH4), NH3, TS (H2S), H20, 02, Ar
N2—5 ppm; CO2—0.1 ppm; CO—0.01 ppm; NH3—0.02 ppm; Stot—20 ppt; H2O—0.12 ppm; O2—1 ppm; Ar—5 ppm
developing methods for separating
15 min 1.5 L at 100–125 psig

30
General Contaminant Detection
Company Hydrogen Technologies Target Analytes Concentration Limits Mixture Effects Analysis
Duration Gas Requirement
JASCO FTIR, Raman mostly organics ppm, but depends on tube length n/a few sec to
few min 10 to 100 mL
CIC Photonics FTIR systems any IR active; not diatomics (O2, N2, etc.) or single molecule gases (He, N)
low ppb possible yes, spectral overlap 6 seconds
The Ranger, being the largest gas cell, has a volume of 1.6 L; the 4Runner has a volume of 0.6 L (with a low volume option bringing it to 0.33 L); and the Scout and CRV have the smallest volumes, depending on the path length chosen. The Scout ranges from ~10 cc to ~75 cc, and the CRV has volumes ranging from ~1.7 cc to ~16.9 cc
HORIBA NDIR (GA-360E) CO, CO2 and CH4 0.01 ppm can measure <2 <180 seconds 3.5 L/min
Tiger Optics CW CRDS (Prismatic, HALO)
H20, CO, CO2, CH4, CH20, CH202, NH3
CO—150 ppb/1,000 ppm; NH3—2 ppb/40 ppm; H20—10 ppb/50 ppm; CH4—1 ppb/10 ppm
not susceptible 1 reading per second 500–1,500 sccm
Agilent microGC - - - - -
AERIS Technology TDL (MIR) multipass CH4 2 ppm 6 0cc

31
Cost and Availability General Availability Cost Notes
Company Hydrogen Technologies Current Future Capital Operational
Daylight Solutions tunable mid-infrared lasers n/a n/a n/a n/a not the right
application
HIDEN quadrupole mass spec HPR-20 yes as application evolves $65k–$70k $300–$500/year; $5k/2–3 year;
$12k/4 year
CAI NDIR, FTIR, PAC, CLD, paramagnetic yes laser diode $10k–$80k <$1k/year
Power & Energy HEMS-M (GC-TCD) ship 1Q 2015 cost and analysis time reduction $40k $1k/year + 1–2days of training
JASCO FTIR, Raman yes no advances planned FTIR—$16k Raman—$90k
low power consumption
CIC Photonics FTIR systems 6–8 weeks new analytical software base $45k continuous purging with N2 or air
HORIBA NDIR (GA-360E) yes $15k $65/year
Tiger Optics CW CRDS (Prismatic, HALO) yes develop ASTM/ISO MTBF >20 yrs, zero cost
Agilent microGC - - - - not a good fit
AERIS Technology TDL (MIR) multipass developmental yes <$50k