h1 fy22 investor presentation 9 nov 2021 copy
TRANSCRIPT

H1 FY22 Investor Presentation 10th November 2021
Safaricom PLC
The Numbers
12
The following presentation is being made only to, and is only directed at, persons to whom such presentations may lawfully be communicated (“relevant persons”). Any person who is not a relevant person should not act or rely on this presentation or its contents.
This presentation does not constitute an offering of securities or otherwise constitute an invitation or inducement to any person to underwrite or subscribe for or otherwise acquire securities in the Company. The presentation also contains certain non-GAAP financial information.
The Group’s management believes these measures provide valuable additional information in understanding the performance of the Company’s businesses because they provide measures used by the company to assess performance. Although these measures are important in the management of the business, they should not be viewed as replacements for, but rather as complementary to, the comparable GAAP measures.
Safaricom, M-PESA and Safaricom/M-PESA logos are trade marks of Safaricom PLC. Other products and company names mentioned herein may be the trademarks of their respective owners.
DISCLAIMER
2

OPERATING ENVIRONMENT UNCERTAINTY REMAINS, GRADUAL RECOVERY UNDERWAY |
3
HeadwindsTailwindsIncreasing regulatory scrutiny,
Taxation- adjusted excise duty on telcoproducts
Improved macro outlook +6.3% YoY GDP projection for
2021 (World Bank), -0.3% 2020
Sustained pressure on currency & consumer wallet with
rising inflation
Improved business sentiment Strong service revenue recovery,
strong balance sheet & diversified portfolio
Upcoming general electionspolitical risk
Consumer confidence and business activity boosted by COVID-19 vaccination
efforts

SUPPORTING ECONOMIC RESILIENCE IN OUR COMMUNITIES | OUR PURPOSE
4
Safaricom YouthOrchestra
LEWA Marathon (raised $350Mn for wildlife
conservation and community development)
Pamoja (Staff) Initiative
Ndoto Zetu phase 3 projects
Maternal & Child Health,Education and Economic
empowerment programmes ongoing
Uzazi Salama Programme
Fistula repair programme
Wezesha Elimu phase 4Christian Blind Mission for
Children with Disability
Foundations
SafaricomFoundation
M-PESAFoundation
Sponsorships
Sports Conservation& Music
Supporting our Communities
2021 World Rally Championship
2021 World Athletics U20 Championships
2021 Tokyo Olympics
Kenya Open & Sunshine Golf Tours
2 millionBeneficiaries
InvestingKShs 810Mn
(KShs 200Mn)

SUSTAINABLE BUSINESS STANDING TOGETHER, GOING BEYOND |
5
True Value Assessment
5
For more details on the True Value methodology refer to our 2021 Sustainable Business Reportlaunched in September 2021. Link <SBR Report 2021>
1,003,669Jobs Sustained
A
9.7x profit
1.5%
generated(KShs 68.7Bn)
Impact onsociety BEconomic
value added
KShs 362.0Bn
1.0%
Through operationsand taxes
DEnvironmentalexternalities
KShs 419.0Bn3.1%
100% YoY
Trees planted650k
C
KShs 242.4Bn3.5 %
Social valueof M-PESA

6
STRATEGIC FOCUS | STRONG EXECUTION DRIVING GROWTH
To be a purpose-led technology company
A digital-first, insights-led organization that enables platforms and ecosystem partnerships
!Foundational Enablers
Vision
TransformationGoal
People and Organization
Data & Analytics Network and IT M&A and Partnerships
!Purpose Transforming lives
Transformative Pillars
Strengthen the Core Achieve cost leadership
To be a Financial Services Provider
Win in select digital ecosystems
Deepen Customer Engagement & Experience

STRATEGY PIVOTING TOWARDS A TECHNOLOGY COMPANY |
67
Strengthening the Core
Defending voice
Democratizing data
Technology business partner of choice
Regional expansionto Ethiopia
FinTech Ecosystem
Addressing customerpain points
Powering digital lifestyles(consumer & businesses)
Integrated businesssolutions
Scale DigiFarm in a commercially
sustainable way
Enabling access toclean energy via Circle
Gas
Driving healthcareinclusion
Winning in Digital
EcosystemsCost optimization to
fuel new growthareas: KShs 2.3Bn
opex savings
Driving productivityand efficiency
Achieving CostLeadership
Regional Expansionto Ethiopia

8
Regional Expansionto Ethiopia

ETHIOPIA AN OPPORTUNITY TO LAUNCH OPERATIONS BEYOND KENYA |
* Source; World Bank. GDP per Capita, PPP is expressed in current international dollars** Significant sim penetration growth in first 5 years– new licenses driving coverage and multi-simming, base case prior to bid submission
9
Mobile Financial Services (subject to license award)
Telecommunications ServicesDigital Services
Opportunities for Safaricom
Ethiopia is an attractive market GDP per Capita, PPP (USD) / Population*
Sim Card Penetration & GDP Growth Rate Projections
44.4%
-1.8%52.9%
62.7%72.1% 81.1%4.1%
9.1%10.1%
9.8%
Launch Y2 Y3 Y4 Y5
Sim card penetration**GDP Growth rate*
Governmentʼs clear intention to open up the economy
A huge population (median age at 17 years), growing GDP per capita (average at 7% over the last 7 years)
Opportunity to drive digital transformation in Ethiopia
A high growth opportunity, low penetration of services (telecoms at 43% and mobile financial services at <2%)
2020
Ken Tanz Eth Moz DRC Population
1,297
4,4522,780
2,423
1,131
120Mn59Mn49Mn 30Mn 89Mn

ETHIOPIA LICENSE AWARDED AND OUR FINANCIAL AMBITIONS |
10
Network Rollout Y1: c1k sites at launch Y10: 10k - 12k sites
Capex Investment5Yr plan:USD 1.5 - 2.0Bn
EnablersNetwork expansion through own build and infrastructure sharingSim card penetration
Mobile money products (subject to license award)
World class digital services
EBITDA break-even in Y4EBITDA Margin Y10 est. at around 40%
Y1 Funding including license payment (Safaricom PLC)
USD c600Mn
Funding sources; Equity, DFIs, local borrowing and internal
reserves
Spectrum Unified technology neutral telecoms
services license, with spectrum allocated
2x10 2x202x10 2x202x20
800 MHz 900 MHz 1,800 MHz 2,100 MHz 2,600 MHz
MHz MHz MHz MHz MHz

11
ETHIOPIA INVESTMENT RISKS AND UNCERTAINTIES |
Currency
Currency volatility
Forex availability
Infrastructure
Securing access to land and buildings
Concluding
infrastructure sharing agreements
Political &Regulatory
Implementation of market liberalisation & new
regulatory framework
Investment rules and taxation
Ongoing political conflict

ETHIOPIA LAUNCH READINESS |
12
02DATA
01Completion of company and governance set up Board members appointedExco leadership team with diverse experience
03DATA
02DATA04
Contributing to purpose-led digital Ethiopia Regulatory framework operationalizationEthio Telecom partnership on infrastructure Mobile money licenseTransforming lives Social Contract
03
Target date forcommercial launch
mid 2022 asrequired
by the licenseOnboarding local and international partners including network and IT Operating company fully operational
Job creationOngoing staff recruitment1,000 employees in year 1 including 150 graduates
02

The Numbers
13
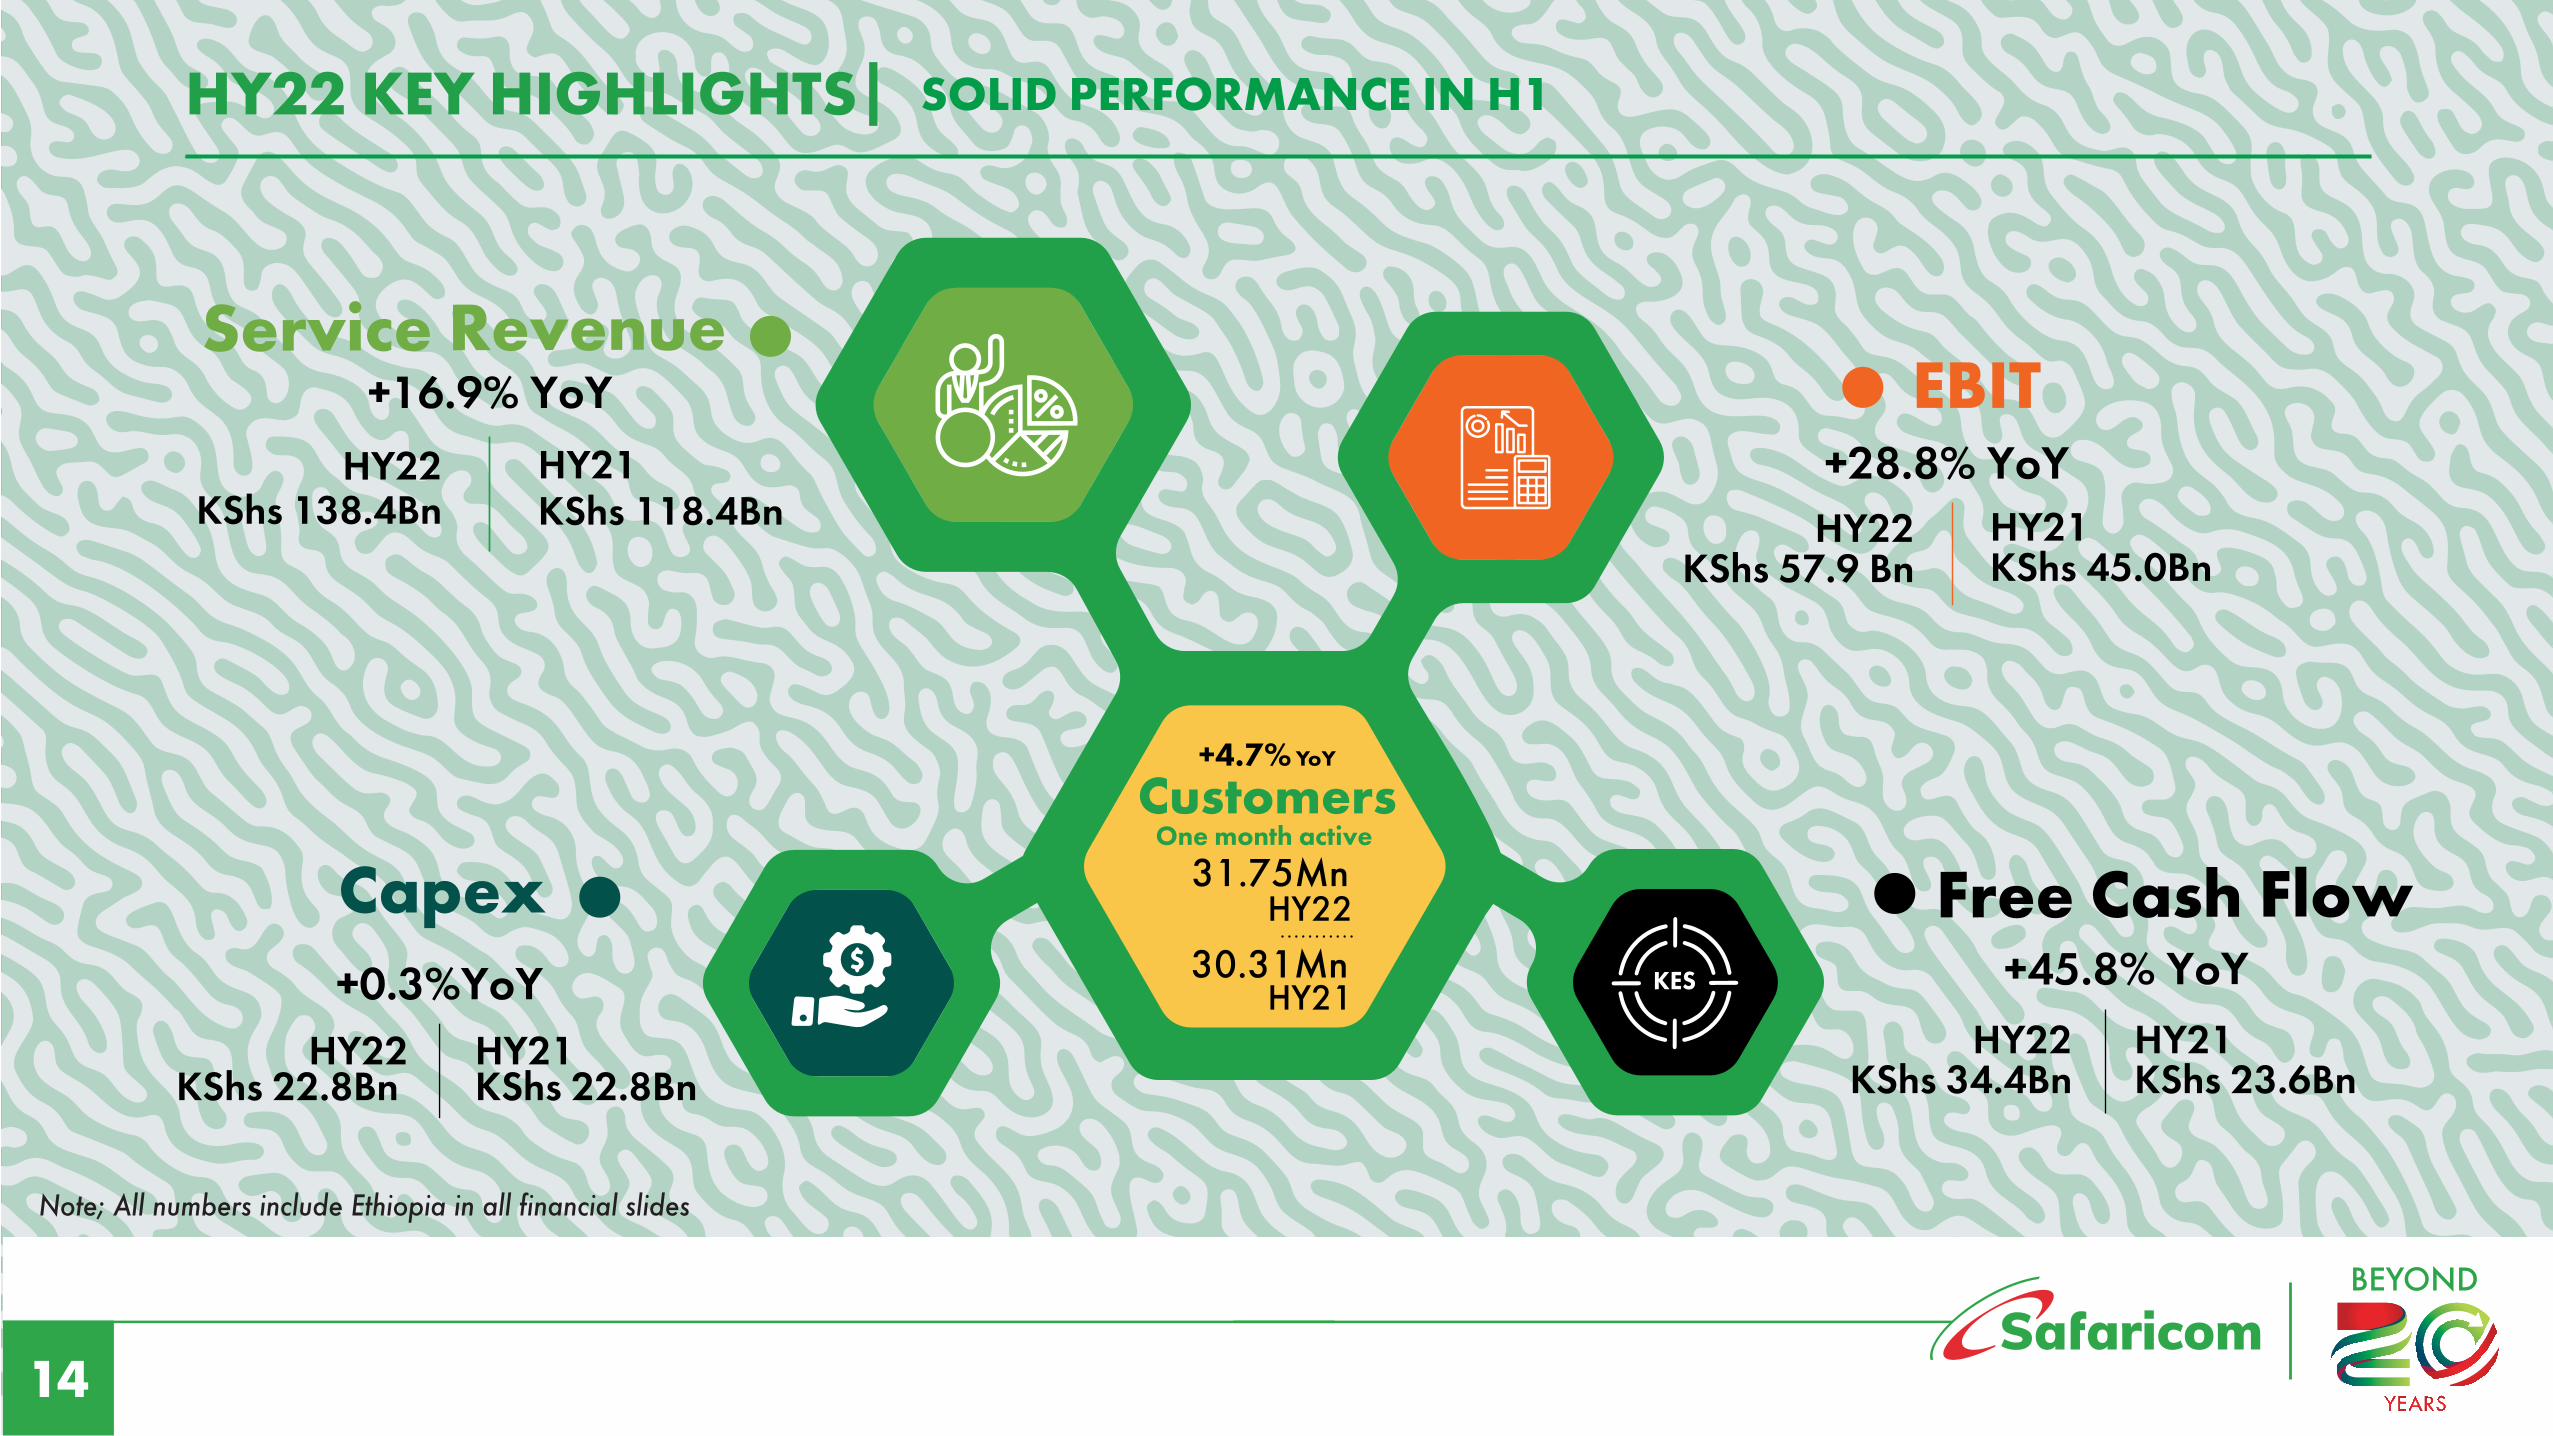
HY22 KEY HIGHLIGHTS SOLID PERFORMANCE IN H1 |
Service Revenue+16.9% YoY
HY22KShs 138.4Bn HY21
KShs 118.4Bn+28.8% YoY HY22
KShs 57.9 BnHY21KShs 45.0Bn
EBIT
Free Cash Flow+45.8% YoY
HY22KShs 34.4Bn
HY21 KShs 23.6Bn
Capex+0.3%YoY
HY22KShs 22.8Bn
HY21 KShs 22.8Bn
One month active
+4.7% YoY
Customers31.75Mn
HY22
30.31MnHY21
14
Note; All numbers include Ethiopia in all financial slides

SERVICE REVENUE DOUBLE DIGIT GROWTH, SUPPORTED BY M-PESA |
15
*Others - Incoming Voice & SMS revenue, Messaging and Other SR
+45.8%YoY
+6.3%YoY
+16.9%YoY
118.416.4 1.4 138.4
H1 FY21 H1 FY22M-PESA Mobile data
+20.1%YoY
0.6
FixedEnterprise
+23.0%YoY
0.4
FTTH
-0.2%YoY
(0.0)
Other*
+3.2%YoY
1.3
Voice Outgoing
Voice Revenue 43.0
40.2
3.2%-1.1%
-6.5%
41.5
H1 FY20 H1 FY21 H1 FY22 Voice Revenue (KShs Bn) % YoY
Service Revenue
H2 FY20 H1 FY21 H2 FY21 H1 FY22
Service Revenue (KShs Bn) % YoY
4.3%
-4.8%
4.0%
16.9%
126.9
118.4
131.9138.4
Contribution to Service Revenue Growth (KShs Bn) Evolution of Service Revenue Profile
Others13.1%
HY21
M-PESA30.3%
MobileData
18.8%
Voice Outgoing33.9%
FixedEnterprise
2.4%
FTTH1.4%
HY22
Others11.2%
M-PESA37.8%
MobileData
17.1%
Voice Outgoing29.9%
FixedEnterprise
2.5%
FTTH1.5%

M-PESA REGAINING MOMENTUM WITH RETURN TO CHARGING |
C2B +42.1% YoYB2C +48.5% YoYLNM +83.6% YoYB2B +24.2% YoY
Fuliza, M-ShwariKCB M-PESAM-KOPA, M-KESHOOther savings
International Money Transfer, Alipay
Contribution to Fintech Solutions Growth
Payments +50.7% YoY
Betting
Lending & Savings
IMT
14.3ppts
>100.0% YoY
+17.2%% YoY
+22.6% YoY
7.7ppts
4.1ppts
1.8ppts
0.6ppts
Contribution to M-PESA Growth
Withdrawals
Transfers
Fintech Solutions
+45.8 % YoY
16
Value of M-PESA transactions +51.5% YoY, KShs 13.7Trn, of which 18.1% is still zero-ratedVolume of M-PESA transactions +42.0% YoY, 7.3BnOne month active M-PESA Agents +19.7% YoY, 258kOne month active merchants tills +72.8% YoY, 387k
7.6ppts+18.8% YoY
14.3ppts+43.7% YoY
23.9ppts+89.5% YoY

M-PESA SUSTAINED VELOCITY IN THE CUSTOMER ECOSYSTEM |
17
Note; M-PESA Wallet to Bank/ Bank to M-PESA Wallet transactions still zero rated, accounting for 18.1% of HY22 total value of M-PESA transactions
H1 FY22H1 FY21 H2 FY21
9.0
13.0 13.7
Total M-PESA Value
H1 FY22H1 FY21 H2 FY21
1.6
2.0 2.1
Transfers
H1 FY22H1 FY21 H2 FY21
0.91.1 1.1
Withdrawals
H1 FY22H1 FY21 H2 FY21
2.5
3.94.3
Payments
Usage Growth, Opportunity to DrivePenetration Remains
H1 FY22
H2 FY21
H1 FY21
M-PESA one month active customers (Mn)Chargeable transactions per one month active customers
14.528.3
9.4
26.8
18.1
28.7
Sustained Growth in Value of M-PESA Transactions (KShs Trn)

DELIVERINGCONSUMER
VALUE
CREDIT
B2B
WEALTH
INSURANCE
BIG DATA
SAVINGSLOYALTY & CVM
E-COMMERCE
P2P
C2B
MINIAPPS
PARTNERSHIPS
M-PESA 2.0 FINTECHPLATFORM
CONSUMER SUPERAPP
CONSUMERFOCUS
3.9Mn App Customers
Target Addressable Market29.0Mn
Customer Focused Products,Intuitive Digital Journeys
BUSINESS SUPER APP
BUSINESS FOCUS
322k Business AppCustomers
258k Agents
Merchant Business Solutions,Extensive Agency Network
18
M-PESA | DEVELOPING SCALABLE DIGITAL PLATFORMS FOR KEY GROWTH AREAS
Subject to Regulatory approval
Target Addressable Market+5.0Mn

MOBILE DATA PRICE RATIONALIZATION SLOWS DOWN PERFORMANCE |
19
H1 FY21
Mobile data revenue (KShs Bn) Rate per MB (Cents)
H2 FY21 H1 FY22H1 FY21 H2 FY21 H1 FY22
30.3 31.531.7
+4.7% YoY
One month active customers (Mn)
15.716.7 17.0
+8.1% YoY
Distinct data bundle customers
(Mn)
Opportunity to Drive Usage and Growth RemainsMobile Data Revenue
9.9 10.811.5
+16.4% YoY
Data customers using >100MBs (Mn)
7.1 8.59.7
+37.3% YoY
Active 4G devices (Mn)
5.46.1
6.8+26.7% YoY
Data customers using >1GB (Mn)
22.222.6
1.3
1.5
12.2
23.6
2.0
10.0
13.7
Average GBs per user
Spurring usage and growth through:
Driving content aggregationLaunched Baze platform
Aggressivecustomer
acquistions
Enhanced CVMpropositions and
personalised offerings
Expanding the baseof device
financing customers
HY 22
Data ARPU
+7.9% YoY
KShs 198.3
GBs per chargeable
user+47.8% YoY
Rate per MB(cents)
-27.0% YoY
+6.3%YoY

FIXED SERVICE ACCELERATED CUSTOMER ACQUISITION DRIVES SOLID GROWTH |
20
Fixed Enterprise
*LTE customers 25.28k, +55.5% YoY making up 56.3% of total fixed data closing customers at 44.89k, +38.3% YoY **Fixed Enterprise ARPU ex-LTE KShs 23.32k, LTE ARPU 3.7k, Fixed Enterprise ARPU KShs 11.63k in HY22
FTTH
2,337 137.4 153.4
119.1
2,278
2,334
H1 FY21 H2 FY21 H1 FY22
H1 FY21 H2 FY21 H1 FY22
Closing Customers (’000s) ARPU (KShs) Conversion rate
32.438.9
44.9
11.715.6
12.8
*Closing Fixed Data Customers (’000s) **Fixed Enterprise ARPU (KShs ‘000s)
Contribution to Fixed Revenue Growth
FTTH 8.3ppts+22.9% YoYKShs 2.0 Bn
Other 4.0ppts+48.2% YoYKShs 0.6Bn
FTTB 8.8ppts+15.8% YoYKShs 2.9Bn+21.1% YoY
KShs 5.5Bn
63.9%53.5% 58.5%

NET INCOME IMPROVED PERFORMANCE DRIVEN BY TOP LINE RECOVERY & COST EFFICIENCIES |
21
H1 FY21Net income
33.1
OpexSavings
Share of Associate& JV loss
Taxation H1 FY22Net Income
ContributionMargin
2.316.2
(4.4)(0.3)
(2.7)
(6.0)
37.1
Finance cost
OpexCosts
(1.1)
Depreciation
EBIT Margin improved 3.3ppts
Service Revenue and EBIT (KShs Bn)
Service Revenue EBIT EBIT Margin
118.4
138.4
45.0
57.9
36.3%
H1 FY21 H1 FY22
39.6%

L
CAPEX SUSTAINED INVESTMENT TO ENHANCE CUSTOMER EXPERIENCE |
Radio Access 36.5%
Core Network 7.7%Other Network
Mobile 5.2%
Operations 1.7 %
HY22 Capex Split
IT Capex 33.5%
Fixed Network 6.5%
Transmission 8.9%
14.9%
13.8%
13.2%
14-16%
FY19 FY20 FY21 FY22
Capex Intensity
Capex Intensity
22.8
35.0
22.8
40-43*
FY18 FY19 FY20 FY21 FY22
H1 FY
17.4 17.0 18.1
36.337.3 36.1
Capex (KShs Bn)
22
HY22 Capex AllocationGrowth: 79.6% KShs 18.1BnMaintenance: 20.4% KShs 4.7Bn
*Capex guidance excluding Ethiopia

23
Outlook

REVISED FY22 GUIDANCE
Revised guidance (KShs)
SafaricomPLC Group
Including SafaricomEthiopia
Excluding SafaricomEthiopia
EBIT97-100Bn
CAPEX70-73Bn
EBIT107-110Bn
CAPEX40-43Bn
Initial Guidance FY22 (KShs)
Capex40 – 43Bn
EBIT105 – 108Bn
24

Thank You!25

Lorem ipsum
26