gwendolin porst phd 2009.pdf - tara - trinity college dublin
TRANSCRIPT
The Effects of Season, Habitat, Hydroperiod and Water Chemistry on the Distribution of Turlough Aquatic Invertebrate Communities
Gwendolin Porst M.Sc. (University of Bremen)
Thesis submitted in fulfilment for the degree of Doctor of Philosophy to the University of Dublin, Trinity College
2009


Declaration
I declare that this thesis is entirely my own work, except where otherwise stated, and
that it has not previously been submitted to this or any other university. I give my
permission to the library to lend or copy this thesis on request.
------------------------------------------------------- Gwendolin Porst


Summary
The aim of this study was to investigate the effects of season, habitat, hydroperiod and water
chemistry on the distribution of turlough aquatic invertebrate communities. Twenty-two
turloughs, selected as representative of geographical distribution and hydrological
conditions were included in the study. A comparative study of eight turloughs representing a
nutrient gradient determined macroinvertebrate community distinctiveness in a stratified
sampling design and related assemblage structures to environmental variables. Assessment
of macroinvertebrate temporal and spatial variation was the objective of separate studies
conducted in a subset of four turloughs, varying in hydrological and nutrient regimes. The
influence of disturbance and habitat characteristics on macroinvertebrate community
dynamics was tested. Across twenty-two turloughs macroinvertebrate and cladoceran
zooplankton communities were analysed and their relation to varying trophic, hydrological
and morphological regimes identified.
For a comparative study of macroinvertebrates eight turloughs were selected to represent a
gradient of total phosphorus (TP) concentrations. To allow comparability of turlough
macroinvertebrate communities, samples were collected from one habitat type (submerged
grassland) in April 2007 using a simple box sampler. Five replicates were collected in every
turlough by rapidly lowering the box to the substratum and removing trapped organisms
with a net. Community analysis identified highly distinct macroinvertebrate assemblages,
indicating that a single or pooled sample can provide a reliable description of turlough
macroinvertebrate communities. Hydroperiod influenced mean taxon richness and
abundance of macroinvertebrates but no correlation was found between nutrient status and
either mean taxon richness or abundance.
In order to study temporal dynamics of macroinvertebrates in turloughs, littoral faunal
samples were collected over a one to two year period in four turloughs with differing
hydrological and nutrient regimes. Sampling was carried out using a standardised sampling
approach. Five replicate samples were collected every month using a box sampler from the
dominant turlough habitat, submerged grassland. Macroinvertebrate biodiversity and
community structure varied monthly and interannually. A two-phased hydrocycle was
identified with permanent residents dominating during the start of the hydrocycle, with an
increase of ephemeral taxa over time. Disturbance, as demonstrated by short hydroperiod
and high areal reduction rate had an important effect on macroinvertebrate community
structure in turloughs, with high disturbance generally supporting lower faunal diversity.
Influence of disturbance generally decreased over time leading to a stabilization of
macroinvertebrate communities.
i
For the study of spatial variation of macroinvertebrates in turloughs two habitats were
sampled in two turloughs during sampling season 2006/2007 using a box sampler and five
replicates were collected in each habitat. Within-habitat variability was assessed by
collecting five replicate macroinvertebrate samples from four different submerged grassland
habitat sites in four turloughs in sampling season 2007/2008 using the box sampler. While
habitat specific preferences were found for some taxa of conservation concern variability of
macroinvertebrates within turloughs was nevertheless identified to be smaller than among
turloughs. Macroinvertebrate samples collected in any location of the dominant turlough
habitat (submerged grassland) were identified as reliable indicators of ecological change of
turloughs.
A comparative study of macroinvertebrates and cladoceran zooplankton communities was
conducted across twenty-two turloughs, representing a wide hydromorphological and
geographical range. Macroinvertebrate samples were collected in November 2006 and April
2007 using a stratified sampling approach. All available habitats in a turlough were sampled
proportional to their availability using sweeps with a standard FBA pond net. Three minute
sampling time was subdivided proportionally to each habitat’s availability. Cladoceran
zooplankton and separate chydorid samples were collected from twenty turloughs in April
2007 by horizontal hauls with a zooplankton net from the shore and a perspex tube,
respectively. Varying associations of macroinvertebrate as well as zooplankton communities
to environmental variables season, TP concentrations, number of habitats sampled and
hydroperiod of turloughs were detected. Some macroinvertebrate orders and zooplankton
species showed significant relationships with chemical descriptors of nutrient enrichment.
Turlough macroinvertebrate communities are highly distinct and conducive to time and
cost-effective monitoring. Collection of a single submerged grassland sample reduces
inherent ‘noise’ and is suited for the detection of pressure gradients. The number of habitats
sampled should, however, depend on the objective of the sampling. Sampling for more
holistic purposes should be carried out using a multi-habitat sampling approach to obtain a
more comprehensive survey of turlough biodiversity. Season had an important influence on
macroinvertebrate community structures. Turlough sampling regimes need a flexible
approach with timing and frequency of sampling depending on sampling protocol objectives
and should be geared towards the start of the flooding season and variable hydrocycles.
Turloughs are inherently variable systems which might negate the development of simple
type-specific reference conditions as required for lakes under the WFD.
ii

Acknowledgements
I would like to thank the following people for their support throughout the course of
this project:
I am very grateful to my supervisor Dr. Ken Irvine for his critical and constructive
advice, enthusiasm and support over the past few years.
Many thanks to the Irish National Parks & Wildlife Service (NPWS) for funding this
project as part of the multidisciplinary ‘Turlough Conservation Project’.
I would like to thank Dr. Norman Allott and Professor Jim Wilson for their
appreciated critical comments and suggestions during the annual research steering
meetings.
I am thankful to Helder Pereira with whom I conducted most of the field trips and
the analysis of water chemistry owing to shared needs and to Fabien Charrier, Owen
Naughton, Sinead O’Connor, Natacha Salles, Klaus Schwachhofer and Nova
Sharkey for practical support. I would like to thank the whole ‘Turlough
Conservation Project’ Team Dr. Norman Allot, Dr. Catherine Coxon, Laurence Gill,
Paul Johnston, Dr. Sarah Kimberley, Dr. Deirdre Lynn, Owen Naughton, Dr. Áine
O’Connor, Helder Pereira, Dr. Jim Ryan, Nova Sharkey and Dr. Steve Waldren for
their support and encouragement.
All the other members of the Freshwater Ecology Research Group – Ian Donohue,
Louise Donohue, Vesela Evtimova, Jorge Garcia Molinos, Tamara Jurca, Marjolein
Kamermans, Antón Lawlor, Valerie McCarthy, Elaine McGoff, Bláithín Ní Ainín,
John O’Brien, and Yesim Tunali for many exciting and inspiring discussions and
other postgraduates and staff in the Zoology Department for creating a very
welcoming and friendly working atmosphere.
I would furthermore like to thank Dr. Evelyn Moorkens, Professor Garth Foster and
Dr. Brian Nelson for the verification of macroinvertebrate and Dr. Ken Irvine for the
verification of zooplankton identifications.
iii

Many thanks go to the administrative and technical staff of the School of Natural
Sciences Alison Boyce, Richard Hollinshead, Mark Kavanagh, Dr. Martyn Linnie,
Fiona Moloney and Peter Stafford for advice and help whenever needed.
Mein herzlichster Dank geht an meine Familie für deren grenzenlose Liebe und
Unterstützung und ihren immerwährenden Glauben an mich...
...und Klaus - meinen Fels in der Brandung, für’s Lieben, Halten, Unterstützen, Da-
sein und einfach Du-sein.
iv

Table of Contents
SUMMARY i
ACKNOWLEDGEMENTS iii
TABLE OF CONTENTS v
LIST OF TABLES ix
LIST OF FIGURES xi
1 INTRODUCTION 1
1.1 General Research Aims 1
1.2 Thesis Outline 1
1.3 Turloughs 2
1.4 Legislation affecting Turloughs 6
1.5 Littoral Benthic Macroinvertebrates 7
1.6 Cladoceran Zooplankton 9
2 SITE SELECTION AND METHODOLOGY 11
2.1 Turlough Selection 11
2.2 Methodology 14
2.2.1 Water chemistry Sampling and Analysis 14
2.2.2 Invertebrate Sampling and Identification 17
2.2.3 Hydrological Parameters 18
3 DISTINCTIVENESS OF MACROINVERTEBRATE COMMUNITIES IN 19 TURLOUGHS (TEMPORARY PONDS) AND THEIR RESPONSE TO ENVIRONMENTAL VARIABLES
3.1 Abstract 19
3.2 Introduction 20
3.3 Methods 21
3.3.1 Site Selection 21
3.3.2 Macroinvertebrate Sampling 24
v

3.3.3 Water Chemistry Sampling 24
3.3.4 Statistical Analysis 24
3.4 Results 26
3.4.1 Abundance and Taxon Richness 26
3.4.2 Cluster Analysis 28
3.4.3 Non-Metric Multidimensional Scaling (MDS) 28
3.5 Discussion 33
3.5.1 Comparison of Macroinvertebrates among Turloughs 33
3.5.2 Macroinvertebrate Response to Environmental Variables 35
3.5.3 Temporal Effects 36
3.6 Conclusions 37
4 THE IMPORTANCE OF DISTURBANCE FOR SEASONAL AND 39 INTER-ANNUAL SUCCESSION OF MACROINVERTEBRATES IN TURLOUGHS
4.1 Introduction 39
4.2 Methods 41
4.2.1 Study Sites 41
4.2.2 Macroinvertebrate Sampling 42
4.2.3 Statistical Analysis 43
4.2.3.1 Temporal Variation in Invertebrate Taxon Richness 43
4.2.3.2 Temporal Variation in Invertebrate Community 44 Composition and Co-occurrence of Taxa
4.3 Results 45
4.3.1 Temporal Variation in Invertebrate Taxon Richness 45
4.3.2 Temporal Variation in Invertebrate Community 49 Composition and Co-occurrence of Taxa
4.4 Discussion 51
4.4.1 Invertebrate Succession in Turloughs 51
vi
4.4.2 Influence of Disturbance on Invertebrate Communities 55
4.5 Conclusions 57
5 SPATIAL VARIABILITY OF MACROINVERTEBRATES IN TURLOUGHS 63
5.1 Introduction 63
5.2 Methods 64
5.2.1 Study Sites and Macroinvertebrate Sampling 64
5.2.2 Statistical Analysis 67
5.3 Results 68
5.3.1 Between-Habitat Variability 68
5.3.2 Within-Habitat Variability 71
5.4 Discussion 79
5.4.1 Between-Habitat Variability 79
5.4.2 Within-Habitat Variability 80
5.5 Conclusions 82
6 MACROINVERTEBRATE AND CLADOCERAN ZOOPLANKTON COMMUNITIES 85 OF TURLOUGHS AND THEIR USEFULNESS AS BIOINDICATORS
6.1 Introduction 85
6.2 Material and Methods 87
6.2.1 Study Sites 87
6.2.2 Macroinvertebrate Sampling 89
6.2.3 Zooplankton and Chydorid Sampling 89
6.2.4 Statistical Analysis 90
6.2.4.1 Relating Macroinvertebrate, Zooplankton and 90 Chydorid Taxon Richness and Abundances to Environmental Variables
6.2.4.2 Relating Macroinvertebrate Taxonomic 91 Structure to Environmental Variables
6.3 Results 92
vii

6.3.1 Relating Macroinvertebrate, Zooplankton and 92 Chydorid Taxon Richness and Abundances to Environmental Variables
6.3.2 Relating Macroinvertebrate Taxonomic Structure 93 to Environmental Variables
6.3.3 Relating Zooplankton Taxonomic Structure to 104 Nutrient Enrichment
6.4 Discussion 105
6.4.1 Macroinvertebrate Community Composition 105 and its Relationship to Environmental Variables
6.4.1.1 Season 105
6.4.1.2 Nutrient Enrichment 106
6.4.1.3 Habitat 108
6.4.1.4 Hydroperiod 109
6.4.2 Zooplankton Community Structure and its 110 Relationship to Environmental Variables
6.5 Conclusions 113
7 DISCUSSION 115
7.1 Research Aims 115
7.2 Importance of Season, Habitat, Nutrients and 115 Hydroperiod for Turlough Invertebrate Distinctiveness and Community Structures and Implications for Monitoring
7.2.1 Season 115
7.2.2 Habitat 117
7.2.3 Nutrients 118
7.2.4 Hydroperiod 120
7.2.5 Macroinvertebrate Distinctiveness 122
7.3 Conclusions 123
8 REFERENCES 127
viii
List of Tables
2.1 List of twenty-two turloughs studied their ID, location, reference 12 to source of hydrological information used for selection and information of karstic flow system.
3.1 Summary of turloughs, their location and concentrations of key water 22 chemistry variables and hydroperiod.
3.2 Pooled species abundances of macroinvertebrates found in eight 30 turloughs.
3.3 Mean abundance of macroinvertebrate orders (± s.e.) found in samples 32 of eight turloughs.
4.1 Sampling sites, their nutrient status, areal reduction rates and 42 hydroperiod of two sampling seasons 2006/07 and 2007/08 of the four turloughs studied.
4.2 Sampling dates of turloughs studied over 2 years. 43
4.3 Results of repeated measures ANOVA testing for effects of time on 46 taxon richness for the whole community and different life-cycle groups in turloughs for consecutive sampling months December 07 – April 08.
4.4 Results of PERMANOVA testing for the effect of time on community 49 structure for the whole community and different life-cycle groups in turloughs for consecutive sampling months December 07 – April 08.
4.5 Summary of co-occurrence (ECOSIM) analysis of taxa over time in the 50 studied turloughs for sampling season 2007/2008.
4.6 Summary results from SIMPER analysis showing cumulative 59 contribution (Cum%) of three most important contributing taxa to sample dissimilarities in %.
5.1 Sampling sites, their nutrient status, hydrological regimes and 65 hydroperiod of two sampling seasons 2006/07 and 2007/08 of the four turloughs studied.
5.2 Summary statistics of total taxa recovered from each habitat 68 (s.g.=submerged grass; e.g.=emergent grass) in two turloughs, minimum, maximum and average taxon richness recovered from a single sample and coefficient of variation (C.V.) of taxon richness.
5.3 Summary results from SIMPER analysis showing cumulative 70 contribution (Cum%) of contributing taxa to habitat dissimilarities (in %).
5.4 Summary statistics of total, minimum, maximum and average 71 taxon richness found in four grassland sites in four.
ix

5.5 One-way ANOVA results examining the differences in taxon richness 71 among sites in the four turloughs.
6.1 List of turloughs studied, their ID, TP concentrations per sampling 87 month, number of habitats sampled in each sampling month and respective hydroperiods.
6.2 Spearman rank-order correlations of macroinvertebrate orders 93 significantly correlated with environmental variables TP, hydroperiod and number of habitats sampled in a) November 2006 and b) April 2007.
6.3 Summary results from SIMPER analysis cumulative contribution 95 (Cum%) of macroinvertebrate taxa to sample similarities (in %) (cut-off level 90% similarity).
6.4 Summary results from SIMPER analysis at individual turlough 96 level showing cumulative contribution (Cum%) of macroinvertebrate taxa to sample dissimilarities (in %)(first ten contributing taxa).
6.5 Summary statistics of CCA ordination on macroinvertebrate log(x+1) 102 abundances data, using automatic forward selection of four environmental variables.
6.6 Summary of automatic forward selection in CCA ordination 102 using log(x+1) transformed macroinvertebrate abundance data and four environmental variables.
6.7 Summary of cladoceran zooplankton taxa found in 20 turloughs in 104 April 2007 combining records from open water zooplankton and chydorid sampling protocols.
x
List of Figures
1.1 Garryland Turlough July 2006 and November 2006. 5
2.1 Map of Ireland showing the location of twenty-two turloughs 13 selected for study.
3.1 Map of the sampling region showing the eight turloughs studied. 23
3.2 Mean abundance of macroinvertebrates recorded per turlough. 27
3.3 Mean number of macroinvertebrate taxa recorded per turlough. 27
3.4 Hierarchical cluster analysis dendogram of macroinvertebrate 29 species log(x+1) transformed total abundance data of eight turloughs.
3.5 MDS plot of macroinvertebrate species log(x+1) transformed total 29 abundance data of eight turloughs, overlaid with similarity levels from Cluster Analysis.
4.1 Map of Ireland showing the location of the four turloughs studied. 42
4.2 a) Seasonal variation of average number of macroinvertebrate taxa 46 recorded per turlough. b) Seasonal average taxon richness during sampling season 2007/2008 46 per turlough.
4.3 Temporal changes in the taxon richness of permanent and ephemeral 47 residents in four turloughs.
4.4 a) Seasonal variation of coefficient of variation of taxon richness 48 b) Seasonal average coefficient of variation of taxon richness during sampling season 2007/2008 per turlough
4.5 Multidimensional scaling (MDS) ordinations of macroinvertebrate 54 communities over two successive sampling periods in four turloughs.
5.1 Map of Ireland showing the location of the six turloughs studied. 66
5.2 a) Hierarchical cluster analysis dendogram and b) MDS plot of 69 macroinvertebrate species log(x+1) transformed total abundance data from submerged (s.g.) and emergent grassland habitat (e.g.) in Brierfield and Lisduff.
5.3 Coefficient of variation (C.V.) of replicate samples per site 72 per turlough and average C.V. per turlough ± s.e.
xi
5.4 a) Hierarchical cluster analysis dendogram and b) MDS plot of 74 macroinvertebrate species log(x+1) transformed total abundance data from Blackrock sampled in April 2008.
5.5 a) Hierarchical cluster analysis dendogram and b) MDS plot of 75 macroinvertebrate species log(x+1) transformed total abundance data from Caranavoodaun sampled in May 2008.
5.6 a) Hierarchical cluster analysis dendogram and b) MDS plot of 76 macroinvertebrate species log(x+1) transformed total abundance data from Roo West sampled in April 2008.
5.7 a) Hierarchical cluster analysis dendogram and b) MDS plot of 77 macroinvertebrate species log(x+1) transformed total abundance data from Termon sampled in April 2008.
5.8 a) Hierarchical cluster analysis dendogram and b) MDS plot of 78 macroinvertebrate species log(x+1) transformed total abundance data from Termon sampled in June 2008.
5.9 MDS plot of macroinvertebrate species log(x+1) transformed 79 abundance data of 4 turloughs sampled in April 2008 till June 2008.
6.1 Map of Ireland showing the location of twenty-two turloughs studied. 88
6.2 a) Hierarchical cluster analysis dendogram of macroinvertebrate 100 species log(x+1) transformed total abundance data of 22 turloughs sampled in November 2006 and b) 20 turloughs sampled in April 2007.
6.3 MDS plot of macroinvertebrate species log(x+1) transformed total 101 abundance data collected in November 2006 and April 2007.
6.4 Axes 1 and 2 of the CCA ordination generated using automatic 103 forward selection of four environmental variables and log(x+1) transformed macroinvertebrates abundances data.
7.1 Conceptual model of the turlough aquatic invertebrate community, 125 summarizing major findings of this study.
xii
1 Introduction
1.1 General Research Aims
The overall aim of this study was to investigate the effects of season, habitat,
hydroperiod and water chemistry on the distribution of turlough aquatic invertebrate
communities. This included comparative studies of the macroinvertebrate and
cladoceran zooplankton communities across twenty-two turloughs, representing a
wide hydromorphological and geographical range. It was investigated how
differences in hydrological, geomorphological and trophic regimes would affect
turlough invertebrate biodiversity and community structure. Macroinvertebrate
communities of eight turloughs selected to represent a gradient of total phosphorus
were studied using a stratified sampling approach and their relation to environmental
variables was investigated. Separate studies examined the spatial and temporal
variability of macroinvertebrate communities in a subset of turloughs with varying
hydrological and nutrient regimes, testing the influence of different disturbance
regimes and habitat characteristics on community dynamics.
This project was part of the broader Turlough Conservation Project ‘Assessing the
Conservation Status of Turloughs’ (Turlough Conservation Project:
http://www.tcd.ie/Botany/turlough_conservation/). This multidisciplinary project
included four PhD projects and two Post-doctoral subprojects, focussing on a range
of interconnected aspects of the turlough habitat: Hydrology, algae and
hydrochemistry, vegetation, soils, aquatic invertebrate communities, and catchment-
scale and within-site management.
1.2 Thesis Outline
This thesis comprises seven chapters, starting with a general introduction and a
methods section, followed by four data chapters and concludes with a general
discussion and final conclusions. The introduction presents a summary of
background information on turloughs, relevant legislation and aquatic invertebrates.
The turlough site selection procedure and a summary of general methods used in the
subsequent data chapters are outlined in Chapter two. A comparative study of eight
turloughs determines the distinctiveness of macroinvertebrate communities and
investigates their relationship to selected environmental variables in Chapter three.
1

This is followed by a more detailed study on the temporal patterns of
macroinvertebrate communities in turloughs investigating the importance of
disturbance on successional processes of macroinvertebrates. Chapter five explores
the among- and within-habitat variability of littoral macroinvertebrate communities
and tests the usefulness of a single grassland habitat sample collected in any location
of a turlough for monitoring purposes. Chapter six assesses macroinvertebrate and
cladoceran zooplankton community structures across a range of turloughs and
investigates the effect of differing hydrological, morphological and trophic regimens
on the faunal communities. The final chapter discusses the overall findings of the
research and draws conclusions for monitoring and conservation of turloughs and
their invertebrate communities.
1.3 Turloughs
Temporary wetlands are common throughout the world (Studinski and Grubbs,
2007; Williams, 2006). However, some temporary wetland types such as turloughs
(temporary filling carboniferous limestone ponds or lakes) are restricted
geographically owing to climate and geology (Reynolds et al., 2004). Turloughs are
most abundant and found in their greatest variety throughout the Western third of
Ireland, a region characterized by frequent rainfall and karstified carboniferous
limestone (Sheehy Skeffington et al., 2006). Particularly the karstic limestone
regions of south County Galway, north County Clare, County Mayo, including the
Burren region, and County Roscommon where thin or no glacial drift cover is found,
harbour a large number of turloughs (Ní-Bhriain et al., 2003; Ní-Bhriain et al.,
2002; Reynolds, 1982; Sheehy Skeffington et al., 2006). More isolated turloughs
occur in Counties Cork, Donegal, Fermanagh, Kilkenny, Leitrim, Limerick,
Longford, Monaghan, Sligo, Tipperary and Westmeath (Goodwillie, 2003;
Reynolds, 1982, 1996; Sheehy Skeffington et al., 2006). Turlough-like water bodies
have also been described in Wales at Pant-y-llyn (Blackstock et al., 1993), in
Catalonia (Boix et al., 2001), in Slovenia and eastern Canada (Coté et al., 1990),
although these differ from turloughs in terms of seasonality, hydrology, size or
geomorphology (Coxon, 1986).
Carboniferous limestone differs from many other rock types owing to its solubility
by rainwater. It can hold large volumes of water hidden in cracks and cavities or
2
leading them underground through channels either to a spring or into the sea
(Goodwillie and Reynolds, 2003). In most rock types, groundwater flows very
slowly (from just a few centimetres to a few meters per day), but in karstified
limestone the flow rate can be, in some cases, up to 100 metres per hour or more
(Coxon and Drew, 1986; Drew, 1990). When the underground water, which is
carrying dissolved limestone as calcium bicarbonate comes in contact with air, CO2
is released, leading to the deposition of marl or calcite in the basin (Goodwillie et
al., 2003). As a result turloughs typically have high alkalinities and high pH
(Goodwillie, 2003).
Turloughs are not true lakes, even though they support an aquatic fauna, as they
reveal a variety of wet grassland and fen type vegetation when drying up in summer
(Sheehy Skeffington et al., 2006). They usually fill and empty through underground
passages and estavelles (sinkholes that also act as a spring) with some turloughs
obtaining their major water input from inflowing streams or rivers (Coxon, 1986;
Goodwillie, 1992; Goodwillie et al., 2003). Although not strictly seasonal, turloughs
generally flood in response to variations in the local water table in autumn and
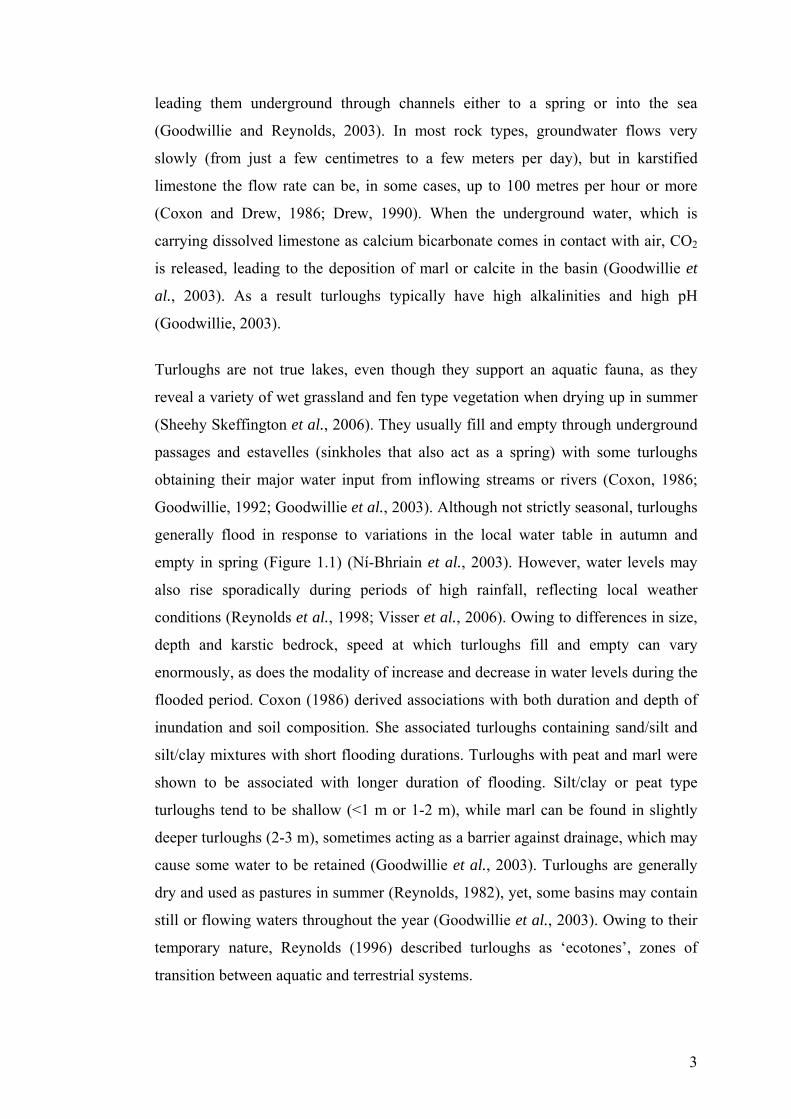
empty in spring (Figure 1.1) (Ní-Bhriain et al., 2003). However, water levels may
also rise sporadically during periods of high rainfall, reflecting local weather
conditions (Reynolds et al., 1998; Visser et al., 2006). Owing to differences in size,
depth and karstic bedrock, speed at which turloughs fill and empty can vary
enormously, as does the modality of increase and decrease in water levels during the
flooded period. Coxon (1986) derived associations with both duration and depth of
inundation and soil composition. She associated turloughs containing sand/silt and
silt/clay mixtures with short flooding durations. Turloughs with peat and marl were
shown to be associated with longer duration of flooding. Silt/clay or peat type
turloughs tend to be shallow (<1 m or 1-2 m), while marl can be found in slightly
deeper turloughs (2-3 m), sometimes acting as a barrier against drainage, which may
cause some water to be retained (Goodwillie et al., 2003). Turloughs are generally
dry and used as pastures in summer (Reynolds, 1982), yet, some basins may contain
still or flowing waters throughout the year (Goodwillie et al., 2003). Owing to their
temporary nature, Reynolds (1996) described turloughs as ‘ecotones’, zones of
transition between aquatic and terrestrial systems.
3

Turloughs are variable in size, extending from a few hundred square metres to
several square kilometres (Coxon, 1987b). To date over 300 active turloughs have
been documented and the size of about 100 is known (Sheehy Skeffington et al.,
2006) most of which are smaller than 10 ha. The distribution and extent of turloughs
are remnants of a vast complex of turloughs and other wetlands that have been
drained during successive waves of state- and EU-funded arterial drainage works
mainly to increase agricultural land (Visser et al., 2007). Following drainage
schemes from the 19th century to the present, only one turlough larger than 200 ha
remains (Rahasane in Co. Galway; approximately 260 ha). In a study on 90
turloughs over 10 ha in size Coxon (1986, 1987a) identified one third as irreversibly
damaged by drainage. The land in which turloughs are located is often owned as
‘commonage’ by numerous landowners and frequently used as pastures for cattle,
sheep and even horses or domestic geese (Sheehy Skeffington et al., 2006). The
intensification of grazing practices and the introduction of agriculture of greater
intensity also cause a major threat to the turlough environment, by potentially
increasing nutrient inputs (manure or fertilizer) to the system (Goodwillie, 2001; Ní-
Bhriain et al., 2003; Ní-Bhriain et al., 2002).
4
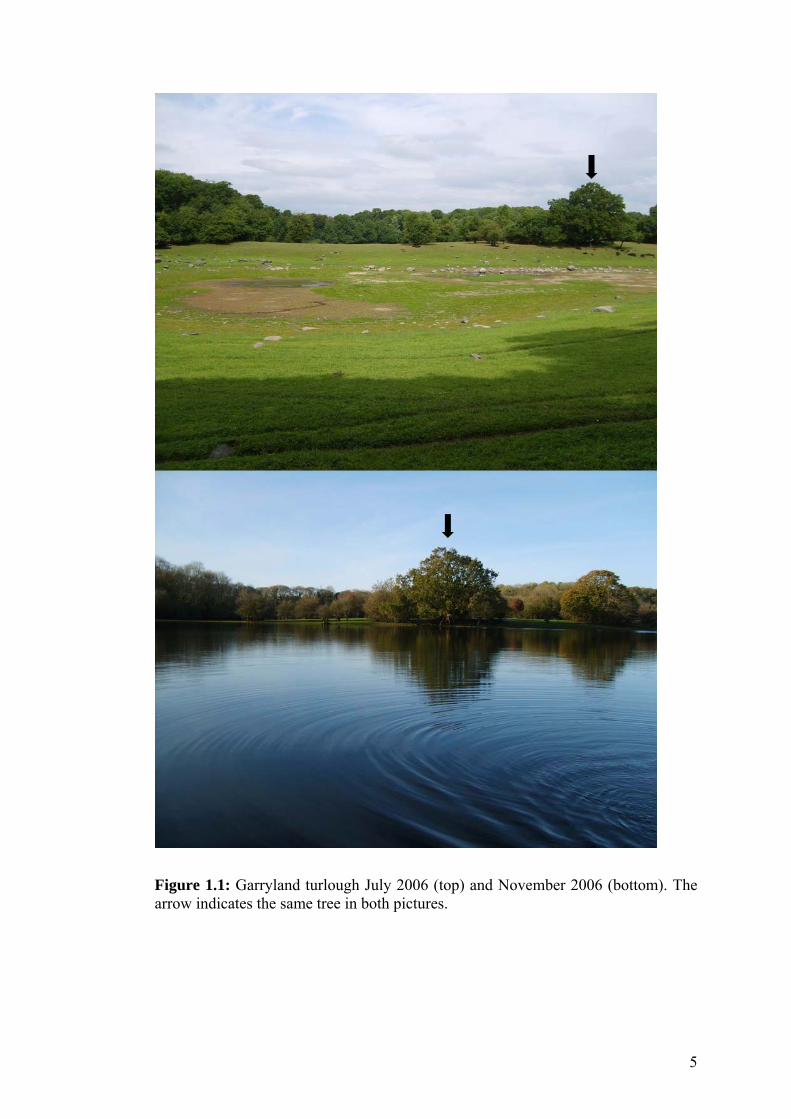
Figure 1.1: Garryland turlough July 2006 (top) and November 2006 (bottom). The arrow indicates the same tree in both pictures.
5

1.4 Legislation affecting Turloughs
Turloughs are classified as priority habitats under the European Habitats Directive
(92/43/EEC) (EEC, 1992) and many are candidate Special Areas of Conservation
(cSACs). A priority habitat is classified as a natural habitat that is in danger of
disappearing. The purpose of the directive is to ‘maintain or restore at a favourable
conservation status, natural habitats and species of wild fauna and flora of
Community interest’ by designation of Special Areas of Conservation (SACs). To
allow this, relevant landowners have been issued with a list of ‘notifiable actions’,
which restricts certain activities to be carried out within the ‘buffer area’,
comprising 50 m from the level of high water of a turlough, without prior ministerial
consent. There are seventeen main ‘notifiable actions’ for turloughs, ten of which
are related to agriculture such as grazing above a ‘sustainable level’ (according to
definition in farm plans) or fertilizer application of any type within the buffer zone
(Goodwillie, 2001; Ní-Bhriain et al., 2003). In Ireland, owners of land formally
designated as SACs are bound to manage these areas according to management
plans drawn up by the Irish National Parks and Wildlife Services or alternatively
adopt a Rural Environmental Protection Scheme (REPS) plan (Ní-Bhriain et al.,
2003). Under Article 17 Member States are required to report on the implementation
of the Habitats Directive including conservation status, at time intervals of six years.
Currently, in the Republic of Ireland, seventy-one turloughs are included in forty-
three candidate SACs, of which eight are identified as Special Protection Areas
(SPA) under the Birds Directive (EEC, 1979) and one is a Nature Reserve (Sheehy
Skeffington et al., 2006; Working Group on Groundwater, 2004). Additional
turloughs are likely to be designated as Natural Heritage Areas under the Wildlife
(Amendment) Act, 2000.
The Water Framework Directive (2000/60/EC) (WFD) was established in response
to increasing anthropogenic pressures on aquatic systems in the European Union
(EC, 2000). It establishes a comprehensive basis for the management of water
resources in Europe and rationalises and updates several pre-existing Directives in
the area of water policy. The WFD encompasses all inland flowing and standing
surface waters, transitional waters, coastal waters and groundwaters and stipulates
the need for an integrated strategy to protect and manage river basins, thus including
6
turloughs within an appropriate ‘river basin district’ (EC, 2000). For the purpose of
the WFD, turloughs are classified as Groundwater Dependent Terrestrial
Ecosystems (GWDTE) as their aquatic phase is not permanent. They represent an
extreme case of this category as they are connected directly to the groundwater table
(Kilroy et al., 2005; Working Group on Groundwater, 2004). The Directive requires
the establishment of a typology for all surface water bodies (‘ecotypes’) and the
definition of respective reference conditions, but the requirements for GWDTE are
presently unclear. The WFD demands that European member states achieve at least
‘good ecological status’ for all European water bodies through ‘programmes of
measures’ by 2015 and has initiated changes of water quality concepts and
assessment (Solimini et al., 2006). Annex five of the directive explicitly requires
that biological variables are considered as indicators of water quality, thus, including
the ‘composition and abundance of benthic invertebrate fauna’ for all surface water
systems. In order to obtain ‘good ecological status’ under the WFD, turloughs must
meet their Habitats Directive objective of ‘favourable conservation status’ where it
is dependent on their water needs.
1.5 Littoral Benthic Macroinvertebrates
The littoral zone of freshwater systems is the part of the benthos and its overlying
water which falls between the shore and the deepest point at which sufficient light
for photosynthesis for plants or algae can penetrate, representing the extent of the
euphotic zone (Moss, 1998; Wetzel, 2001). The littoral zone can play an important
part in the energy budget of lentic ecosystems and whole-lake functioning
(Blumenshine et al., 1997; Vadeboncoeur et al., 2002). In shallow lakes, which
include most turloughs, the littoral zone can be extensive, increasing its influence on
within-lake processes compared with deeper, stratified lakes. It generally supports
diverse biotic communities owing to inter alia high habitat heterogeneity, good
light, food and oxygen conditions (Brodersen et al., 1998).
Littoral benthic macroinvertebrates inhabit the bottom substrates of littoral
freshwater habitats for at least part of their lifecycles (Rosenberg and Resh, 1993a).
They range in size from only a few millimetres to several centimetres, but are
generally visible by the naked eye. Macroinvertebrates are commonly defined as the
part of the faunal community which can be retained by mesh sizes of ≥200-500 µm,
7
comprising a variety of taxa, including insects, annelids, molluscs, flatworms and
crustaceans. They play an essential role in key ecological processes in the littoral
zone by forming an important link between primary producers, detrital deposits and
higher trophic levels in aquatic food webs (Stoffels et al., 2005; Vadeboncoeur et
al., 2002; Blumenshine et al., 1997). Macroinvertebrates can occupy a variety of
substrates ranging from fine to coarse sediments, submerged and emergent
vegetation, debris, filamentous algae to various other natural or artificial habitats
(Rosenberg and Resh, 1993b). Not only habitat is important for distribution patterns
of macroinvertebrates (Hinden et al., 2005; Stoffels et al., 2005; Tolonen et al.,
2001; White and Irvine, 2003). Habitat stability and macroinvertebrate adaptations
to droughts, floods or other disturbances have been described to fundamentally
influence macroinvertebrate community structures of temporary freshwater habitats
(Collinson et al., 1995; Schneider and Frost, 1996; Wiggins, 1980; Williams, 2006).
Proximity of habitats for oviposition (Brooks and Lewington, 1997), nutrient trophic
state (Brauns et al., 2007; Brodersen et al., 1998; Rader and Richardson, 1994) and
seasonal variation in life-cycles, macroinvertebrate succession and seasonal influx of
aerial colonizers (Boix et al., 2004; Brooks, 2000; Cayrou and Céréghino, 2005;
Jocqué et al., 2007) among other variables also contribute significantly to ecological
processes and dynamics in macroinvertebrate communities.
Benthic macroinvertebrates are most frequently recommended as monitoring tools
for the assessment of water quality in rivers (Hellawell, 1986). Although chemical
and physical measurements are also used to define the ecological status of surface
waters, these variables only reflect conditions encountered at time of sampling (Resh
et al., 1996). In contrast, biotic elements such as littoral macroinvertebrates
represent past and present conditions of water and ecological quality. Their
sedentary nature, rather long life histories, diversity, sensitivity to changes in their
environment and ubiquitous distribution allows for efficient spatial analysis of
pollutants or other anthropogenic influences and disturbance effects (Abel, 1996;
Rosenberg et al., 1993a). The occurrence of relatively large numbers of invertebrate
species offers a wide spectrum of response to different kind of stress (Hellawell,
1986). While responses of macroinvertebrates to various stressors including nutrient
pressures have been studied in less complex habitats of the lake profundal
(Brodersen and Lindegaard, 1999; Langdon et al., 2006), research on littoral
8

macroinvertebrate communities experienced increased research in lakes only in
recent years (e.g Brauns et al., 2007; Pinel-Alloul et al., 1996; Tolonen et al., 2001).
However, studies on the dynamics and ecology of littoral macroinvertebrates in
turloughs are comparatively scarce.
The European Water Framework Directive (WFD) requires assessment of ecological
quality of all standing waters (including turloughs), and specifically the inclusion of
biotic elements, such as macroinvertebrates, in the assessment and monitoring of
lake/turlough ecological status. This, however, requires the prior knowledge of basic
community dynamics and ecology, including temporal and spatial variability of
macroinvertebrates and response of communities and taxonomic structures to single
or multiple stressors.
1.6 Cladoceran Zooplankton
The term ‘zooplankton’ usually refers to small animals that inhabit the open-water.
However, the cladoceran zooplankton also includes the group of Chydoridae
(Anomopoda), which are primarily littoral dwellers. Zooplankton are common
inhabitants of shallow lakes and ponds. They act as primary consumers of
phytoplankton and serve as food source for invertebrate and vertebrate predators,
thus representing an important part of lentic freshwater food webs (Irvine et al.,
2001a; Mckee et al., 2002). Most cladoceran zooplankton possess a carapace
covering the body and include herbivorous types such as Daphnia or Bosmina and
carnivores such as Polyphemus, preying on small zooplankton. Grazing by
zooplankton can regulate phytoplankton growth (Sterner, 1989) and might stabilize
plant communities by improving light conditions through the removal of periphyton
(Mckee et al., 2002). The majority of the Chydoridae are detritus feeders and
associations with distinct habitats have been found (de Eyto et al., 2003).
Changes in water quality can have an effect on zooplankton communities, either
through direct physiological or indirectly through food web processes. Nutrient
enrichment, which is one of the major threats to ecological quality of freshwater
systems in Ireland, affects zooplankton mainly through greater primary productivity
and, thus, enhanced secondary production. Eutrophication and associated high
concentrations of filamentous phytoplankton can, furthermore, cause a shift from
9

large-bodied to smaller bodied species of zooplankton (Moss et al., 1991). Certain
chydorid taxa and assemblages have been described as useful indicators of
ecological quality of lakes, including turloughs (Duigan and Kovach, 1991; de Eyto
et al., 2002; de Eyto et al., 2003; Duigan and Kovach, 1994). Furthermore, chydorid
taxon richness has a potential for the assessment of water quality (Irvine et al.,
2001a). Increased nutrient input to lakes may result in higher chydorid species
diversity through greater nutrient availability. This, however, may result in a
subsequent decrease of diversity with increasing eutrophication associated with a
switch from plant to phytoplankton dominated habitats, and thus a change in habitat
and food availability (de Eyto and Irvine, 2001). This may lead to monospecific
chydorid communities of species which can cope with both littoral as well as pelagic
food sources (Duigan and Murray, 1987a).
With the aim to fulfil the requirement of the EC Habitats Directive and the WFD of
achieving ‘favourable conservation status’ and ‘good ecological status’,
respectively, understanding the ecology and relation of different biotic groups to
multiple stress factors is indispensable. While zooplankton are not referred to in the
WFD, their identified response to different stressors in lentic freshwater
environments suggests them as useful surrogates for determining ecological change
of turloughs.
10
2 Site Selection and Methodology
2.1 Turlough Selection
In Ireland, turloughs occur most frequently in areas where the extensive
carboniferous limestone has only thin or no deposits of glacial till (Coxon, 1987b).
Highest densities of turloughs can be found in Counties Clare, Galway, Mayo and
Roscommon. Over 300 active turloughs are known and combined hydrological and
ecological information, of varying forms and standards, is available for
approximately 60 of them (Coxon, 1986; Goodwillie, 1992; Southern Water Global,
1998; Tynan et al., 2005). Twenty-two turloughs were selected for study on the
basis of existing hydrological data founded on the hypothesis by Mitsch and
Gosselink (2000) that hydrology is the key determinant for the establishment and
maintenance of wetland processes. The site selection process was driven by the
Project Management and Steering Committee of the broader project ‘Assessing the
Conservation Status of Turloughs’ (Turlough Conservation Project:
http://www.tcd.ie/Botany/turlough_conservation/). The twenty-two turloughs were
selected in order to represent the hydromorphological and geographical range of
turloughs in Ireland (Table 2.1 & Figure 2.1).
Selection of turloughs was based, as far as respective information was available, on
the Karstic Flow System hypothesis which suggests that turloughs associated with
specific types of karstic flow system (e.g. shallow epikarst, conduit) are associated
with specific ecological conditions (Drew, 1990; Southern Water Global, 1998;
Tynan et al., 2005). The concept of turlough hydrology is currently subject to
change. Where a preliminary classification of karstic flow system was unavailable,
selection was based on surrogate hydrological data from Coxon (1986) and other
data sources given in Table 2.1. The criteria included information on the mosses
Cinclidotus fontinaloides and Fontinalis antipyretica as a surrogate for duration of
flooding of turloughs and on height of C. fontinaloides as a measure of depth of
flooding of turloughs. Information on groundwater tracing data, deposits and
swallow holes was considered as secondary data in the selection process. Access to
turloughs was clarified with landowners prior to the start of the project and the
finalisation of the site selection. With the exception of Brierfield, Carrowreagh and
11

12
Rathnalluleagh, all selected turloughs are designated as candidate Special Areas of
Conservation (cSAC) under the EC Habitats Directive (92/43/EEC) (EEC, 1992).
Table 2.1: List of twenty-two turloughs studied, their ID, location, reference to source of hydrological information used for selection and information of karstic flow system.
Turlough ID County Hydrological Data Source
Postulated Karstic Flow System
Ardkill 1 Mayo Coxon (1986), Drew (pers. comm.)
N/A
Ballindereen 2 Galway Coxon (1986) N/A
Blackrock 3 Galway Tynan et al. (2005) Conduit
Brierfield 4 Roscommon Coxon (1986), Drew (pers. comm.)
N/A
Caherglassaun 5 Galway Tynan et al. (2005) Conduit
Caranavoodaun 6 Galway Southern Water Global (1998), Tynan et al. (2005)
Shallow epikarst
Carrowreagh 7 Roscommon Coxon (1986), Drew (pers. comm.)
N/A
Coolcam 8 Galway/ Roscommon
Coxon (1986), Drew (pers. comm.)
N/A
Croaghill 9 Galway Coxon (1986), David Drew (pers. comm.)
N/A
Garryland 10 Galway Southern Water Global (1998) Conduit
Kilglassan 11 Mayo Coxon (1986), Drew (pers. comm.)
N/A
Knockaunroe 12 Clare Drew (1990) Shallow epikarst
Lisduff 13 Roscommon Coxon (1986), David Drew (pers. comm.)
N/A
Lough Aleenaun 14 Clare Southern Water Global (1998), Drew (pers. comm.)
Shallow epikarst
Lough Coy 15 Galway Southern Water Global (1998), Tynan et al. (2005)
Conduit
Lough Gealain 16 Clare Drew (pers. comm.) Shallow epikarst
Rathnalulleagh 17 Roscommon Coxon (1986), Drew (pers. comm.)
N/A
Roo West 18 Galway/Clare Tynan et al. (2005) Shallow epikarst
Skealoghan 19 Mayo Coxon (1986), Drew (pers. comm.), Moran (2000)
N/A
Termon 20 Galway/Clare Southern Water Global (1998) Shallow epikarst
Tullynafrankagh 21 Galway Southern Water Global (1998), Tynan et al. (2005)
Shallow epikarst
Turloughmore 22 Clare Coxon (1986) N/A

13
Figure 2.1: Map of Ireland showing the location of twenty-two turloughs selected for study (numbers refer to turlough IDs as indicated in Table 2.1).
!
!!
!
!
!
!
!
!!
!!!
!
!
!
!!
!
!
!
!
Co. Galway
Co. Mayo
Co. Clare
Co. Roscommon
Co. Tipperary North
1
3
4
5
26
78
9
10
11
12
13
14
15
21
22
16
17
18
19
20!
!!
!
!
!
!
!
!!
!!!
!
!
!
!!
!
!
!
!
Co. Galway
Co. Mayo
Co. Clare
Co. Roscommon
Co. Tipperary North
1
3
4
5
26
78
9
10
11
12
13
14
15
21
22
16
17
18
19
20!
!!
!
!
!
!
!
!!
!!!
!
!
!
!!
!
!
!
!
Co. Galway
Co. Mayo
Co. Clare
Co. Roscommon
Co. Tipperary North
1
3
4
5
26
78
9
10
11
12
13
14
15
21
22
16
17
18
19
20
13

2.2 Methodology
2.2.1 Water Chemistry Sampling and Analysis
On every sampling occasion water was sampled using a weighted 5 litre plastic
bottle which was attached to a rope and thrown out from the turlough shore. Water
samples were analysed for alkalinity, chlorophyll a, colour, conductivity, dissolved
oxygen, molybdate reactive phosphorus (MRP), pH, silicate, temperature, total
nitrogen (TN), total phosphorus (TP), turbidity, the anions chlorine, sulphate, nitrate
and the cations calcium, magnesium, potassium and sodium following standard
methods in cooperation with a separate PhD study (Helder Pereira) on algae and
hydrochemistry of turloughs.
Temperature and dissolved oxygen concentrations were assessed directly in the field
using a thermometer and a WTW Oxi 330i water proof dissolved oxygen meter with
a CellOx 325 probe. Temperature and dissolved oxygen were not assessed during
the second year field season in 2007/2008. Depending on turlough water sample
turbidity, 0.3-1.0 L of each sample was immediately filtered in the field station
through Whatman® GF/C filter papers using a vacuum filtration system. Each filter
paper was stored in a polypropylene centrifuge tube containing 10 ml of methanol
and kept in the fridge. The filtrate was kept for subsequent analysis. Back in the
laboratory samples were analysed for chlorophyll a following methods by the
Standing Committee of Analysts (1983). Samples were heated in a water bath at
~ 65-70 ºC until the methanol was boiling and left boiling for 10 second to extract
further pigment from the filter papers. After cooling the filter papers were removed
and samples centrifuged (8 minutes at 3500 rpm). Chlorophyll a contents were
assessed by measuring absorbance against a methanol blank at both 665 nm (the
chlorophyll a peak) and 750 nm (turbidity correction) using a Shimadzu® UV-1700
UV-Visible spectrophotometer.
Turbidity of turlough waters was assessed using a HACH® turbidity meter 2100P
on triplicate unfiltered samples. True colour was quantified with a HACH® DR2000
direct reading spectrophotometer by measuring triplicate filtered turlough samples.
Silicate concentrations were measured using previously filtered turlough water
samples following methods by Grasshoff et al. (1999). After preparing a range of
14
standards (0, 0.5, 1 and 2 mg L-1 Si), duplicate water samples and standards were
mixed with 0.2 ml of acid molybdate reagent to form silicomolybdic acid (yellow
colour) followed by 0.2 ml of oxalic acid reagent and 0.1 ml of ascorbic acid after
10-20 minutes to produce an intensely coloured blue complex. Silicate
concentrations were measured after 30-60 minutes at 810 nm on a Shimadzu® UV-
1700 UV-Visible spectrophotometer.
Turlough water was analysed for pH by inserting a pH-electrode into 50 ml of
unfiltered turlough sample. The pH-electrode and pH-meter were calibrated prior to
analysis using Reagon buffer of pH 4 and 7 following recommendations by Davison
(1990). pH was read once the reading had stabilised. Alkalinity of turlough waters
was measured on 50 ml of turlough sample following methods by Clesceri et al.
(1998) for high alkalinity lakes. A Metrohm 715 Dosimat automatic dispenser was
used to titrate 0.01 M H2SO4 into the sample until the pH endpoint 4.5 was reached.
Titration was finished within 2 minutes using a magnetic stirrer throughout to ensure
that gentle mixing occurred. The millilitres of titrant used were recorded and
subsequently multiplied by 20 to obtain turlough alkalinity (mg L-1 Ca CO3).
Conductivity of turlough water was measured on approximately 100 ml of sample in
a glass beaker using a WTW multimetre Cond 197i; Probe: TetraCon® 325WTW
and reported as μsiemens cm-1.
Total phosphorus concentrations were measured using triplicate unfiltered turlough
water samples and PO4-P standards according to the methods by Eisenreich et al.
(1975). This method is based on the oxidisation of organic matter in samples by acid
persulphate (potassium peroxide sulphate K2S2O8) digestion at 120ºC converting
organically bound phosphorus to phosphate which can be subsequently measured
using colorimetry. A volume of 25 ml of each sample and standard was pipetted into
an autoclaveable glass bottle and 5 ml digestion reagent added. Bottles were loosely
covered with caps and samples autoclaved at 15 psi for 30 minutes. After letting
them cool down to room temperature, samples were mixed with 5 ml mixed reagent
(containing H2SO4, antimony stock, molybdate stock and ascorbic acid). Sample
absorbance was measured after colour development on a Shimadzu® UV-1700 UV-
Visible spectrophotometer at 882 nm. Molybdate reactive phosphorus (MRP) was
measured on filtered turlough samples, immediately on return to a field station,
15
based on the reaction of phosphate ions (PO4) with sodium molybdate and antimony
potassium tartrate after Murphy and Riley (1962). The resulting compound is
reduced to ‘molybdenum blue’ by ascorbic acid which can be determined
spectrophotometrically. 5 ml of each filtered sample were mixed with 1 ml of mixed
reagent (containing H2SO4, antimony stock, molybdate stock and ascorbic acid) and
colour let develop for at least 15 minutes. Concentrations in turlough samples and 2
standards were read at 882nm.
Concentrations of total nitrogen in turlough water samples were determined in
triplicate according to Grasshoff et al. (1999). This method is based on alkaline
persulphate digestion at 120 ºC converting organically bound nitrogen and ammonia
to nitrate. Triplicate 50 ml samples and nitrate standards were filled into
polypropylene bottles and 5 ml of oxidising reagent added. Samples were autoclaved
at 15 psi for 30 minutes and cooled down over night. Nitrate concentrations were
measured using a continuous flow auto-analyser (AutoAnalyzer 3, Bran and
Luebbe® AACE 5.40).
Nitrate, chloride and sulphate were analysed on turlough water filtrate in duplicate
by self regenerated electrolytically suppressed ion chromatography (Dionex-ICS-
1500 Ion-chromatographer System; Dionex AS40 automated sampler) (Clesceri et
al., 1998). Reading of concentrations of respective anions followed calibration using
five standards and calibration was tested using a quality control solution after every
ten samples. Calcium, magnesium, potassium and sodium concentrations were
measured on filtered turlough samples by flame atomic absorption (Perkin Elmer
3100 Spectrometer) and inductively coupled plasma atomic emission spectroscopy
(ICPAES). Samples were mixed with lanthanum chloride to a concentration of 0.4%
and 0.1% CsCl contained in a 1% HNO3 matrix for the different methods,
respectively. Duplicate samples were read after calibration with four standards per
cation using the flame atomic absorption method, and calibration was checked after
every ten samples using one standard and if necessary a reslope factor. For ICPAES
turlough samples were read after calibration with five standards and calibration
tested after every ten samples using a quality control solution.
For quality control (QC), samples of known concentration were run along with
turlough water samples for analysis of total and molybdate reactive phosphorus (TP
16

and MRP), total nitrogen (TN), silicate, anions and cations. QC solutions were
prepared from different stock reagents to those used for preparing concentration
standards. For total and molybdate reactive phosphorus analysis, the QC
concentration used was 25 μg L-1 TP and MRP, while for nitrogen analysis the QC
concentration was 2.1 mg L-1 NO3-N. Concentrations of QCs for the anion analysis
were 10 mg L-1 chloride and sulphate, respectively, and 1 mg L-1 NO3-N. QC
concentrations for cations were 2.5 mg L-1 calcium, 0.25 mg L-1magnesium, 1 mg
L-1 potassium and 0.5 mg L-1 sodium. The concentration of the silicate QC was 1 mg
L-1. For further quality assurance certified lake water (Ontario-99, lot 406) was run
together with samples for analysis of anions and cations. Only the key water
chemistry variables TP, TN, Chl a, turbidity and conductivity were considered
relevant for analysis in subsequent data chapters.
2.2.2 Invertebrate Sampling and Identification
Field sampling of turloughs for this study was carried out during two successive
flooding seasons (2006/2007 and 2007/2008). Macroinvertebrates were collected
from the littoral zone of turloughs following different sampling approaches as
outlined in each of the following data chapters. The comparability of different
methods was assessed by means of hierarchical cluster analysis. Clustering of
turloughs sampled in April 2007 using the two different sampling strategies (multi-
habitat sweep net and single-habitat box sampling) resulted in a similar grouping of
turloughs, demonstrating reliable comparability of methods (Figure 3.4 & Figure
6.2b).
Macroinvertebrates were identified using the keys by Ashe et al. (1998), Brooks and
Lewington (1997), Edington and Hildrew (1995), Elliott and Mann (1979), Elliot et
al. (1988), Fitter and Manuel (1986), Friday (1988), Gledhill et al. (1993), Holland
(1972), Hynes (1977), Macan (1977), Miller (1996), Nilsson (1997), Reynoldson
and Young (2000), Richoux (1982), Savage (1989), Savage (1999) and Wallace et
al. (2003). Macroinvertebrates were identified to the lowest taxonomic level,
generally species. However, Diptera and Trichoptera pupae, Hydrachnidia,
Ostracoda and Oligochaeta were identified to order and all Diptera and Collembola
to family level only. Random samples were identified by an independent individual
to ensure quality assurance of identification. Identifications of rare species were
17

verified by established experts. Cladoceran zooplankton and separate chydorid
samples were collected from twenty turloughs in April 2007 using methodologies
described in Chapter 6 and identified using keys by Scourfield and Harding (1966)
and Amoros (1984). Quality of identification was assured by cross-identification of
random samples by established experts.
2.2.3 Hydrological Parameters
Detailed hydrological data was assessed through a separate PhD study (Owen
Naughton) on hydrology of turloughs that provided estimates for hydrological
metrics such as ‘hydroperiod’ and ‘areal reduction rate’. Estimates of hydroperiod
were based on detailed water level records and defined as the time each turlough
was inundated during one year. A turlough was defined as ‘dry’ when the diver,
which was placed at the lowest point in each turlough, clearly identified a dry spell
(no water) or when only a minimal amount of water e.g. little puddle or water in
swallow hole was remaining. Multimodal flooding events were factored in the
calculations to give a total number of days of inundation.
Areal reduction rate was calculated for a subset of turloughs with the purpose to
provide a metric for the speed at which water levels change in each turlough. It was
calculated as the average rate of decrease in planar flooded area between the time of
maximum and minimum areal inundation. The maximum areal inundation was
defined as the maximum stage and volume of each turlough, whereas the minimum
areal inundation coincided with the drying of the turlough, or, if a permanent water
body was present throughout the year, the surface area of the permanent water body
was used (dA/dT m2/Day where dA= -maximum areal inundation and dT=time
between maximum areal inundation and emptying of turlough/non permanent water
body).
18

3 Distinctiveness of Macroinvertebrate Communities in Turloughs (Temporary Ponds) and their Response to Environmental Variables1
3.1 Abstract
1. Turloughs are a prime example of a water body type that interfaces with both
the European Habitats Directive (92/43/EEC) and Water Framework
Directive (2000/60/EC) (WFD), highlighting the need for an integrated
strategy to protect and manage surface waters and groundwaters. To date,
research on turloughs, including their invertebrate communities is limited.
2. Eight turloughs were sampled for their macroinvertebrate communities and
water chemistry in April 2007. Faunal samples were collected by means of a
simple box sampler.
3. Replicate samples within each turlough clustered together, indicating that a
single sample can provide a meaningful description of the turlough
invertebrate community. Variation of invertebrate communities within
turloughs was nested among turloughs.
4. Hydroperiod influenced mean abundance and taxon richness of
macroinvertebrates, but no correlation was found between nutrient status and
either mean abundance or taxon richness.
5. Turloughs are priority habitats under the EU Habitats Directive, requiring
maintenance of ‘favourable conservation status’, which needs to be assessed
through monitoring and effected through appropriate management plans.
While the distinctiveness of macroinvertebrate communities across turloughs
is conducive to simple and cost-effective monitoring, this also challenges the
applicability of the concept of type-specific communities across these highly
dynamic ecosystems.
1 Porst G, Irvine K. 2009. Distinctiveness of macroinvertebrate communities in turloughs (temporary ponds) and their response to environmental variables. Aquatic Conservation: Marine and Freshwater Ecosystems 19: 456-465.
19

3.2 Introduction
Turloughs are periodically flooded karst wetland ecosystems. They are common in
the western third of Ireland, where the dominant bedrock is carboniferous limestone,
with or without shallow deposits of glacial till (Coxon, 1987b). Turloughs support
both aquatic fauna during the flooding period, typically over the winter, and wet
grasslands and fen type vegetation over the summer (Sheehy Skeffington et al.,
2006). They usually flood with rising water tables through springs and fissures in the
limestone in autumn and empty, often through the same fissures or ‘swallow holes’,
in spring (Ní-Bhriain et al., 2003). Filling and emptying can vary enormously
among turloughs and water levels may rise sporadically during periods of high
rainfall (Reynolds et al., 1998; Visser et al., 2006). In summer turloughs are
generally dry and used as pastures (Reynolds, 1982), although some may contain
still or flowing waters throughout the year (Goodwillie and Reynolds, 2003).
Turloughs are classified as priority habitats under the European Habitats Directive
(92/43/EEC) (EEC, 1992). Article 2 of the EU Directive requires Member states to
ensure maintenance of biodiversity through the conservation of natural habitats and
of wild fauna and flora. Under the Water Framework Directive (WFD) (EC, 2000)
turloughs are classified as groundwater dependent terrestrial ecosystems (GWDTE).
The WFD has stimulated increased research on littoral invertebrates in lakes
(García-Criado et al., 2005; Moss et al., 2003; Sondergaard et al., 2005; Tolonen et
al., 2001; White and Irvine, 2003) but work on the invertebrate fauna of Irish
wetlands, including turloughs remains very limited (Reynolds, 2000; Reynolds et
al., 1998). While hydrographic studies exist for relatively large temporary water
bodies in some areas (counties Clare and Galway) (Coxon, 1987a), and Goodwillie
(1992) mapped vegetation for over 80 turloughs, most data on aquatic turlough
invertebrate communities are not recent (Lansbury, 1965; Reynolds, 1982, 1985a, b;
Reynolds, 1997), focuses on single taxon groups (Donaldson et al., 1979; Duigan
and Kovach, 1991; Grainger, 1991) and does not consider conservation issues per
se. Studies encompassing the macroinvertebrate community as a whole have not
been conducted to date.
20
21
Coxon (1986) considered that approximately one third of all turloughs over 10
hectares were damaged irreversibly by drainage. Nutrient enrichment, together with
changes in stocking densities, is a current major threat to turloughs (Ní-Bhriain et
al., 2003; Ní-Bhriain et al., 2002; Sheehy Skeffington et al., 2006) that can alter
biotic communities, including macroinvertebrates (Working Group on Groundwater,
2004). In addition, temporary waters are important for the survival of rare and
restricted species (Collinson et al., 1995), and regional biodiversity (Oertli et al.,
2005; Williams, 1997). Maintaining ecological integrity is required by both the
Habitats and Water Framework Directive. The macroinvertebrates provide an
essential component for the assessment of conservation status of turloughs, and the
understanding of biotic response to changing catchment pressures and hydrological
regimes (Reynolds, 1996; Sheehy Skeffington et al., 2006).
The aim of the work reported here was to compare macroinvertebrate community
structures in eight turloughs, selected along a nutrient gradient of total phosphorus,
and identify their conservation value for rare and restricted species, and their
response to a range of environmental variables.
3.3 Methods
3.3.1 Site Selection
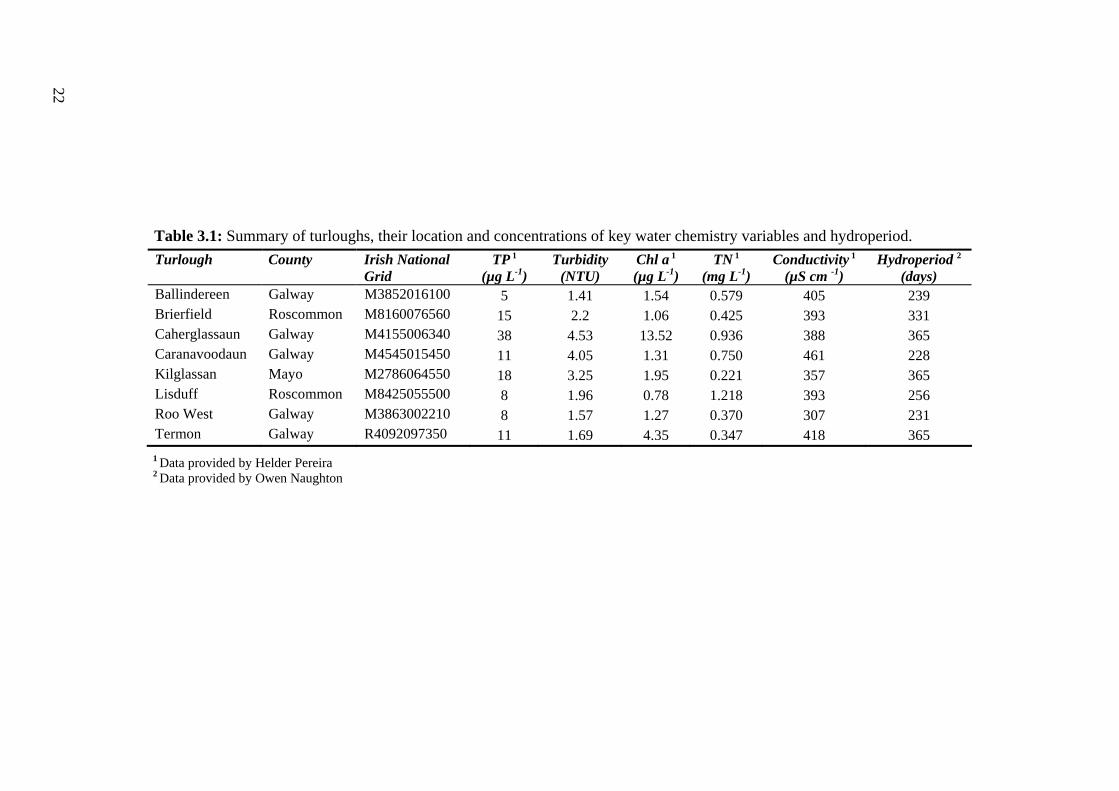
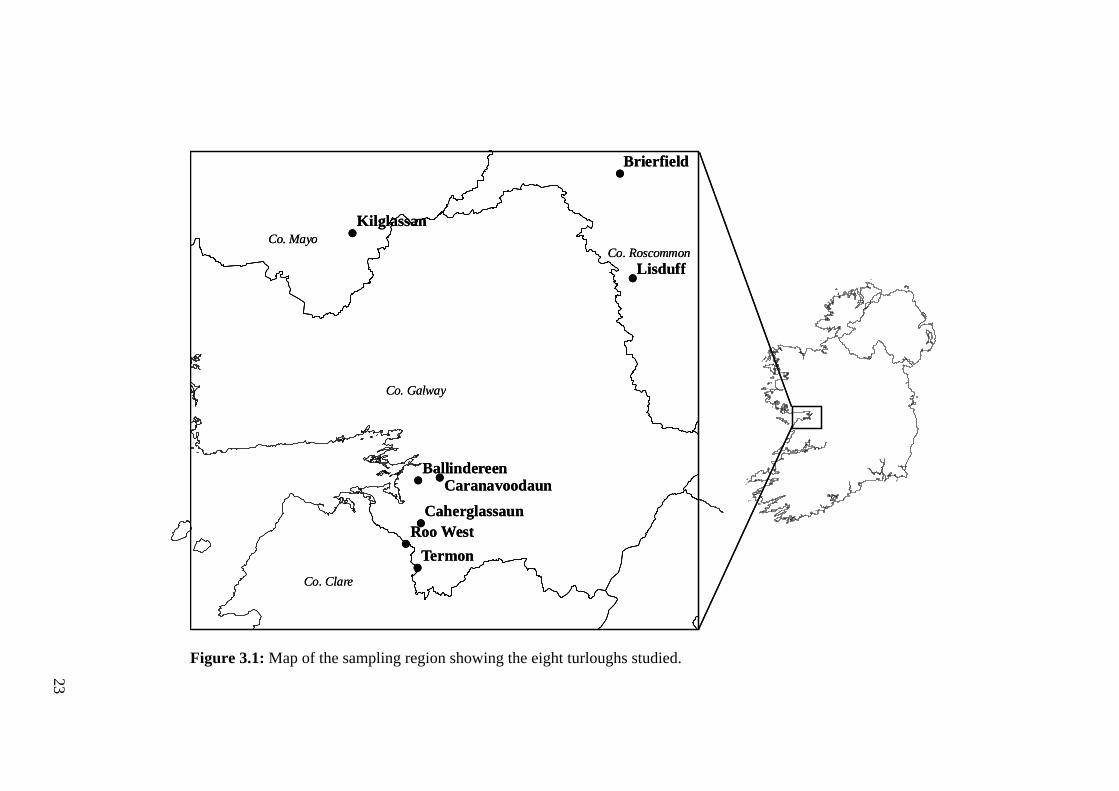
Eight turloughs were selected to represent a gradient of total phosphorus (TP)
concentrations (Table 3.1 & Figure 3.1). Phosphorus concentrations of twenty-two
turloughs were determined prior to the selection of sites. Except Brierfield, all the
sites are designated as candidate Special Areas of Conservation (cSAC) under the
Habitats Directive.
22
Table 3.1: Summary of turloughs, their location and concentrations of key water chemistry variables and hydroperiod. Turlough County Irish National
Grid TP 1
(µg L-1) Turbidity
(NTU) Chl a 1 (µg L-1)
TN 1 (mg L-1)
Conductivity 1 (µS cm -1)
Hydroperiod 2 (days)
Ballindereen Galway M3852016100 5 1.41 1.54 0.579 405 239 Brierfield Roscommon M8160076560 15 2.2 1.06 0.425 393 331 Caherglassaun Galway M4155006340 38 4.53 13.52 0.936 388 365 Caranavoodaun Galway M4545015450 11 4.05 1.31 0.750 461 228 Kilglassan Mayo M2786064550 18 3.25 1.95 0.221 357 365 Lisduff Roscommon M8425055500 8 1.96 0.78 1.218 393 256 Roo West Galway M3863002210 8 1.57 1.27 0.370 307 231 Termon Galway R4092097350 11 1.69 4.35 0.347 418 365
1 Data provided by Helder Pereira 2 Data provided by Owen Naughton
22
23
Figure 3.1: Map of the sampling region showing the eight turloughs studied.
!
!
!
!
!
!
!
!
Co. Galway
Co. Mayo
Co. Clare
Co. Roscommon
Termon
Lisduff
Roo West
Kilglassan
Brierfield
BallindereenCaranavoodaun
Caherglassaun
!
!
!
!
!
!
!
!
Co. Galway
Co. Mayo
Co. Clare
Co. Roscommon
Termon
Lisduff
Roo West
Kilglassan
Brierfield
BallindereenCaranavoodaun
Caherglassaun
23
3.3.2 Macroinvertebrate Sampling
Turloughs were sampled in April 2007 with a simple box sampler (50 cm long x 40
cm wide x 50.5 cm high), created by cutting out the bottom of a sturdy plastic
storage box, modified after O’Connor et al. (2004). Turlough littoral zones can
comprise different habitat types varying from grassland, limestone pavement, and
stone walls to thick stands of sedges or reeds. To allow comparability of littoral
macroinvertebrate communities among turloughs, one habitat type (submerged
grassland) was selected, which occurred extensively in all of the eight turloughs.
Five replicate samples were collected from each turlough by rapidly lowering the
box on to the substratum. Organisms trapped within the box where then removed
with a small net with a mesh size of 1mm, sieved, washed into collection bottles and
preserved in 90% industrial methylated spirits (IMS) for later sorting and
identification. In the laboratory macroinvertebrates were identified under a
dissecting stereomicroscope to the lowest taxonomic level possible (typically
species). Identifications of rare species were verified by established experts.
3.3.3 Water Chemistry Sampling
At every turlough a water sample was collected using a weighted 5 L plastic bottle
attached to a rope, and thrown out from the shore. Water samples were analysed for
turbidity (HACH Portable Turbidity Meter 2100P), conductivity (WTW multimetre
Cond 197i; Probe: TetraCon® 325), chlorophyll a (Standing Committee of Analysts,
1983; SHIMADZU UV-VIS Spectrophotometer UV-1700), total nitrogen (TN)
(Grasshoff et al., 1999; Bran+Luebbe AutoAnalyzer 3) and total phosphorus (TP)
(Eisenreich et al., 1975; SHIMADZU UV-VIS Spectrophotometer UV-1700).
3.3.4 Statistical Analysis
To test for differences among turloughs a one-way analysis of variance (ANOVA)
was performed on total abundance and taxon richness of samples. The relationship
between nutrient status and invertebrate communities was assessed using Pearson
product-moment correlation (comparing, respectively, mean abundance and log-
transformed mean taxon richness, with log-transformed TP and TN concentrations)
and Spearman rank-order correlation to compare, respectively, mean abundance and
24

log-transformed mean taxon richness with turbidity, chlorophyll a, conductivity and
hydroperiod. Hydroperiod was estimated as the period of time each turlough was
inundated during the sampling period. Data normality was verified using the Shapiro
Wilk test and homogeneity of variance checked with the Leven’s test before
choosing parametric or nonparametric statistical analysis.
Cluster Analysis and Multi-Dimensional Scaling (MDS) ordination on log(x+1)
transformed total abundance macroinvertebrate data assessed similarity of samples.
Cluster Analysis and MDS are based on a Bray-Curtis similarity matrix, with
clusters formed using the average group linkage method. The similarity profile
(SIMPROF) permutation test, which tests for statistically robust clusters, not defined
a priori into groups (Clarke and Gorley, 2006), was incorporated into the Cluster
Analysis. Contributions of individual species to sample similarities or differences to
the grouping of clusters or MDS plots was done using the similarity percentages
routine SIMPER (PRIMER® 6). This method decomposes Bray-Curtis similarities
among all pairs of samples, within a priori defined groups, into percentage
contributions from each species to the respective similarities (Clarke and Warwick,
2001).
25

3.4 Results
3.4.1 Abundance and Taxon Richness
Taxon richness and abundance of invertebrates were significantly different among
turloughs (one-way ANOVA: F7,39=5.515 and F7,39=9.84, respectively; P<0.001 in
both cases). Pair wise comparisons between turloughs using the least significant
differences (LSD) test for post hoc testing identified differences between samples in
19 (abundance) and 9 (taxon richness) of the possible 28 comparisons (P<0.05 in
both cases). Mean sample abundances varied considerably among turloughs (Figure
3.2), with highest numbers in Termon (146.6±18.6 95% c.I.; n=5), the most
permanent of the eight turloughs investigated and lowest in Caranavoodaun
(56±13.9 95% c.I.; n=5). Highest mean taxon richness (Figure 3.3) occurred in
Kilglassan (18.4±2.6 95% c.I.; n=5) and lowest in Ballindereen (10.8±1.6 95% c.I.;
n=5) and Caranavoodaun (10.8±3.6 95% c.I.; n=5). Average taxon richness in all
eight turloughs was 14, with a range from 7 to 21 species. A significant positive
correlation was found between mean abundance and log-transformed mean taxon
richness (R=0.71; P<0.05). No significant correlations were found between either
mean abundance or log-transformed mean taxon richness and log_TP, log_TN,
turbidity, chlorophyll a and conductivity, respectively. Hydroperiod correlated
positively with mean abundance and mean taxon richness (R=0.88; P<0.01 and
R=0.74; P<0.05, respectively).
Macroinvertebrate community structure varied among turloughs (Table 3.2, 3.3).
For example, Lisduff was dominated by Coleoptera, Isopoda and Oligochaeta, while
Caherglassaun had high abundances of Diptera and Gastropoda. Highest mean
numbers of Coleoptera were found in Kilglassan, highest proportions of Isopoda
were found in Lisduff and very high abundances of Diptera were found in Brierfield,
Caherglassaun and Termon. High numbers of Odonata (both Lestes sp. and
Sympetrum sanguineum) were found only in Caranavoodaun. Six rare/restricted
species of conservation concern were found in five of the eight turloughs studied
(Table 3.2).
26

90.8
96.0
107.
0
56.0
142.
2
113.
0
59.4
146.
6
0
20
40
60
80
100
120
140
160
180
Ballinde
reen
Brierfie
ld
Cahergl
assau
n
Caranav
oodau
n
Kilglass
an
Lisdu
ff
Roo W
est
Termon
Num
ber o
f Ani
mal
s
Figure 3.2: Mean abundance of macroinvertebrates recorded per turlough. Error bars are 95% c.I. (n=5).
10.8 13
.4
13.4
10.8
18.4
15.2
12.8
13.6
0
5
10
15
20
25
Ballinde
reen
Brierfie
ld
Cahergl
assau
n
Caranav
oodau
n
Kilglass
an
Lisdu
ff
Roo W
est
Termon
Num
ber o
f Tax
a
Figure 3.3: Mean number of macroinvertebrate taxa recorded per turlough. Error bars are 95% c.I. (n=5).
27

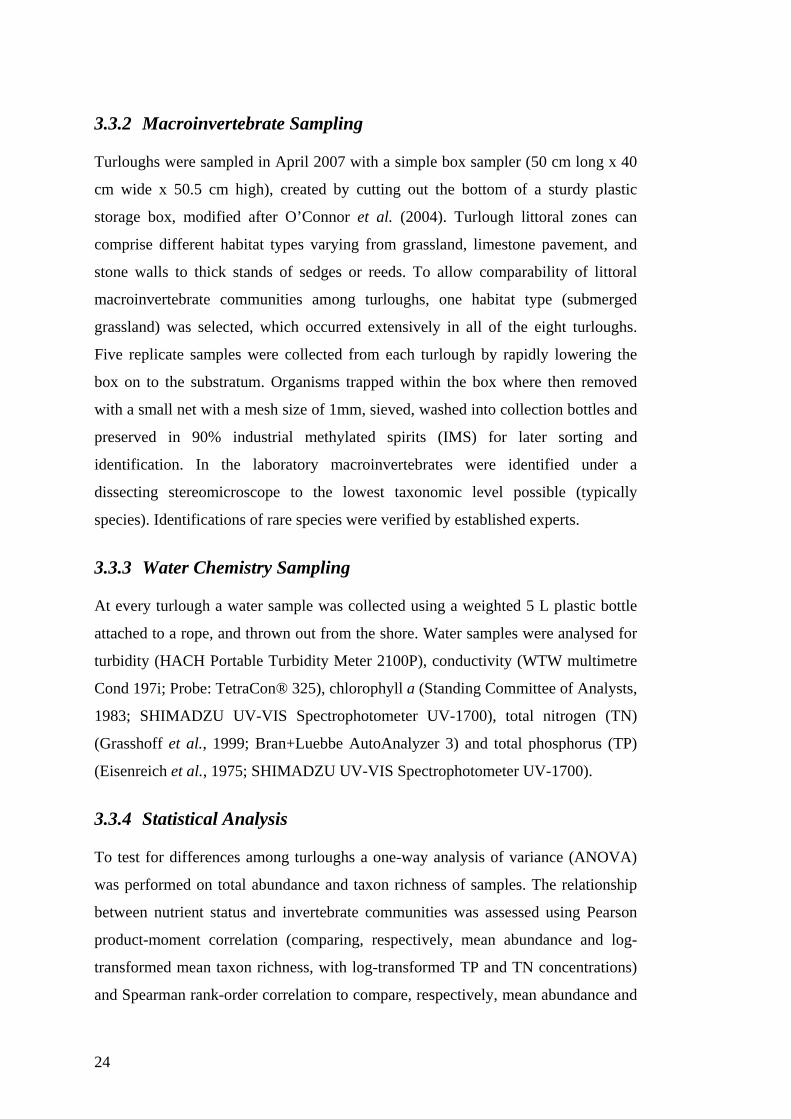
3.4.2 Cluster Analysis
Hierarchical cluster analysis grouped all replicate samples within turloughs together
(Figure 3.4). The similarity profile test (SIMPROF) indicated no significant
differences among replicate samples per turlough. The six turloughs Ballindereen,
Brierfield, Kilglassan, Lisduff, Roo West and Termon clustered at about 43%. This
group was only being joined by Caherglassaun turlough at about 34% and finally by
Caranavoodaun at about 28 % similarity.
The average similarity of replicate samples of the six turloughs Ballindereen,
Brierfield, Lisduff, Roo West and Termon was identified as 48% by the SIMPER
routine. Chironomidae sp., Oligochaeta sp. and Agabus sp. larvae contributed 24%,
23.4% and 22.4%, respectively, to average similarity of this group. The high
presence of Planorbis conturtus and Asellus meridianus and the absence of Agabus
sp. larvae in Caherglassaun samples accounted for, respectively, 10.5%, 5.9% and
9.4% of the average dissimilarity (66.3%) of this turlough compared with the other
six. Caranavoodaun differed from the group of six turloughs by 70.6%. The
dissimilarity was mainly caused by the high occurrence of Sympetrum sanguineum,
Anisoptera sp. larvae and Culicidae sp. (respectively, 9.7%, 7.3% and 6.4% of
dissimilarity).
3.4.3 Non-Metric Multidimensional Scaling (MDS)
The non-metric multidimensional (MDS) scaling plot concurred with results from
the Cluster Analysis and the SIMPER routine. The six turloughs Termon, Brierfield,
Roo West, Kilglassan, Ballindereen and Lisduff showed higher similarities to each
other compared with Caranavoodaun and Caherglassaun. Replicate samples
clustered together, with almost no overlap with other turloughs (Figure 3.5).
28
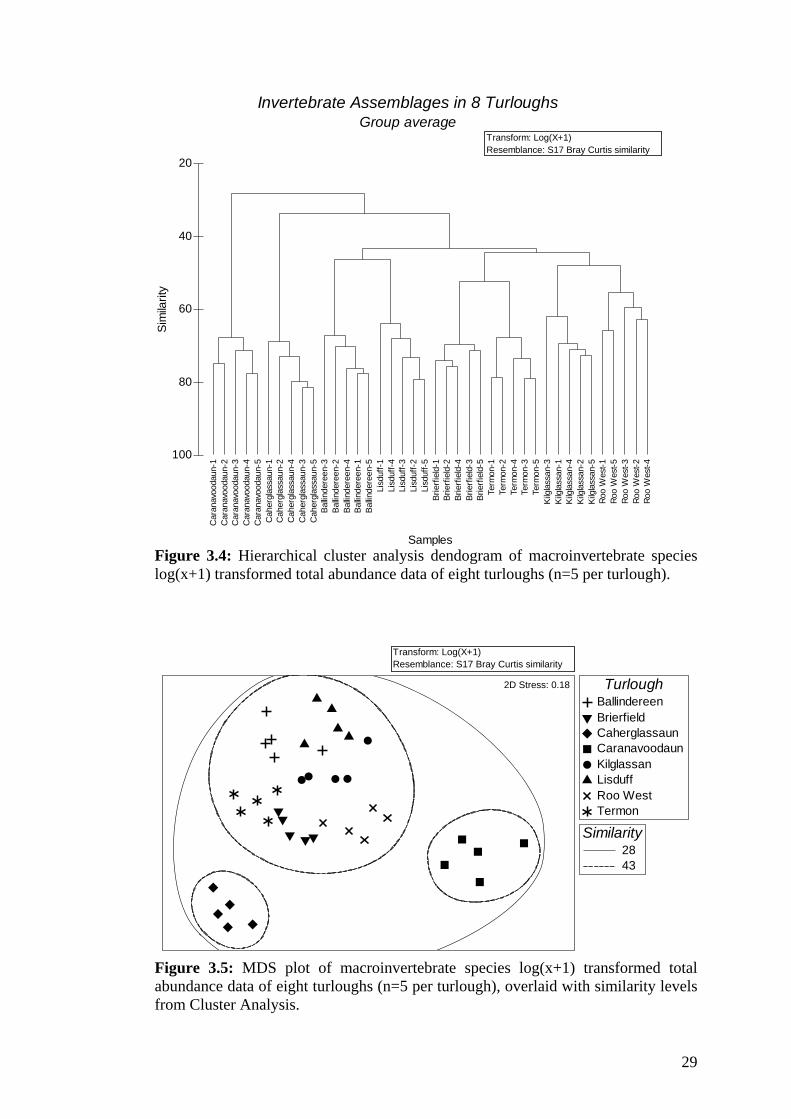
Figure 3.4: Hierarchical cluster analysis dendogram of macroinvertebrate species log(x+1) transformed total abundance data of eight turloughs (n=5 per turlough).
Invertebrate Assemblages in 8 TurloughsGroup average
Car
anav
ooda
un-1
Car
anav
ooda
un-2
Car
anav
ooda
un-3
Car
anav
ooda
un-4
Car
anav
ooda
un-5
Cah
ergl
assa
un-1
Cah
ergl
assa
un-2
Cah
ergl
assa
un-4
Cah
ergl
assa
un-3
Cah
ergl
assa
un-5
Ballin
dere
en-3
Ballin
dere
en-2
Ballin
dere
en-4
Ballin
dere
en-1
Ballin
dere
en-5
Lisd
uff-1
Lisd
uff-4
Lisd
uff-3
Lisd
uff-2
Lisd
uff-5
Brie
rfiel
d-1
Brie
rfiel
d-2
Brie
rfiel
d-4
Brie
rfiel
d-3
Brie
rfiel
d-5
Term
on-1
Term
on-2
Term
on-4
Term
on-3
Term
on-5
Kilg
lass
an-3
Kilg
lass
an-1
Kilg
lass
an-4
Kilg
lass
an-2
Kilg
lass
an-5
Roo
Wes
t-1Ro
o W
est-5
Roo
Wes
t-3Ro
o W
est-2
Roo
Wes
t-4
Samples
100
80
60
40
20Si
mila
rity
Transform: Log(X+1)Resemblance: S17 Bray Curtis similarity
Transform: Log(X+1)Resemblance: S17 Bray Curtis similarity
TurloughBallindereenBrierfieldCaherglassaunCaranavoodaunKilglassanLisduffRoo WestTermon
Similarity2843
2D Stress: 0.18
Figure 3.5: MDS plot of macroinvertebrate species log(x+1) transformed total abundance data of eight turloughs (n=5 per turlough), overlaid with similarity levels from Cluster Analysis.
29

Table 3.2: Pooled species abundances of macroinvertebrates found in eight turloughs. BN=Ballindereen; BF=Brierfield; CN=Caherglassaun; CV=Caranavoodaun; KN=Kilglassan; LF=Lisduff; RO=Roo West; TN=Termon (n=5 per turlough). Species marked with * are considered rare/restricted species, e.g. their occurrence can be restricted to the turlough environment and is considered to be of high conservation value.
Class/Order Family Species BN BF CN CV KN LF RO TN Acari Hydrachnidia Hydrachnidia sp. 4 2 14 2 Amphipoda Gammaridae Gammarus lacustris 1 11 Gammarus sp. juveniles 1 2 Araneae Argyronetidae Agyroneta aquatica 1 Coleoptera Chrysomelidae Halticinae sp. 7 8 1 Donacia sp (larvae) 2 Curculionidae Curculionidae sp. 2 2 Dryopidae Dryops sp. 1 Dryops sp. (larvae) 1 2 3 3 2 1 Dysticidae Dytiscus sp. (larvae) 1 Ilybius sp. (larvae) 2 1 2 1 8 Rhantus sp. (larvae) 1 4 14 5 2 6 Agabus bipustulatus 3 Agabus labiatus * 1 1 Agabus nebulosus 2 1 1 Agabus sp. (larvae) 116 63 20 181 49 65 31 Hydaticus sp. (larvae) 1 2 Graptodytes bilineatus * 14 102 2 Hydroporus erythrocephalus 5 1 Hydroporus palustris 4 4 2 Hydroporus pubescens 3 Hygrotus inaequalis 2 1 2 2 1 Hygrotus impressopunctatus 1 2 Hygrotus quinquelineatus * 5 1 2 Hygrotus sp. (larvae) 2 2 11 8 Laccophilus minutus 1 1 Laccophilus sp. (larvae) 1 10 4 Rhantus exsoletus 1 1 Haliplidae Haliplus fulvus 1 1 Haliplus sp. (larvae) 1 1 1 Hydraenidae Ochthebius minimus 3 2 Hydrophilidae Berosus signaticollis * 7 7 2 Cercyon tristis 1 Helophorus brevipalpis 7 1 1 7 5 2 Hydrobius fuscipes 1 Diptera Ceratopogonidae Ceratopogonidae sp. 4 Chironomidae Chironomidae sp. 56 214 209 13 96 31 79 216 Culicidae Culicidae sp. 13 33 4 Psychodidae Psychodidae sp. 1 1 Stratiomyidae Stratiomyidae sp. 1 Tabanidae Tabanidae sp. 5 Tipulidae Tipulidae sp. 3 1 11 Diptera pupae 4 4 25 1 1 1 2 2
30
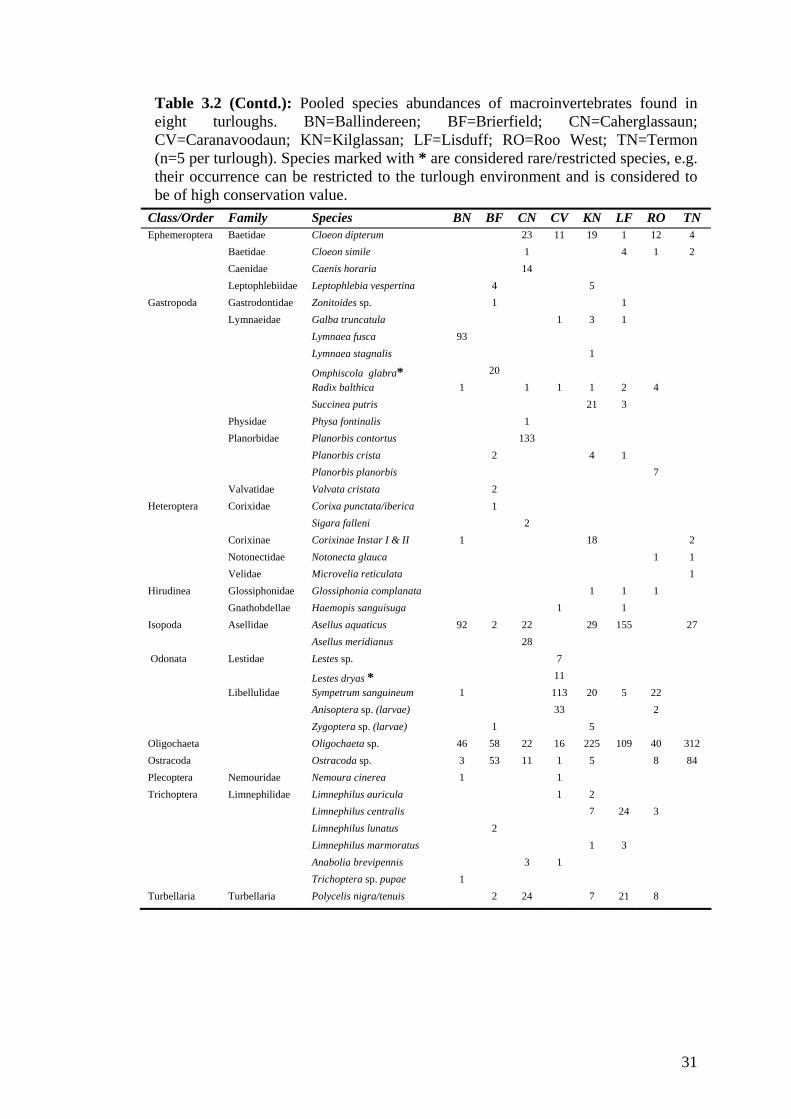
31
Table 3.2 (Contd.): Pooled species abundances of macroinvertebrates found in eight turloughs. BN=Ballindereen; BF=Brierfield; CN=Caherglassaun; CV=Caranavoodaun; KN=Kilglassan; LF=Lisduff; RO=Roo West; TN=Termon (n=5 per turlough). Species marked with * are considered rare/restricted species, e.g. their occurrence can be restricted to the turlough environment and is considered to be of high conservation value.
Class/Order Family Species BN BF CN CV KN LF RO TN Ephemeroptera Baetidae Cloeon dipterum 23 11 19 1 12 4 Baetidae Cloeon simile 1 4 1 2 Caenidae Caenis horaria 14 Leptophlebiidae Leptophlebia vespertina 4 5 Gastropoda Gastrodontidae Zonitoides sp. 1 1 Lymnaeidae Galba truncatula 1 3 1 Lymnaea fusca 93 Lymnaea stagnalis 1 Omphiscola glabra* 20 Radix balthica 1 1 1 1 2 4 Succinea putris 21 3 Physidae Physa fontinalis 1 Planorbidae Planorbis contortus 133 Planorbis crista 2 4 1 Planorbis planorbis 7 Valvatidae Valvata cristata 2 Heteroptera Corixidae Corixa punctata/iberica 1 Sigara falleni 2 Corixinae Corixinae Instar I & II 1 18 2 Notonectidae Notonecta glauca 1 1 Velidae Microvelia reticulata 1 Hirudinea Glossiphonidae Glossiphonia complanata 1 1 1 Gnathobdellae Haemopis sanguisuga 1 1 Isopoda Asellidae Asellus aquaticus 92 2 22 29 155 27 Asellus meridianus 28 Odonata Lestidae Lestes sp. 7 Lestes dryas * 11 Libellulidae Sympetrum sanguineum 1 113 20 5 22 Anisoptera sp. (larvae) 33 2 Zygoptera sp. (larvae) 1 5 Oligochaeta Oligochaeta sp. 46 58 22 16 225 109 40 312 Ostracoda Ostracoda sp. 3 53 11 1 5 8 84 Plecoptera Nemouridae Nemoura cinerea 1 1 Trichoptera Limnephilidae Limnephilus auricula 1 2 Limnephilus centralis 7 24 3 Limnephilus lunatus 2 Limnephilus marmoratus 1 3 Anabolia brevipennis 3 1 Trichoptera sp. pupae 1 Turbellaria Turbellaria Polycelis nigra/tenuis 2 24 7 21 8
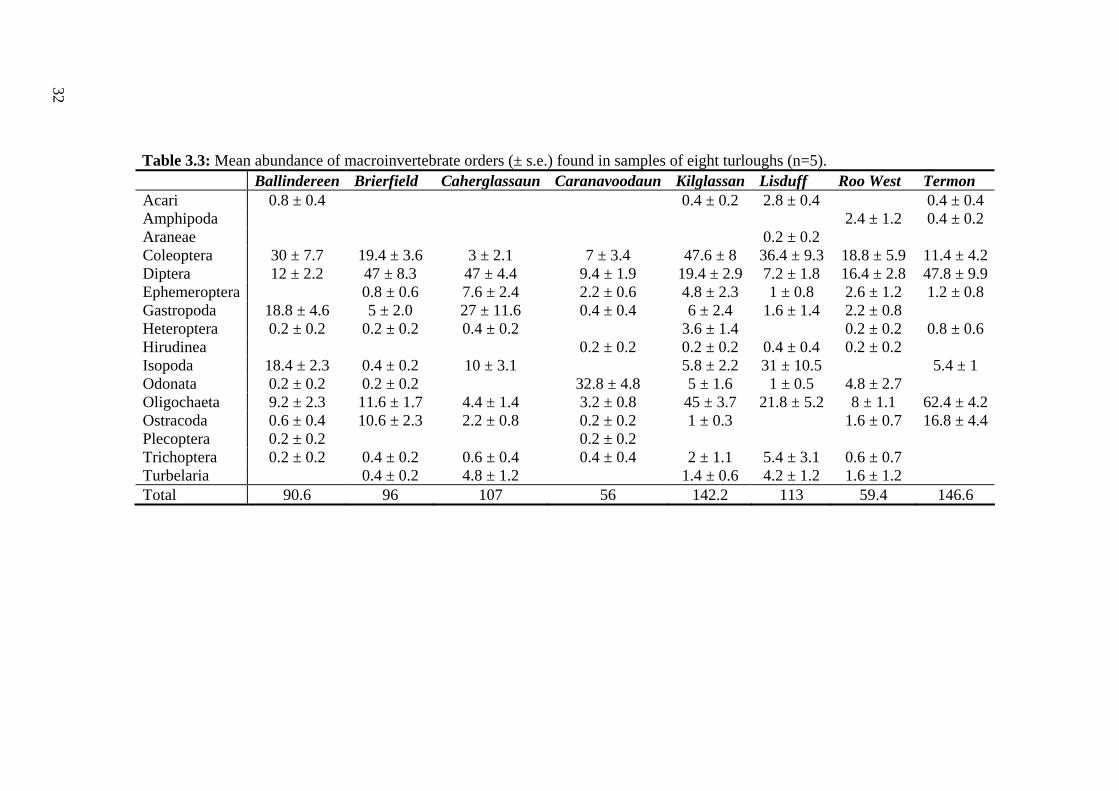
32
Table 3.3: Mean abundance of macroinvertebrate orders (± s.e.) found in samples of eight turloughs (n=5). Ballindereen Brierfield Caherglassaun Caranavoodaun Kilglassan Lisduff Roo West Termon Acari 0.8 ± 0.4 0.4 ± 0.2 2.8 ± 0.4 0.4 ± 0.4 Amphipoda 2.4 ± 1.2 0.4 ± 0.2 Araneae 0.2 ± 0.2 Coleoptera 30 ± 7.7 19.4 ± 3.6 3 ± 2.1 7 ± 3.4 47.6 ± 8 36.4 ± 9.3 18.8 ± 5.9 11.4 ± 4.2 Diptera 12 ± 2.2 47 ± 8.3 47 ± 4.4 9.4 ± 1.9 19.4 ± 2.9 7.2 ± 1.8 16.4 ± 2.8 47.8 ± 9.9 Ephemeroptera 0.8 ± 0.6 7.6 ± 2.4 2.2 ± 0.6 4.8 ± 2.3 1 ± 0.8 2.6 ± 1.2 1.2 ± 0.8 Gastropoda 18.8 ± 4.6 5 ± 2.0 27 ± 11.6 0.4 ± 0.4 6 ± 2.4 1.6 ± 1.4 2.2 ± 0.8 Heteroptera 0.2 ± 0.2 0.2 ± 0.2 0.4 ± 0.2 3.6 ± 1.4 0.2 ± 0.2 0.8 ± 0.6 Hirudinea 0.2 ± 0.2 0.2 ± 0.2 0.4 ± 0.4 0.2 ± 0.2 Isopoda 18.4 ± 2.3 0.4 ± 0.2 10 ± 3.1 5.8 ± 2.2 31 ± 10.5 5.4 ± 1 Odonata 0.2 ± 0.2 0.2 ± 0.2 32.8 ± 4.8 5 ± 1.6 1 ± 0.5 4.8 ± 2.7 Oligochaeta 9.2 ± 2.3 11.6 ± 1.7 4.4 ± 1.4 3.2 ± 0.8 45 ± 3.7 21.8 ± 5.2 8 ± 1.1 62.4 ± 4.2 Ostracoda 0.6 ± 0.4 10.6 ± 2.3 2.2 ± 0.8 0.2 ± 0.2 1 ± 0.3 1.6 ± 0.7 16.8 ± 4.4 Plecoptera 0.2 ± 0.2 0.2 ± 0.2 Trichoptera 0.2 ± 0.2 0.4 ± 0.2 0.6 ± 0.4 0.4 ± 0.4 2 ± 1.1 5.4 ± 3.1 0.6 ± 0.7 Turbelaria 0.4 ± 0.2 4.8 ± 1.2 1.4 ± 0.6 4.2 ± 1.2 1.6 ± 1.2 Total 90.6 96 107 56 142.2 113 59.4 146.6
32

3.5 Discussion
3.5.1 Comparison of Macroinvertebrates among Turloughs
Hierarchical Cluster Analysis, MDS and the SIMPER routine identified a strong
individual character of turloughs with macroinvertebrate community compositions
varying markedly among the eight turloughs studied. Caranavoodaun and
Caherglassaun separated clearly from the remaining six turloughs in all methods,
suggesting discrete turlough invertebrate communities. Caherglassaun, which had
highest turbidity (4.53 NTU), total phosphorus (38 µg L-1) and chlorophyll a
concentrations (13.5 µg L-1), and reported high cattle stocking densities (Ní-Bhriain
et al., 2003) had abundant Diptera (mainly Chironomidae sp.) and Gastropoda
(mainly Planorbis contortus). This concurs with a tolerance to nutrient enrichment
by Gastropoda and Diptera suggested by Hellawell (1986) and Rosenberg and Resh
(1993a). Water level in Caherglassaun had dropped dramatically in April 2007 and
water at sampling locations was extremely turbid owing to a great amount of soft,
muddy sediment. The high occurrence of Sympetrum sanguineum observed in
Caranavoodaun reflects its preference for shallow well-vegetated ponds, situated in
woodland. Its adults typically perch in bankside trees while feeding (Brooks and
Lewington, 1997). S. sanguineum as well as the scarce emerald damselfly Lestes
dryas complete their live cycle within one year, allowing them to breed in seasonal
pools with thick vegetation such as Caranavoodaun (Brooks et al., 1997). L. dryas is
considered the rarest Irish damselfly and is especially threatened by intensive
grazing, which removes shelter for adult damselflies and reduces suitable areas for
reproduction (Nelson and Thompson, 2004). Thus, the comparably low grazing
pressure (Ní-Bhriain et al., 2002) and relatively low nutrient status (TP=11 µg L-1;
Chl a=1.31 µg L-1), together with its surrounding hazel woodland and well vegetated
littoral/shore zone make Caranavoodaun an ideal habitat for both Odonata species.
Their mutual occurrence furthermore agrees with findings by Moore (1980), who
reported S. sanguineum in two out of four L. dryas freshwater sites in Ireland. The
seasonality of turloughs and hence the absence of larger predatory invertebrates and
fish in many sites seems also crucial for the survival of L. dryas (Nelson and
Thompson, 2004). The occupation of mainly aerial colonizers in Caranavoodaun
33

furthermore represents an adaptation of aquatic invertebrates to turloughs, which
also include resistance to desiccation and resting stages (Reynolds, 2003).
The mayfly Cloeon simile Eaton, which occurred in four of the eight turloughs
studied, has been reported to produce only one generation per year in two upland
turloughs, whereas normally it has a bivoltine lifestyle (Byrne, 1981). Other typical
aquatic macroinvertebrates of turloughs comprise inter alia Cloeon dipterum, the
molluscs Radix balthica and Galba truncatula, the flatworm Polycelis nigra/tenuis,
Ostracoda sp., caddis-fly species of the family Limnephilidae, the amphipods
Gammarus sp. and Asellus sp. and various beetle species including Hydroporus
palustris and Hygrotus impressopunctatus (Reynolds, 1982, 1985b, 1996; Reynolds,
1997; Reynolds, 2003). This fauna typically inhabits small ponds (Reynolds, 2000)
and were all found in the surveyed turloughs.
Small fish were discovered in Termon, which has a permanent water body all year
round, and Kilglassan, which also holds a considerable area of puddles and drainage
ditches supporting fauna with life-spans exceeding one year. The smooth newt
Triturus vulgaris was detected in Brierfield, a turlough which usually holds some
water even during summer when newt tadpoles metamorphose. T. vulgaris is
probably the top-predator in this turlough during spring, but large beetle larvae such
as Rhantus sp. can also prey on amphibians in turloughs (Sheehy Skeffington et al.,
2006). Temporal and spatial habitat complexity was suggested by Reynolds (2000)
to allow for the coexistence of predators with characteristic turlough invertebrates.
The distinctiveness of turlough macroinvertebrate assemblages was demonstrated by
the clear clustering of replicate samples. Temporal and spatial sampling of three of
the studied turloughs (Caranavoodaun, Roo West and Termon) and one additional
one confirmed these results (see Chapter 4 & 5). This also suggests that single or
pooled invertebrate samples are sufficient to describe the aquatic macroinvertebrate
communities of turloughs, at least from individual habitat types. White and Irvine
(2003) found variation of littoral macroinvertebrates within lakes nested among
lakes across a range of lake types. This suggests that standing waters in general have
distinct invertebrate communities. Turloughs, with their ephemeral character, may
provide extreme examples of community response to local regional variations that
favour distinctive, well adapted macroinvertebrate assemblages (Reynolds, 2003).
34
Furthermore, like other temporary waters (Collinson et al., 1995; Williams, 1996;
Williams et al., 2003), turloughs tend to have highly individual physico-chemical
features and hydrological regimes, plus small catchment areas that provide relative
isolation from other water bodies (Sheehy Skeffington and Gormally, 2007). These
facets, and the evidence from the sampling programme, emphasize both the
importance of turloughs as important conservation sites, but also the likely
distinctiveness of the habitats.
3.5.2 Macroinvertebrate Response to Environmental Variables
While hydrogeomorphological characteristics and land use practices of turlough
basins would be expected to influence their ecology strongly (Sheehy Skeffington et
al., 2006), our study did not find any evidence for the influence of water chemistry
on mean abundance or taxon richness. This is in agreement with Reynolds (2000),
who found nutrient concentrations to be unimportant in determining faunal
community diversity in turloughs. Yet, further research is needed to investigate the
relationship between water chemistry variables and macroinvertebrate community
composition in turloughs. The data confirmed, however, the influence of duration of
flooding on mean macroinvertebrate abundance and taxon richness in the eight
turloughs studied. The most permanent turlough, Termon, had highest numbers of
macroinvertebrates and relatively high mean taxon richness. Caranavoodaun, a
turlough which usually dries out completely during the summer months, had the
lowest mean abundance and mean taxon richness. Correlation of permanence of
temporary ponds with invertebrate taxon richness and abundance has also been
found in several studies of ponds (Collinson et al., 1995; Duigan, 1988; Eitam et al.,
2004; Spencer et al., 1999; Tavernini et al., 2005). The exclusion of riparian species
such as rove beetles (Staphylinidae), ground beetles (Carabidae) or shore bugs
(Saldidae), which might be a significant component of the faunal community of
turloughs during the dry phase (Williams, 1997), may contribute, however, to an
underestimation of taxon richness associated with temporary ponds (Collinson et al.,
1995; Della Bella et al., 2005).
The question of taxonomic resolution is controversial (Bailey et al., 2001). While
some benthologists argue that the lowest resolution gives the best information on
variability in aquatic macroinvertebrate communities (Resh and Unzicker, 1975),
35
others have found that the lower taxonomic resolution has little effect on
multivariate statistics (Hewlett, 2000; Marshall et al., 2006). In this study most of
the specimens could be identified to species (Table 3.2). However, Diptera and
Trichoptera pupae, oligochaetes and ostracods were identified to order and all the
dipterans to family level only. The statistical analysis of the macroinvertebrate data
was nevertheless based on the displayed species list, which included different
taxonomic levels. Similar results were, however, obtained when the data was
transposed to order and family levels, demonstrating the validity of the reported
results at a mixed but lower taxonomic resolution.
3.5.3 Temporal Effects
This study emphasizes the importance of drying out of ponds for the occurrence of
rare and restricted species. Up to four rare/restricted taxa of the six uncommon
species discovered during this study were found in five of the studied turloughs.
This finding also highlights the contribution of turloughs to regional biodiversity
and their high conservation value. Similar importance of temporary pond conditions
was found in studies comparing the conservation value of temporary and permanent
ponds (Collinson et al., 1995; Della Bella et al., 2005). The coleopterans recorded
also comprise species of a characteristic ‘edge-moss-dwelling’ turlough community,
identified by Bilton (1988), which is considered of high conservation value and
unknown from Great Britain (Foster et al., 1992). This assemblage, which is
reported to be very susceptible to disturbance by anthropogenic sources such as
heavy grazing and nutrient enrichment, includes the ‘nationally notable B species’
(Great Britain) Hygrotus quinquelineatus, Agabus labiatus and Berosus
signaticollis. They are frequently accompanied by other typical turlough beetles
including Agabus nebulosus (Foster), Hygrotus impressopunctatus (Schaller) and
Helophorus sp. (Bilton, 1988), which were also documented in this study. The Red
Data Book category three species (rare and threatened) Graptodytes bilineatus
(Shirt, 1987), together with Agabus labiatus and Dryops similaris (not recorded in
this study) were, furthermore, described as most sensitive to disturbances (Bilton,
1988). The mutual occurrence of G. bilineatus and A. labiatus in the nutrient poor
turloughs Lisduff and Roo West suggests relatively low disturbance of these sites.
The mud snail Omphiscola glabra (UK RDB category one – vulnerable) is known as
a temporary pond specialist and typically found on its own or accompanied only by
36
very few molluscs species (Bratton, 1991). In this survey it was only recorded from
Brierfield, a turlough which usually dries out for a considerable amount of time
during the year, together with just one other, not truly aquatic snail species
(Zonitoides sp.). However, the fully aquatic species such as snails and the
crustaceans Gammarus and Asellus (also reported in this study) are known to adapt
to the changing turlough environment by reproducing quickly after onset of
flooding. Moreover, they can survive dry periods in refugia such as swallow holes or
little puddles (Sheehy Skeffington et al., 2006).
3.6 Conclusions
In order to comply with the requirements of the WFD and the EC Habitats Directive
of achieving and maintaining good ecological status and favourable conservation
status, respectively, adequate monitoring and management plans have to be
developed for turloughs in the near future. If littoral macroinvertebrates are to be
used to assess the ecological status of Irish turloughs, our findings are important for
the design of monitoring, suggesting assessment of the macroinvertebrates can be
carried out in a cost and time effective way. Owing to the strong individuality of
turlough macroinvertebrate communities, a single box sample taken from the most
dominant turlough habitat, submerged grassland, appears sufficient to provide
comparison of the macroinvertebrate community among turloughs. However, for the
assessment of maximum species diversity of single turloughs we recommend a more
intensive sampling approach, including all available habitats in each turlough in
agreement with Della Bella et al. (2005). Yet, the understanding of the relative
effect of hydrology and nutrient status requires further work. Turloughs are of high
conservation importance, supporting invertebrate species and assemblages of
restricted distribution and high conservation value, and are susceptible to inputs
from both surface land use, and alterations to groundwater regimes (Drew and
Coxon, 1988; Sheehy Skeffington et al., 2006). Assessment of conservation value of
turloughs should not discriminate against low diversity sites, as this is the natural
character of these ecosystems. A net of turlough SAC sites should reflect the
biodiversity gradation from low to high. However, the highly dynamic nature of
turlough hydrology may negate simple classification or even development of a
typology (Visser et al., 2006). This conclusion contrasts strongly with the current
37
vogue (under the WFD) to classify water bodies within types and estimating type-
specific reference communities. As sites that fall outside the normal classification
and monitoring paradigm of the WFD, turloughs may not be subject to some of the
naïve ecological assumptions that underpin the implementation of the WFD (Hatton-
Ellis, 2008; Moss, 2008). A major challenge for turlough monitoring and
management is how to provide general guidance useful for sites that have extremely
variable and often unpredictable hydrology, and hence disturbance, within and
among years.
38
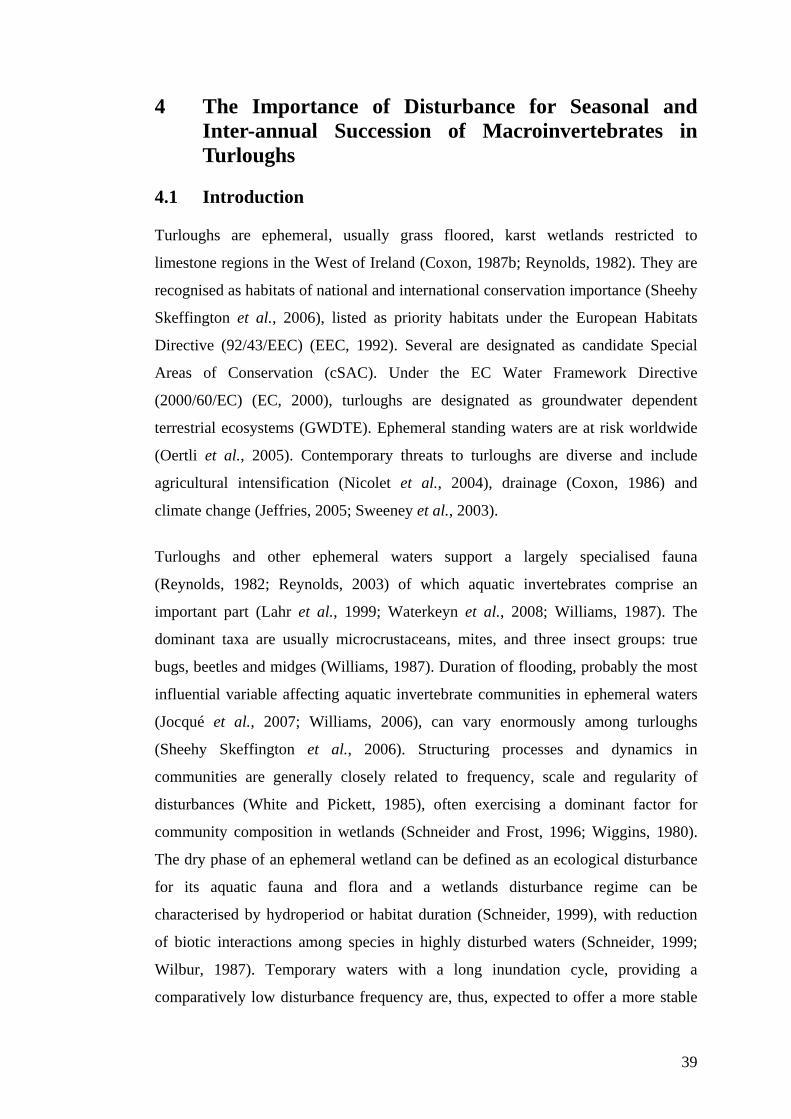
4 The Importance of Disturbance for Seasonal and Inter-annual Succession of Macroinvertebrates in Turloughs
4.1 Introduction
Turloughs are ephemeral, usually grass floored, karst wetlands restricted to
limestone regions in the West of Ireland (Coxon, 1987b; Reynolds, 1982). They are
recognised as habitats of national and international conservation importance (Sheehy
Skeffington et al., 2006), listed as priority habitats under the European Habitats
Directive (92/43/EEC) (EEC, 1992). Several are designated as candidate Special
Areas of Conservation (cSAC). Under the EC Water Framework Directive
(2000/60/EC) (EC, 2000), turloughs are designated as groundwater dependent
terrestrial ecosystems (GWDTE). Ephemeral standing waters are at risk worldwide
(Oertli et al., 2005). Contemporary threats to turloughs are diverse and include
agricultural intensification (Nicolet et al., 2004), drainage (Coxon, 1986) and
climate change (Jeffries, 2005; Sweeney et al., 2003).
Turloughs and other ephemeral waters support a largely specialised fauna
(Reynolds, 1982; Reynolds, 2003) of which aquatic invertebrates comprise an
important part (Lahr et al., 1999; Waterkeyn et al., 2008; Williams, 1987). The
dominant taxa are usually microcrustaceans, mites, and three insect groups: true
bugs, beetles and midges (Williams, 1987). Duration of flooding, probably the most
influential variable affecting aquatic invertebrate communities in ephemeral waters
(Jocqué et al., 2007; Williams, 2006), can vary enormously among turloughs
(Sheehy Skeffington et al., 2006). Structuring processes and dynamics in
communities are generally closely related to frequency, scale and regularity of
disturbances (White and Pickett, 1985), often exercising a dominant factor for
community composition in wetlands (Schneider and Frost, 1996; Wiggins, 1980).
The dry phase of an ephemeral wetland can be defined as an ecological disturbance
for its aquatic fauna and flora and a wetlands disturbance regime can be
characterised by hydroperiod or habitat duration (Schneider, 1999), with reduction
of biotic interactions among species in highly disturbed waters (Schneider, 1999;
Wilbur, 1987). Temporary waters with a long inundation cycle, providing a
comparatively low disturbance frequency are, thus, expected to offer a more stable
39

habitat and facilitate continued colonization of invertebrates (Holland and Jenkins,
1998; Williams, 1997). This consequently favours higher species diversity in lakes
with increased habitat persistence compared with waters with a shorter and more
variable inundation period (Duigan, 1988; Jocqué et al., 2007; Spencer et al., 1999).
Temporary wetland invertebrates have to mature, reproduce or disperse before the
end of the wet cycle and their life histories need to be responsive to effects and
duration of disturbance (Williams, 2006). Survival strategies include the production
of resting eggs (crustaceans), the migration of adults to permanent waters
(hemipterans, coleopterans), and the survival as terrestrial adults when only the
larval stages are aquatic (mayflies, damselflies, dragonflies) (Lahr, 1997; Lahr et al.,
1999; Williams, 1987). Temporary wetland invertebrates can, furthermore, be
categorised broadly into passive and active dispersers. Passive dispersers, such as
snails or crustaceans, typically recolonize the temporary habitat shortly after
reflooding through the hatching of resting stages or recolonization from refugia (e.g.
sinkholes or puddles) (Jocqué et al., 2007; Reynolds, 1982, 1996). Active dispersers,
characterised by rapid larval development and excellent colonization abilities
(Wiggins, 1980), comprise most insects, typically colonizing the habitat later in the
season (Jocqué et al., 2007).
While macroinvertebrate succession has, for example, been studied in temporary
rock pools of eastern Botswana (Jocqué et al., 2007), in Sahelian and Mediterranean
temporary ponds (Boix et al., 2000; Lahr et al., 1999) and in seasonal forest ponds
in central Massachusetts (Brooks, 2000), research on temporal variability in turlough
aquatic invertebrate communities has been limited (Reynolds, 1996). Owing to the
rather irregular nature of the turlough environment, invertebrate species occurrence
and diversity is postulated to depend on the variable availability of colonizers at
times of flooding (Reynolds, 1996; Reynolds et al., 2004). Despite the importance of
turloughs as hot spots for biodiversity (Biggs et al., 2005; Scheffer et al., 2006;
Williams et al., 2003), there is an absence of studies on colonization and ecological
succession (Reynolds et al., 2004). Knowledge of successional patterns of aquatic
invertebrates of temporary wetlands establishes a reference point for judging
whether or not a site is subject to subsequent degradation (Linke et al., 1999; Trigal
et al., 2006).
40

The aim of this study was to assess seasonal and inter-annual variation in
macroinvertebrate community structures, and community response to disturbance in
four turloughs differing in hydrological and nutrient regimes.
4.2 Methods
4.2.1 Study Sites
From a data set of twenty-two turloughs, located in counties Clare, Galway, Mayo
and Roscommon, which represents the morphological and geographical range of
turloughs in Ireland (see section 2.1 in Chapter 2 for details), four turloughs were
selected for study of macroinvertebrate succession. Turloughs were chosen to
represent different recurrent nutrient and hydrological regimes (Table 4.1, Figure
4.1). Blackrock is an example of a turlough with a hydrological regime that responds
rapidly to local rainfall and weather conditions, characterised by a relatively short
hydroperiod and a high areal reduction rate (dA/dT (m2/Day) = average rate of
change of area between the time of maximum areal inundation and the emptying of a
turlough). A high areal reduction rate implies rapid changes in water levels and,
thus, disturbance in the littoral zone. This turlough has, furthermore, comparatively
high nutrient concentrations. Caranavoodaun represents a turlough with a low
nutrient status and a comparatively low areal reduction rate. Roo West’s areal
reduction rate is slightly faster, while possessing a similar hydroperiod and nutrient
concentrations to Caranavoodaun. Termon has the lowest areal reduction rate and
contains a permanent water body throughout the year, with nutrient concentrations a
little higher than those of Caranavoodaun and Roo West (Table 4.1). All four
turloughs are designated as cSACs under the EC Habitats Directive (EEC, 1992).
41
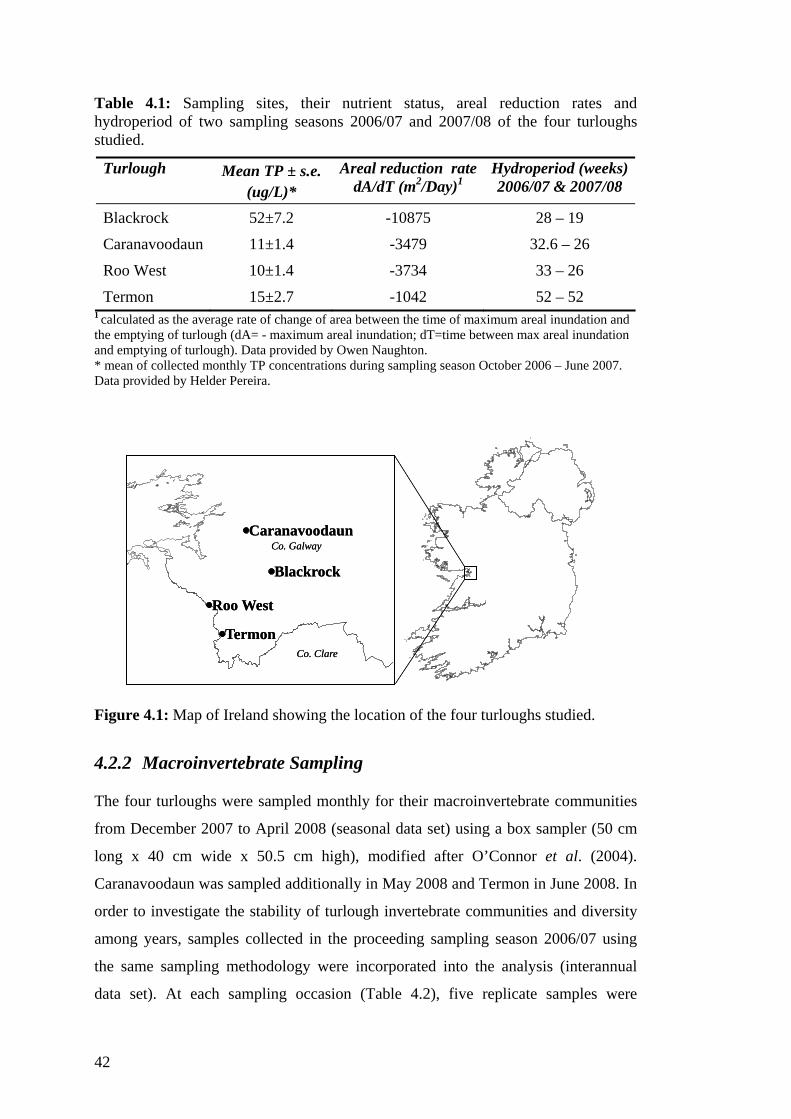
Table 4.1: Sampling sites, their nutrient status, areal reduction rates and hydroperiod of two sampling seasons 2006/07 and 2007/08 of the four turloughs studied.
Turlough Mean TP ± s.e. (ug/L)*
Areal reduction ratedA/dT (m2/Day)1
Hydroperiod (weeks) 2006/07 & 2007/08
Blackrock 52±7.2 -10875 28 – 19
Caranavoodaun 11±1.4 -3479 32.6 – 26
Roo West 10±1.4 -3734 33 – 26
Termon 15±2.7 -1042 52 – 52 1 calculated as the average rate of change of area between the time of maximum areal inundation and the emptying of turlough (dA= - maximum areal inundation; dT=time between max areal inundation and emptying of turlough). Data provided by Owen Naughton. * mean of collected monthly TP concentrations during sampling season October 2006 – June 2007. Data provided by Helder Pereira.
Co. Galway
Co. Clare
Termon
Roo West
Blackrock
CaranavoodaunCo. Galway
Co. Clare
Termon
Roo West
Blackrock
Caranavoodaun
Figure 4.1: Map of Ireland showing the location of the four turloughs studied.
4.2.2 Macroinvertebrate Sampling
The four turloughs were sampled monthly for their macroinvertebrate communities
from December 2007 to April 2008 (seasonal data set) using a box sampler (50 cm
long x 40 cm wide x 50.5 cm high), modified after O’Connor et al. (2004).
Caranavoodaun was sampled additionally in May 2008 and Termon in June 2008. In
order to investigate the stability of turlough invertebrate communities and diversity
among years, samples collected in the proceeding sampling season 2006/07 using
the same sampling methodology were incorporated into the analysis (interannual
data set). At each sampling occasion (Table 4.2), five replicate samples were
42

collected in each turlough from submerged grassland habitat (the dominant habitat
of turloughs studied). Samples were collected in the accessible, wadable littoral
zone, moving with the turlough shore line along a transect with increasing or
decreasing water level. Macroinvertebrates caught within the box were removed
with a small 1 mm mesh size net, sieved through a 500 µm sieve and preserved in
90% industrial methylated spirits (IMS). In the laboratory macroinvertebrates were
identified to the lowest taxonomic level possible (typically species).
Table 4.2: Sampling dates of turloughs studied over 2 years. Sampling date Sampling
season Blackrock Caranavoodaun Roo West Termon
November-06 1 x x January-07 1 x x April-07 1 x x x June-07 1 x December-07 2 x x x x January-08 2 x x x x February-08 2 x x x x March-08 2 x x x x April-08 2 x x x x May-08 2 x June-08 2 x
4.2.3 Statistical Analysis
4.2.3.1 Temporal Variation in Invertebrate Taxon Richness
The effect of time on macroinvertebrate species richness of the four turloughs was
investigated using repeated measures ANOVA in SPSS 15 (SPSS-Inc., 2006) on
synchronized, consecutive sampling data (December 2007 - April 2008/seasonal
data set). For this analysis recorded taxa were divided into permanent and ephemeral
residents after Williams (1987) and Lahr (1997). Permanent residents comprised
mainly crustaceans (amphipoda and isopoda), bivalves, gastropods, flatworms,
leeches, ostracods, oligochaetes and collembolans. Ephemeral residents
encompassed primarily coleopterans, trichopterans, dipterans, hemipterans,
ephemeropterans and Odonata species. Repeated measures ANOVA was carried out
on the whole community and permanent and ephemeral residents separately,
including all replicate samples. Least significant difference (LSD) and Bonferroni
43

procedure were used for post hoc testing. Variability of taxon richness within
replicate samples was estimated by the coefficient of variation (C.V.):
CV = s.d. / X * 100
4.2.3.2 Temporal Variation in Invertebrate Community Composition and Co-occurrence of Taxa
The effect of time on invertebrate community composition was investigated using
PERMANOVA (Anderson et al., 2008) with 9999 permutations on invertebrate
community compositions over consecutive sampling data (December 2007 - April
2008/seasonal data set). Analysis was carried out on the whole invertebrate
community data as well as for the separate life-cycle groups (permanent and
ephemeral residents) using a two-way crossed design (factors time and turlough),
including all replicates. Data were log(x+1) transformed and analysis was carried
out on a Bray-Curtis dissimilarity matrix. Pair-wise comparisons among all pairs of
levels of the factor time were carried out in a separate run of the PERMANOVA
routine.
Patterns of co-occurrence of taxa over time in the seasonal data set were tested with
ECOSIM (Gotelli and Entsminger, 2006), using C-score settings, which measures
the average number of ‘checkerboard units’ between all possible pairs of species
(Stone and Roberts, 1990) and default settings (fixed sum) for both row and column
constraints. ECOSIM tests for non-random patterns of co-occurrence using a
presence/absence matrix. P-values indicate probability of observed index value to be
greater than or equal to the expected index values based on Monte Carlo
permutations (5000 randomizations). Average values of replicate samples per month
were included in the calculations.
Seasonal and interannual differences in community structures in each turlough were
analyzed using the similarity percentages routine SIMPER (PRIMER® 6). By
decomposing Bray-Curtis similarities among all pairs of samples, within a priori
defined groups, SIMPER computes the percentage contributions of individual
species to respective sample differences (Clarke and Warwick, 2001). Similarity of
samples was moreover assessed using log(x+1) transformed total abundance
macroinvertebrate data for Multi-Dimensional Scaling (MDS) ordination.
44
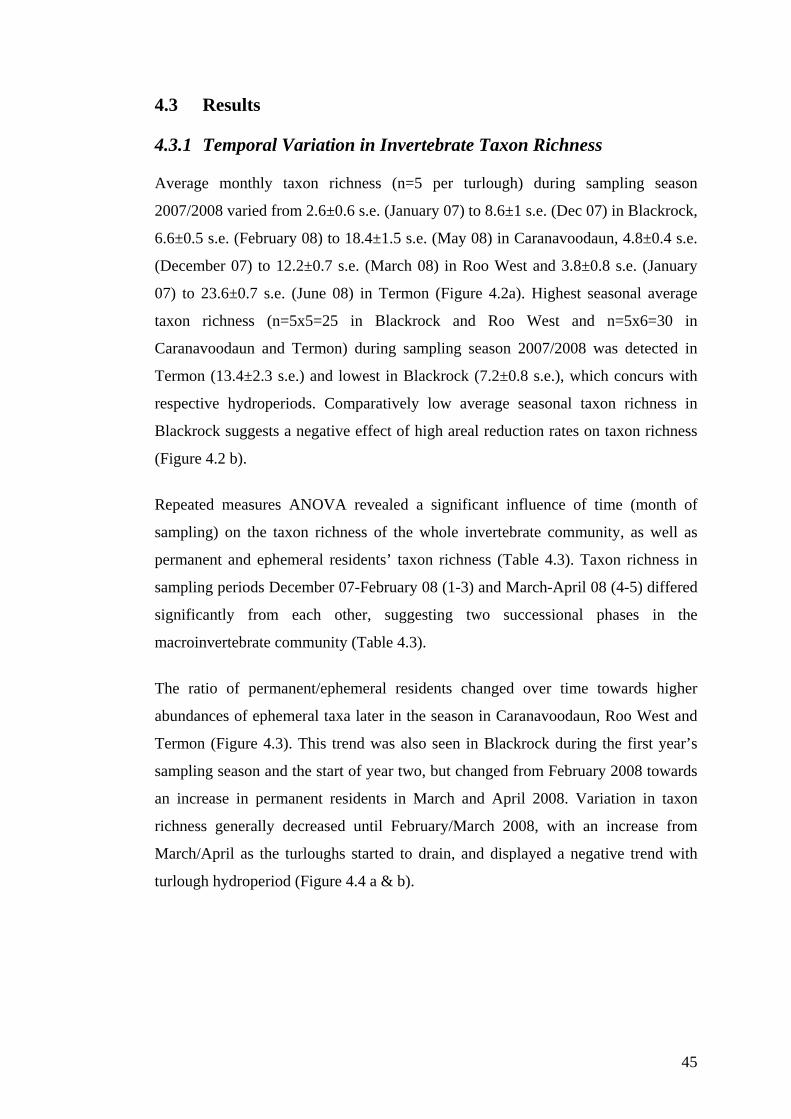
4.3 Results
4.3.1 Temporal Variation in Invertebrate Taxon Richness
Average monthly taxon richness (n=5 per turlough) during sampling season
2007/2008 varied from 2.6±0.6 s.e. (January 07) to 8.6±1 s.e. (Dec 07) in Blackrock,
6.6±0.5 s.e. (February 08) to 18.4±1.5 s.e. (May 08) in Caranavoodaun, 4.8±0.4 s.e.
(December 07) to 12.2±0.7 s.e. (March 08) in Roo West and 3.8±0.8 s.e. (January
07) to 23.6±0.7 s.e. (June 08) in Termon (Figure 4.2a). Highest seasonal average
taxon richness (n=5x5=25 in Blackrock and Roo West and n=5x6=30 in
Caranavoodaun and Termon) during sampling season 2007/2008 was detected in
Termon (13.4±2.3 s.e.) and lowest in Blackrock (7.2±0.8 s.e.), which concurs with
respective hydroperiods. Comparatively low average seasonal taxon richness in
Blackrock suggests a negative effect of high areal reduction rates on taxon richness
(Figure 4.2 b).
Repeated measures ANOVA revealed a significant influence of time (month of
sampling) on the taxon richness of the whole invertebrate community, as well as
permanent and ephemeral residents’ taxon richness (Table 4.3). Taxon richness in
sampling periods December 07-February 08 (1-3) and March-April 08 (4-5) differed
significantly from each other, suggesting two successional phases in the
macroinvertebrate community (Table 4.3).
The ratio of permanent/ephemeral residents changed over time towards higher
abundances of ephemeral taxa later in the season in Caranavoodaun, Roo West and
Termon (Figure 4.3). This trend was also seen in Blackrock during the first year’s
sampling season and the start of year two, but changed from February 2008 towards
an increase in permanent residents in March and April 2008. Variation in taxon
richness generally decreased until February/March 2008, with an increase from
March/April as the turloughs started to drain, and displayed a negative trend with
turlough hydroperiod (Figure 4.4 a & b).
45

Groups d.f. MS F-value P-value Post hoc Whole community 4,99 53.62 19.88 <0.001 1-3*4-5 Permanent residents 4,99 10.94 7.84 <0.001 2*5, 3*4-5 Ephemeral residents 4,99 25.53 13.67 <0.001 1*4-5, 2*3-5
46
Table 4.3: Results of repeated measures ANOVA testing for effects of time on taxon richness for the whole community and different life-cycle groups in turloughs for consecutive sampling months December 07 – April 08 (seasonal data set) (n=5 per turlough in each month; d.f., degrees of freedom; MS, mean sum of squares; *Significant (P<0.05) Bonferroni and LSD pair-wise tests).
0
5
10
15
20
25
Dec 07 Jan 08
Num
ber o
f Tax
Febr 08 Mar 08 Apr 08 May 08 Jun 08
a
BlackrockCaranavoodaunRoo WestTermon
0
2
4
6
8
10
12
14
16
18
Blackrock Caranavoodaun Roo West Termon
Ave
rage
Tax
on R
ichn
ess
Figure 4.2: a) Seasonal variation of average number of macroinvertebrate taxa recorded per turlough (n=5). b) Seasonal average taxon richness during sampling season 2007/2008 per turlough (n=25 in Blackrock and Roo West; n=30 in Caranavoodaun and Termon). Error bars indicate standard error.
b)
a)
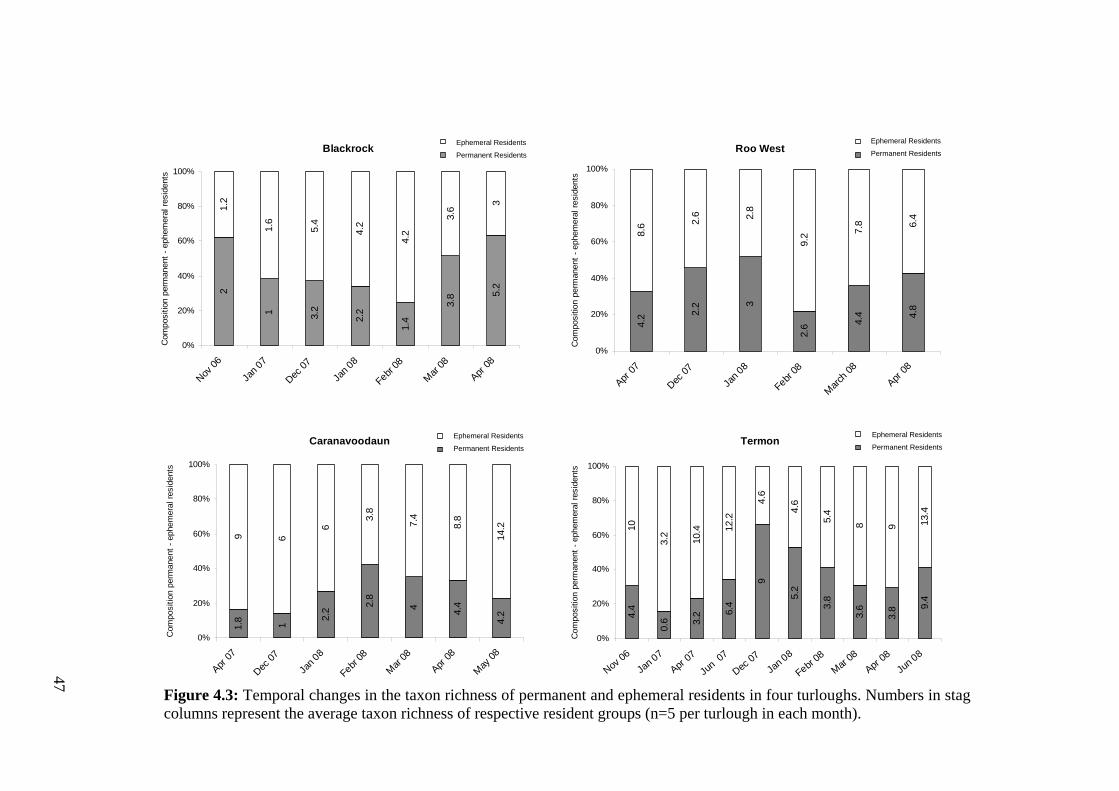
47
Blackrock
2
1 3.2
2.2
1.4
3.8 5.
2
1.2
1.6
5.4
4.2
4.2
3.6
3
20%
40%
60%
80%
100%po
sitio
n pe
rman
ent -
eph
emer
al re
side
nts
0%
Nov 06
Jan 0
7
Dec 07
Jan 0
8
Febr 08
Mar 08
Apr 08
Com
Active DispersersPassive Dispersers Roo West
4.2 2.
2 3
6 4.4 4.
8
8.6 2.
6 2.8
9.2 7.
8 6.4
20%
40%
60%
80%
100%
posi
tion
perm
anen
t - e
phem
eral
resi
dent
s
2.
0%
Apr 07
Dec 07
Jan 0
8
Febr 08
March 08
Apr 08
Com
Active DispersersPassive Dispersers
Caranavoodaun
1.8 1
2.2 2.
8
4 4.4
4.2
9 6
6
3.8
7.4
8.8
14.2
0%
20%
40%
60%
80%
100%
Apr 07
Dec 07
Jan 0
8
Febr 08
Mar 08
Apr 08
May 08
Com
posi
tion
perm
anen
t - e
phem
eral
resi
dent
s
Active DispersersPassive Dispersers
Termon
4.4
0.6 3.
2 6.4
9
5.2
3.8
3.6
3.8 9.
4
10
3.2
10.4
0 12.2
4.60
4.6
5.4
8 9 13.4
0%
20%
40%
60%
80%
100%
Nov 06
Jan 0
7Apr
07
Jun
07
Dec 07
Jan 0
8
Febr 08
Mar 08
Apr 08
Jun 0
8
Com
posi
tion
perm
anen
t - e
phem
eral
resi
dent
s
Active DispersersPassive Dispersers
Ephemeral Residents
Permanent Residents
Ephemeral Residents
Permanent Residents
Ephemeral Residents
Permanent Residents
Ephemeral Residents
Permanent Residents
Figure 4.3: Temporal changes in the taxon richness of permanent and ephemeral residents in four turloughs. Numbers in stag columns represent the average taxon richness of respective resident groups (n=5 per turlough in each month).
47

0
5
10
15
20
25
30
Dec 07 Jan 08 Febr 08 Mar 08 Apr 08 May 08 Jun 08
Coe
ffici
ent o
f Var
iatio
n (%
)
BlackrockCaranavoodaunRoo WestTermon
a)
0
5
10
15
20
25
Blackrock Caranavoodaun Roo West Termon
Ave
rage
Coe
ffici
ent o
f Var
iatio
n (%
)
b)
Figure 4.4: a) Seasonal variation of coefficient of variation of taxon richness (n=5). b) Seasonal average coefficient of variation of taxon richness during sampling season 2007/2008 per turlough (n=5 in Blackrock and Roo West; n=6 in Caranavoodaun and Termon). Error bars indicate standard error.
48

4.3.2 Temporal Variation in Invertebrate Community Composition and Co-occurrence of Taxa
PERMANOVA analysis revealed a significant effect of time (month of sampling) on
the composition of both the whole community, and the two life-cycle groups in the
four turloughs (Table 4.4). Pair-wise comparisons of the different sampling times in
the four turloughs revealed significant differences in community composition for the
whole community analysis among all months in all turloughs (P<0.05). For the
permanent residents all pair-wise comparisons differed significantly except in
Caranavoodaun, where no significant differences were found between December
2007 and January 2008, or January 2008 and February 2008. Pair-wise comparisons
of ephemeral community structures over time showed significant difference among
almost all months in all turloughs, except December 2007 and January 2008 in Roo
West, and December 2007 and March 2008 in Caranavoodaun
Table 4.4: Results of PERMANOVA testing for the effect of time on community structure for the whole community and different life-cycle groups in turloughs for consecutive sampling months December 07 – April 08 (n=5 per turlough in each month; d.f., degrees of freedom; SS, sum of squares; MS, mean sum of squares).
Groups df SS MS Pseudo-F P(perm)Whole community 4,99 48377 12094 21.033 >0.001Permanent residents 4,99 42276 10569 33.265 >0.001Ephemeral residents 4,99 51837 12959 10.583 >0.001
Co-occurrence analyses revealed a non-random distribution of taxa over time in all
four turloughs (Table 4.5). In Blackrock this was mainly caused by changes in
oligochaete and dipteran species abundances (Table 4.6). Mollusc species were
found only in the first sample of each season (November 2006 and December 2007)
and again in April 2008. Hydrachnidia sp. was found in early samples of the second
year’s season but was not detected after a peak in March 2008. Dissimilarities of
samples varied between 77.2% (November 2006 and January 2007) and 37.2%
(January and February 2008) (Table 4.6). Temporal changes in macroinvertebrate
taxa in Caranavoodaun were characterised by decreasing numbers of oligochaetes
and an increase of trichopteran and dipteran species. Odonata and Ephemeroptera
were only found in late season samples (April 2007 and May 2008), Ostracoda sp.
only between February and April 2008, and bivalves only in May 2008. Coleopteran
species abundances varied throughout the season and were highest in December
49
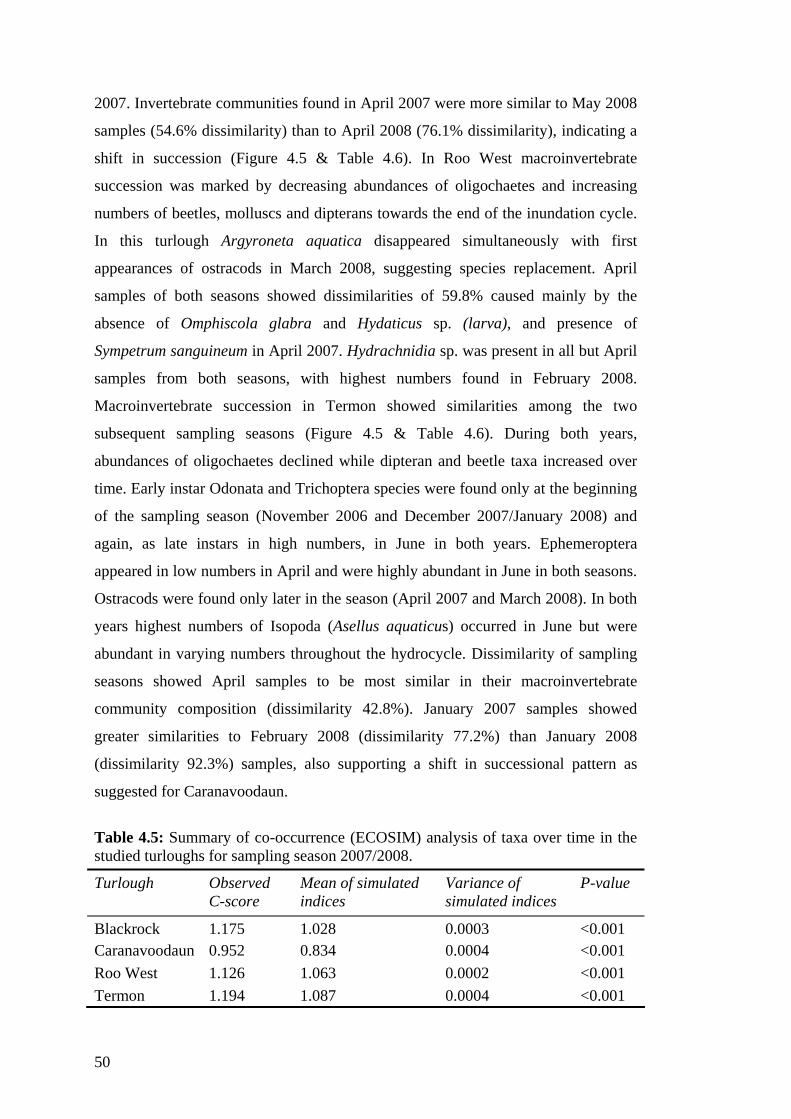
2007. Invertebrate communities found in April 2007 were more similar to May 2008
samples (54.6% dissimilarity) than to April 2008 (76.1% dissimilarity), indicating a
shift in succession (Figure 4.5 & Table 4.6). In Roo West macroinvertebrate
succession was marked by decreasing abundances of oligochaetes and increasing
numbers of beetles, molluscs and dipterans towards the end of the inundation cycle.
In this turlough Argyroneta aquatica disappeared simultaneously with first
appearances of ostracods in March 2008, suggesting species replacement. April
samples of both seasons showed dissimilarities of 59.8% caused mainly by the
absence of Omphiscola glabra and Hydaticus sp. (larva), and presence of
Sympetrum sanguineum in April 2007. Hydrachnidia sp. was present in all but April
samples from both seasons, with highest numbers found in February 2008.
Macroinvertebrate succession in Termon showed similarities among the two
subsequent sampling seasons (Figure 4.5 & Table 4.6). During both years,
abundances of oligochaetes declined while dipteran and beetle taxa increased over
time. Early instar Odonata and Trichoptera species were found only at the beginning
of the sampling season (November 2006 and December 2007/January 2008) and
again, as late instars in high numbers, in June in both years. Ephemeroptera
appeared in low numbers in April and were highly abundant in June in both seasons.
Ostracods were found only later in the season (April 2007 and March 2008). In both
years highest numbers of Isopoda (Asellus aquaticus) occurred in June but were
abundant in varying numbers throughout the hydrocycle. Dissimilarity of sampling
seasons showed April samples to be most similar in their macroinvertebrate
community composition (dissimilarity 42.8%). January 2007 samples showed
greater similarities to February 2008 (dissimilarity 77.2%) than January 2008
(dissimilarity 92.3%) samples, also supporting a shift in successional pattern as
suggested for Caranavoodaun.
Table 4.5: Summary of co-occurrence (ECOSIM) analysis of taxa over time in the studied turloughs for sampling season 2007/2008.
Turlough Observed C-score
Mean of simulated indices
Variance of simulated indices
P-value
Blackrock 1.175 1.028 0.0003 <0.001 Caranavoodaun 0.952 0.834 0.0004 <0.001 Roo West 1.126 1.063 0.0002 <0.001 Termon 1.194 1.087 0.0004 <0.001
50
4.4 Discussion
4.4.1 Invertebrate Succession in Turloughs
Across four turloughs of varying hydrological regime and nutrient status over two
successive years, macroinvertebrate taxon richness and community composition
fluctuated both monthly and annually. An evident shift in the successional pattern of
macroinvertebrate communities was identified from the MDS graph generated for
the most comprehensive data set collected in Termon. The clear picture, which is
also supported by the SIMPER analysis, concurs with trends seen in Caranavoodaun
and Roo West. Macroinvertebrate communities in Caranavoodaun were more
similar between April 2007 and May 2008 compared with April 2008, suggesting a
shift in macroinvertebrate succession. As Roo West was not sampled after April
2008 this trend could not be assessed for this turlough. Nevertheless, dissimilarity of
samples was highest for April comparisons and additional later season samples are
expected to hold more similar macroinvertebrate communities to April 2007
assemblages. The variability in onset of flooding, owing to the comparatively late
start of the rainy season in 2007/2008, most likely caused the observed change in the
successional pattern in the studied turloughs. In autumn/winter 2007 flooding was
observed to start about one month later compared with the proceeding flooding
season, concurring with the detected shift in invertebrate succession.
Two phases of succession could be identified in turloughs during the 2007/2008
sampling season based on invertebrate taxon richness. The two successional phases
were characterized by a change of the ratio of permanent/ephemeral residents
towards an increase of ephemeral taxa later in the season in turloughs
Caranavoodaun, Roo West and Termon. A susceptibility of this successional pattern
to nutrient enrichment was, however, observed in Blackrock (mean seasonal total
phosphorus 52±7.2 s.e. µg L-1). Invertebrate succession in Blackrock showed similar
trends compared with the other three turloughs in the beginning of the flooding
season but changed towards higher abundances of passive dispersers during the last
two sampling months (March and April 2008). The faunal community in Blackrock
was generally dominated by taxa with high tolerances to pollutants such as
oligochaetes and chironomids (BMWP score 1 and 2, respectively). Ephemeral
residents found in March and April 2008 in this turlough were mainly chironomids,
51
which are reported as tolerant to nutrient enrichment (Hellawell, 1986; Rosenberg
and Resh, 1993a). More susceptible ephemeral taxa, such as crane flies (Tipulidae;
BMWP score 5) disappeared towards the end of the season.
The identified successional pattern in the four turloughs studied concurs with
findings by Jocqué et al (2007) which also identified a two-phased hydrocycle in
freshwater rock pools in Botswana. These relatively short lived pools were,
however, dominated by permanent residents throughout the flooding season, but
showed also an increase in ephemeral residents towards the end of the hydrocycle.
In studies on relatively long-lasting temporary aquatic habitats (temporary ponds)
community changes were mainly attributed to variable hatching stages of permanent
residents/passive dispersers from the egg bank compared with the different time of
arrival of active dispersers (Boix et al., 2004; Lahr et al., 1999). In both studies,
succession phases based on taxonomic criteria distinguished three (Boix et al., 2004)
and four (Lahr et al., 1999) successional stages with a trend towards higher
abundances or late appearances of ephemeral insects, towards the end of the
hydroperiod. Wiggins et al. (1980) identified four phases of invertebrate succession
in intermittent woodland ponds in southern Ontario over a 17 year sampling period.
Classification of successional stages was based on survival strategies of species
during the dry periods. Groups 1-3 were taxa which are especially adapted to survive
dry periods, while group 4 was characterized by species susceptible to desiccation,
dispersing to permanent waters prior to the dry phase. Dispersal of ephemeral
residents in temporary waters is not considered to be a random event, as ephemeral
taxa actively select suitable habitats for reproduction, with preferences for sites with
low risk of predation with the help of chemical clues or other stimuli (Berendonk,
1999; Blaustein et al., 2004; Resetarits, 2001). In general, the four turloughs showed
higher abundances of permanent residents such as crustaceans, molluscs or
oligochaetes, which colonize newly filled ponds from dormant stages or refugia,
during the first identified successional phase in both years. Aquatic insects, which
depend on dispersal and migration to survive the dry period and which may need the
presence of permanent taxa to prey on, dominated during the later stage of the
season. While high densities of ephemeral taxa such as Ephemeroptera, Odonata or
Trichoptera species were almost entirely restricted to the end of the season, the
permanent community included both early and later season species.
52

53
A non-random distribution of taxa over time was identified in all four turloughs. The
relative longevity of the turlough hydrocycle (normally several months compared
with e.g. a few weeks in case of temporary rock pools) facilitates importance of
local biotic interactions, and thus increases the possibility of species replacement
(Wellborn et al., 1996). While the temporal variation in some of the taxa recorded
was characterized by changes in their abundance over time, other species only
emerged for a specific time. Ostracoda which are considered passive dispersers and
permanent residents of turloughs were only found in samples later in the season.
Lahr et al. (1999) also found highest densities of ostracods later during a flooding
period, corresponding with a shift towards ephemeral taxa, identifying them as
relatively slow establishing crustaceans. Sympetrum sangiuneum (together with
Lestes dryas and L. sponsa in Caranavoodaun), Cloeon dipterum and C. simile
occurrences were limited to April 2007 in Roo West and Caranavoodaun, but were
also found in May 2008 samples in Caranavoodaun (corresponding to a shift in
successional pattern). In Termon, high numbers of Odonata and Trichoptera species
were present in early season samples (early instar larvae) and only appeared again
together with Ephemeroptera taxa in late season samples in both years. Early season
specimens were probably the early hatched offspring of the preceding
spring/summer population (Nelson and Thompson, 2004) and if early instars
migrated to deeper parts of the turlough they could have been missed with the
littoral zone sampling strategy used in this study. Overall, invertebrate succession in
the four turloughs studied was characterised mainly by a non-random accumulation
of species with some suggestions of species replacement.

Figure 4.5: Multidimensional scaling (MDS) ordinations of macroinvertebrate communities over two successive sampling periods in four turloughs. Trajectories are indicating the chronological sequence of samples.
Macroinvertebrate Succession in CaranavoodaunTransform: Log(X+1)Resemblance: S17 Bray Curtis similarity
TimeDec 07Jan 08Febr 08Mar 08Apr 08Apr 07May 08Centroid
Dec 07Jan 08Febr 08
Mar 08
Apr 08
May 08
Apr 07
2D Stress: 0.13
Macroinvertebrate Succession in BlackrockTransform: Log(X+1)Resemblance: S17 Bray Curtis similarity
TimeNov 06Jan 07Dec 07Jan 08Febr 08Mar 08Apr 08Centroid
Nov 06
Jan 07
Dec 07Jan 08
Febr 08
Mar 08
Apr 08
2D Stress: 0.14
Macroinvertebrate Succession in Roo West
54
Transform: Log(X+1)Resemblance: S17 Bray Curtis similarity
TimeApr 07Dec 07Jan 08Febr 08March 08April 08Centroid
Apr 07
Dec 07
Jan 08
Febr 08
Mar 08
Apr 08
2D Stress: 0.14
Macroinvertebrate Succession in TermonTransform: Log(X+1)Resemblance: S17 Bray Curtis similarity
TimeNov 06Jan 07Apr 07June 07Dec 07Jan 08Febr 08March 08Apr 08June 08Centroid
2D Stress: 0.13
Jun 08
Dec 07
Nov 06
Jun 07
Jan 08
Jan 07
Apr 07
Febr 08
Apr 08
Mar 08
54
4.4.2 Influence of Disturbance on Invertebrate Communities
The dry phase of a turlough, as well as relatively rapid changes in water levels
owing to a high areal reduction rate is an ecological disturbance (Schneider et al.,
1996; Sousa, 1984; White et al., 1985). Thus, Blackrock, the turlough with the
shortest hydroperiod and the highest areal reduction rate can be regarded as the most
disturbed turlough studied. Community composition identified in this turlough
concur with findings by Wiggins (1980) who found highly disturbed temporary
waters to have a community structure characterised mainly by permanent residents,
which are able to cope with recurring stresses. Schneider and Frost (1996)
furthermore postulated that year to year changes in taxa composition are interlinked
with interannual variability of hydroperiod. Thus, highly disturbed habitats will
foster invertebrate community structures dominated by permanent residents after dry
years, and higher abundances of ephemeral residents after relatively wet ones. The
data support this assumption as macroinvertebrate assemblages of Blackrock
showed generally higher proportions of permanent residents together with lower
taxon richness during the first sampling season in 2006/2007, following an
exceptionally dry summer when compared with samples taken during the second
field season with a preceding wet summer.
Variation in taxon richness generally decreased in all turloughs towards the end of
the sampling season, conforming with stabilising macroinvertebrate communities
over time following major disturbance. The increase of variability in taxon richness
in March/April 2008 coincided with the draining of turloughs, once more supporting
the influence of disturbance on macroinvertebrate communities. Furthermore, an
inverse relationship of increasing hydroperiod/decreased disturbance regime on
variability in taxon richness was evident, with lowest average seasonal variability in
Termon. High disturbances, caused by rapid changes in water level in Blackrock can
be associated with persistent high monthly, and highest overall, seasonal variability
in taxon richness. Owing to rapidly lowering water levels and likely desiccation of
invertebrates during the sampling cycle, succession of invertebrates was possibly
repeatedly set back towards initial colonization processes, reducing progress to
stability for the invertebrate community in Blackrock. Ward and Blaustein (1994)
identified flash floods in Negev Dessert pools as overriding importance for
55

invertebrate communities, leading to a multiple restart of colonization of pools. With
increasing habitat existence, the importance of disturbance becomes less and finally,
as abiotic stress decreases, biotic interactions become increasingly important
(Schneider, 1999). Temporary wetlands with a relatively long hydroperiod are,
therefore, expected to show a stabilization of invertebrate communities over time
owing to inter alia increased potential of niche development (Jocqué et al., 2007). In
contrast, in frequently disturbed environments physical stress and species
adaptations to their environment dominate the formation of the faunal matrix
(Schneider et al., 1996). The influence of the occurrence of droughts furthermore
depends on the individual disturbance regime of wetlands (Schneider et al., 1996).
Thus, regularly disturbed turloughs such as Blackrock show high variability in taxon
richness for the entire flooding cycle owing to constantly recurring disturbances,
while variability of faunal communities in turloughs with a longer hydroperiod/low
disturbance will be greater immediately after the disturbance associated with the
start of the flooding season.
High disturbance, demonstrated by short hydroperiod, had an adverse influence on
taxon richness. Termon, the turlough with the lowest disturbance regime, usually
had highest monthly and additionally average seasonal taxon richness. Average
seasonal taxon richness was lowest in Blackrock, the turlough with the shortest
duration of flooding. This is in agreement with several studies on the influence of
hydroperiod on macroinvertebrate taxon richness in temporary wetlands (Collinson
et al., 1995; Kiflawi et al., 2003; Schneider et al., 1996; Waterkeyn et al., 2008;
Williams et al., 2003). The results furthermore indicate that the additional
disturbance of high areal reduction rates has an adverse effect on taxon richness.
Respective hydrological regimes are associated with rapid changes in water levels,
which predominantly depend on the mode of filling and emptying, topographical
conditions and recharge events associated with rainfall (Coxon and Drew, 1986;
Tynan et al., 2005). In Blackrock the change in water level can account for up to 9m
in 48h, owing to its filling via surface waters and its location in an epikarstic flow
system (Sheehy Skeffington et al., 2006), which is reported to be associated with
multimodal flood events (Tynan et al., 2005). Recurring disturbances like these
favour the abundance of taxa, such as chironomids, with short life cycles or high
reproductive rates, which can cope with constant changes in the littoral zone
56

(Hershey and Lamberti, 2001), as found in Blackrock. Across the turloughs, taxon
richness generally increased over time, suggesting a temporal gradient of
biodiversity. The longer a habitat exists during a flooding season, the longer the
exposure for colonization and emergence from resting stages, which increases the
opportunity for a more diverse macroinvertebrate community (Cayrou and
Céréghino, 2005; Holland et al., 1998; Spencer et al., 1999). This results in higher
species richness and densities of macroinvertebrates following disturbance over time
(Holland et al., 1998).
4.5 Conclusions
Although turloughs support varied and unpredictable faunal communities, this study
suggests a similarity in following general patterns observed in other ephemeral
wetlands. Well adapted early season species take advantage of the habitat before the
community diversifies and, in case of suitable low disturbance pressures, possible
predatory species appear. The species which arrive in the late successional stage are
mainly migrants and do not possess adaptations to drought. These general patterns
appear vulnerable to trophic regimes and changes in hydroperiod. Climate change is
expected to alter turlough hydrology and in turn lead to disruption in the observed
successional patterns by changing invertebrate distribution, population dynamics
and biotic interactions. This could have major implications for the long term
persistence of the highly specialized fauna which is a feature of turloughs. Changes
of local weather conditions associated with climate change seem to be inevitable
(McElwain and Sweeney, 2007; Sweeney et al., 2003) and are already starting to
become evident through increased variability in rainfall patterns from year to year.
Climate change will increase the number and intensity of stressors affecting turlough
ecosystems. Thus, management which reduces already existing stressors, such as
nutrient enrichment from land use or drainage is necessary in order to reduce
anthropogenic pressures on turloughs. Effectiveness of monitoring to support
conservation management needs to account for temporal variability. This includes
adapting monitoring to varying onset of flooding rather than more traditionally
spaced sampling. Macroinvertebrate communities observed in one particular month
are likely to differ from year to year in response to rainfall patterns. Furthermore,
life stages of macroinvertebrate taxa need to be considered in monitoring
programmes as most univoltine ephemeral taxa emerge in spring/summer (Solimini
57

et al., 2006). In case sampling can only be conducted during one particular season,
late season (late spring/early summer) sampling should be avoided as this could lead
to an underestimation of biodiversity or misinterpretation of macroinvertebrate
communities of turloughs. Taxa such as Ephemeroptera or Trichoptera generally
considered sensitive to anthropogenic disturbance could have already emerged.
Single season sampling could moreover overlook species with short life-cycles or
egg-diapause periods. Adequate turlough sampling, thus, needs to be aligned with
the starting of the turlough flooding season and suitably temporally stratified, with
timing and frequency of sampling depending on the question addressed by
respective sampling protocols.
58

Table 4.6: Summary results from SIMPER analysis showing cumulative contribution (Cum%) of three most important contributing taxa to sample dissimilarities in % (n=5 per month in each turlough).
Blackrock Roo West Groups Nov 06 & Jan 07 Groups Dec 07 & Jan 08 Average dissimilarity = 77.16 Average dissimilarity = 53.16
(Higher) (Higher) Species Cum.% presence
Species Cum.% presence
Oligochaeta sp. 33.88 Nov Oligochaeta sp. 23.13 Dec Tipulidae sp. 50.74 only Jan Agyroneta aquatica 38.27 Jan Succinea sp. 61.8 only Nov Ceratopogonidae sp. 47.86 only Dec Groups Jan 07 & Jan 08 Groups Jan 08 & Febr 08 Average dissimilarity = 69.29 Average dissimilarity = 61.89
(Higher) (Higher) Species Cum.% presence
Species Cum.% presence
Oligochaeta sp. 24.4 Jan 08 Hydrachnidia sp. 19.37 Feb Chironomidae sp. 45.67 Jan 08 Graptodytes bilineatus 29.34 only Feb Hydrachnidia sp. 58.55 Jan 08 Tipulidae sp. 38.27 Feb Groups Dec 07 & Jan 08 Groups Febr 08 & March 08 Average dissimilarity = 43.57 Average dissimilarity = 58.80
(Higher) (Higher) Species Cum.% presence
Species Cum.% presence
Oligochaeta sp. 12.97 Dec Diptera Pupae 11.06 only Mar Velia sp. 25.86 only Dec Ostracoda sp. 21.81 only Mar Tipulidae sp. 38 Dec Agyroneta aquatica 29.48 only Feb Groups Jan 08 & Febr 08 Groups Apr 07 & April 08 Average dissimilarity = 37.19 Average dissimilarity = 59.84
(Higher) (Higher) Species Cum.% presence
Species Cum.% presence
Tipulidae sp. 28.4 Feb Omphiscola glabra 12.04 only Apr 08 Chironomidae sp. 43.56 Feb Hydaticus sp. (larva) 22.53 only Apr 08 Hydrachnidia sp. 58.1 Feb Zonitoides sp. 29.45 only Apr 08 Groups Febr 08 & Mar 08 Groups March 08 & April 08 Average dissimilarity = 52.46 Average dissimilarity = 56.09
(Higher) (Higher) Species Cum.% presence
Species Cum.% presence
Hydrachnidia sp. 16.07 Only Feb Hydaticus sp. (larva) 11.27 only Apr Tipulidae sp. 30.55 Feb Omphiscola glabra 21.22 Apr Ostracoda sp. 44.37 only Mar Graptodytes bilineatus 30 only Mar Groups Mar 08 & Apr 08 Average dissimilarity = 48.71
(Higher) Species Cum.% presence
Succinea sp. 16.84 only Apr Galba truncatula 29.07 only Apr Agabus sp. (larva) 38.08 only Mar
59

Table 4.6 (Contd.): Summary results from SIMPER analysis showing cumulative contribution (Cum%) of three most important contributing taxa to sample dissimilarities in % (n=5 per month in each turlough). Caranavoodaun Termon Groups Dec 07 & Jan 08 Groups Jan 07 & Febr 08 Average dissimilarity = 53.20 Average dissimilarity = 77,19
(Higher) (Higher) Species Cum.% presence
Species Cum.% presence
Limnephilidae sp. Instar III 10.86 only Jan Oligochaeta sp. 25,19 Feb 08 Oligochaeta sp. 20.05 Jan Asellus aquaticus 40,97 only Feb 08 Berosus signaticollis 28.14 only Dec Chironomidae sp. 49,53 Feb 08 Groups Jan 08 & Febr 08 Groups Jan 07 & Apr 07 Average dissimilarity = 45.34 Average dissimilarity = 86,56
(Higher) (Higher) Species Cum.% presence
Species Cum.% presence
Oligochaeta sp. 12.71 Feb Oligochaeta sp. 17,93 Apr Limnephilidae sp. Instar III 25.24 only Jan Chironomidae sp. 34,83 Apr Chironomidae sp. 32.57 Jan Ostracoda sp. 46,06 only Apr Groups Febr 08 & Mar 08 Groups Apr 07 & June 07 Average dissimilarity = 57.21 Average dissimilarity = 61,05
(Higher) (Higher) Species Cum.% presence
Species Cum.% presence
Ostracoda sp. 18.87 Mar Cloeon simile 14,88 June Oligochaeta sp. 30.13 Feb Sympetrum sanguineum 21,64 only June Agabus sp. (larva) 38.42 Mar Porhydrus sp. (larva) 28,07 only June Groups Mar 08 & Apr 08 Groups Dec 07 & Jan 08 Average dissimilarity = 47.50 Average dissimilarity = 72,04
(Higher) (Higher) Species Cum.% presence
Species Cum.% presence
Limnephilus centralis 8.56 only Apr Anisoptera sp. larvae 18,58 Dec Ostracoda sp. 15.48 Mar Galba truncatula 29,09 only Dec Graptodytes bilineatus 21.76 Mar Limnephilidae sp. Instar I 38,18 only Dec Groups Apr 08 & May 08 Groups Jan 08 & Febr 08 Average dissimilarity = 74.76 Average dissimilarity = 54,24
(Higher) (Higher) Species Cum.% presence
Species Cum.% presence
Sympetrum sanguineum 9.89 only May Tipulidae sp. 11,64 only Feb Pisidium/Sphaerium sp. 16.79 only Apr Isotomidae sp. 23,14 Jan Cloeon dipterum 23.1 only May Oligochaeta sp. 32,50 Feb Groups Apr 08 & Apr 07 Groups Febr 08 & March 08 Average dissimilarity = 76.10 Average dissimilarity = 44,01
(Higher) (Higher) Species Cum.% presence
Species Cum.% presence
Sympetrum sanguineum 12.67 only Apr 07 Asellus aquaticus 10,44 Feb Anisoptera sp. (larva) 20.69 only Apr 07 Ostracoda sp. 18,95 only Mar Culicidae sp. 28.55 only Apr 07 Tipulidae sp. 27,16 Feb
60
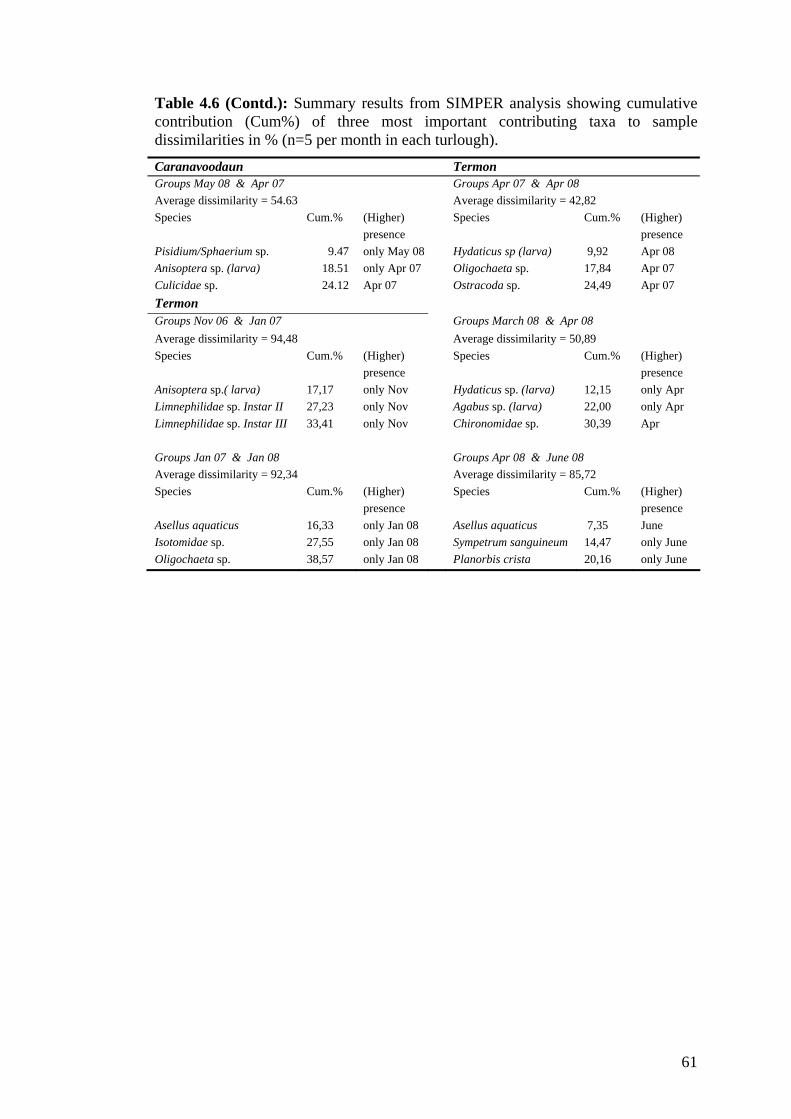
Table 4.6 (Contd.): Summary results from SIMPER analysis showing cumulative contribution (Cum%) of three most important contributing taxa to sample dissimilarities in % (n=5 per month in each turlough). Caranavoodaun Termon Groups May 08 & Apr 07 Groups Apr 07 & Apr 08 Average dissimilarity = 54.63 Average dissimilarity = 42,82
(Higher) (Higher) Species Cum.% presence
Species Cum.% presence
Pisidium/Sphaerium sp. 9.47 only May 08 Hydaticus sp (larva) 9,92 Apr 08 Anisoptera sp. (larva) 18.51 only Apr 07 Oligochaeta sp. 17,84 Apr 07 Culicidae sp. 24.12 Apr 07 Ostracoda sp. 24,49 Apr 07 Termon Groups Nov 06 & Jan 07 Groups March 08 & Apr 08 Average dissimilarity = 94,48 Average dissimilarity = 50,89
(Higher) (Higher) Species Cum.% presence
Species Cum.% presence
Anisoptera sp.( larva) 17,17 only Nov Hydaticus sp. (larva) 12,15 only Apr Limnephilidae sp. Instar II 27,23 only Nov Agabus sp. (larva) 22,00 only Apr Limnephilidae sp. Instar III 33,41 only Nov Chironomidae sp. 30,39 Apr Groups Jan 07 & Jan 08 Groups Apr 08 & June 08 Average dissimilarity = 92,34 Average dissimilarity = 85,72
(Higher) (Higher) Species Cum.% presence
Species Cum.% presence
Asellus aquaticus 16,33 only Jan 08 Asellus aquaticus 7,35 June Isotomidae sp. 27,55 only Jan 08 Sympetrum sanguineum 14,47 only June Oligochaeta sp. 38,57 only Jan 08 Planorbis crista 20,16 only June
61

62
5 Spatial Variability of Macroinvertebrates in Turloughs
5.1 Introduction
The littoral environment of freshwater ecosystems is heterogeneous (Hall et al.,
1992; Pickett and White, 1985; Wetzel, 2001), owing to a variety of physical,
chemical and biotic interactions. This can lead to a high variability of animals in
space (Downes et al., 1993) and has caused concern over the meaningfulness of
littoral invertebrate data collected in freshwater ecosystems (Harrison and Hildrew,
1998). Habitat heterogeneity poses a challenge to the collection of representative
samples, with potentially far reaching effects on effectiveness of monitoring
protocols. Ecological assessment and monitoring are based on the assumption of
adequate representation of each sampling site. Understanding and evaluation of
natural spatial heterogeneity in macroinvertebrate assemblages in turloughs is
therefore essential for the development of adequate biomonitoring, as required under
the European Water Framework Directive (WFD) (EC, 2000) and the EC Habitats
Directive (EEC, 1992). Without this, it is impossible to detect anthropogenic
disturbances with confidence (Johnson, 1998; Trigal et al., 2006).
Macroinvertebrate spatial variation has been studied in lakes in relation to habitat
and trophic status (Brodersen et al., 1998; Tolonen et al., 2001; White and Irvine,
2003). Results of these studies emphasized the need for habitat stratification in
among-lake comparisons, especially when the purpose of monitoring is the detection
of pressure gradients. Differences in macroinvertebrate communities at multiple
spatial scales have been detected in oligotrophic lakes in New Zealand (Stoffels et
al., 2005; Weatherhead and James, 2001) and among habitats in 16 Swedish lakes
(Johnson, 1998). White and Irvine (2003) found distinct clusters of
macroinvertebrate samples collected from 15 visually distinct habitats in lakes of a
wide range of trophic status in Ireland. The same study, furthermore, found paired
samples from contrasting habitats of pebble/cobble and macrophyte-dominated
mesohabitats of 21 lakes to have greater similarity within than among lakes and
concluded that variation within lakes was nested in among lake variation across a
range of lakes. Studies in wetlands including temporary ponds, however, have rather
concentrated on the influence of hydroperiod (Brooks, 2000; Collinson et al., 1995;
63
Solimini et al., 2005) on invertebrate communities and only few studies have dealt
with the implications of spatial variation for the biological assessment of ponds
(Della Bella et al., 2005; García-Criado et al., 2005).
The spatial patterns of macroinvertebrate communities in Irish turloughs, in the
context of biomonitoring, have not been examined. The littoral zone of turloughs
can comprise different habitat types (i.e. grassland, limestone pavement, stone walls,
reed stands) but the dominant habitat in the majority of turloughs is
flooded/submerged grassland. The underlying assumption in ecological assessment
programmes is that samples effectively discriminate among lakes, albeit in this case,
temporary ones. Meaningful ecological surveys for the very variable and dynamic
turlough environments require cost and time effective sampling.
The aim of this chapter was to determine spatial variability of turlough
macroinvertebrate communities within and between-habitats. It tests the adequacy
that a single grassland habitat sample collected at any location of a turlough is
representative of the entire macroinvertebrate community. Spatial variation was
investigated on two different spatial scales. First, two different habitats were
sampled in order to examine variability of macroinvertebrates between habitats.
Second, a number of replicate samples were collected in the dominant habitat type
(submerged grassland) from different sites within a turlough to investigate the
within-habitat variation of macroinvertebrate communities.
5.2 Methods
5.2.1 Study Sites and Macroinvertebrate Sampling
Two different habitat types comprising short, totally submerged grassland (height
<10 cm) and long, emergent grassland (emerging over the water surface >30 cm)
were sampled in two turloughs, Brierfield and Lisduff, in April 2007 in order to
study between-habitat variability of macroinvertebrate communities in turloughs.
Both habitats were sampled at 30-40 cm water depth in each turlough, with habitats
in Brierfield dominated by Glyceria fluitans and in Lisduff by Agrostis stolonifera.
The two habitats will subsequently be referred to as submerged and emergent
grassland.
64
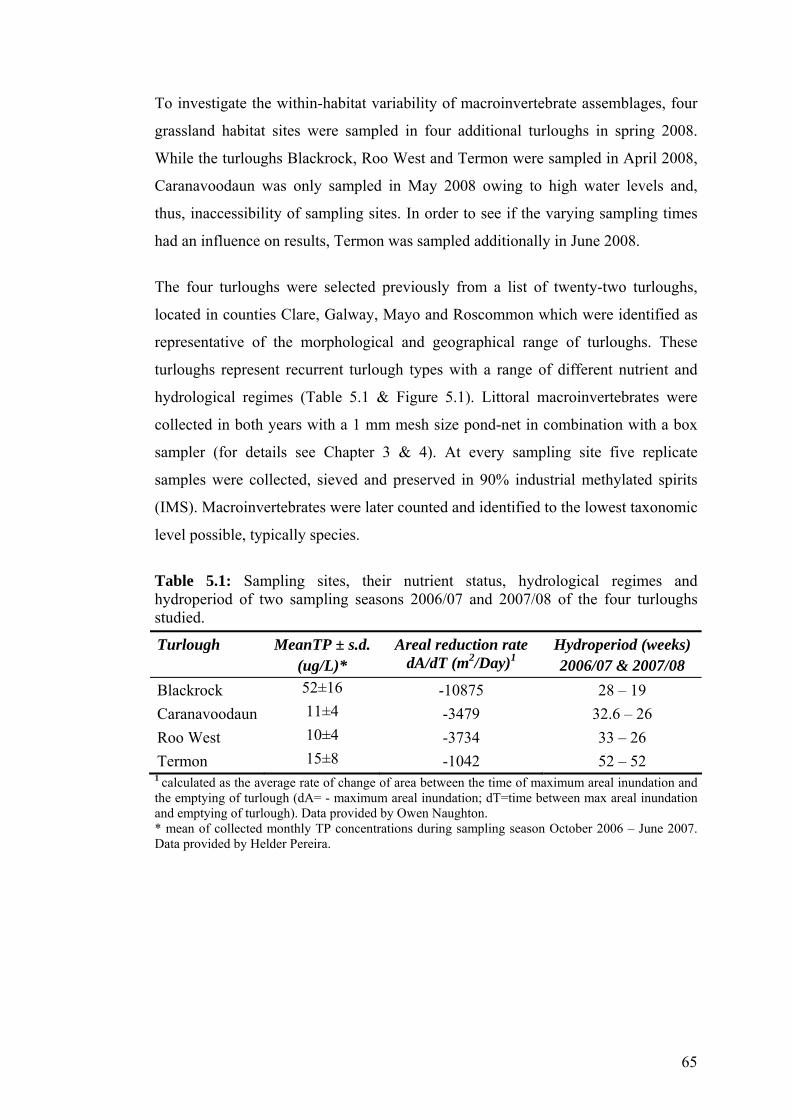
65
To investigate the within-habitat variability of macroinvertebrate assemblages, four
grassland habitat sites were sampled in four additional turloughs in spring 2008.
While the turloughs Blackrock, Roo West and Termon were sampled in April 2008,
Caranavoodaun was only sampled in May 2008 owing to high water levels and,
thus, inaccessibility of sampling sites. In order to see if the varying sampling times
had an influence on results, Termon was sampled additionally in June 2008.
The four turloughs were selected previously from a list of twenty-two turloughs,
located in counties Clare, Galway, Mayo and Roscommon which were identified as
representative of the morphological and geographical range of turloughs. These
turloughs represent recurrent turlough types with a range of different nutrient and
hydrological regimes (Table 5.1 & Figure 5.1). Littoral macroinvertebrates were
collected in both years with a 1 mm mesh size pond-net in combination with a box
sampler (for details see Chapter 3 & 4). At every sampling site five replicate
samples were collected, sieved and preserved in 90% industrial methylated spirits
(IMS). Macroinvertebrates were later counted and identified to the lowest taxonomic
level possible, typically species.
Table 5.1: Sampling sites, their nutrient status, hydrological regimes and hydroperiod of two sampling seasons 2006/07 and 2007/08 of the four turloughs studied.
Turlough MeanTP ± s.d. (ug/L)*
Areal reduction rate dA/dT (m2/Day)1
Hydroperiod (weeks) 2006/07 & 2007/08
Blackrock 52±16 -10875 28 – 19 Caranavoodaun 11±4 -3479 32.6 – 26 Roo West 10±4 -3734 33 – 26 Termon 15±8 -1042 52 – 52
1 calculated as the average rate of change of area between the time of maximum areal inundation and the emptying of turlough (dA= - maximum areal inundation; dT=time between max areal inundation and emptying of turlough). Data provided by Owen Naughton. * mean of collected monthly TP concentrations during sampling season October 2006 – June 2007. Data provided by Helder Pereira.

Figure 5.1: Map of Ireland showing the location of the six turloughs studied.
Co. Galway
Co. Roscommon
Co. Clare Termon
Lisduff
Roo WestBlackrock
Brierfield
Caranavoodaun
Co. Galway
Co. Roscommon
Co. Clare Termon
Lisduff
Roo WestBlackrock
Brierfield
Caranavoodaun
66
66

5.2.2 Statistical Analysis
Statistical analysis tested for between-habitat (Brierfield and Lisduff) and within-
habitat differences (Blackrock, Caranavoodaun, Roo West and Termon) in
macroinvertebrate community structures.
A one-way analysis of variance (ANOVA) was used to test for significant
differences in taxon richness between habitats in the two turloughs Lisduff and
Brierfield and between the four grassland habitat sites sampled in the four turloughs
Blackrock, Caranavoodaun, Roo West and Termon. All replicate samples were
included in the analysis (n=5 per habitat and per site in each turlough). The degree
of variability of taxon richness within replicate samples was estimated by the
coefficient of variation (CV):
CV = s.d. / X * 100
Hierarchical Cluster Analysis and non-metric multidimensional scaling (MDS)
tested for similarities of macroinvertebrate community structures across habitats and
grassland sampling sites. Both ordination methods were based on log(x+1)
transformed invertebrate abundance data and presence/absence data using a Bray-
Curtis similarity matrix. Clusters were formed using the group average linkage
method and the similarity profile (SIMPROF) permutation test was incorporated into
the Cluster Analysis using 999 simulation permutations. SIMPROF tests the null
hypothesis that a certain set of samples which are a priori unstructured do not differ
from each other in multivariate space (Clarke and Gorley, 2006). Differences in
community composition between habitats were, furthermore, analyzed using the
similarity percentages routine SIMPER (PRIMER® 6). By decomposing Bray-
Curtis similarities among all pairs of samples, within defined groups (in this case
habitats in each turlough), SIMPER computes the percentage contributions of
individual species to respective group differences (Clarke and Warwick, 2001).
67

5.3 Results
5.3.1 Between-Habitat Variability
Taxon richness did not vary significantly between habitats sampled in April 2007 in
turloughs Lisduff and Brierfield (one-way ANOVA: F1,9=1.33 and F1,9=0.02 in
Lisduff and Brierfield, respectively; P non significant in both cases) with highest
average taxon richness found in submerged grassland in Lisduff (15.2±1.04 s.e.;
n=5) (Table 5.2). Variability in taxon richness was highest in emergent grassland in
Lisduff (C.V.=23.7%) and lowest among emergent grassland in Brierfield
(C.V.=12.5%).
Table 5.2: Summary statistics of total taxa recovered from each habitat (s.g.=submerged grass; e.g.=emergent grass) in two turloughs, minimum, maximum and average taxon richness recovered from a single sample and coefficient of variation (C.V.) of taxon richness (n=5 per habitat). Samples collected in April 2007.
Turlough Habitat Total Minimum Maximum Average ± S.E. C.V. (%) Lisduff s.g. 31 12 20 15.2 ± 1.04 19.4 Lisduff e.g. 26 9 17 13.0 ± 1.11 23.7 Brierfield s.g. 26 11 17 13.4 ± 0.94 19.5 Brierfield e.g. 25 11 15 13.2 ± 0.59 12.5
Hierarchical cluster analysis in combination with the SIMPROF-test detected
significant differences in community structure between habitat type in Brierfield
(π=4.58; P<0.001 for log(x+1) transformed abundance data) and between turloughs
(π=6.72; P<0.001 for log(x+1) transformed abundance data) in both, the log(x+1)
transformed total abundance and the presence/absence data set. No significant
differences were found between habitats in Lisduff (Figure 5.2a) in both data sets.
The results were supported by the MDS plot generated for the same
macroinvertebrate abundance and presence/absence data, showing higher variability
between habitats in Brierfield than in Lisduff (Figure 5.2b). Both results indicate
that within turlough variability in invertebrate community composition is nested
within turlough variability. As log(x+1) transformed total abundance and
presence/absence data achieved similar results in both ordination methods, only
hierarchical cluster dendograms and MDS graphs of the log(x+1) transformed total
abundance macroinvertebrate data are subsequently presented.
68

Group average
Lisd
uff s
.g. 1
Lisd
uff s
.g. 3
Lisd
uff s
.g. 2
Lisd
uff s
.g. 5
Lisd
uff e
.g. 5
Lisd
uff e
.g. 1
Lisd
uff e
.g. 3
Lisd
uff e
.g. 2
Lisd
uff s
.g. 4
Lisd
uff e
.g. 4
Brie
rfiel
d s.
g. 1
Brie
rfiel
d s.
g. 2
Brie
rfiel
d s.
g. 4
Brie
rfiel
d s.
g. 3
Brie
rfiel
d s.
g. 5
Brie
rfiel
d e.
g. 2
Brie
rfiel
d e.
g. 3
Brie
rfiel
d e.
g. 4
Brie
rfiel
d e.
g. 1
Brie
rfiel
d e.
g. 5
Samples
100
80
60
40
20S
imila
rity
Transform: Log(X+1)Resemblance: S17 Bray Curtis similarity
Sprfgpsabc
a)
Transform: Log(X+1)Resemblance: S17 Bray Curtis similarity
Turlough-habitatLisduff s.g.Lisduff e.g.Brierfield s.gBrierfield e.g.
2D Stress: 0.05
b)
Figure 5.2: a) Hierarchical cluster analysis dendogram and b) MDS plot of macroinvertebrate species log(x+1) transformed total abundance data from submerged (s.g.) and emergent grassland habitat (e.g.) in Brierfield and Lisduff (n=5 per habitat; n=10 per turlough) (Sprfgps = SIMPROF-groups identified using SIMPROF-test).
69

Greater dissimilarity of macroinvertebrate community structures was identified
between habitats in Brierfield (Table 5.3). While the majority of the predominant
invertebrate species occurred in both habitats in differing abundances, some taxa
showed preferences for one particular habitat type. For example, Berosus
signaticollis was recovered only from submerged grassland in Lisduff, whereas
Argyroneta aquatica was only collected from emergent grassland and Omphiscola
glabra only from submerged grassland habitat in Brierfield.
Table 5.3: Summary results from SIMPER analysis showing cumulative contribution (Cum%) of contributing taxa to habitat (submerged grassland=s.g.; emergent grassland=e.g.) dissimilarities (in %) (only first 10 contributing species are presented) (n=5 per habitat).
Lisduff submerged grass & Lisduff emergent grass
Brierfield submerged grass & Brierfield emergent grass
Average dissimilarity = 33.47 Average dissimilarity = 50.44 Species Cum.% higher
presenceSpecies Cum.% higher
presence Graptodytes bilineatus 9.36 s.g. Agyroneta aquatica 9.89 only e.g. Limnephilus centralis 15.11 s.g. Agabus sp. (larvae) 17.75 s.g. Berosus signaticollis 20.36 only s.g. Omphiscola glabra 25.28 only s.g. Oligochaeta sp. 25.05 e.g. Ostracoda sp. 31.74 s.g. Hydrachnidia sp. 29.29 e.g. Halticinae sp. 38.16 e.g. Polycelis nigra/tenuis 33.52 s.g. Graptodytes bilineatus 43.76 s.g. Sympetrum sanguineum 37.49 s.g. Dryops sp. (larvae) 49.06 e.g. Asellus aquaticus 41.3 s.g. Culicidae sp. 53.97 s.g. Chironomidae sp. 44.9 e.g. Chironomidae sp. 58.09 s.g. Culicidae sp. 48.36 s.g. Rhantus sp. (larvae) 62.18 e.g.
70

5.3.2 Within-Habitat Variability
Average taxon richness in grassland habitat samples (n=20 per turlough) sampled
between April and June 2008 varied among turloughs (Table 5.4). Highest average
taxon richness was found in Caranavoodaun (18.7±0.5 s.e.) sampled in May 2008
and Termon (26±0.97 s.e.) in June 2008, suggesting an increase of taxon richness
over time of flooding.
Table 5.4: Summary statistics of total, minimum, maximum and average taxon richness found in four grassland sites in four turloughs (n=20 in each turlough).
Turlough Total Minimum Maximum Average ± S.E. Blackrock 17 4 10 6.8 ± 0.57 Caranavoodaun 48 15 24 18.7 ± 0.5 Roo West 29 8 15 11.4 ± 0.31 Termon (April) 48 9 17 13.1 ± 0.28 Termon (June) 57 21 33 26 ± 0.97
No significant difference in taxon richness was found among the four grassland
habitat sites in Caranavoodaun (May 2008), Roo West (April 2008) and Termon
(April 2008). However, taxon richness varied significantly among sampling sites in
Blackrock and Termon collected in June 2008 (Table 5.5).
Table 5.5: One-way ANOVA results examining the differences in taxon richness among sites in the four turloughs studied (n=5 per site; n=20 per turlough and sampling month).
Turlough SS df MS F P Post hoc Blackrock 37.4 3 12.5 7.55 0.002 1,3 * 4 Caranavoodaun 28.6 3 9.5 1.23 0.332 Roo West 11.4 3 3.8 1.63 0.223 Termon (April 08) 8.9 3 3.0 0.48 0.702 Termon (June 08) 108.4 3 36.1 5.58 0.008 2,3 * 4
71

Variability in taxon richness among replicate samples was highest in site one in
Blackrock (C.V.=25%) and lowest in site one in Termon in June 2008 (C.V.=5.9%)
indicating a negative correlation of variability with increasing hydroperiod (Figure
5.3). The average coefficient of variation per turlough was also highest in Blackrock
and lowest in Termon in June 2008 (C.V.=9.2%). The decrease in variability in
Termon from 13% in April 2008 to 9.2% two months later, furthermore, concurs
with a stabilisation of the invertebrate community over time.
0
5
10
15
20
25
30
Blackrock Caranavoodaun Roo West Termon (April) Termon (June)
Coe
ffici
ent o
f var
iatio
n (%
)
Site 1Site 2Site 3Site 4Average
Figure 5.3: Coefficient of variation (C.V.) of replicate samples per site per turlough and average C.V. per turlough ± s.e. (n=5 per site; n=20 per average in each turlough). Turlough order is ranked according to hydroperiod.
The SIMPROF test, which was incorporated in the hierarchical cluster analysis,
identified no significant differences among samples from different grassland
sampling sites in turloughs sampled in April 2008 (Figures 5.4a, 5.6a & 5.7a) using
both, log(x+1) transformed total abundance and presence/absence data. These results
were supported by those from the non-metric multidimensional scaling (MDS)
equally using both data sets (Figures 5.4b, 5.6b & 5.7b). However, samples collected
72

at different grassland sites in Caranavoodaun in May 2008 and Termon in June 2008
separated samples into two significantly different groups identified by the
SIMPROF test employing log(x+1) transformed abundance data (Caranavoodaun:
π=1.64, P<0.01; Termon: π=0.7, P<0.01) (Figure 5.5a & 5.8a). The clustering of
sites was also apparent in the respective MDS plots (Figure 5.5b & 5.8b). No
significant difference was found among grassland sampling sites in the same
turloughs using presence/absence data, highlighting the importance of
macroinvertebrate abundance for the separation of sites. The MDS plot generated
using log(x+1) transformed abundance data of all grassland habitat
macroinvertebrate samples collected in each turlough (n=20 per turlough) revealed
that invertebrate community structures within the turloughs were, nevertheless,
highly distinct. Samples clustered closely together with no overlap among turloughs
(Figure 5.9). Similar results were obtained using the presence/absence data set.
Significant differences among turloughs were identified using the SIMPROF-test
(cluster diagram not shown here). The MDS plot revealed a closer clustering of
turloughs sampled in the same month (April 2008) compared with later samples
collected in May 2008 and June 2008, indicating a spatio-temporal interaction in
invertebrate community structure (Figure 5.9).
73
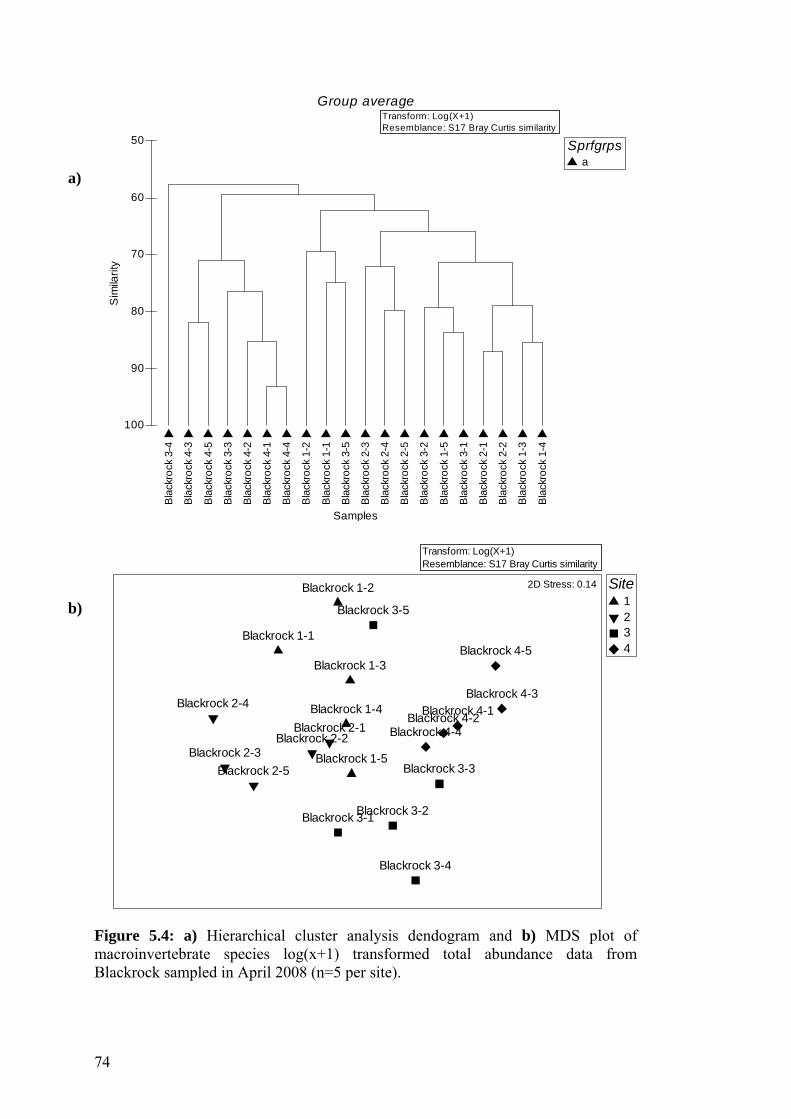
Group averageTransform: Log(X+1)Resemblance: S17 Bray Curtis similarity
100
90
80
70
60
50
Sim
ilarit
y
Sprfgrpsa
a) B
lack
rock
3-4
Bla
ckro
ck 4
-3
Bla
ckro
ck 4
-5
Bla
ckro
ck 3
-3
Bla
ckro
ck 4
-2
Bla
ckro
ck 4
-1
Bla
ckro
ck 4
-4
Bla
ckro
ck 1
-2
Bla
ckro
ck 1
-1
Bla
ckro
ck 3
-5
Bla
ckro
ck 2
-3
Bla
ckro
ck 2
-4
Bla
ckro
ck 2
-5
Bla
ckro
ck 3
-2
Bla
ckro
ck 1
-5
Bla
ckro
ck 3
-1
Bla
ckro
ck 2
-1
Bla
ckro
ck 2
-2
Bla
ckro
ck 1
-3
Bla
ckro
ck 1
-4
Samples
Transform: Log(X+1)Resemblance: S17 Bray Curtis similarity
Site
Blackrock 4-5
2D Stress: 0.14Blackrock 1-21b) Blackrock 3-5 23Blackrock 1-14
Blackrock 1-3
Blackrock 4-3Blackrock 2-4 Blackrock 1-4 Blackrock 4-1
Figure 5.4: a) Hierarchical cluster analysis dendogram and b) MDS plot of macroinvertebrate species log(x+1) transformed total abundance data from Blackrock sampled in April 2008 (n=5 per site).
Blackrock 1-5
Blackrock 2-1Blackrock 2-2
Blackrock 2-3
Blackrock 4-2Blackrock 4-4
Blackrock 3-3Blackrock 2-5
Blackrock 3-1Blackrock 3-2
Blackrock 3-4
74
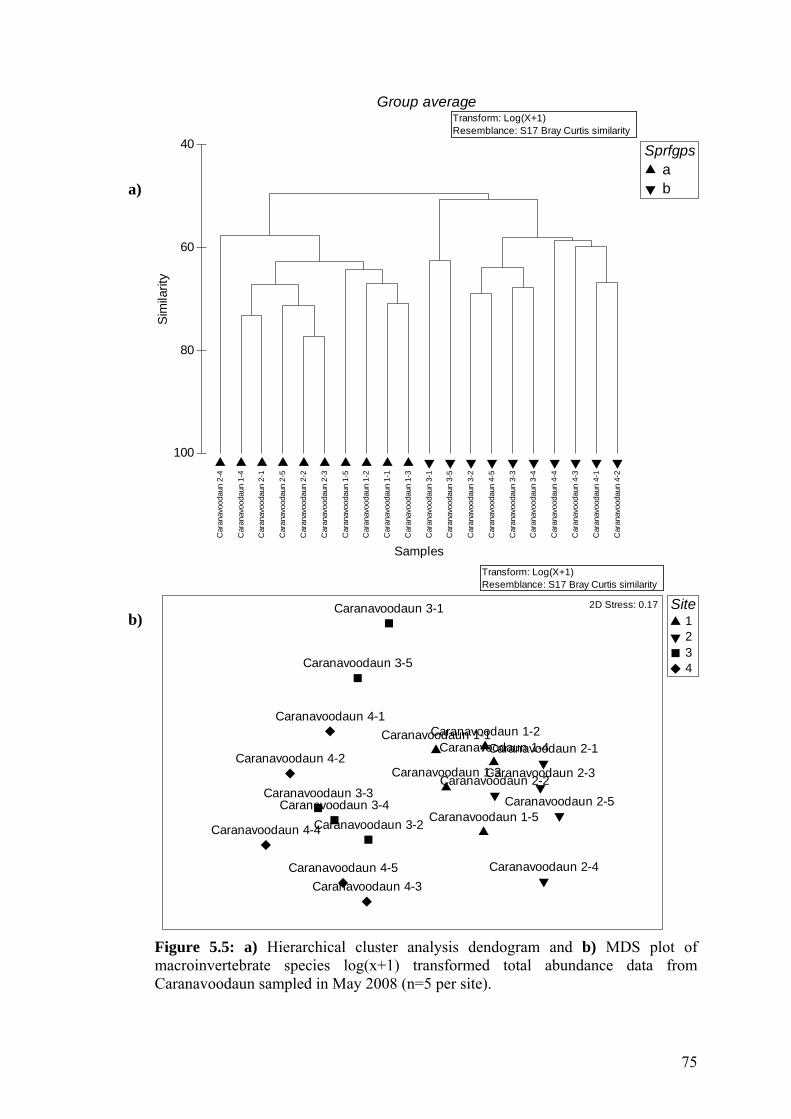
Group average
Car
anav
ooda
un 2
-4
Car
anav
ooda
un 1
-4
Car
anav
ooda
un 2
-1
Car
anav
ooda
un 2
-5
Car
anav
ooda
un 2
-2
Car
anav
ooda
un 2
-3
Car
anav
ooda
un 1
-5
Car
anav
ooda
un 1
-2
Car
anav
ooda
un 1
-1
Car
anav
ooda
un 1
-3
Car
anav
ooda
un 3
-1
Car
anav
ooda
un 3
-5
Car
anav
ooda
un 3
-2
Car
anav
ooda
un 4
-5
Car
anav
ooda
un 3
-3
Car
anav
ooda
un 3
-4
Car
anav
ooda
un 4
-4
Car
anav
ooda
un 4
-3
Car
anav
ooda
un 4
-1
Car
anav
ooda
un 4
-2
Samples
100
80
60
40S
imila
rity
Transform: Log(X+1)Resemblance: S17 Bray Curtis similarity
Sprfgpsab
a)
Transform: Log(X+1)Resemblance: S17 Bray Curtis similarity
Site1234
Caranavoodaun 1-1Caranavoodaun 1-2
Caranavoodaun 1-3
Caranavoodaun 1-4
Caranavoodaun 1-5
Caranavoodaun 2-1
Caranavoodaun 2-2Caranavoodaun 2-3
Caranavoodaun 2-4
Caranavoodaun 2-5
Caranavoodaun 3-1
Caranavoodaun 3-2
Caranavoodaun 3-3Caranavoodaun 3-4
Caranavoodaun 3-5
Caranavoodaun 4-1
Caranavoodaun 4-2
Caranavoodaun 4-3
Caranavoodaun 4-4
Caranavoodaun 4-5
2D Stress: 0.17
b)
Figure 5.5: a) Hierarchical cluster analysis dendogram and b) MDS plot of macroinvertebrate species log(x+1) transformed total abundance data from Caranavoodaun sampled in May 2008 (n=5 per site).
75
Group average
Roo
Wes
t 4-5
Roo
Wes
t 3-5
Roo
Wes
t 3-1
Roo
Wes
t 4-4
Roo
Wes
t 4-3
Roo
Wes
t 4-1
Roo
Wes
t 4-2
Roo
Wes
t 1-3
Roo
Wes
t 1-4
Roo
Wes
t 1-5
Roo
Wes
t 2-2
Roo
Wes
t 2-3
Roo
Wes
t 2-4
Roo
Wes
t 3-2
Roo
Wes
t 3-4
Roo
Wes
t 2-1
Roo
Wes
t 2-5
Roo
Wes
t 3-3
Roo
Wes
t 1-1
Roo
Wes
t 1-2
Samples
100
90
80
70
60
50
Sim
ilarit
yTransform: Log(X+1)Resemblance: S17 Bray Curtis similarity
Sprfgpsa
a)
Transform: Log(X+1)Resemblance: S17 Bray Curtis similarity
Site1234
Roo West 1-1
Roo West 1-2
Roo West 1-3
Roo West 1-4
Roo West 1-5
Roo West 2-1
Roo West 2-2
Roo West 2-3
Roo West 2-4
Roo West 2-5
Roo West 3-1
Roo West 3-2
Roo West 3-3
Roo West 3-4
Roo West 3-5
Roo West 4-1
Roo West 4-2
Roo West 4-3
Roo West 4-4
Roo West 4-5
2D Stress: 0.17
b)
Figure 5.6: a) Hierarchical cluster analysis dendogram and b) MDS plot of macroinvertebrate species log(x+1) transformed total abundance data from Roo West sampled in April 2008 (n=5 per site).
76
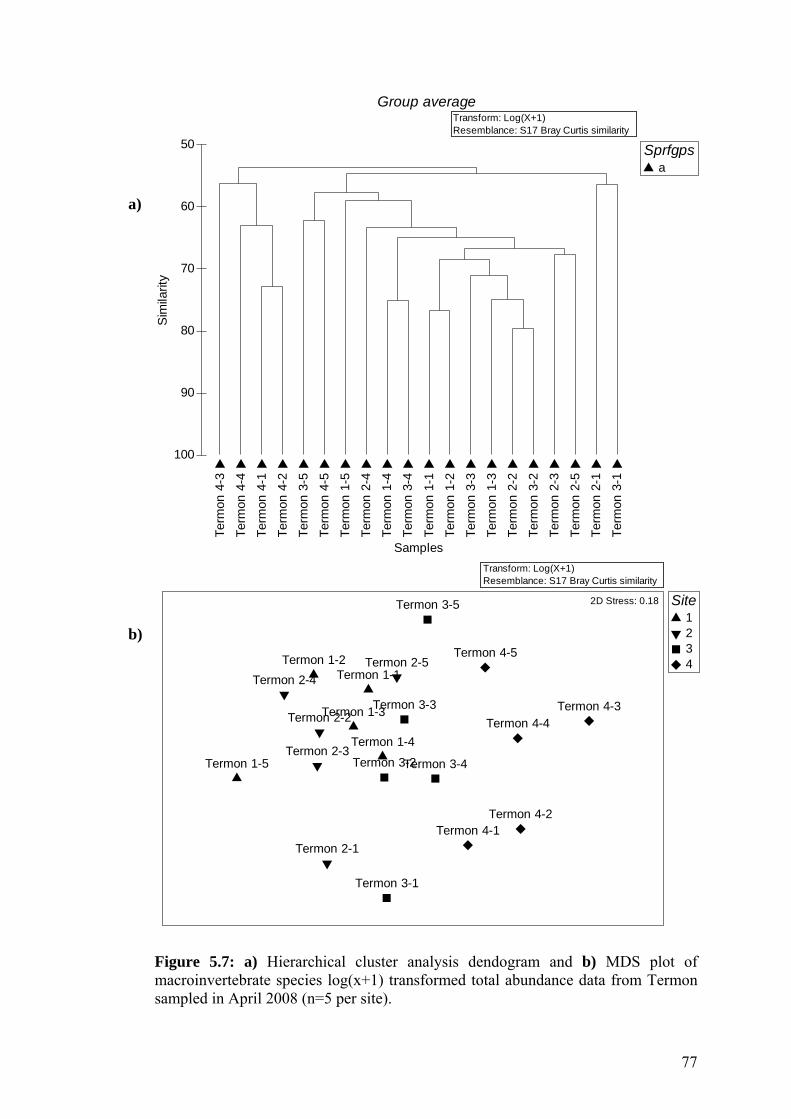
Group average
Term
on 4
-3
Term
on 4
-4
Term
on 4
-1
Term
on 4
-2
Term
on 3
-5
Term
on 4
-5
Term
on 1
-5
Term
on 2
-4
Term
on 1
-4
Term
on 3
-4
Term
on 1
-1
Term
on 1
-2
Term
on 3
-3
Term
on 1
-3
Term
on 2
-2
Term
on 3
-2
Term
on 2
-3
Term
on 2
-5
Term
on 2
-1
Term
on 3
-1
Samples
100
90
80
70
60
50S
imila
rity
Transform: Log(X+1)Resemblance: S17 Bray Curtis similarity
Sprfgpsa
a)
Transform: Log(X+1)Resemblance: S17 Bray Curtis similarity
Site1234
Termon 1-1Termon 1-2
Termon 1-3
Termon 1-4
Termon 1-5
Termon 2-1
Termon 2-2
Termon 2-3
Termon 2-4Termon 2-5
Termon 3-1
Termon 3-2
Termon 3-3
Termon 3-4
Termon 3-5
Termon 4-1Termon 4-2
Termon 4-3Termon 4-4
Termon 4-5
2D Stress: 0.18
b)
Figure 5.7: a) Hierarchical cluster analysis dendogram and b) MDS plot of macroinvertebrate species log(x+1) transformed total abundance data from Termon sampled in April 2008 (n=5 per site).
77
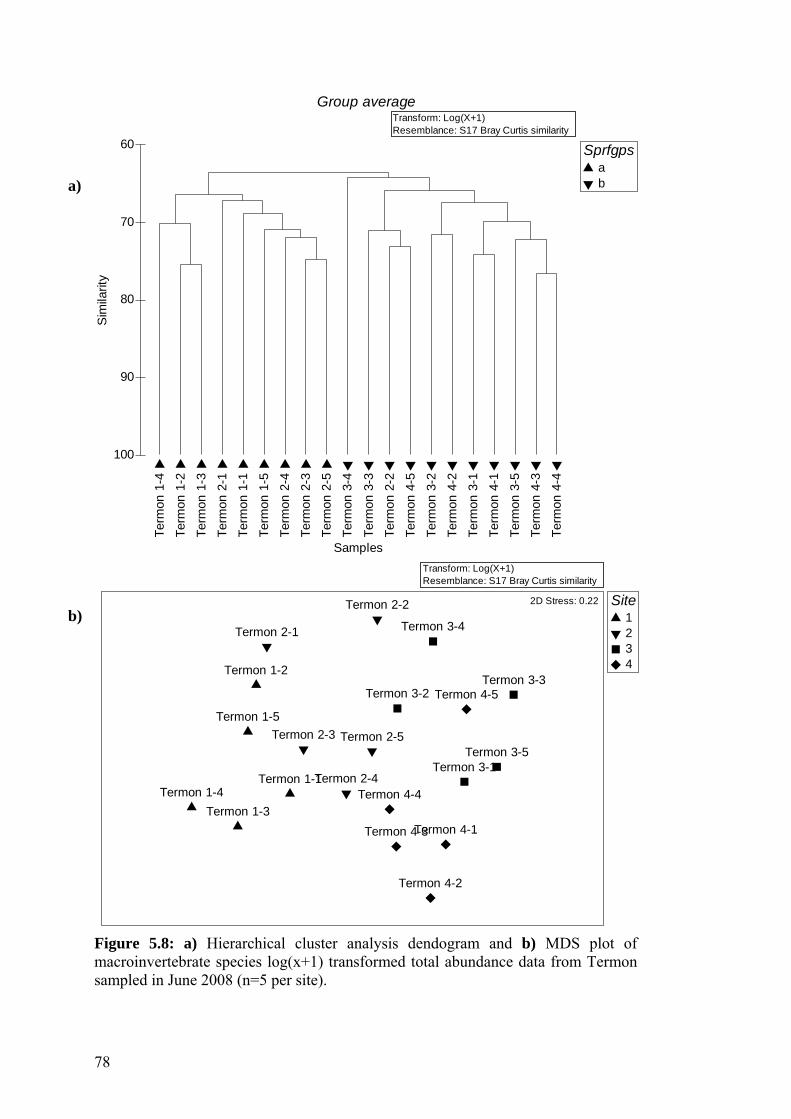
Group average
Term
on 1
-4
Term
on 1
-2
Term
on 1
-3
Term
on 2
-1
Term
on 1
-1
Term
on 1
-5
Term
on 2
-4
Term
on 2
-3
Term
on 2
-5
Term
on 3
-4
Term
on 3
-3
Term
on 2
-2
Term
on 4
-5
Term
on 3
-2
Term
on 4
-2
Term
on 3
-1
Term
on 4
-1
Term
on 3
-5
Term
on 4
-3
Term
on 4
-4Samples
100
90
80
70
60
Sim
ilarit
yTransform: Log(X+1)Resemblance: S17 Bray Curtis similarity
Sprfgpsab
Transform: Log(X+1)Resemblance: S17 Bray Curtis similarity
Site1234
Termon 1-1
Termon 1-2
Termon 1-3Termon 1-4
Termon 1-5
Termon 2-1
Termon 2-2
Termon 2-3
Termon 2-4
Termon 2-5
Termon 3-1
Termon 3-2Termon 3-3
Termon 3-4
Termon 3-5
Termon 4-1
Termon 4-2
Termon 4-3
Termon 4-4
Termon 4-5
2D Stress: 0.22
a)
b)
Figure 5.8: a) Hierarchical cluster analysis dendogram and b) MDS plot of macroinvertebrate species log(x+1) transformed total abundance data from Termon sampled in June 2008 (n=5 per site).
78
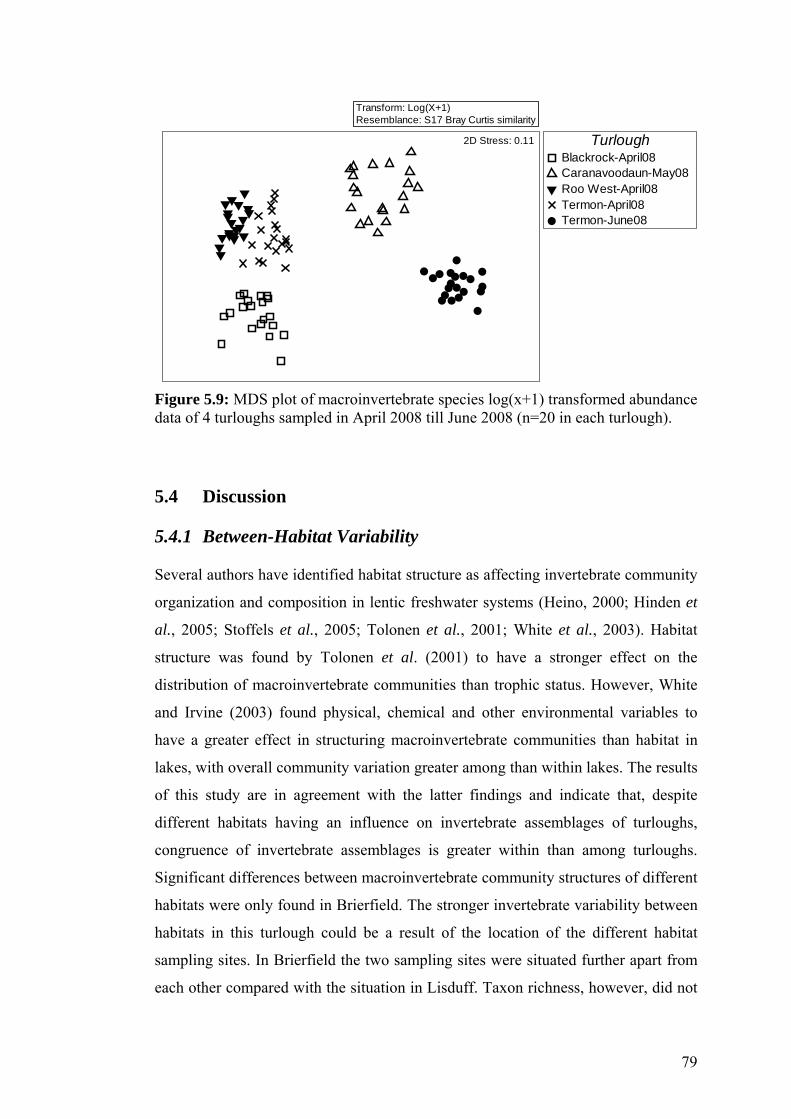
Transform: Log(X+1)Resemblance: S17 Bray Curtis similarity
TurloughBlackrock-April08Caranavoodaun-May08Roo West-April08Termon-April08Termon-June08
2D Stress: 0.11
Figure 5.9: MDS plot of macroinvertebrate species log(x+1) transformed abundance data of 4 turloughs sampled in April 2008 till June 2008 (n=20 in each turlough).
5.4 Discussion
5.4.1 Between-Habitat Variability
Several authors have identified habitat structure as affecting invertebrate community
organization and composition in lentic freshwater systems (Heino, 2000; Hinden et
al., 2005; Stoffels et al., 2005; Tolonen et al., 2001; White et al., 2003). Habitat
structure was found by Tolonen et al. (2001) to have a stronger effect on the
distribution of macroinvertebrate communities than trophic status. However, White
and Irvine (2003) found physical, chemical and other environmental variables to
have a greater effect in structuring macroinvertebrate communities than habitat in
lakes, with overall community variation greater among than within lakes. The results
of this study are in agreement with the latter findings and indicate that, despite
different habitats having an influence on invertebrate assemblages of turloughs,
congruence of invertebrate assemblages is greater within than among turloughs.
Significant differences between macroinvertebrate community structures of different
habitats were only found in Brierfield. The stronger invertebrate variability between
habitats in this turlough could be a result of the location of the different habitat
sampling sites. In Brierfield the two sampling sites were situated further apart from
each other compared with the situation in Lisduff. Taxon richness, however, did not
79

differ significantly between habitats and most prevalent invertebrate species were
represented in both habitats, although differing in abundance.
Some taxa such as the nationally notable B species Berosus signaticollis and the UK
RDB category one (vulnerable) species Omphiscola glabra did show preferences for
the submerged grassland habitat in Lisduff and Brierfield, respectively. Thus, habitat
heterogeneity within the littoral zone of turloughs is nevertheless important and
should be considered for conservation assessment. Sampling of all available habitats
in a turlough is likely to generate a more thorough evaluation of turlough
biodiversity. Della Bella et al. (2005) also found habitat specific preferences of
species of conservation concern in a study of temporary ponds in Italy and suggested
sampling of all available mesohabitats for conservation purposes in temporary
ponds.
5.4.2 Within-Habitat Variability
The results of this study indicate that grassland habitat samples collected in any
location of a turlough can provide a reliable metric of the macroinvertebrate
community of the turlough as a whole. This supports applicability of sampling a
single location for monitoring where purpose is to provide an estimation of general
status of a site. This was demonstrated by the clear separation of turlough replicate
grassland samples collected in spring 2008 using MDS and the SIMPROF-test
(incorporated in the cluster analysis). This is in agreement with results by Irvine et
al. (2001a) who found differences among macroinvertebrate communities within
lakes to be generally smaller than among lakes. Turloughs sampled in April 2008,
furthermore, showed no significant differences among sampling sites, emphasizing
the adequacy of single or pooled grassland habitat samples from any location in a
turlough for the representation of the aquatic macroinvertebrate community of
turloughs.
Turloughs are very dynamic and naturally variable systems and specific sets of
microhabitats in the dominant submerged grassland habitat might, thus, prevail for a
limited amount of time only. Exclusive specialization of turlough invertebrates in
microhabitats would consequently pose a threat to the survival of specialists in a
rapidly changing wetland environment (Batzer et al., 2004). Turlough invertebrates
80

have to endure high habitat variability frequently and are therefore likely to adapt to
this challenge by habitat generalization, enabling them to cope with changing habitat
conditions. For habitat generalists, habitat size or location becomes less important,
and environmental variability may, therefore, not be expected to negatively affect
many invertebrate taxa of temporary wetlands (Williams, 1996).
The separation of macroinvertebrate communities into two significantly different
groups using log(x+1) transformed total abundance data in turloughs sampled in
May and June 2008 suggests a spatio-temporal interaction in turloughs. Results from
the presence/absence data set highlight the importance of changes in
macroinvertebrate abundance over time for the separation of communities. Spatial
variation within submerged grassland habitat in turloughs increases over time
possibly owing to seasonal changes in life cycle and abundance of invertebrates. The
longer availability of a habitat offers the possibility of niche-building and continued
colonisation, reflected in a change in invertebrate community structure (Dvořaki and
Bestz, 1982; Jocqué et al., 2007), even within one habitat type. Furthermore, as
habitat duration increases so does local diversity and, thus, community structure
(Holland and Jenkins, 1998). An increase in ephemeral species later in the season as
reported by several authors (Boix et al., 2004; Lahr et al., 1999; Schneider, 1999),
and in a separate study on temporal dynamics of macroinvertebrate communities in
turloughs reported in Chapter 4, possibly also contributes to the observed spatio-
temporal trend. Habitat selection of ephemeral residents may not be a random event
and sites with low predator densities are preferably selected for oviposition by active
dispersers with the help of chemical clues or other stimuli (Blaustein et al., 2004;
Resetarits, 2001) possibly leading to the observed increased patchiness of
invertebrate species. The spatial differences in grassland habitat sites from late
season samples do not, however, weaken turlough invertebrate community
distinctiveness. The clear clustering of grassland replicate samples of individual
turloughs in the MDS plot and results from the SIMPROF-test (incorporate in the
cluster analysis) identified turloughs to hold discrete invertebrate communities
despite their inherent natural spatial variation. The results furthermore highlight that
differences in benthic communities among turloughs cannot be explained on the
basis of habitat structures alone. As turloughs generally possess highly individual
characters owing to differences in hydrological, nutrient, soil or geographical
81

regime, it is likely that such variation promotes the variable macroinvertebrate
communities of turloughs.
Variability in community composition is a natural feature of the littoral zone (White
et al., 2003). Albeit that between-habitat variability was excluded by sampling one
distinct habitat type (submerged grassland) in each turlough, within-habitat
variability in invertebrate community structures of turloughs could still be detected.
Taxon richness varied significantly among sampling sites in only two of the studied
turloughs but considerable variability in taxon richness was also apparent among
replicate samples from each sampling site and within each turlough. An increase in
taxon richness over time was furthermore discovered in Termon, which is in
agreement with studies on successional progress in invertebrate communities
(Cayrou and Céréghino, 2005; Jocqué et al., 2007) and results from Chapter 4.
Variability in community structure was also evident from the results of the MDS and
cluster analysis as replicate samples never showed exactly matching community
structures, even when no significant differences among replicate samples within a
turlough were detected.
5.5 Conclusions
The Water Framework Directive requires the assessment of water bodies on the
basis of a wide suite of variables, including benthic invertebrates (EC, 2000). Their
meaningful use as monitoring tools in turlough management programmes depends
on the ability of assessment tools to discriminate natural spatial (and temporal)
variation in invertebrate community structure from alterations caused by
anthropogenic disturbance (Trigal et al., 2007; White et al., 2003). The results of
this study suggest that despite inherent spatial heterogeneity of the littoral zone of
turloughs, macroinvertebrate samples can be used as reliable indicators of change,
even across a range of habitat structures. The dominant and easily identifiable
turlough habitat submerged grassland seems, moreover, highly suitable for routine,
standardised (among) turlough monitoring especially for the detection of pressure
gradients. A standardised stratified sampling approach furthermore reduces natural
“noise” in biotic monitoring and facilitates cost and time effective collection and
processing of samples. A recommendation from this work would therefore be to
apply a standardised sampling approach for routine turlough sampling with
82

macroinvertebrate samples collected from the easily identifiable submerged
grassland habitat, rather then attempting to collect samples from an extensive range
of habitats. This routine sampling would not be a comprehensive conservation
assessment, however, but a pressure response method and, thus, fulfil the
requirements of the WFD (EC, 2000). Yet, a sampling regime incorporating all
available habitats in a turlough seems more appropriate for a full assessment of
conservation value of turloughs as required under the EC Habitats Directive (EEC,
1992), providing a more comprehensive picture of turlough biodiversity and
enhanced likelihood for detection of local and nationally rare taxa.
83

84

6 Macroinvertebrate and Cladoceran Zooplankton Communities of Turloughs and their Usefulness as Bioindicators
6.1 Introduction
Turloughs appear in a wide range of hydrological, geomorphological and trophic
states throughout the West of Ireland. While the general pattern is to flood in
autumn and empty in summer, hydroperiod can vary greatly among turloughs
(Sheehy Skeffington et al., 2006) depending on fluctuations in the local groundwater
table (Reynolds, 1982; Reynolds et al., 1998). Soil type, vegetation and nutrient
status determine, further, each turlough’s unique hydromorphological regime which,
in turn, has a direct influence on the faunal and floral communities (Goodwillie and
Reynolds, 2003; Regan, 2005; Sheehy Skeffington et al., 2006).
Zooplankton represents an important part of lentic water food webs. They are the
primary consumers of phytoplankton and are themselves an important food source
for invertebrate and vertebrate predators (Irvine et al., 2001a). Zooplankton
communities have been reported as sensitive to various types of water quality
changes including eutrophication (Brett, 1989; Moss et al., 1991; Sládeček, 1983).
The Chydoridae are a family of the Anomopoda which are primarily littoral
dwellers. They have been described as potential tools to assess the status of
ecological quality of freshwaters, including turloughs (de Eyto et al., 2002; de Eyto
et al., 2003; Duigan and Kovach, 1991). Several authors (Ali et al., 1987; Duigan,
1988; Grainger, 1966, 1976, 1979, 1989; Reynolds, 1985a) reported high
entomostracan densities (mainly chydorids and copepods) in turloughs. Most
entomostracans possess resting stages enabling them to live in temporary
environments. However, single turlough sites are often dominated by one or two
zooplankton species only (Duigan et al., 1991; Reynolds and Marnell, 1999). The
glacial relict species Eurycercus glacialis is largely restricted to temporary habitats
characteristic of turloughs (Sheehy Skeffington et al., 2006). It has been reported to
occur with a mix of common forms such as Daphnia pulex and Chydorus sphaericus
and species which are more restricted in their occurrence such as Eurycercus
lamellatus (Reynolds, 1997, 2000).
85
Benthic invertebrates inhabit the bottom substrate of freshwater habitats for at least
part of their life (Rosenberg and Resh, 1993b). Owing to their ubiquitous
occurrence, long life cycles, sedentary nature, diversity, sensitivity to changes in
their environment and their importance in freshwater food chains there is a long
tradition in using benthic macroinvertebrates in the assessment of running waters
(Hellawell, 1986; Rosenberg and Resh, 1993a). Assessment of standing waters has
traditionally mainly relied on water chemistry measures and chlorophyll a and, to a
lesser extent, invertebrates of the profundal (Brodersen and Lindegaard, 1999;
Langdon et al., 2006). This tradition is now challenged under the European Water
Framework Directive (2000/60/EC) (WDF) (EC, 2005) as it specifically requires the
inclusion of benthic invertebrates in the assessment of surface waters.
Hydroperiod, habitat complexity and nutrient status can contribute to differences in
invertebrate community structures of temporary wetlands. Several studies showed
that an increase in hydroperiod had a positive effect on the presence of invertebrate
taxa in temporary wetlands (Collinson et al., 1995; Della Bella et al., 2005; Duigan,
1988; Schneider and Frost, 1996; Tavernini et al., 2005) with long duration wetlands
supporting colonizers lacking adaptations to drought (Schneider et al., 1996). The
influence of habitat structure on aquatic invertebrate communities has been
documented by several authors (Heino, 2000; Tolonen et al., 2001; White and
Irvine, 2003) and habitat heterogeneity and diversity has been attributed to
increasing invertebrate diversity and abundance (Brönmark, 1985; Tolonen et al.,
2003). Studies on invertebrate community responses to nutrient enrichment in lentic
environments are quite recent and have so far focused mainly on lake invertebrate
communities (Brauns et al., 2007; Brodersen et al., 1998; Brodersen et al., 1999;
Pinel-Alloul et al., 1996; Tolonen et al., 2001; White, 2000).
The objective of this study was to assess macroinvertebrate and cladoceran
zooplankton community structures of a range of turloughs and to investigate the
effect of differences in hydrological, morphological and trophic regimes on their
invertebrate biodiversity, taxonomic and community structure.
86

87
6.2 Material and Methods
6.2.1 Study Sites
Twenty-two turloughs, located in counties Clare, Galway, Mayo and Roscommon,
were selected for study as representative of the hydrological conditions and
geographical range of turloughs in Ireland, based on existing hydrogeological
(Drew, 1990; Southern Water Global, 1998; Tynan et al., 2005) and
hydromorphological data (Coxon, 1986) (for details on the selection process see
Chapter 2.1; Table 6.1 & Figure 6.1).
Table 6.1: List of turloughs studied, their ID, TP concentrations per sampling month, number of habitats sampled in each sampling month and respective hydroperiods.
TP (µg L-1) 1
Nr of habitats sampled
Turlough ID
Nov 06 Apr 07 Nov 06 Apr 07
Hydroperiod (days) 2
Ardkill 1 34 98 2 1 296 Ballindereen 2 7 5 3 2 239 Blackrock 3 56 -- 1 -- 196 Brierfield 4 14 15 1 2 331 Caherglassaun 5 46 38 1 1 365 Caranavoodaun 6 12 11 1 1 228 Carrowreagh 7 56 36 1 1 220 Coolcam 8 9 27 1 1 365 Croaghill 9 11 14 1 1 365 Garryland 10 21 12 1 1 221 Kilglassan 11 16 18 1 1 365 Knockaunroe 12 1 3 2 2 231 Lisduff 13 5 8 1 2 256 Lough Aleenaun 14 23 31 1 1 194 Lough Coy 15 62 25 1 1 365 Lough Gealain 16 5 2 2 2 230 Rathnalulleagh 17 62 43 1 2 214 Roo West 18 4 8 1 1 231 Skealoghan 19 14 20 1 1 252 Termon 20 4 11 2 1 365 Tullynafrankagh 21 16 18 4 2 365 Turloughmore 22 36 -- 1 -- 139
1 Data provided by Helder Pereira 2 Data provided by Owen Naughton
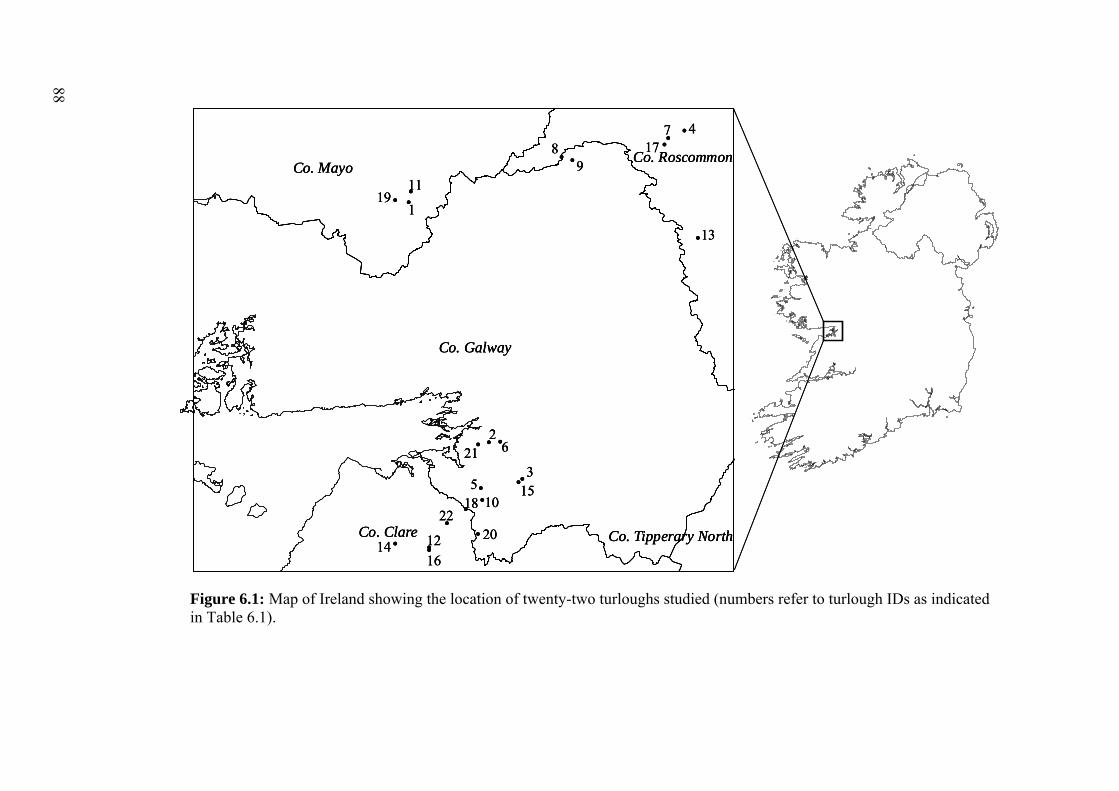
Figure 6.1: Map of Ireland showing the location of twenty-two turloughs studied (numbers refer to turlough IDs as indicated in Table 6.1).
!
!!
!
!
!
!
!
!!
!!!
!
!
!
!!
!
!
!
!
Co. Galway
Co. Mayo
Co. Clare
Co. Roscommon
Co. Tipperary North
1
3
4
5
26
78
9
10
11
12
13
14
15
21
22
16
17
18
19
20!
!!
!
!
!
!
!
!!
!!!
!
!
!
!!
!
!
!
!
Co. Galway
Co. Mayo
Co. Clare
Co. Roscommon
Co. Tipperary North
1
3
4
5
26
78
9
10
11
12
13
14
15
21
22
16
17
18
19
20!
!!
!
!
!
!
!
!!
!!!
!
!
!
!!
!
!
!
!
Co. Galway
Co. Mayo
Co. Clare
Co. Roscommon
Co. Tipperary North
1
3
4
5
26
78
9
10
11
12
13
14
15
21
22
16
17
18
19
20
88
88
6.2.2 Macroinvertebrate Sampling
At each turlough macroinvertebrate samples were collected using sweeps with a
standard FBA pond net with 1 mm mesh size. Sampling within the accessible area of
each turlough was carried out proportional to habitat availability, modified after
Biggs et al. (1998). The sweep net samples comprised a 3 minute sampling time,
which was subdivided proportionally to each habitat’s availability. Samples were
sieved using a 500 μm sieve on site and preserved in 90% industrial methylated
spirits (IMS) for later sorting and identification in the laboratory. Number of habitats
sampled and their proportions were recorded. Where samples had a very high
abundance of macroinvertebrates they were split prior to sorting and taxonomic
identification following methods by Donohue (2008). All individuals were identified
to the lowest practicable level, typically species. Sampling was carried out in
November 2006 (autumn sampling) about one month after flooding of turloughs had
started and again before water receded in April 2007 (spring sampling). However,
during spring only twenty turloughs were sampled, as Turloughmore and Blackrock
had already dried out.
6.2.3 Zooplankton and Chydorid Sampling
In April 2007 open water cladoceran zooplankton as well as separate chydorid
samples were collected from twenty turloughs. Open water cladoceran zooplankton
samples were collected using a zooplankton net with 60 µm mesh size. At every
turlough three cladoceran zooplankton samples were collected with horizontal hauls
of the zooplankton net from the shore at three random locations. Samples were
subsequently pooled, washed into collection bottles and preserved with 90% IMS for
later identification in the laboratory.
At all twenty turloughs, separate sampling for chydorids was carried out with the use
of a perspex tube (diameter 5.5 cm, volume 2276 cm2) after Irvine et al. (1989). All
available habitats in each turlough were sampled proportional to their abundance in
accessible areas as described for the collection of macroinvertebrate sweep net
samples in section 6.2.2. For every chydorid sample a total of 25 L was collected by
rapidly lowering the perspex tube to the substratum, sealing the end with a rubber
ball and collecting the content in a container. The sample was subsequently sieved
89

through a sieve of 60 µm mesh size, washed into collection bottles and preserved in
situ in 90% IMS. Separate samples of cladoceran zooplankton and chydorids were
identified and enumerated in the laboratory. Where subsampling of samples was
necessary no less than 20% of each sample was analysed following methods by de
Eyto et al. (2003).
6.2.4 Statistical Analysis
6.2.4.1 Relating Macroinvertebrate, Zooplankton and Chydorid Taxon Richness and Abundances to Environmental Variables
Relationships of macroinvertebrate taxon richness and log-transformed abundance to
log-transformed TP concentrations and number of habitats sampled were assessed
using Pearson product-moment correlations. Spearman rank-order correlation
investigated the influence of hydroperiod on macroinvertebrate taxon richness and
abundances, respectively. Average values for samples from 22 turloughs (22
sampled in November 2006 and 20 sampled in April 2007) were included in the
analysis. Total abundance recorded in Turloughmore was excluded from the analysis
owing to its extreme outlier character.
Relationships of cladoceran zooplankton and log-transformed chydorid taxon
richness and respective log-transformed abundances, to macroinvertebrate taxon
richness and log-transformed TP were investigated using Pearson product-moment
correlations. Correlation of cladoceran zooplankton and chydorid taxon richness and
abundances with hydroperiod of turloughs was, furthermore, investigated using
Spearman rank-order correlation. TP concentrations recovered from Ardkill were
excluded from the analysis owing to a strong outlier character.
Data normality was verified using the Shapiro Wilk test and homogeneity of
variance checked with the Leven’s test before choosing parametric or nonparametric
statistical analysis.
90
6.2.4.2 Relating Macroinvertebrate Taxonomic Structure to Environmental Variables
Spearman rank-order correlation tested the relationships between environmental
variables (TP, hydroperiod and number of habitats sampled) and the respective
abundances of Amphipoda, Aranea, Bivalvia, Coleoptera, Diptera, Ephemeroptera,
Gastropoda, Heteroptera, Hirudinea, Hydrachnidia, Isopoda, Lepidoptera, Odonata,
Oligochaeta, Ostracoda, Plecoptera, Trichoptera and Turbellaria in the two different
seasons.
To identify the similarities of communities in each sampling season the similarity
percentage routine SIMPER (PRIMER® 6) was carried out. This method
decomposes Bray-Curtis similarities among all pairs of samples, within a priori
defined groups (in this case individual turloughs), into percentage contributions
from each species to the respective similarities (Clarke and Warwick, 2001).
Dissimilarities of seasonal turlough samples of each individual turlough were
computed using the same method, in order to investigate changes in the
macroinvertebrate community of each turlough with sampling season.
Cluster Analysis and Multi-Dimensional Scaling (MDS) ordination on log(x+1)
transformed total abundance macroinvertebrate data assessed similarity of samples.
Cluster Analysis and MDS were based on a Bray-Curtis similarity matrix, with
clusters formed using the average group linkage method. The similarity profile
(SIMPROF) permutation test, which tests for statistically robust clusters of a priori
undefined groups (Clarke and Gorley, 2006) was incorporated into the Cluster
Analysis.
Canonical Correspondence Analysis (CCA) was performed to examine the ability of
the environmental variables TP, season, number of habitats sampled and
hydroperiod to explain the variability present in the macroinvertebrate community
(CANOCO Version 4.5). CCA is a non-linear eigenvector ordination technique in
which the axes are constrained to be linear combinations of the measured
environmental variables. The ordination was performed on log(x+1) transformed
macroinvertebrate abundance data using automatic forward selection of the
environmental variables to obtain the conditional effects for each variable and
down-weighting of rare species. When selecting the down-weighting option in
91
CANOCO version 4.5, species with a total frequency less than 20% of the maximum
recorded total frequency are weighted in proportion to their frequency, divided by
20% of the maximum recorded total frequency (ter Braak and Šmilauer, 2002).
Treating each variable as the sole predictor variable in a first step, all environmental
variables were ranked on the basis of the variance they explained separately, thus
representing marginal effects. The explanatory effect of each variable was evaluated
for its significance using Monte Carlo permutation tests with 999 permutations.
To asses the similarity of macroinvertebrate sample ordinations of different seasons,
turlough samples were ranked according to their arrangement in the 2D CCA
ordination created using the log(x+1) transformed abundance macroinvertebrate
data. Turlough ranks of each season were correlated using Spearman rank-order
correlation.
6.3 Results
6.3.1 Relating Macroinvertebrate, Zooplankton and Chydorid Taxon Richness and Abundances to Environmental Variables
Pearson product-moment correlation detected a positive correlation of
macroinvertebrate taxon richness with number of habitats sampled (R=0.435;
P<0.05; n=22). A positive correlation was also found for macroinvertebrate taxon
richness with hydroperiod of turloughs (Spearman rank-order correlation; R=0.666;
P<0.001; n=22).
A significant positive correlation was found between log-transformed TP and both
log-transformed cladoceran zooplankton and chydorid abundance, respectively
(R=0.529; P<0.05; and R=0.498; P<0.05, respectively; n=19 in both cases), using
Pearson product-moment correlation. A negative correlation was found between
cladoceran zooplankton taxon richness and log-transformed TP (Pearson product-
moment correlation; R=-0.506; P<0.05). Spearman rank-order correlation indicated
a positive relationship of both cladoceran zooplankton and chydorid abundance with
turlough hydroperiod (R=0.556; P<0.05 and R=0.489; P<0.05, respectively; n=20 in
both cases).
92
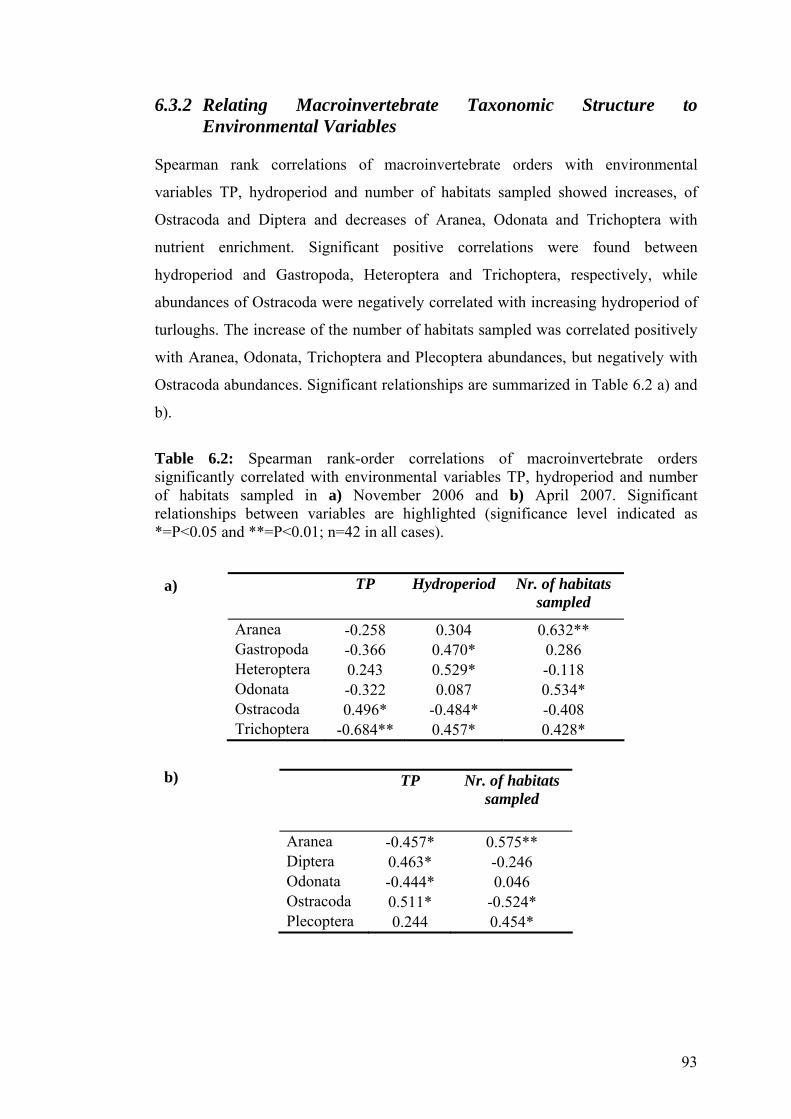
6.3.2 Relating Macroinvertebrate Taxonomic Structure to Environmental Variables
Spearman rank correlations of macroinvertebrate orders with environmental
variables TP, hydroperiod and number of habitats sampled showed increases, of
Ostracoda and Diptera and decreases of Aranea, Odonata and Trichoptera with
nutrient enrichment. Significant positive correlations were found between
hydroperiod and Gastropoda, Heteroptera and Trichoptera, respectively, while
abundances of Ostracoda were negatively correlated with increasing hydroperiod of
turloughs. The increase of the number of habitats sampled was correlated positively
with Aranea, Odonata, Trichoptera and Plecoptera abundances, but negatively with
Ostracoda abundances. Significant relationships are summarized in Table 6.2 a) and
b).
Table 6.2: Spearman rank-order correlations of macroinvertebrate orders significantly correlated with environmental variables TP, hydroperiod and number of habitats sampled in a) November 2006 and b) April 2007. Significant relationships between variables are highlighted (significance level indicated as *=P<0.05 and **=P<0.01; n=42 in all cases).
TP Hydroperiod Nr. of habitats sampled
Aranea -0.258 0.304 0.632** Gastropoda -0.366 0.470* 0.286 Heteroptera 0.243 0.529* -0.118 Odonata -0.322 0.087 0.534* Ostracoda 0.496* -0.484* -0.408 Trichoptera -0.684** 0.457* 0.428*
a)
b) TP Nr. of habitats sampled
Aranea -0.457* 0.575** Diptera 0.463* -0.246 Odonata -0.444* 0.046 Ostracoda 0.511* -0.524* Plecoptera 0.244 0.454*
93

The similarity percentage routine SIMPER identified overall similarity of turloughs
sampled in November 2006 to be 27.6% and in April 2007 32.3%. Turlough
macroinvertebrate communities differed between sampling months by 76.4%,
suggesting a strong seasonal influence on macroinvertebrate community structure.
Macroinvertebrate species composition and contributions to overall turlough
similarities in each sampling month differed among sampling seasons. While
macroinvertebrates identified to contribute strongly to overall turlough similarity in
November 2006 were Ostracoda sp., Galba truncatula and Agabus sp. larvae
(17.6%, 12.4% and 12.1% contribution to overall similarity of samples,
respectively), macroinvertebrates playing a major part in overall similarity among
turloughs in April 2007 were Chironomidae sp., Agabus sp. larvae, Diptera pupae
and Oligochaeta sp. (17.7%, 14.9%, 8.6% and 8.5% contribution to overall
similarity of samples, respectively) (Table 6.3). Taxa contributing to overall
turlough similarities occurring in both months were generally those classified as
permanent residents, or early larval stages of macroinvertebrates classified as
ephemeral resident of temporary waters after Williams (1987) and Lahr (1997).
Differences in contributing taxa among sampling months were largely owing to
ephemeral taxa, thus, indicating a seasonal effect on turlough macroinvertebrate
community structure.
94
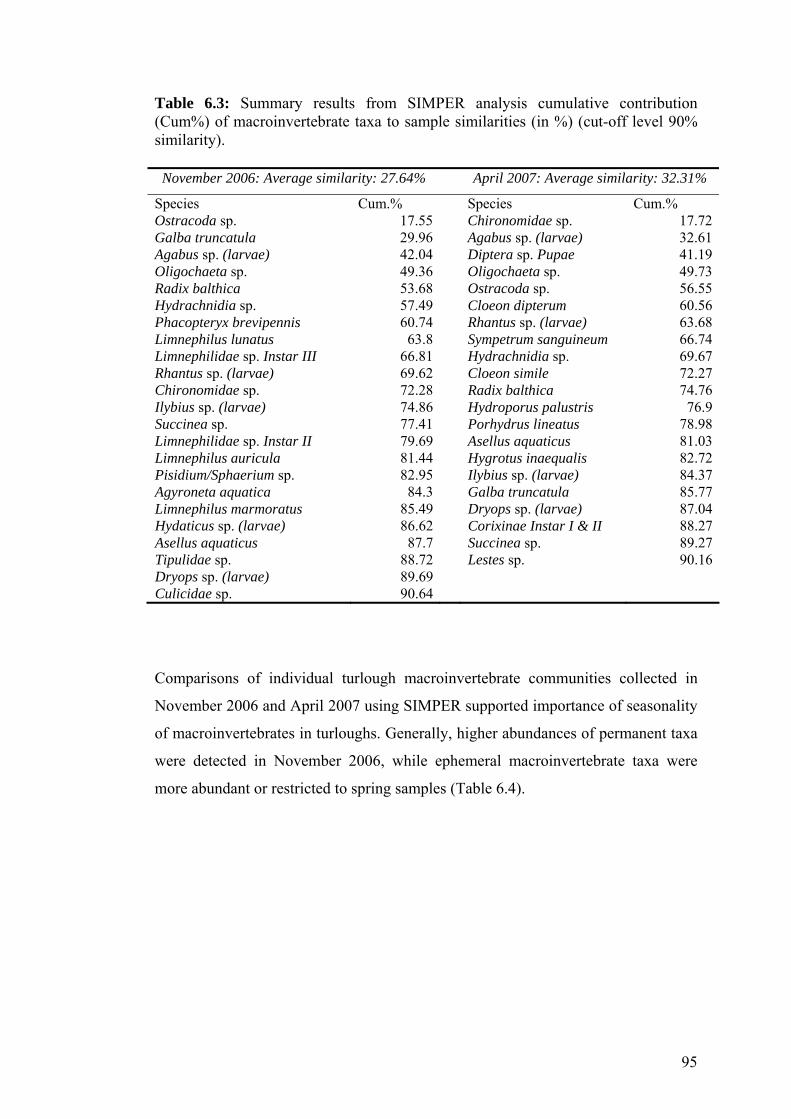
Table 6.3: Summary results from SIMPER analysis cumulative contribution (Cum%) of macroinvertebrate taxa to sample similarities (in %) (cut-off level 90% similarity).
November 2006: Average similarity: 27.64% April 2007: Average similarity: 32.31%
Species Cum.% Species Cum.% Ostracoda sp. 17.55 Chironomidae sp. 17.72Galba truncatula 29.96 Agabus sp. (larvae) 32.61Agabus sp. (larvae) 42.04 Diptera sp. Pupae 41.19Oligochaeta sp. 49.36 Oligochaeta sp. 49.73Radix balthica 53.68 Ostracoda sp. 56.55Hydrachnidia sp. 57.49 Cloeon dipterum 60.56Phacopteryx brevipennis 60.74 Rhantus sp. (larvae) 63.68Limnephilus lunatus 63.8 Sympetrum sanguineum 66.74Limnephilidae sp. Instar III 66.81 Hydrachnidia sp. 69.67Rhantus sp. (larvae) 69.62 Cloeon simile 72.27Chironomidae sp. 72.28 Radix balthica 74.76Ilybius sp. (larvae) 74.86 Hydroporus palustris 76.9Succinea sp. 77.41 Porhydrus lineatus 78.98Limnephilidae sp. Instar II 79.69 Asellus aquaticus 81.03Limnephilus auricula 81.44 Hygrotus inaequalis 82.72Pisidium/Sphaerium sp. 82.95 Ilybius sp. (larvae) 84.37Agyroneta aquatica 84.3 Galba truncatula 85.77Limnephilus marmoratus 85.49 Dryops sp. (larvae) 87.04Hydaticus sp. (larvae) 86.62 Corixinae Instar I & II 88.27Asellus aquaticus 87.7 Succinea sp. 89.27Tipulidae sp. 88.72 Lestes sp. 90.16Dryops sp. (larvae) 89.69 Culicidae sp. 90.64
Comparisons of individual turlough macroinvertebrate communities collected in
November 2006 and April 2007 using SIMPER supported importance of seasonality
of macroinvertebrates in turloughs. Generally, higher abundances of permanent taxa
were detected in November 2006, while ephemeral macroinvertebrate taxa were
more abundant or restricted to spring samples (Table 6.4).
95

Table 6.4: Summary results from SIMPER analysis at individual turlough level showing cumulative contribution (Cum%) of macroinvertebrate taxa to sample dissimilarities (in %)(first ten contributing taxa). Ardkill Knockaunroe Average dissimilarity: 69.04% Average dissimilarity: 80.51% Species Cum.% (higher)
presence Species Cum.% (higher)
presence
Chironomidae sp. 8.31 only Apr 07 Oligochaeta sp. 8.99 only Nov 06 Agabus sp. (larvae) 16.19 only Apr 07 Cloeon simile 17.58 only Apr 07 Radix balthica 21.42 Nov 06 Chironomidae sp. 24.18 only Apr 07 Hydroporus palustris 26.27 Apr 07 Limnephilus lunatus 30.61 only Nov 06 Oligochaeta sp. 30.74 Apr 07 Limnephilidae sp. Instar III 37.03 only Nov 06 Haliplus fulvus 35.01 only Nov 06 Limnephilidae sp. Instar II 43.46 only Nov 06 Haliplus sp. ruficollis group (females)
39.03 only Nov 06 Diptera sp. Pupae 49.31 only Apr 07
Planorbis crista 42.39 only Nov 06 Anisoptera sp. (larvae) 54.05 Apr 07 Ostracoda sp. 45.01 Apr 07 Hydroporus palustris 58.41 only Apr 07 Hygrotus sp. (larvae) 47.61 only Apr 07 Hygrotus inaequalis 62.33 only Apr 07
Ballindereen Lisduff Average dissimilarity: 72.26% Average dissimilarity: 56.04% Species Cum.% (higher)
presence Species Cum.% (higher)
presence
Ostracoda sp. 8.81 Nov 06 Limnephilus auricula 6.6 only Nov 06 Vallonia pulchella 16.54 Nov 06 Pisidium/Sphaerium sp. 13.16 only Nov 06 Limnephilus lunatus 22.18 Nov 06 Valvata cristata 18.81 only Nov 06 Phacopteryx brevipennis 27.11 Nov 06 Limnephilus centralis 24.3 only Apr 07 Lymnaea fusca 31.91 Nov 06 Limnephilus lunatus 29.39 Nov 06 Limnephilus auricula 36.35 Nov 06 Agabus sp. (larvae) 34.39 Apr 07 Limnephilus decipiens 40.55 Nov 06 Sympetrum sanguineum 38.95 only Apr 07 Asellus aquaticus 44.72 Apr 07 Limnephilus marmoratus 43.37 Nov 06 Diptera sp. Pupae 48.32 Apr 07 Galba truncatula 46.99 Nov 06 Cloeon dipterum 51.92 Apr 07 Lestes sp. 50.45 only Apr 07
Brierfield Lough Aleenaun Average dissimilarity: 57.24% Average dissimilarity: 57.57% Species Cum.% (higher)
presence Species Cum.% (higher)
presence
Phacopteryx brevipennis 9.51 only Nov 06 Oligochaeta sp. 8.88 Apr 07 Succinea sp. 17.87 only Nov 06 Radix balthica 15.87 Apr 07 Omphiscola glabra 24.53 only Apr 07 Chironomidae sp. 22.66 Nov 06 Galba truncatula 30.53 Nov 06 Pisidium/Sphaerium sp. 28.65 only Nov 06 Limnephilus auricula 35.64 only Nov 06 Helophorus brevipalpis 34.23 only Apr 07 Culicidae sp. 40.04 only Apr 07 Ceratopogonidae sp. 39.81 only Apr 07 Rhantus sp. (larvae) 44 only Nov 06 Haliplus sp. (larvae) 44.66 only Nov 06 Euconulus alderi 47.69 Nov 06 Cloeon dipterum 49.43 only Apr 07 Ostracoda sp. 51.32 Nov 06 Coroxinae Instar I & II 54.2 only Apr 07 Pisidium/Sphaerium sp. 54.72 only Nov 06 Planorbis leucostoma 58.42 only Apr 07
96

Table 6.4 (Contd.): Summary results from SIMPER analysis at individual turlough level showing cumulative contribution (Cum%) of macroinvertebrate taxa to sample dissimilarities (in %)(first ten contributing taxa). Caherglassaun Lough Coy Average dissimilarity: 78.45% Average dissimilarity: 81.75% Species Cum.% (higher)
presence Species Cum.% (higher)
presence
Planorbis contortus 8.73 only Apr 07 Ostracoda sp. 9.05 Apr 07 Agabus sp. (larvae) 16.82 Apr 07 Cloeon dipterum 17.8 only Apr 07 Chironomidae sp. 24.72 only Apr 07 Hydroporus palustris 24.33 only Apr 07 Asellus aquaticus 31 only Apr 07 Galba truncatula 30.19 only Nov 06 Ostracoda sp. 36.98 Nov 06 Chironomidae sp. 34.76 only Apr 07 Diptera sp. Pupae 42.91 only Apr 07 Valvata macrostoma 39.32 only Apr 07 Hydaticus sp. (larvae) 48.29 only Nov 06 Gammarus lacustris 43.42 Apr 07 Haliplus sp. ruficollis group (females)
53.04 only Nov 06 Oligochaeta sp. 47.52 only Apr 07
Ilybius sp. (larvae) 57.5 only Nov 06 Sigara dorsalis 51.35 Apr 07 Rhantus sp. (larvae) 61.64 only Nov 06 Sigara concinna 55 Apr 07
Caranavoodaun Lough Gealain Average dissimilarity: 56.91% Average dissimilarity: 79.42% Species Cum.% (higher)
presence Species Cum.% (higher)
presence
Limnephilidae sp. Instar II 7.11 only Nov 06 Cloeon simile 11.7 only Apr 07 Sympetrum sanguineum 13.79 only Apr 07 Porhydrus lineatus 20.02 only Apr 07 Limnephilidae sp. Instar III 19.77 only Nov 06 Chironomidae sp. 25.41 only Apr 07 Limnephilus lunatus 25.52 only Nov 06 Limnephilidae sp. Instar III 30.79 only Nov 06 Ostracoda sp. 31.04 only Nov 06 Phacopteryx brevipennis 36.18 only Nov 06 Leste dryas 36.31 only Apr 07 Graptodytes bilineatus 40.82 only Nov 06 Radix balthica 41.47 Nov 06 Diptera sp. Pupae 45.46 only Apr 07 Hydaticus sp. (larva) 46.07 only Nov 06 Omphiscola glabra 50.1 only Nov 06 Anisoptera sp. larvae 50.29 Apr 07 Limnephilidae sp. Instar II 54.74 only Nov 06 Berosus signaticollis 54.06 Apr 07 Agyroneta aquatica 58.42 only Apr 07
Carrowreagh Rathnalulleagh Average dissimilarity: 66.42% Average dissimilarity: 60.29% Species Cum.% (higher)
presence Cum.% (higher)
presence
Chironomidae sp. 9.25 Apr 07 Ostracoda sp. 13.9 only Nov 06 Phacopteryx brevipennis 17.41 only Nov 06 Diptera sp. Pupae 21.33 only Apr 07 Hydaticus sp. (larvae) 25.46 only Nov 06 Planorbis planorbis 28.77 only Apr 07 Galba truncatula 33.17 only Nov 06 Tipulidae sp. 35.61 only Apr 07 Rhantus sp. (larvae) 40.63 only Nov 06 Nemoura cinerea 42.46 only Apr 07 Ilybius sp. (larvae) 47.49 only Nov 06 Corixa iberica 47.75 only Apr 07 Succinea sp. 54.17 only Nov 06 Galba truncatula 52.62 Nov 06 Oligochaeta sp. 60.32 Apr 07 Rhantus sp. (larvae) 56.81 only Apr 07 Ostracoda sp. 65.71 Nov 06 Cloeon dipterum 61.01 only Apr 07 Limnephilus decipiens 70.64 only Nov 06 Succinea sp. 65.21 only Apr 07
97

Table 6.4 (Contd.): Summary results from SIMPER analysis at individual turlough level showing cumulative contribution (Cum%) of macroinvertebrate taxa to sample dissimilarities (in %)(first ten contributing taxa). Coolcam Roo West Average dissimilarity: 71.27% Average dissimilarity: 56.33% Species Cum.% (higher)
presence Species Cum.% (higher)
presence
Limnephilus lunatus 7.5 only Nov 06 Ostracoda sp. 10.82 only Nov 06 Limnephilidae sp. Instar II 13.6 only Nov 06 Sympetrum sanguineum 20.34 only Apr 07 Limnephilidae sp. Instar III 19.26 only Nov 06 Cloeon dipterum 28.03 only Apr 07 Cloeon simile 24.76 only Apr 07 Planorbis planorbis 35.71 only Apr 07 Limnephilus marmoratus 30.26 only Nov 06 Diptera sp. Pupae 42.3 only Apr 07 Gammarus sp. juveniles 34.86 only Apr 07 Lymnaea fusca 48.88 only Nov 06 Lymnaea fusca 39.02 only Nov 06 Galba truncatula 53.7 only Nov 06 Porhydrus lineatus 42.94 only Apr 07 Chironomidae sp. 57.41 Nov 06 Limnephilus auricula 46.76 only Nov 06 Agabus sp. (larvae) 60.83 Nov 06 Agabus sp. (larvae) 50.53 Apr 07 Cloeon simile 64.12 only Apr 07
Croaghill Skealoghan Average dissimilarity: 67.07% Average dissimilarity: 69.09% Species Cum.% (higher)
presence Species Cum.% (higher)
presence
Agabus sp. (larvae) 10.52 only Apr 07 Sympetrum sanguineum 4.31 only Apr 07 Lestes sp. 17.89 only Apr 07 Lymnaea fusca 8.59 only Apr 07 Planorbis crista 24.75 only Nov 06 Notonectidae sp. (larvae) 12.37 only Apr 07 Valvata cristata 30.77 only Nov 06 Triaenodes bicolor 15.96 only Apr 07 Lestes dryas 36.57 only Apr 07 Limnephilidae sp. Instar II 19.53 only Nov 06 Galba truncatula 42.15 only Nov 06 Corixinae Instar I & II 22.95 only Apr 07 Limnephilidae sp. Instar II 47.72 only Nov 06 Helophorus brevipalpis 26.3 only Apr 07 Phacopteryx brevipennis 53.3 Nov 06 Asellus aquaticus 29.58 only Apr 07 Limnephilidae sp. Instar III 58.33 only Nov 06 Oligochaeta sp. 32.83 only Nov 06 Chironomidae sp. 63.04 only Apr 07 Cloeon dipterum 35.73 Apr 07
Garryland Termon Average dissimilarity: 49.16% Average dissimilarity: 87.77% Species Cum.% (higher)
presence Species Cum.% (higher)
presence
Chironomidae sp. 8.79 only Apr 07 Limnephilidae sp. Instar II 5.37 only Nov 06 Planorbis planorbis 16.63 only Apr 07 Bithynia tentaculata 9.94 only Nov 06 Asellus meridianus 23.87 Apr 07 Limnephilus lunatus 14.47 only Nov 06 Hydrachnidia sp. 30.13 only Apr 07 Pisidium/Sphaerium sp. 18.98 only Nov 06 Hygrotus quinquelineatus 36.1 Apr 07 Chironomidae Sp. 23.42 April 07 Hygrobia hermanni 41.95 only Apr 07 Bithynia leachi 27.69 only Nov 06 Oligochaeta sp. 47.39 Nov 06 Ostracoda sp. 31.7 only Apr 07 Diptera sp. Pupae 52.03 Apr 07 Galba truncatula 35.66 only Nov 06 Zygoptera sp. (larvae) 55.96 only Apr 07 Anisoptera sp. (larvae) 39.63 only Nov 06 Helobdella stagnalis 59.71 only Nov 06 Limnephilidae sp. Instar III 43.32 only Nov 06
98
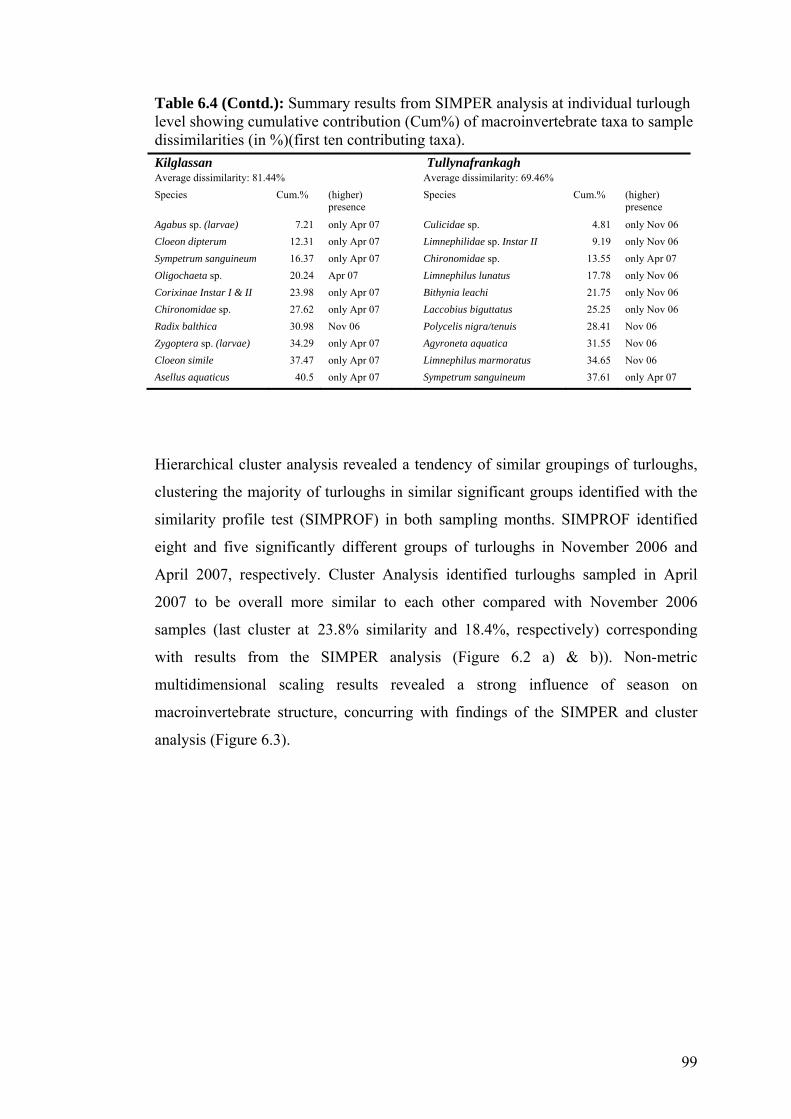
Table 6.4 (Contd.): Summary results from SIMPER analysis at individual turlough level showing cumulative contribution (Cum%) of macroinvertebrate taxa to sample dissimilarities (in %)(first ten contributing taxa). Kilglassan Tullynafrankagh Average dissimilarity: 81.44% Average dissimilarity: 69.46% Species Cum.% (higher)
presence Species Cum.% (higher)
presence
Agabus sp. (larvae) 7.21 only Apr 07 Culicidae sp. 4.81 only Nov 06 Cloeon dipterum 12.31 only Apr 07 Limnephilidae sp. Instar II 9.19 only Nov 06 Sympetrum sanguineum 16.37 only Apr 07 Chironomidae sp. 13.55 only Apr 07 Oligochaeta sp. 20.24 Apr 07 Limnephilus lunatus 17.78 only Nov 06 Corixinae Instar I & II 23.98 only Apr 07 Bithynia leachi 21.75 only Nov 06 Chironomidae sp. 27.62 only Apr 07 Laccobius biguttatus 25.25 only Nov 06 Radix balthica 30.98 Nov 06 Polycelis nigra/tenuis 28.41 Nov 06 Zygoptera sp. (larvae) 34.29 only Apr 07 Agyroneta aquatica 31.55 Nov 06 Cloeon simile 37.47 only Apr 07 Limnephilus marmoratus 34.65 Nov 06 Asellus aquaticus 40.5 only Apr 07 Sympetrum sanguineum 37.61 only Apr 07
Hierarchical cluster analysis revealed a tendency of similar groupings of turloughs,
clustering the majority of turloughs in similar significant groups identified with the
similarity profile test (SIMPROF) in both sampling months. SIMPROF identified
eight and five significantly different groups of turloughs in November 2006 and
April 2007, respectively. Cluster Analysis identified turloughs sampled in April
2007 to be overall more similar to each other compared with November 2006
samples (last cluster at 23.8% similarity and 18.4%, respectively) corresponding
with results from the SIMPER analysis (Figure 6.2 a) & b)). Non-metric
multidimensional scaling results revealed a strong influence of season on
macroinvertebrate structure, concurring with findings of the SIMPER and cluster
analysis (Figure 6.3).
99

Group average
Loug
h C
oy
Kilg
lass
an
Ardk
ill
Gar
ryla
nd
Bla
ckro
ck
Tur
loug
hmor
e
Cah
ergl
assa
un
Rat
hnal
ulle
agh
Loug
h Al
eena
un
Roo
Wes
t
Balli
nder
een
Cro
aghi
ll
Car
row
reag
h
Brie
rfiel
d
Loug
h G
eala
in
Knoc
kaun
roe
Lisd
uff
Tul
lyna
frank
agh
Ter
mon
Coo
lcam
Skea
logh
an
Car
anav
ooda
un
Samples
100
80
60
40
20
0S
imila
rity
Transform: Log(X+1)Resemblance: S17 Bray Curtis similarity
Sprfgpsbhcfagde
a)
Group average
Coo
lcam
Loug
h G
eala
in
Kno
ckau
nroe
Gar
ryla
nd
Loug
h Al
eena
un
Car
row
reag
h
Brie
rfiel
d
Bal
linde
reen
Roo
Wes
t
Rat
hnal
ulle
agh
Tul
lyna
frank
agh
Ardk
ill
Ter
mon
Kilg
lass
an
Lisd
uff
Ske
alog
han
Cro
aghi
ll
Car
anav
ooda
un
Loug
h C
oy
Cah
ergl
assa
un
Samples
100
80
60
40
20
Sim
ilarit
y
Transform: Log(X+1)Resemblance: S17 Bray Curtis similarity
Sprfgpscebda
b)
Figure 6.2: a) Hierarchical cluster analysis dendogram of macroinvertebrate species log(x+1) transformed total abundance data of 22 turloughs sampled in November 2006 and b) 20 turloughs sampled in April 2007.
100
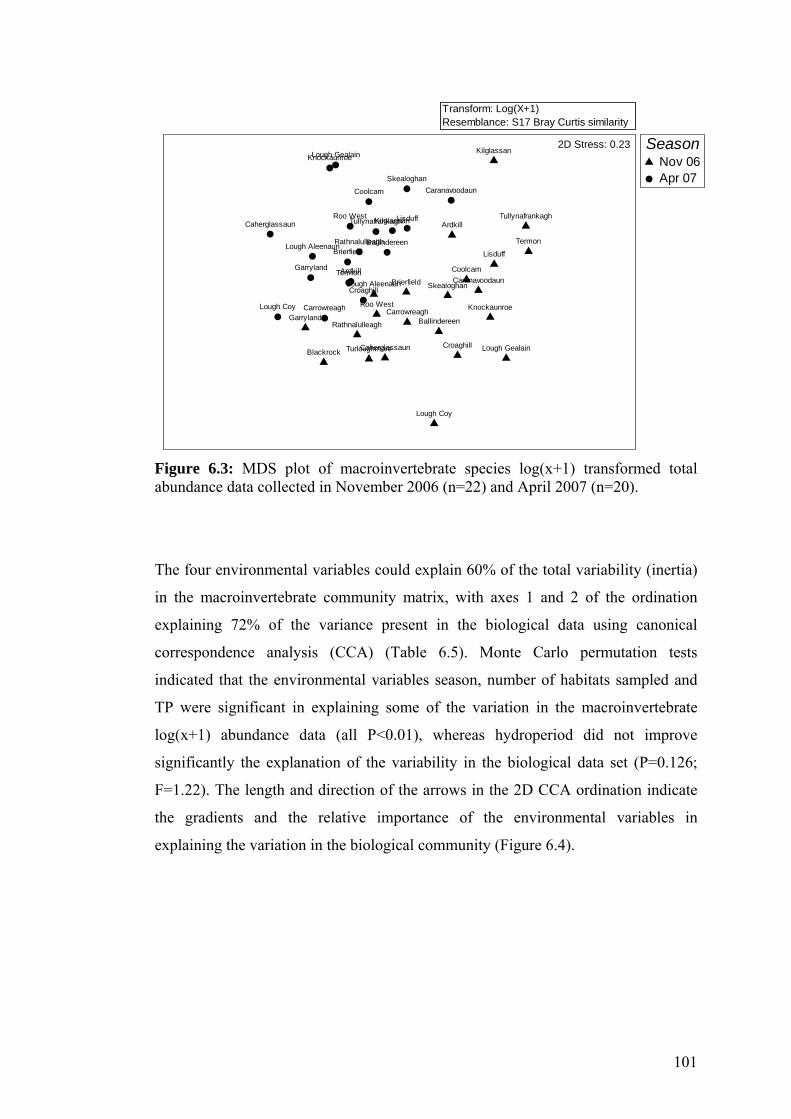
Transform: Log(X+1)Resemblance: S17 Bray Curtis similarity
SeasonNov 06Apr 07
Kilglassan
Lisduff
Garryland
Lough Aleenaun
Roo West
Ballindereen
Lough Coy
Carrowreagh
Lough Gealain
Ardkill
Blackrock
Rathnalulleagh
Knockaunroe
TurloughmoreCaherglassaun Croaghill
Brierfield
Coolcam
Skealoghan
Tullynafrankagh
Caranavoodaun
Termon
KilglassanLisduff
Garryland
Lough Aleenaun
Roo West
Ballindereen
Lough Coy Carrowreagh
Lough Gealain
Ardkill
Rathnalulleagh
Knockaunroe
Caherglassaun
Croaghill
Brierfield
Coolcam
Skealoghan
Tullynafrankagh
Caranavoodaun
Termon
2D Stress: 0.23
Figure 6.3: MDS plot of macroinvertebrate species log(x+1) transformed total abundance data collected in November 2006 (n=22) and April 2007 (n=20).
The four environmental variables could explain 60% of the total variability (inertia)
in the macroinvertebrate community matrix, with axes 1 and 2 of the ordination
explaining 72% of the variance present in the biological data using canonical
correspondence analysis (CCA) (Table 6.5). Monte Carlo permutation tests
indicated that the environmental variables season, number of habitats sampled and
TP were significant in explaining some of the variation in the macroinvertebrate
log(x+1) abundance data (all P<0.01), whereas hydroperiod did not improve
significantly the explanation of the variability in the biological data set (P=0.126;
F=1.22). The length and direction of the arrows in the 2D CCA ordination indicate
the gradients and the relative importance of the environmental variables in
explaining the variation in the biological community (Figure 6.4).
101
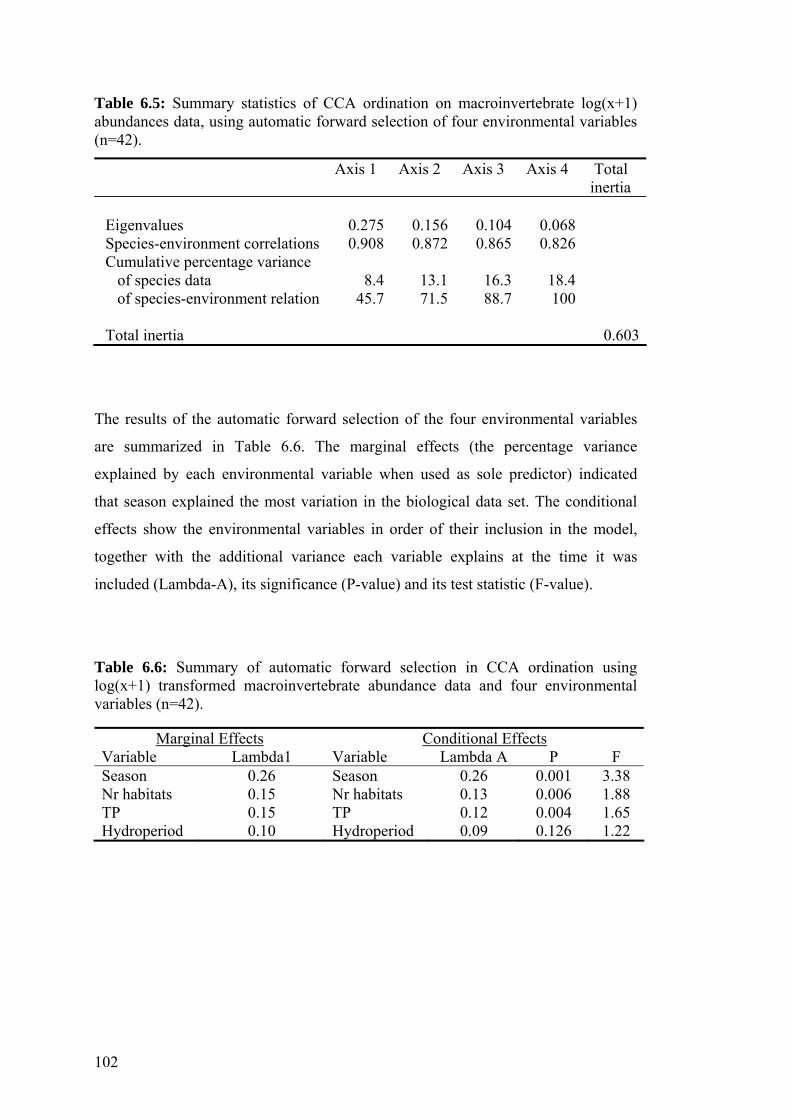
Table 6.5: Summary statistics of CCA ordination on macroinvertebrate log(x+1) abundances data, using automatic forward selection of four environmental variables (n=42).
Axis 1 Axis 2 Axis 3 Axis 4 Total inertia
Eigenvalues 0.275 0.156 0.104 0.068 Species-environment correlations 0.908 0.872 0.865 0.826 Cumulative percentage variance of species data 8.4 13.1 16.3 18.4 of species-environment relation 45.7 71.5 88.7 100 Total inertia 0.603
The results of the automatic forward selection of the four environmental variables
are summarized in Table 6.6. The marginal effects (the percentage variance
explained by each environmental variable when used as sole predictor) indicated
that season explained the most variation in the biological data set. The conditional
effects show the environmental variables in order of their inclusion in the model,
together with the additional variance each variable explains at the time it was
included (Lambda-A), its significance (P-value) and its test statistic (F-value).
Table 6.6: Summary of automatic forward selection in CCA ordination using log(x+1) transformed macroinvertebrate abundance data and four environmental variables (n=42).
Marginal Effects Conditional Effects
Variable Lambda1 Variable Lambda A P F Season 0.26 Season 0.26 0.001 3.38 Nr habitats 0.15 Nr habitats 0.13 0.006 1.88 TP 0.15 TP 0.12 0.004 1.65 Hydroperiod 0.10 Hydroperiod 0.09 0.126 1.22
102
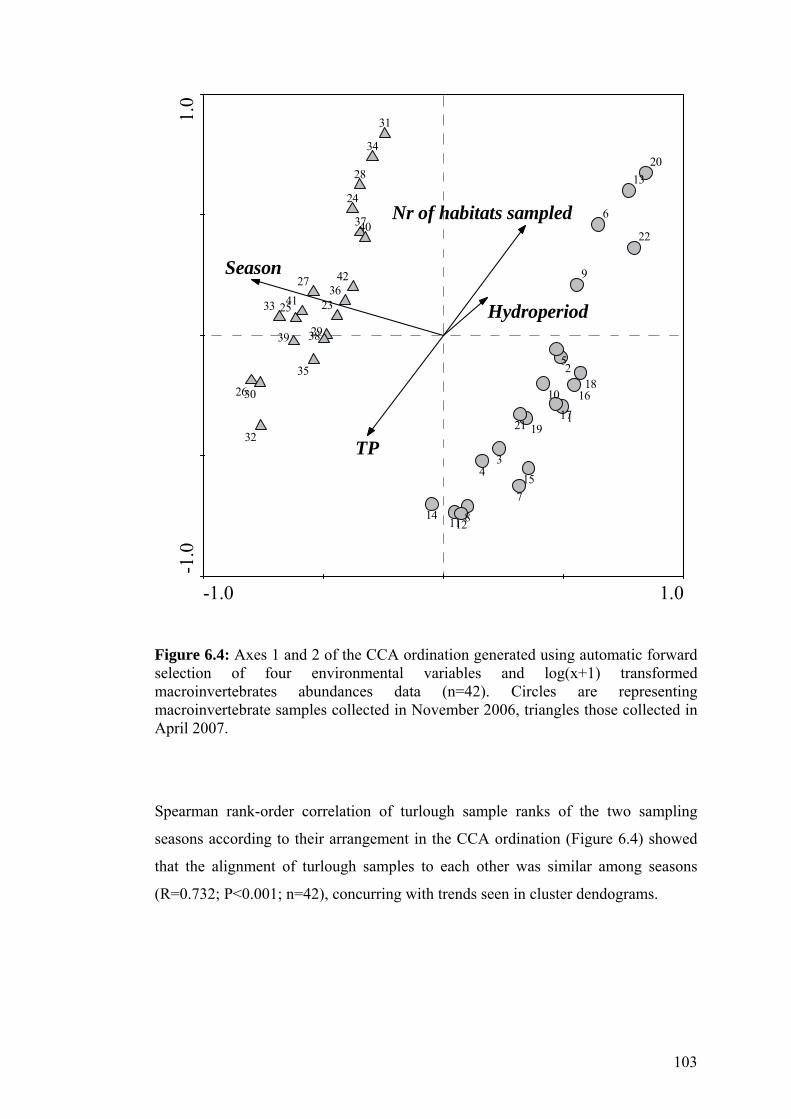
-1.0 1.0
-1.0
1.0
Hydroperiod
Season
TP
Nr of habitats sampled
1
2
34
5
6
7
8
9
10
1112
13
14
15
1617
18
19
20
21
22
23
24
25
26
27
28
29
30
31
32
33
34
35
36
37
3839
40
41
42
Figure 6.4: Axes 1 and 2 of the CCA ordination generated using automatic forward selection of four environmental variables and log(x+1) transformed macroinvertebrates abundances data (n=42). Circles are representing macroinvertebrate samples collected in November 2006, triangles those collected in April 2007.
Spearman rank-order correlation of turlough sample ranks of the two sampling
seasons according to their arrangement in the CCA ordination (Figure 6.4) showed
that the alignment of turlough samples to each other was similar among seasons
(R=0.732; P<0.001; n=42), concurring with trends seen in cluster dendograms.
103

6.3.3 Relating Zooplankton Taxonomic Structure to Nutrient Enrichment
Combining the two sampling strategies for open water cladoceran zooplankton and
chydorids a total of 29 cladoceran zooplankton species were found in the 20
turloughs sampled in April 2007. Recorded taxa varied from common species such
as Chydorus sphaericus or Daphnia pulex, to rare species such as Alona rectangular
or Alonopsis elongata which only occurred in Croaghill and Lough Gealain,
respectively. While some taxa such as Alona rectangula, A. rustica, Alonella excisa
and Alonopsis elongate only occurred in turloughs with low to medium TP
concentrations, the more common Chydorus sphaericus and Daphnia pulex were
found across the whole range of TP concentrations (Table 6.7).
Table 6.7: Summary of cladoceran zooplankton taxa (presence indicated with 1) found in 20 turloughs in April 2007 combining records from open water zooplankton and chydorid sampling protocols. Order of turloughs is ranked according to total phosphorus (TP) concentrations.
Loug
h G
eala
in
Kno
ckau
nroe
Bal
linde
reen
Roo
Wes
t
Lisd
uff
Car
anav
ooda
un
Term
on
Gar
ryla
nd
Cro
aghi
ll
Brie
rfie
ld
Tully
nafr
anka
gh
Kilg
lass
an
Skea
logh
an
Loug
h C
oy
Coo
lcam
Loug
h A
leen
aun
Car
row
reag
h
Cah
ergl
assa
un
Rat
hnal
ulle
agh
Ard
kill
Acroperus angustatus 1 1 1Acroperus harpae 1 1Alona affinis 1 1 1 1 1 1 1 1 1 1 1 1 1 1 1Alona excisa 1 1 1Alona guttata 1 1 1 1Alona intermedia 1 1Alona quadrangularis 1 1 1 1Alona rectangula 1Alona rustica 1 1 1 1Alonella excisa 1 1 1 1 1 1 1 1 1 1 1Alonella nana 1 1Alonopsis elongata 1Chydorus globosus 1 1 1Chydorus latus 1 1 1 1 1Chydorus ovalis 1Chydorus piger 1Chydorus sphaericus 1 1 1 1 1 1 1 1 1 1 1 1 1 1 1 1 1 1 1 1Daphnia pulex 1 1 1 1 1 1 1 1 1 1 1 1 1 1 1 1 1 1 1Eurycercus glacialis 1 1 1Eurycercus lamellatus 1 1 1 1 1 1 1 1 1 1 1 1 1 1 1Graptoleberis testudinaria 1 1 1 1 1 1 1 1 1 1 1Lathurona rectirostris 1 1 1 1 1 1 1 1 1 1 1Leydigia leydigi 1 1Peracantha truncata 1Pleuroxus laevis 1 1 1 1 1 1 1Pleuroxus trigonellus 1 1 1 1Polyphemus pediculus 1 1Rhynchotalona rostrata 1Simocephalus vetulus 1 1 1 1 1 1 1 1 1 1 1 1 1 1
TP µg L-1 2 3 5 8 8 11 11 12 14 15 18 18 20 25 27 31 36 38 43 98
1
1
104

6.4 Discussion
6.4.1 Macroinvertebrate Community Composition and its Relationship to Environmental Variables
6.4.1.1 Season
Non-metric multidimensional scaling (MDS), SIMPER and Canonical
Correspondence Analysis (CCA) revealed a strong influence of sampling season on
macroinvertebrate community structure of turloughs. Seasonal differences in
macroinvertebrate community assemblages are most likely owing to differences in
life-cycle stages of different taxa, with ephemeral taxa more abundant later in the
season (Boix et al., 2004; Jocqué et al., 2007). Differences in community structures
among the different sampling months were identified by SIMPER mainly as a result
of increases or appearances of ephemeral taxa in April 2007 samples. Trichoptera
(predominantly early instar stages) were, however, mainly collected in November
2006 samples. The comparatively low representation of Trichoptera larvae in later
season samples, albeit being characterised as an ephemeral macroinvertebrate
species, could be partly owing to the sampling regime used. Samples were collected
in the same location of the accessible, wadable littoral zone of each turlough in each
month moving along a transect with the turlough shore line with increasing or
decreasing water level. Trichopteran larvae could have migrated to deeper parts of
the turlough and, thus, been omitted with the sampling strategy used. The alternative
possibility is an early emergence of Trichoptera larvae from turloughs before the
collection of samples in April 2007.
Cluster Analysis and SIMPER estimated overall similarity of turlough
macroinvertebrate communities to be higher in April 2007 than in November 2006.
This suggests a stabilisation of the macroinvertebrate community of turloughs over
time which is in agreement with results from the study on temporal dynamics of
macroinvertebrates in turloughs reported in Chapter 4. Moving further away from a
disturbance, in this case the occurrence of the dry phase and, thus, habitat loss for
aquatic invertebrates in turloughs, the greater the possibility of niche building and
stabilisation of the faunal communities will be (Jocqué et al., 2007). Significantly,
different groups of turloughs clustering together identified using the SIMPROF-test
105
decreased from eight in November 2006 to five in April 2007, supporting the higher
resemblance of macroinvertebrate community structures in later season samples.
Despite differences in overall turlough similarities among sampling months, certain
macroinvertebrate taxa were identified to occur in all of the sampled turloughs,
accounting for about one third (27.6% and 32.3% overall similarity of turloughs in
November 2006 and April 2007, respectively) of the community. This
macroinvertebrate ‘core group’ comprises taxa which were previously described as
characteristic turlough species such as the molluscs Lymnaea fusca, Radix balthica
and Galba truncatula (Byrne et al., 1989; Donaldson et al., 1979), the beetles
Porhydrus lineatus, Hydroporus palustris, larvae of the genus Agabus sp. and
Dryops sp. (Bilton, 1988), the damselfly Lestes sp. and dragonfly Sympetrum
sanguineum (Nelson and Thompson, 2004), the mayfly Cloeon dipterum, caddis-fly
species of the family Limnephilidae, Ostracoda sp. and the amphipod Asellus
aquaticus (Reynolds, 1982, 1985b, 1996; Reynolds, 1997; Reynolds, 2003). Even
though some of the macroinvertebrate taxa identified as the ‘core group’ are
common inhabitants of ponds (Lansbury, 1965; Reynolds, 2000), they all possess
special adaptations to the ephemeral turlough environment either through the
formation of resting stages or resistance to desiccation, or through migration to
permanent water bodies as aerial adults (Reynolds, 1982, 1996; Sheehy Skeffington
et al., 2006).
6.4.1.2 Nutrient Enrichment
CCA identified total phosphorus (TP) concentrations as important in structuring the
macroinvertebrate community of turloughs. Other studies have emphasized the
importance of trophic conditions in determining the structure of macroinvertebrate
assemblages (Brauns et al., 2007; Brodersen et al., 1998; Heino, 2000; Langdon et
al., 2006; Rasmussen, 1988; Tolonen et al., 2001; Tolonen et al., 2005; White et al.,
2003). Brauns et al. (2007) found macroinvertebrate community composition
between oligotrophic and hypertrophic lakes to differ significantly from each other
while communities from mesotrophic lakes were less distinct. The same study,
furthermore, identified the effects of trophic state on macroinvertebrate assemblages
to be nested within habitat type and partly substituted by biotic interactions and
small-scale habitat complexity. Indicators of nutrient enrichment, chlorophyll a and
106

Secchi depth were identified as important in contributing to structuring the
macroinvertebrate community in a study on 39 Danish lakes of differing trophic
state using CCA (Brodersen et al., 1998). Although Tolonen et al. (2001) identified
habitat structure to be more important than trophic state in structuring
macroinvertebrate communities in lakes, their results were from lakes within a
limited range of nutrient concentrations (TP among all studied habitats: 3-26 μg L-1).
White and Irvine (2003), in contrast, found physical, chemical and other
environmental conditions to have a greater effect than substrata on structuring
macroinvertebrate assemblages in a study across systems comprising a wider trophic
range. In this study nutrient concentrations were shown also to be important in
structuring macroinvertebrate communities of turloughs, with similar importance to
habitat heterogeneity. The interrelatedness of nutrient trophic state and habitat
structure, however, can make the separation of the two effects on macroinvertebrate
community structure often difficult (Brauns et al., 2007; Brodersen et al., 1998;
Solimini et al., 2006).
Occurrences of macroinvertebrate orders Aranea, Odonata and Trichoptera showed a
significant negative correlation with increasing nutrient concentration of turloughs,
while Diptera and Ostracoda abundances increased significantly with nutrient state.
Aquatic macroinvertebrates such as Odonata or Trichoptera larvae are widely
recognised as characterizing habitat quality since they are sensitive indicators of
environmental stressors, such as altered hydrology and nutrient enrichment (Moore,
1980; Nelson et al., 2004; Resh and Jackson, 1996). While decreases in species
richness were reported to occur as a response to nutrient enrichment of freshwaters
(Brodersen et al., 1998; Rasmussen, 1988), some taxa may benefit from these
extreme conditions owing to reduced biotic-interactions. Ostracoda have previously
been reported as tolerant to a wide range of environmental conditions and certain
species have been identified to proliferate in extreme environments, with increasing
abundances in more productive systems (Külköylüoğlu et al., 2007; Wetzel, 2001;
Yılmaz and Külköylüoğlu, 2006). The positive correlation of Diptera with increased
trophic state of turloughs is in agreement with previous reports by Hellawell (1986)
and Rosenberg and Resh (1993a) and their traditional use as indicators of pollution.
.
107

6.4.1.3 Habitat
CCA identified the number of habitats sampled to have a strong relationship with
macroinvertebrate community structure. Habitats sampled varied from submerged
grassland (dominant habitat type in most turloughs) limestone pavement and stone
walls, submerged shrub flora to thick stands of sedges or reeds. The importance of
habitat heterogeneity for macroinvertebrates is well known (Heino, 2000; Hinden et
al., 2005; Stoffels et al., 2005; Tolonen et al., 2001; Tolonen et al., 2003; van den
Berg et al., 1997; White et al., 2003), with distinct invertebrate communities often
associated with particular habitat types. In a study on two eutrophic lakes van den
Berg (1997) identified vegetation type as a major factor in determining
macroinvertebrate community composition. Cheruvelil et al. (2000) found plant
architecture to have a significant influence on macroinvertebrate abundance, with
dissected-leaf macrophytes supporting higher numbers of macroinvertebrates than
broad-leafed vegetation.
Habitat heterogeneity also significantly influenced macroinvertebrate taxon richness
in turloughs. Habitat diversity has previously been identified to have a positive
effect on macroinvertebrate taxon richness (Brönmark, 1985; Jeppesen et al., 2000;
Tolonen et al., 2003). Increasing numbers of habitats provide more potential niches
(Heino, 2000) favouring coexistence of potential competitors. Submerged vegetation
can also provide shelter from predation by fish (if present). Tolonen et al. (2003)
found Odonata, Corixidae, Dytiscidae, Ephemeroptera and Sialidae taxa in lower
abundances in macrophyte-poor regions compared with areas of thick macrophyte
stands and postulated their depletion by fish because of the greater visibility of these
larger macroinvertebrates in visibly unprotected areas. The loss of submerged
vegetation not only causes an increase in predation pressure but also a decrease in
important food resources for many macroinvertebrates such as epiphytic algae
associated with macrophyte habitats (Jones et al., 1998).
The number of available habitats varied in some of the studied turloughs among
seasons, owing to changes in water levels and consequently available habitats in the
littoral zone. Thus, the seasonal changes in the macroinvertebrate community may
also be influenced by seasonal differences of habitat availability in turloughs
(Solimini et al., 2006). Pieczyńska (1998) found invertebrate littoral fauna to be
108

regulated by seasonal changes in species composition and abundance of submerged
vegetation. Seasonal changes in habitat preference of macroinvertebrate taxa in
accordance with life-cycle stages may affect community composition (Solimini et
al., 2006). A positive correlation was found between Plecoptera taxa (only Nemoura
cinerea), which were generally seldom detected, and the number of habitats
sampled. Plecoptera are widely credited as bioindicators in rivers, including of
acidification, sedimentation, nutrient enrichment and loss of riparian structures
(Camargo et al., 2004; Küry, 1995; Quinn and Hickey, 1990; Resh et al., 1996a).
However, Plecoptera are not common inhabitants of standing waters and especially
not temporary ponds (Williams, 1997), but Nemoura cinerea, a stonefly species very
abundant and widespread in Britain and Ireland has been previously reported from
turloughs (Byrne, 1981) and Pant-y-Llyn, a seasonal lake in Wales (Blackstock et
al., 1993). The positive relationship between Aranea occurrences with more
structurally complex habitats probably reflects modes of feeding or movement (e.g.
net or web building) (Warren, 1989). Significantly greater abundances of Odonata
and Trichoptera taxa in turloughs with higher habitat heterogeneity could be
attributed to refuges from predation by fish (if present) (Gilinsky, 1984) or perches
for feeding (Brooks and Lewington, 1997; Nelson et al., 2004; Warren, 1989).
6.4.1.4 Hydroperiod
The importance of hydroperiod on the biodiversity of temporary waters has been
reported by a number of authors (Batzer et al., 2004; Brooks, 2000; Collinson et al.,
1995; Schneider, 1999) identifying habitat loss during dry periods as severe
disturbance for the macroinvertebrate community (De Meester et al., 2005; Holland
and Jenkins, 1998; Schneider et al., 1996; Sousa, 1984). In this study, turlough
macroinvertebrate taxon richness increased significantly with increasing
hydroperiod of turloughs. Results from CCA, however, suggest that hydroperiod had
a low influence on community composition of macroinvertebrates compared with
the other environmental variables measured, and did not describe any additional
variation in the biological community after including it in the model (marginal
effect: λ1= 0.10; conditional effect: λA=0.09, P=0.126, F=1.22). The effect of
hydroperiod on community compositions could be expected to be reflected in higher
abundances of ephemeral taxa in more permanent turloughs, because in turloughs
with longer habitat permanence there is a greater possibility of colonization. Thus,
109
effects of hydroperiod are directly linked to macroinvertebrate life-stages. The
strongly dominating seasonal effect on macroinvertebrate community structure
seems most likely to have an overriding effect on hydroperiod, which nevertheless
has an important effect on shaping macroinvertebrate diversity of turloughs. The
interrelatedness of macroinvertebrate life-strategies and hydroperiod was also
evident from the significant positive correlation of Trichoptera and Heteroptera
abundances with hydroperiod. Both macroinvertebrate groups are ephemeral
residents of temporary waters and need more permanent habitats in order to
complete their life-cycles before water recedes (Lahr, 1997; Lahr et al., 1999;
Williams, 1987). The association of higher abundances of Gastropoda in turloughs
with longer hydroperiods concurs with their limited mobility (Follner and Henle,
2006). Despite possessing adaptations to drought (Williams, 2006), the limited
mobility of molluscs seems to permit greater survival in longer inundated sites.
6.4.2 Zooplankton Community Structure and its Relationship to Environmental Variables
The cladocerans found in this study are generally well known in turlough conditions.
Acroperus harpae, Alona affinis, Alonella excisa, Chydorus sphaericus, Eurycercus
lamellatus, Graptoleberis testudinaria and Simocephalus vetulus were previously
recorded in Knockaunroe and Lough Gealain (Reynolds, 1985a). Reynolds et al.
(2004) detected 15 taxa belonging to four families in a survey on 28 turloughs early
in the season, with Chydorus sphaericus occurring in all but one of the sampled
turloughs, sometimes as the only species present. This almost ubiquitous distribution
of C. sphaericus is in agreement with the results of this study, which identified C.
sphaericus together with Daphnia pulex as the most common zooplankton species.
C. sphaericus dominated almost a third of 66 studied shallow European lakes,
generally those demonstrating low diversity, in a study by de Eyto et al. (2003). C.
sphaericus can colonize new environments quickly as it is characterised by the
ability to utilize various food sources more efficiently than more littoral, detritus
feeding species such as Alona affinis (de Eyto and Irvine, 2001). It is tolerant of a
wide range of environmental conditions (Fryer, 1993) and possibly the most
ubiquitous chydorid species in Ireland (Duigan, 1992).
110
Eurycercus glacialis was first recorded in Ireland by Duigan and Frey (1987b) in
1985 in four sites close to Gort, Co. Galway, while investigating thirty-eight sites in
the karstic limestone region between Ballyvaughan, Gort and Corofin, Cos. Galway
and Clare. So far it has been recorded from eighteen turloughs (Duigan et al., 1987b;
Reynolds et al., 1999) of which seventeen were considered to lack vertebrate
predators. It is assumed that E. glacialis, as well as other cladoceran species forming
resting eggs, would be able to occur with vertebrate predators such as newts or fish
if the populations’ diapauses commence before juvenile predators will be large
enough to prey on the large entomostracan (Reynolds, 2000). This study detected
E. glacialis in three of the twenty turloughs, all of which also contained larger
predatory invertebrate species of the order Odonata and/or predatory flatworms.
Reynolds (2000) reported the simultaneous occurrence of both entomostracans and
predators in some turloughs and assumed the rather large size of the cladoceran
larvae would make them unsuitable as prey for the coexisting carnivorous
cladoceran Polyphemus pediculus. Furthermore, he attributed habitat complexity to
permit the occurrence of predatory leeches, flatworms and Odonata larvae and
E. glacialis in several of the study sites in the Gort-Kinvara area. Reynolds et al.
(2004) described E. glacialis as an indicator of turlough conditions rather than water
quality, as its occurrence is limited to turloughs whose hydrology is unimpacted by
major drainage.
Cladoceran zooplankton and chydorid abundances increased significantly with
increasing permanence of turloughs. This is in agreement with Duigan (1988) who
concluded that turloughs which contain permanent still or flowing water throughout
the year have higher invertebrate abundance and greater taxon richness than those
drying out for a certain amount of time. This study, however, did not find any
correlation between hydroperiod of turloughs and cladoceran zooplankton diversity.
Cladoceran zooplankton and chydorid abundances were both positively related to
trophic state of turloughs. The abundance and biomass of zooplankton is usually
positively related to nutrient concentrations (Karjalainen et al., 1999; McCauley and
Kalff, 1981; Tolonen et al., 2005) owing to the positive relationship of
phytoplankton abundance with nutrient enrichment and, thus, higher food
availability for zooplankton in nutrient rich waters (Canfield and Jones, 1996). The
diversity of zooplankton has been found to be highest in complex vegetated habitats
111
(Van den Brink et al., 1994). The number of habitats sampled did not, however,
have any association with chydorid species richness, which is in agreement with
Tolonen et al. (2005) who did not find any relationship with zooplankton taxon
richness and environmental variables, including habitat. Chydorid species richness
did not differ among rocky and macrophyte sampling sites in the 66 European
shallow lakes sampled by de Eyto et al. (2003). The lack of correlation of taxon
richness with habitat heterogeneity is nevertheless surprising as it is generally
considered that areas with higher spatial heterogeneity posses higher species
richness (Rasmussen, 1988; Rundle and Ormerod, 1991).
Some zooplankton species showed marked preferences for certain turlough types.
Presence of Alonopsis elongata in only one turlough, the turlough with lowest
nutrient concentrations, suggests a low tolerance of this species to eutrophication.
This is in agreement with other studies identifying its distribution as limited to
colder, oligotrophic water bodies (de Eyto et al., 2003; Fryer, 1993; Irvine et al.,
2001b). Alona rustica and Alonella excisa have been reported to show negative
correlations with nutrient trophic state of lakes (de Eyto et al., 2002; de Eyto et al.,
2003) and were predominantly found in turloughs with low to medium trophic state.
Cladoceran zooplankton taxon richness significantly decreased with increasing
trophic state of turloughs, which concurs with findings by other authors linking high
nutrient status to a shift from diverse zooplankton assemblages to monospecific
communities of predominantly C. sphaericus in eutrophic waters (de Eyto, 2001;
Duigan and Murray, 1987a). This effect was, however, not congruent for
macroinvertebrate taxon richness, indicating that the link between littoral
macroinvertebrates and zooplankton is not direct but rather that conditions in the
turloughs affect both, but in different ways. As zooplankton as well as
macroinvertebrates are second order consumers, tangible links are unlikely, which
was reflected in a lack of correlation between neither cladoceran nor chydorid taxon
richness and macroinvertebrate taxon richness.
112

6.5 Conclusions
Season explained the most variability in the macroinvertebrate community data set
emphasizing the importance of temporal variability in assemblage structure for the
sampling of macroinvertebrates for monitoring purposes. Life-cycle attributes (e.g.
reproduction, hatching and emergence periods) need to be carefully considered
when deciding on sampling strategies for conservation purposes (Cayrou and
Céréghino, 2005). The similar grouping of turloughs in the two different sampling
seasons, however, indicates that despite considerable temporal variation in
macroinvertebrate community composition, macroinvertebrate communities are
nevertheless comparable among turloughs when sampled at the same time. Sampling
for monitoring of ecological status of turloughs should always be carried out within
limited time spans in order to reduce variation owing to phenology and colonisation,
thus, discriminating meaningful results from the background noise of temporal
variation. Variable associations of the macroinvertebrate as well as the zooplankton
communities to environmental variables were found, with some macroinvertebrate
orders and zooplankton species showing significant relationships with chemical
descriptors of nutrient enrichment. Despite the importance of habitat heterogeneity
on macroinvertebrate community structure single habitat sampling showed similar
results when compared with a more labour intensive multi-habitat sampling
approach. While seasonal as well as spatial variations can be marked among littoral
macroinvertebrate assemblages, the results of this study suggest that littoral
shoreline samples of benthic macroinvertebrates can be a meaningful descriptor of
turlough ecological status. The complexity of benthic macroinvertebrate
communities and possible difficulties associated with temporal and spatial variation
may, however, make their use for routine monitoring programmes of the variable
turlough environment difficult. Yet, some chydorid species offer an alternative
biotic element for monitoring of turloughs as their identification is less complex and
this group includes a number of possibly useful indicators of ecological change.
113

114

7 Discussion
7.1 Research Aims
The overall aim of this study was to investigate the effects of season, habitat,
hydroperiod and water chemistry on the distribution of turlough aquatic invertebrate
communities. Twenty-two turloughs, selected as representative of geographical
distribution and hydrological conditions were included in the study. A comparative
study of eight turloughs representing a nutrient gradient determined
macroinvertebrate community distinctiveness in a stratified sampling design and
related assemblage structures to environmental variables. Assessment of
macroinvertebrate temporal and spatial variation was the objective of separate
studies conducted in a subset of four turloughs, varying in hydrological and nutrient
regimes. The influence of disturbance and habitat characteristics on
macroinvertebrate community dynamics was tested. Across twenty-two turloughs
macroinvertebrates and cladoceran zooplankton communities were analysed and
their relation to varying trophic, hydrological and morphological regimes identified.
7.2 Importance of Season, Habitat, Nutrients and Hydroperiod for Turlough Invertebrate Distinctiveness and Community Structures and Implications for Monitoring
Components of this study indicated the importance of season, habitat, nutrient status
and hydroperiod for invertebrate distinctiveness and community composition, with
important implications for monitoring programmes (see summary in Figure 7.1).
7.2.1 Season
A strong influence of season on macroinvertebrate biodiversity and community
structure was found. Trends identified in the detailed study on successional patterns
in macroinvertebrate communities conducted in four turloughs (Chapter 4) were
verified by an independent data set of twenty-two turloughs using a multi-habitat
sampling approach. Both studies identified season to be important for structuring
macroinvertebrate assemblages of turloughs. Two phases of succession were
identified, which were primarily characterised by an increase or appearance of
ephemeral taxa later in the season. The importance of season for macroinvertebrate
communities was confirmed in a wider study on twenty-two turloughs. Differences
115

in macroinvertebrate community composition among sampling months reflected
life-stages of macroinvertebrates. Early season species were identified as those
possessing resting/dormant stages, or resistance to desiccation allowing them to take
advantage of the ephemeral nature of the turlough environment before the
community diversifies. Macroinvertebrate species which arrive in the late
successional stage are considered ephemeral residents of turloughs, depending
largely on migration or aerial dispersal as they do not possess adaptations to
drought. These results concur with other studies on macroinvertebrate succession in
temporary freshwater environments (Boix et al., 2004; Jocqué et al., 2007; Lahr,
1997; Lahr et al., 1999; Wiggins, 1980). Changes in life cycle and abundance and an
increase of ephemeral taxa later in the season contributed, subsequently, to an
increase in spatial variation in macroinvertebrate community structure as reported in
Chapter 5. The increase of ephemeral taxa later in the season and their possibly non-
random habitat selection could, furthermore, lead to increased patchiness of
macroinvertebrate distribution (Blaustein et al., 2004; Resetarits, 2001). Not only
seasonal variation as a result of succession was found important for structuring
processes of the turlough macroinvertebrate communities. Macroinvertebrate taxon
richness and community structures varied interannually. The later onset of flooding
during sampling season 2007/2008 of about one month compared with the previous
year could explain the observed shift of equally one month in the successional
pattern. Sampling for monitoring of turloughs should account for seasonal and
interannual variability of turlough macroinvertebrate communities. Monitoring
programmes relying on single annual samples could lead to an underestimation of
turlough biodiversity, and negatively influence quality scores if taxa such as
Ephemeroptera, Odonata or Trichoptera are included as indicator taxa of
anthropogenic disturbances. These animals can emerge before water recedes in
spring or early summer. Single season sampling could moreover overlook short-
lived or egg-diapausing macroinvertebrate taxa. The highly variable turlough
environment requires a flexible and adaptable sampling programme, to allow for
interannual variability of macroinvertebrate communities. Variable starts of the
flooding cycle should be taken as an orientation rather than sticking to a fixed
sampling-month regime. Thus, adequate turlough sampling needs to be aligned with
the start of the turlough flooding season and temporary stratified according to the
116

needs of respective monitoring programmes. Timing and frequency of sampling
should depend on particular questions dealt with by respective sampling protocols.
7.2.2 Habitat
The number of habitats sampled explained a significant amount of variance in the
macroinvertebrate total abundance data of twenty-two turloughs. Habitat
heterogeneity has been recognised as important for structuring macroinvertebrate
communities in lentic freshwaters (Heino, 2000; Hinden et al., 2005; Stoffels et al.,
2005; Tolonen et al., 2001; Tolonen et al., 2003; van den Berg et al., 1997; White
and Irvine, 2003), with various macrophyte communities or sediment types
associated with distinct macroinvertebrate assemblages (Brauns et al., 2007;
Cheruvelil et al., 2000; Hinden et al., 2005; Pieczyńska et al., 1998; Tolonen et al.,
2001; van den Berg et al., 1997). The positive influence of habitat heterogeneity on
macroinvertebrate taxon richness is in agreement with previous studies (Brönmark,
1985; Jeppesen et al., 2000; Tolonen et al., 2003). Increasing number of habitats
leads to an increase in potential refugia from predation by fish (Tolonen et al., 2003)
and may support the coexistence of competing taxa (Heino, 2000). Seasonal changes
of habitat availability reported in this study could have contributed to seasonal
faunal differences. Changes in habitat preferences of certain taxa as a result of
different life-cycle stages are also reported to affect community structures
(Pieczyńska et al., 1998; Solimini et al., 2006).
Differences in macroinvertebrate assemblages among turlough habitats were
identified in Chapter 5. This study found certain macroinvertebrate taxa of
conservation concern to be associated with particular habitats. For a comprehensive
conservation assessment, a sampling regime incorporating all available habitats in a
turlough seems necessary, as this would provide a more comprehensive picture of
turlough biodiversity. Several parts of this study, however, identified variation
within turlough macroinvertebrate communities to be less than among turlough
variability. This adds weight to the usefulness of macroinvertebrates as reliable
indicators of change even across a range of habitat types despite inherent spatial
variation in littoral zones. Similar results were found by White and Irvine (2003) in
a study on twenty-one Irish lakes. Whether one or multiple habitats should be
sampled for monitoring purposes should consequently depend on the objective of
117

respective sampling protocols. If the aim of a sampling programme is the detection
of a pressure response, routine standardised among turlough sampling of the most
dominant turlough habitat submerged grassland seems highly appropriate. This
stratified sampling approach would reduce inherent spatial ‘noise’ and, furthermore,
facilitate cost and time effective monitoring of turloughs. Reduction of inherent
variability would strengthen the possibility of detecting anthropogenic disturbances
in turlough littoral zones. The results of this study emphasize the suitability of a
single or pooled submerged grassland macroinvertebrate sample for routine turlough
monitoring as required under the WFD (EC, 2000). For a comprehensive survey of
turlough macroinvertebrate biodiversity as required for conservation assessment
under the EC Habitats Directive (EEC, 1992), sampling all available habitats in a
turlough would, however, be favoured. This thorough sampling approach would
enhance the possibility of the detection of local and internationally rare taxa.
7.2.3 Nutrients
The importance of trophic conditions for structuring macroinvertebrate assemblages
in freshwater environments has been widely acknowledged (Brauns et al., 2007;
Brodersen et al., 1998; Heino, 2000; Langdon et al., 2006; Rasmussen, 1988;
Tolonen et al., 2001; Tolonen et al., 2005; White et al., 2003). This study identified
total phosphorus (TP) concentrations as important in structuring macroinvertebrate
communities of turloughs. Brauns et al. (2007) found distinct macroinvertebrate
assemblages in oligotrophic and hypertrophic lakes while communities in
mesotrophic lakes were less distinct, with effects of trophic state nested within
habitat type. The importance of nutrient enrichment on the structuring of
macroinvertebrate communities was identified by Brodersen et al. (1998) in a study
on 39 Danish lakes. Canonical Correspondence Analysis (CCA) results showed
turlough nutrient status to be similarly important as habitat heterogeneity for
macroinvertebrate communities in turloughs. Separating the effects of habitat
structure on macroinvertebrate assemblages from those of nutrient trophic state can
be difficult as these are often interrelated (Brauns et al., 2007; Brodersen et al.,
1998; Solimini et al., 2006). Taxonomic groups responded to increased nutrient
concentrations with higher abundances of Diptera and Ostracoda, while orders
Aranea, Odonata and Trichoptera showed a significant negative correlation with
nutrient state. These findings correspond to those from various other studies
118

(e.g. Hellawell, 1986; Moore, 1980; Nelson and Thompson, 2004; Resh and
Jackson, 1996; Yılmaz and Külköylüoğlu, 2006), emphasizing the potential of
respective macroinvertebrate orders as indicators for nutrient trophic state. Certain
cladoceran zooplankton taxa also showed associations with nutrient state of
turloughs. Low tolerance of Alonopsis elongata to eutrophication has been
previously reported (de Eyto et al., 2003; Fryer, 1993; Irvine et al., 2001b) and
agrees with it being found in only one of the studied turloughs, which had low
nutrient status. Other species such as Alona rustica and Alonella excisa were
predominantly detected in turloughs of low to medium trophic state, concurring with
de Eyto et al. (2002; 2003). Decrease of biodiversity owing to eutrophication of
waters has been previously reported (Brodersen et al., 1998; de Eyto, 2001; Duigan
and Murray, 1987) and was reflected in the decrease of cladoceran zooplankton
taxon richness with nutrient concentrations across the turloughs. The increase of
zooplankton abundance with trophic state of turloughs originates from the positive
relationship of phytoplankton abundance with nutrient enrichment and, thus, higher
food availability for zooplankton in nutrient rich waters (Canfield and Jones, 1996),
and agrees with several other studies (Karjalainen et al., 1999; McCauley and Kalff,
1981; Tolonen et al., 2005). No evidence was, however, found for the influence of
nutrient concentrations on macroinvertebrate taxon richness and abundance, which
is in agreement with Reynolds (2000), who found nutrient concentrations to be
unimportant in determining faunal community diversity in turloughs.
Chapter 4 identified an influence of nutrient enrichment on successional patterns of
macroinvertebrates in turloughs. This was characterised by a general dominance of
taxa considered tolerant to pollution in turloughs with high trophic state (mainly
oligochaetes and chironomids) (Brodersen et al., 1998; Hellawell, 1986; Pinel-
Alloul et al., 1996), and a trend of more susceptible ephemeral residents (if present)
disappearing towards the end of the season owing to their inability to endure
prolonged exposure to high nutrient concentrations. Climate change will possibly
increase the number of stressors affecting turlough ecosystems. Thus, priority should
be given to the reduction of already existing pressures such as nutrient enrichment.
While the spatial and temporal variability of the comparatively complex
macroinvertebrate communities could be challenging for routine turlough sampling,
119

some chydorid taxa have the potential to be used as relatively straightforward
elements for monitoring ecological change of turloughs.
7.2.4 Hydroperiod
The temporary nature of the turlough environment poses a challenge to its faunal
communities. Different macroinvertebrate taxa have adapted in various ways to the
repeating occurrence of drought in turloughs in order to mature, reproduce or
disperse before the end of the wet cycle. Adaptations include the production of
resting eggs and resistance to desiccation by permanent residents of turloughs,
migration of adults to permanent waters, or survival over a dry period as terrestrial
adults by ephemeral residents (Lahr et al., 1999; Williams, 1987). The occurrence of
uncommon invertebrate taxa in temporary ponds has been previously reported
(Collinson et al., 1995; Della Bella et al., 2005; Williams, 1987) and concurs with
findings of invertebrate species and assemblages of restricted distribution and high
conservation value in this study. Several rare invertebrate taxa and assemblages
were detected such as the characteristic ‘edge moss dwelling’ beetle community or
the glacial relict species Eurycercus glacialis many of which are reported as
sensitive to anthropogenic disturbances such as nutrient enrichment (Bilton, 1988;
Shirt, 1987). The loss of water during the periodically occurring dry phase of
turloughs may support not only very distinct and adapted invertebrate communities
but also confer specific advantages to particular rare species including an absence of
fish. The rather large size of E. glacialis was postulated to make it particularly
vulnerable to visual predators, thus, restricting it to temporary habitats (Duigan and
Frey, 1987). The rare damselfly Lestes dryas is also considered to benefit from the
absence of larger predatory invertebrates and fish in many turloughs (Nelson et al.,
2004).
The importance of hydroperiod and, thus, habitat permanence for the diversity of
macroinvertebrate communities in temporary wetlands has been reported by several
authors (Collinson et al., 1995; Kiflawi et al., 2003; Schneider and Frost, 1996;
Waterkeyn et al., 2008; Williams et al., 2003). The dry phase of a turlough can be
defined as a natural disturbance for the faunal communities of turloughs and the
associated hydroperiod length was found to have severe effects on successional
patterns of turlough macroinvertebrates. Macroinvertebrate communities of
120
turloughs with a short hydroperiod and, thus, high disturbance were identified to be
characterised mainly by permanent residents possessing adaptations to the recurring
stress of drought. Wiggins (1980) found the same to be true for faunal communities
of temporary pools. Interannual variability of taxa composition was furthermore
found to be related to interannual differences in hydroperiod (Schneider et al.,
1996). Faunal communities of highly disturbed turlough environments were detected
to support invertebrate community assemblages characterised mainly by permanent
residents after dry years, and greater numbers of ephemeral residents after relatively
wet ones. Variability in taxon richness was negatively correlated with increasing
habitat permanence, favouring more stable communities in turloughs with long
habitat permanence. Complying with stabilising macroinvertebrate assemblages,
variability in taxon richness decreased over time following major disturbance by
drought. With increasing habitat persistence influence of disturbance becomes less
and, finally, biotic interactions become more important (Schneider, 1999). Across
the studied turloughs taxon richness, moreover, increased over time. This temporal
gradient of biodiversity reflects a longer exposure for colonization and emergence
from resting stages (Cayrou and Céréghino, 2005; Holland and Jenkins, 1998;
Spencer et al., 1999). CCA results suggested that hydroperiod had, however, a low
influence on community structures of macroinvertebrates relative to effects of
season, nutrient concentrations and number of habitats sampled. The effect of
hydroperiod on community structure was nevertheless evident in the positive
correlation of ephemeral macroinvertebrate orders Heteroptera and Trichoptera with
increasing habitat permanence. Thus, effects of hydroperiod are directly linked to
macroinvertebrate life-stages and the strong identified seasonal effect had likely an
overriding effect in the CCA analysis.
Possible effects of hydroperiod and its variability among turloughs and years for
macroinvertebrate assemblages of turloughs pose a challenge for the development of
monitoring protocols under the EC WFD (EC, 2000) and the EC Habitats Directive
(EEC, 1992). The highly dynamic nature of turloughs might negate the development
of a classification of turloughs and, thus, associated estimation of type-specific
reference conditions as is required for lakes and rivers. Turlough monitoring
protocols need a more flexible approach, and geared towards flooding regimes and
the variable hydrocycles.
121
7.2.5 Macroinvertebrate Distinctiveness
The highly individual character of turlough macroinvertebrate communities was a
recurrent theme throughout this study. Replicate macroinvertebrate turlough samples
repeatedly formed highly distinct clusters and certain macroinvertebrate taxa
showed associations to certain morphological (e.g. Odonata in well-vegetated
habitats of Caranavoodaun) or water chemical characteristics (e.g. Diptera and
Gastropoda in nutrient rich waters of Caherglassaun) of turloughs. Turlough
macroinvertebrate distinctiveness could be a result of the generally high individual
features of these temporary habitats. Turloughs like other temporary habitats
(Collinson et al., 1995; Williams, 1996; Williams et al., 2003) generally posses very
individual physico-chemical characters and hydromorphological regimes which
contribute to the uniqueness of the habitats. However, similar results have been
reported for lakes (White and Irvine, 2003), suggesting that spatial variation within
lentic freshwaters is nested in among lake/turlough variation. The conclusion from
Chapter 3 that a single submerged grassland sample would be sufficient in
describing the macroinvertebrate community of a turlough was tested in a more
comprehensive spatial study as reported in Chapter 5. Results emphasized the highly
individual character of turlough macroinvertebrate assemblages, leading to the
conclusion that a single submerged grassland habitat sample collected at any
location in the littoral zone of a turlough is representative for the macroinvertebrate
community as a whole. Similar groupings of eight turloughs sampled in April 2007
using a multi-habitat and a single-habitat sampling approach, furthermore, support
this assumption and emphasize the usefulness of macroinvertebrates as reliable
indicators of change despite inherent heterogeneity in the littoral zone of turloughs.
It is, however, a matter of the scale of interest, with conclusions affected by the
extent of the dominating interest. Turloughs may represent quite widespread, but
often unappreciated phenomena of spatial patterns of freshwaters, and maybe all
ecosystems.
122
7.3 Conclusions
• Turlough macroinvertebrate communities are highly distinct and conducive
to simple and cost-effective routine monitoring regimes. A single submerged
grassland habitat sample located in any location of a turlough can provide a
reliable metric of the macroinvertebrate community. This stratified sampling
approach would reduce inherent spatial ‘noise’ and is, thus, suited for the
detection of pressure gradients.
• The number of habitats sampled should depend on the questions addressed
by sampling objectives. When sampling for more holistic purposes, signal
precision should be sacrificed in order to obtain a more comprehensive
survey of turlough biodiversity by adopting a multi-habitat sampling
approach.
• Season had a significant influence on macroinvertebrate community structure
with permanent taxa characterising early season, and ephemeral species
increasing in late season samples. Macroinvertebrate community structure
and biodiversity varied among months and years. Single samples collected
late in the season could lead to an underestimation of turlough biodiversity
and reduce quality scores if based on emerged taxa. Turlough sampling
should be responsive to variable commencements of flooding. Timing and
frequency of sampling should be appropriately stratified depending on
monitoring objectives.
• Macroinvertebrate community structure varied with increased nutrient state
of the turloughs. Total phosphorus concentrations explained a significant
amount of variance in the biological data set and a change in abundance of
taxonomic groups with nutrient enrichment was detected. Macroinvertebrate
successional pattern seem vulnerable to nutrient enrichment with
communities characterised by permanent residents in turloughs, with higher
trophic state. Some macroinvertebrate orders and chydorid taxa have the
potential to be used as biotic elements for monitoring of ecological change of
turloughs.
123
124
• Disturbance, defined as the dry phase of a turlough and rapid changes in
turlough water levels, markedly influenced macroinvertebrate succession and
community structures. High disturbance regimes generally supported lower
biodiversity and communities characterised by taxa possessing adaptations to
drought.
• Turloughs are inherently variable systems which might negate the
development of simple type-specific reference conditions as required for
lakes under the WFD. Turlough sampling regimes need a flexible approach
and should be geared towards the start of the flooding season and variable
hydrocycles.

125
Figure 7.1: Conceptual model of the turlough aquatic invertebrate community, summarizing major findings of this study. Arrows indicate a direct effect on the invertebrate community; dashed lines indicate interactions between factors.
Turlough Macroinvertebrate
Community Structure
Hydroperiod/Disturbance
Turlough Zooplankton
Taxon Richness
Turlough ZooplanktonAbundance
Turlough Macroinvertebrate
Taxon Richness
Nutrient concentrations
Habitat heterogeneity
Season
Turlough Macroinvertebrate
Succession
Turlough Macroinvertebrate
Community Structure
Turlough Macroinvertebrate
Community Structure
Hydroperiod/Disturbance
Turlough Zooplankton
Taxon Richness
Turlough ZooplanktonAbundance
Turlough Macroinvertebrate
Taxon Richness
Turlough Macroinvertebrate
Taxon Richness
Nutrient concentrations
Nutrient concentrations
Habitat heterogeneity
SeasonSeason
Turlough Macroinvertebrate
Succession
Turlough Macroinvertebrate
Succession
125

126

8 References
Abel PD. 1996. Water Pollution Biology. Taylor & Francis Ltd., London.
Ali TH, Holmes JMC, Grainger JNR. 1987. Diaptomus Cyaneus Gurney, a freshwater copepod new to Britain and Ireland. Irish Naturalists' Journal 22: 240-241.
Amoros C. 1984. Crustacés cladocères. Bulletin de la Société Linnéenne de Lyon 53: 72-143.
Anderson MJ, Gorley RN, Clarke KR. 2008 PERMANOVA+ for PRIMER: Guide to Software and Statistical Methods. PRIMER-E: Plymouth, UK.
Ashe P, O'Connor JP, Murray DA. 1998. A checklist of Irish aquatic insects. Irish Biogeographical Society.
Bailey RC, Norris RH, Reynoldson TB. 2001. Taxonomic Resolution of Benthic Macroinvertebrate Communities Bioassessment. Journal of the North American Benthological Society 20: 280-286.
Batzer DP, Palik BJ, Buech R. 2004. Relationships between Environmental Characteristics and Macroinvertebrate Communities in Seasonal Woodland Ponds of Minnesota. Journal of the North American Benthological Society 23: 50-68.
Berendonk TU. 1999. Influence of Fish Kairomones on the Ovipositing Behavior of Chaoborus Imagines. Limnology and Oceanography 44: 454-458.
Biggs J, Fox G, Nicolet P, Walker D, Whitfield M, Williams P. 1998. A guide to the methods of the National Pond Survey. Pond Action, Oxford.
Biggs J, Williams P, Whitfield M, Nicolet P, Weatherby A. 2005. 15 years of pond assessment in Britain: results and lessons learned from the work of Pond Conservation. Aquatic Conservation: Marine and Freshwater Ecosystems 15: 693-714.
Bilton DT. 1988. A survey of aquatic Coleoptera in central Ireland and the Burren. Bulletin of the Irish Biogeographical Society 11: 77-94.
Blackstock TH, Duigan CA, Stevens DP, Yeo MJM. 1993. Vegetation zonation and invetebrate fauna in Pant-y-llyn, an unusual seasonal lake in South Wales, UK. Aquatic Conservation: Marine and Freshwater Ecosystems 3: 253-268.
Blaustein L, Kiflawi M, Eitam A, Mangel M, Cohen J. 2004. Oviposition habitat selection in response to risk of predation in temporary pools: mode of detection and consistency across experimental venue. Oecologia 138: 300-305.
127

Blumenshine SC, Vadeboncoeur Y, Lodge DM, Cottingham KL, Knight SE. 1997. Benthic-Pelagic Links: Responses of Benthos to Water-Column Nutrient Enrichment. Journal of the North American Benthological Society 16: 466-479.
Boix D, Sala J, Moreno-Amich R. 2000. Succession of the macroinvetebrate community in a temporary pond. Verh. Internat. Verein. Limnol. 27: 2586-2593.
Boix D, Sala J, Moreno-Amich R. 2001. The faunal composition of Espolla Pond (NE Iberian Penninsula): The neglected biodiversity of temporary waters. Wetlands 21: 577-592.
Boix D, Sala J, Quintana XD, Moreno-Amich R. 2004. Succession of the animal community in a Mediterranean temporary pond. Journal of the North American Benthological Society 23: 29-49.
Bratton JH. 1991. British Red Data Books: 3. Invertebrates Other than Insects. Joint Nature Conservation Committee.
Brauns M, Garcia X-F, Pusch MT, Walz N. 2007. Eulittoral macroinvertebrate communities of lowland lakes: discrimination among trophic states. Freshwater Biology 52: 1022-1032.
Brett MT. 1989. Zooplankton communities and acidification processes (a review). Water, Air, & Soil Pollution 44: 387-414.
Brodersen KP, Dal PC, Lindegaard C. 1998. The fauna in the upper stony littoral of Danish lakes: macroinvertebrates as trophic indicators. Freshwater Biology 39: 577-592.
Brodersen KP, Lindegaard C. 1999. Classification, assessment and trophic reconstruction of Danish lakes using chironomids. Freshwater Biology 42: 143-157.
Brönmark C. 1985. Freshwater Snail Diversity: Effects of Pond Area, Habitat Heterogeneity and Isolation. Oecologia 67: 127-131.
Brooks RT. 2000. Annual and seasonal variation and the effects of hydroperiod on benthic macroinvertebrates of seasonal forest ("vernal") ponds in Central Massachusetts, USA. Wetlands 20: 707-715.
Brooks S, Lewington R. 1997. Field Guide to the Dragonflies and Damselflies of Great Britain and Ireland. Britsih Wildlife Publishing, Hook.
Byrne RA. 1981. Ecological comparisons of three water bodies in the Burren district of County Clare, Trinity College, Dublin. PhD-thesis.
128

Byrne RA, Reynolds JD, McMahon RF. 1989. Shell growth, reproduction and life cycles of Lymnaea peregra and L. palustris (Pulmonata: Basommatophora) in oligotrophic turloughs (temporary lakes) in Ireland. Journal of Zoology, London 217: 321-339.
Camargo JA, Alonso A, De La Puente M. 2004. Multimetric Assessment of Nutrient Enrichment in Impounded Rivers Based on Benthic Macroinvertebrates. Environmental Monitoring and Assessment 96: 233-249.
Canfield TJ, Jones JR. 1996. Zooplankton abundance, biomass, and size-distribution in selected Midwestern waterbodies and relation with trophic state. Journal of freshwater ecology 11: 171-191.
Cayrou J, Céréghino R. 2005. Life-cycle phenology of some aquatic insects: implications for pond conservation. Aquatic Conservation: Marine and Freshwater Ecosystems 15: 559-571.
Cheruvelil KS, Soranno PA, Serbin RD. 2000. Macroinvertebrates associated with submerged macrophytes: sample size and power to detect effects. Hydrobiologia 441: 133-139.
Clarke KR, Gorley RN. 2006. PRIMER v6: User Manual/Tutorial. PRIMER-E; Plymouth.
Clarke KR, Warwick RM. 2001. Change in marine communities: an approach to statistical analysis and interpretation, 2nd edition. PRIMER-E; Plymouth.
Clesceri LS, Greenberg AE, Eaton AD. 1998. Standard Methods for the Examination of Water and Wastewater. American Publication Health Association, Washington D.C.
Collinson NH, Biggs J, Corfield A, Hodson MJ, Walker D, Whitfield M, Williams PJ. 1995. Temporary and permanent ponds: An assessment of the effects of drying out on the conservation value of aquatic macroinvertebrate communities. Biological Conservation 74: 125-133.
Coté D, Dubois J-M, Gwyn H. 1990. Mysterious lakes. In Early season cladocera diversity of atlantic temporary ponds (turloughs), Reynolds JD, Murphy Mand O'Connor Á (eds). Vol. 57 Archives des Sciences. 99-105.
Coxon CE. 1986. A study of the hydrology and geomorphology of turloughs, Trinity College Dublin. PhD-thesis.
Coxon CE. 1987a. An Examination of the Characteristics of Turloughs, using Multivariate Statistical Techniques. Irish Geography 20: 24-42.
Coxon CE. 1987b. The spatial distribution of turloughs. Irish Geography 20: 11-23.
129
Coxon CE, Drew DP. 1986. Groundwater flow in the lowland aquifer of eastern Co. Galway and eastern Co. Mayo, western Ireland. In New Directions in Karst, Paterson K and Sweeting MM (eds). Geo Books: Norwich.
Davison W. 1990. A practical guide to pH measurement in freshwaters. Trends in Analytical Chemistry 9: 80-83.
de Eyto E. 2001. Chydorus sphaericus as a biological indicator of water quality in lakes. Verh. Internat. Verein. Limnol. 27: 3358-3362.
de Eyto E, Irvine K. 2001. The response of three chydorid species to temperature, pH and food. Hydrobiologia 459: 165-172.
de Eyto E, Irvine K, Free G. 2002. The use of members of the family Chydoridae (Anomopoda, Branchiopoda) as an indicator of lake ecological quality in Ireland. Biology and Environment: Proceedings of the Royal Irish Academy 102B: 81-91.
de Eyto E, Irvine K, Garcia-Criado F, Gyllström M, Jeppensen E, Kornijow R, Miracle MR, Nykänen M, Bareiss C, Cerbin S, Salujõe J, Franken R, Stephens D, Moss B. 2003. The distribution of chydorids (Branchiopoda, Anomopoda) in European shallow lakes and its application to ecological quality monitoring. Archiv für Hydrobiologie 156: 181-202.
De Meester L, Declerck S, Stoks R, Louette G, Van De Meutter F, De Bie T, Michels E, Brendonck L. 2005. Ponds and pools as model systems in conservation biology, ecology and evolutionary biology. Aquatic Conservation: Marine and Freshwater Ecosystems 15: 715-725.
Della Bella V, Bazzanti M, Chiarotti F. 2005. Macroinvertebrate diversity and conservation status of Mediterranean ponds in Italy: water permanence and mesohabitat influence. Aquatic Conservation: Marine and Freshwater Ecosystems 15: 583-600.
Donaldson F, Donaldson F, McMillan NF. 1979. A note on the Mollusca of three turloughs. Irish Naturalists' Journal 19: 400-401.
Donohue LA. 2008. Individual- and community-level response of littoral macroinvertebrates to lake nutrient enrichment, Trinity College Dublin. PhD-thesis.
Downes BJ, Lake PS, Schreiber ESG. 1993. Spatial variation in the distribution of stream invertebrates: implications of patchiness for models of community organization. Freshwater Biology 30: 119-132.
Drew DP. 1990. The hydrology of the Burren, County Clare. Irish Geography 23: 69-89.
130
Drew DP, Coxon CE. 1988. The effects of land drainage on groundwater resources in karstic areas of Ireland. In Proceedings of the 21st I.A.H. Congress, Daoxian Y (ed). Geological Publishing House, Beijing, China. 204-209.
Duigan C. 1992. The ecology and distribution of the littoral freshwater Chydoridae (Branchiopoda, Anomopoda) of Ireland, with taxonomic comments on some species. Hydrobiologia 241: 1-70.
Duigan C, Murray D. 1987a. A contribution to the taxonomy of C. sphaericus sens. lat. (Cladocera, Chydoridae). Hydrobiologia 145: 113-124.
Duigan CA. 1988. The Cladocera (Crustacea) of Lough Ree and neighbouring waterbodies in Ireland. Bulletin of the Irish Biogeographical Society 11: 100-113.
Duigan CA, Frey DG. 1987b. Eurycercus glacialis, a Chydorid Cladoceran new to Ireland. Irish Naturalists' Journal 22: 180-183.
Duigan CA, Kovach WL. 1991. A study of the distribution and ecology of littoral freshwater chydorid (Crustacea, Cladocera) communities in Ireland using multivariate analysis. Journal of Biogeography 18: 267-280.
Dvořaki J, Bestz EPH. 1982. Macro-invertebrate communities associated with the macrophytes of Lake Vechten: structural and functional relationships. Hydrobiologia 95: 115-126.
EC. 2000. Council Directive 2000/60/EC establishing a framework for Community action in the field of water policy. Official Journal no. L 321/1, 22.12.2000.
EC. 2005. Common Implementation Strategy for the Water Framework Directive (2000/60/EC) - Guidance Document No 13 - Overall Approach to the classification of Ecological Status and Ecological Potential.
Edington JM, Hildrew AG. 1995. Caseless caddis larvae of the British Isles - A key with ecological notes. Freshwater Biological Association, Ambleside, U.K.
EEC. 1979. Council Directive 79/409/EEC on the conservation of wild birds. Official Journal no. L 103, 25.04.79.
EEC. 1992. Council Directive 92/43/EEC on the conservation of natural habitats and of wild fauna and flora. Official Journal no. 206, 27.7.92.
Eisenreich SJ, Bannerman RT, Armstrong DE. 1975. A simplified phosphorus analysis technique. Environmental Letters 9: 43-53.
Eitam A, Blaustein L, Van Damme K, Dumont HJ, Martens K. 2004. Crustacean species richness in temporary pools: relationships with habitat traits. Hydrobiologia 525: 125-130.
131

Elliot JM, Humpesch UH, Macam TT. 1988. Larvae of the British Ephemeroptera - a key with ecological notes. Freshwater Biological Association, Ambleside, U.K.
Elliot JM, Mann KH. 1979. A key to the British freshwater leeches. Freshwater Biological Association, Ambleside, U.K.
Fitter R, Manuel R. 1986. Collins Field Guide to Freshwater Life. William Collins Sons Ltd., U.K.
Follner K, Henle K. 2006. The Performance of Plants, Molluscs, and Carabid Beetles as Indicators of Hydrological Conditions in Floodplain Grasslands. International Review of Hydrobiology 91: 364-379.
Foster GN, Nelson BH, Bilton DT, Lott DA, Merritt R, Weyl RS, Eyre MD. 1992. A classification and evaluation of Irish water beetle assemblages. Aquatic Conservation: Marine and Freshwater Ecosystems 2: 185-208.
Friday LE. 1988. A key to the adults of British Water Beetles. Field Studies Council, AIDGAP series.
Fryer G. 1993. The freshwater crustacea of Yorkshire; a faunistic and ecological survey. Yorkshire Naturalists' Union & Leeds Philosophical and Literary Society.
García-Criado F, Bécares E, Fernández-Aláez C, Fernández-Aláez M. 2005. Plant-associated invertebrates and ecological quality in some Mediterranean shallow lakes: implications for the application of the EC Water Framework Directive. Aquatic Conservation: Marine and Freshwater Ecosystems 15: 31-50.
Gilinsky E. 1984. The Role of Fish Predation and Spatial Heterogeneity in Determining Benthic Community Structure. Ecology 65: 455-468.
Gledhill T, Sutcliffe DW, Williams WP. 1993. British freshwater Crustacea Malacostraca: a key with ecological notes. Freshwater Biological Association, Ambleside, U.K.
Goodwillie R. 1992. Turloughs over 10 ha: Vegetation Survey and Evaluation Internal report to the National Parks and Wildlife Service, Office of Public Works, Dublin.
Goodwillie R. 2001. Materials for an Action Plan for the Priority Habitat Tourloughs - Draft of October 2001.
Goodwillie R. 2003. Vegetation of turloughs. In Wetlands of Ireland, Otte ML (ed). University College Dublin Press: Dublin. 135-144.
Goodwillie R, Reynolds JD. 2003. Turloughs. In Wetlands of Ireland, Otte ML (ed). University College Dublin Press: Dublin. 130-133.
132

Gotelli NJ, Entsminger GL. 2006 ECOSIM: Null Models Software for Ecology, Version 7. Acquired Intelligence Inc. & Kesey-Bear, Jericho, VT. http://garyentsminger.com/ecosim/index.htm.
Grainger JNR. 1966. Diaptomus castor in Co. Meath. Irish Naturalists' Journal 15: 211.
Grainger JNR. 1976. Further records for the fairy shrimp Tanymastix stagnalis (L.). Irish Naturalists' Journal 18.
Grainger JNR. 1979. Diaptomus wierzejskii in temporary water bodies in Co. Mayo. Irish Naturalists' Journal 19: 372.
Grainger JNR. 1989. Further records of Diaptomus Cyaneus Gurney, (Crustacea: Copepoda) from temporary waterbodies in Ireland. Irish Naturalists' Journal 23: 160-161.
Grainger JNR. 1991. The biology of Tanymastix stagnalis (L.) and its survival in large and small temporary water bodies in Ireland. Hydrobiologia 212: 77-82.
Grasshoff K, Kremling K, Ehrhardt M. 1999. Mehthods of Seawater Analysis. Verlag Chemie, Weinheim, Germany.
Hall SJ, Raffaelli D, Thrush SF. 1992. Patchiness and disturbance in shallow water benthic assemblages. In Aquatic Ecology. Scale, pattern and process. The 34th Symposium of the British Ecological Society with the American Society of Limnology and Oceanography, University College Cork, Giller PS, Hildrew AGand Raffaelli DG (eds). Blackwell Scientific Publications: Oxford. 333-375.
Harrison SSC, Hildrew AAG. 1998. Patterns in the epilithic community of a lake littoral. Freshwater Biology 39: 477-492.
Hatton-Ellis T. 2008. The Hitchhiker's Guide to the Water Framework Directive. Aquatic Conservation: Marine and Freshwater Ecosystems 18: 111-116.
Heino J. 2000. Lentic macroinvertebrate assemblage structure along gradients in spatial heterogeneity, habitat size and water chemistry. Hydrobiologia 418: 229-242.
Hellawell JM. 1986. Biological Indicators of Freshwater Pollution and Environmental Management. Elsevier, London.
Hershey AE, Lamberti GA. 2001. Aquatic Insect Ecology. Academic Press, California, USA.
Hewlett R. 2000. Implications of taxonomic resolution and sample habitat for stream classification at a broad geographic scale. Journal of the North American Benthological Society 19: 352-361.
133
Hinden H, Oertli B, Menetrey N, Sager L, Lachavanne J-B. 2005. Alpine pond biodiversity: what are the related environmental variables? Aquatic Conservation: Marine and Freshwater Ecosystems 15: 613-624.
Holland DG. 1972. A key to the larvae, pupae and adults of the British species of Elminthidae. Freshwater Biological Association, Ambleside, U.K.
Holland T, Jenkins D. 1998. Comparison of processes regulating zooplankton assemblages in new freshwater pools. Hydrobiologia 387-388: 207-214.
Hynes HBN. 1977. A key to the adults and nymphs of British stoneflies (Plecoptera). Freshwater Biological Association, Ambleside, U.K.
Irvine K, Allott N, De Eyto E, Free G, White J, Caroni R, Kennelly C, Keaney J, Lennon C, Kemp A, Barry E, Day S, Mills P, O'Rían G, Quirke B, Twomey H, Sweeney P. 2001a. Ecological Assessment of Irish Lakes: The development of a new methodology suited to the needs of the EU Directive for Surface Waters.
Irvine K, Moss B, Balls H. 1989. The loss of submerged plants with eutrophication II. Relationships between fish and zooplankton in a set of experimental ponds, and conclusions Freshwater Biology 22: 89-107.
Irvine K, White J, de Eyto E, Free G. 2001b. Invertebrates as bioindicators in the implementation of the Water Framework Directive. In Monitoring and assessment of ecological status of aquatic environments, Karttunen K (ed). Nordic Council of Ministers, Copenhagan.
Jeffries M. 2005. Small ponds and big landscapes: the challenge of invertebrate spatial and temporal dynamics for European pond conservation. Aquatic Conservation: Marine and Freshwater Ecosystems 15: 541-547.
Jeppesen E, Jensen JP, SØndergaard M, Lauridsen T, Landkildehus F. 2000. Trophic structure, species richness and biodiversity in Danish lakes: changes along a phosphorus gradient. Freshwater Biology 45: 201-218.
Jocqué M, Riddoch BJ, Brendonck L. 2007. Successional phases and species replacements in freshwater rock pools: towards a biological definition of ephemeral systems. Freshwater Biology 52: 1734-1744.
Johnson RK. 1998. Spatiotemporal Variability of Temperate Lake Macroinvertebrate Communities: Detection of Impact. Ecological Applications 8: 61-70.
Jones JI, Moss B, Young JO. 1998. Interactions between periphyton, nonmolluscan invertebrates and fish in standing freshwaters. In The Structuring Role of Submerged Macrophytes in Lakes, Jeppesen E, Sondergaard M, Sondergaard Mand Christoffersen K (eds). Springer, New York. 47-68.
134
Karjalainen J, Rahkola M, Holopainen A-L, Huttula T, Jurvelius J, Viljanen M, Avinski V, Letanskaya G, Telesh I. 1999. Trophic gradients and associated changes in the plankton community in two bays of lake Ladoga. Boreal Environment Research 4: 229-238.
Kiflawi M, Eitam A, Blaustein L. 2003. The Relative Impact of Local and Regional Processes on Macro-Invertebrate Species Richness in Temporary Pools. The Journal of Animal Ecology 72: 447-452.
Kilroy G, Coxon C, Ryan J, O'Connor Á, Daly D. 2005. Groundwater and wetland management in the Shannon river basin (Ireland). Environmental Science & Policy 8: 219-225.
Külköylüoğlu O, Dügel M, Kılıç M. 2007. Ecological requirements of Ostracoda (Crustacea) in a heavily polluted shallow lake, Lake Yeniçağa (Bolu, Turkey). In Ostracodology — Linking Bio- and Geosciences. Proceedings of the 15th International Symposium on Ostracoda, Berlin, 2005 Matzke-Karasz R, Martens Kand Schudack M (eds). Springer, Netherlands. 119-133.
Küry D. 1995 Changes in the Ephemeroptera and Plecoptera populations of a Swiss Jura stream (Röserenbach) between 1935 and 1990. In Eighth International Conference on Ephemeroptera, pp. 296-301, Lausanne.
Lahr J. 1997. Ecotoxicology of Organisms Adapted to Life in Temporary Freshwater Ponds in Arid and Semi-Arid Regions. Archives of Environmental Contamination and Toxicology 32: 50-57.
Lahr J, Diallo A, Ndour K, Badji A, Diouf P. 1999. Phenology of invertebrates living in a sahelian temporary pond. Hydrobiologia 405: 189-205.
Langdon PG, Ruiz Z, Brodersen KP, Foster IDL. 2006. Assessing lake eutrophication using chironomids: understanding the nature of community response in different lake types. Freshwater Biology 51: 562-577.
Lansbury I. 1965. Notes on the Hemiptera, Coleoptera, Diptera and other invertebrates of the Burren, Co. Clare and Inishmore, Aran Islands. Proceedings of the Royal Irish Academy 64: 89-111.
Linke S, Bailey RC, Schwindt J. 1999. Temporal variability of stream bioassessments using benthic macroinvertebrates. Freshwater Biology 42: 575-584.
Macan TT. 1977. British freshwater- and brackish-water gastropods - A key. Freshwater Biological Association, Ambleside, U.K.
Marshall J, Steward A, Harch B. 2006. Taxonomic Resolution and Quantification of Freshwater Macroinvertebrate Samples from an Australian Dryland River: The Benefits and Costs of Using Species Abundance Data. Hydrobiologia 572: 171-194.
135

McCauley E, Kalff J. 1981. Empirical relationships between phytoplankton and zooplankton biomass in lakes. Canadian Journal of Fisheries and Aquatic Sciences 38: 458-463.
McElwain L, Sweeney J. 2007. Key Meteorological Indicators of Climate Change in Ireland. Irish Climate Analysis and Research Units (ICARUS) Department of Geography, National University of Ireland, Maynooth.
Mckee D, Atkinson D, Collings S, Eaton J, Harvey I, Heyes T, Hatton K, Wilson D, Moss B. 2002. Macro-zooplankter responses to simulated climate warming in experimental freshwater microcosms. Freshwater Biology 47: 1557-1570.
Miller PL. 1996. Keys to larvae and adults. In Naturalists's Handbook Series: 7. Dragonflies, Miller PL (ed). Richmond Publishing.
Mitsch WJ, Gosselink JG. 2000. Wetland Biogeochemistry. In Wetlands, Mitsch WJ and Gosselink JG (eds). John Wiley and Sons Inc.: New York.
Moore NW. 1980. Lestes dryas Kirby - a declining species of dragonfly (Odonata) in need of conservation; Notes on its status and habitat in England and Ireland. Biological Conservation 17: 143-148.
Moss B. 1998. Ecology of Fresh Waters: Man and Medium, Past to Future. Blackwell Science.
Moss B. 2008. The Water Framework Directive: Total environment or political compromise? Science of The Total Environment. 400: 32-41.
Moss B, Stansfield J, Irvine K. 1991. Development of Daphnid Communities in Diatom- and Cyanophyte-Dominated Lakes and Their Relevance to Lake Restoration by Biomanipulation. The Journal of Applied Ecology 28: 586-602.
Moss B, Stephen D, Alvarez C, Becares E, Bund WVD, Collings SE, Donk EV, Eyto ED, Feldmann T, Fernández-Aláez C, Fernández-Aláez M, Franken RJM, García-Criado F, Gross EM, Gyllström M, Hansson L-A, Irvine K, Järvalt A, Jensen J-P, Jeppesen E, Kairesalo T, Kornijów R, Krause T, Künnap H, Laas A, Lill E, Lorens B, Luup H, Miracle MR, Nõges P, Nõges T, Nykänen M, Ott I, Peczula W, Peeters ETHM, Phillips G, Romo S, Russell V, Salujõe J, Scheffer M, Siewertsen K, Smal H, Tesch C, Timm H, Tuvikene L, Tonno I, Virro T, Vicente E, Wilson D. 2003. The determination of ecological status in shallow lakes - a tested system (ECOFRAME) for implementation of the European Water Framework Directive. Aquatic Conservation: Marine and Freshwater Ecosystems 13: 507-549.
Murphy J, Riley JR. 1962. A modified single solution method for the determination of phosphate in natural waters. Analytica Chimica Acta 27: 31-36.
136

Nelson B, Thompson R. 2004. The Natural History of Ireland’s Dragonflies. The National Museums and Galleries of Northern Ireland, Belfast.
Ní-Bhriain B, Gormally M, Sheehy-Skeffington M. 2003. Changes in land-use practices at two turloughs, on the east burren limestones, Co. Galway, with reference to nature conservation. Biology and Environment: Proceedings of the Royal Irish Academy 103B, No. 3: 169-176.
Ní-Bhriain B, Sheehy-Skeffington M, Gormally M. 2002. Conservation implications of land use practices on the plant and carabid beetle communities of two turloughs in Co. Galway, Ireland. Biological Conservation 105: 81-92.
Nicolet P, Biggs J, Fox G, Hodson MJ, Reynolds C, Whitfield M, Williams P. 2004. The wetland plant and macroinvertebrate assemblages of temporary ponds in England and Wales. Biological Conservation 120: 261-278.
Nilsson A. 1997. Aquatic Insects of Northern Europe - A Taxonomic Handbook. Apollo Books Aps., Denmark.
O'Connor Á, Bradish S, Reed T, Moran J, Regan E, Visser M, Gormally M, Skeffington MS. 2004. A comparison of the efficacy of pond-net and box sampling methods in turloughs - Irish ephemeral aquatic systems. Hydrobiologia 524: 133-144.
Oertli B, Biggs J, Céréghino R, Grillas P, Joly P, Lachavanne J-B. 2005. Conservation and monitoring of pond biodiversity: introduction. Aquatic Conservation: Marine and Freshwater Ecosystems 15: 535-540.
Pickett STA, White PS. 1985. The Ecology of Natural Disturbance and Patch Dynamics. Academic Press, Inc. Orlando.
Pieczyńska E, Kołodziejczyk A, Rybak JI. 1998. The responses of littoral invertebrates to eutrophication-linked changes in plant communities. Hydrobiologia 391: 9-21.
Pinel-Alloul B, Méthot G, Lapierre L, Willsie A. 1996. Macroinvertebrate community as a biological indicator of ecological and toxicological factors in Lake Saint-François (Québec). Environmental Pollution 91: 65-87.
Quinn JM, Hickey CW. 1990. Characterisation and classification of benthic invertebrate communities in 88 New Zealand rivers in relation to environmental factors. New Zealand Journal of Marine and Freshwater Research 24: 387-409.
Rader RB, Richardson CJ. 1994. Response of macroinvertebrates and small fish to nutrient enrichment in the northern Everglades. Wetlands 14: 134-146.
Rasmussen JB. 1988. Littoral Zoobenthic Biomass in Lakes, and Its Relationship to Physical, Chemical, and Trophic Factors. Canadian Journal of Fisheries and Aquatic Sciences 45: 1436-1447.
137

Regan EC. 2005. An Investigation of the Plant, Carabid and Staphylinid Communities of Turloughs in Southeast Galway/NorthClare, Ireland, National University of Ireland, Galway. PhD-thesis.
Resetarits W. 2001. Colonization under threat of predation: avoidance of fish by an aquatic beetle, Tropisternus lateralis (Coleoptera: Hydrophilidae). Oecologia 129: 155-160.
Resh VH, Jackson JK. 1996a. Rapid assessment approaches to biomonitoring using benthic macroinvertebrates. In Freshwater Biomonitoring and Benthic Macroinvertebrates, Rosenberg DM and Resh VH (eds). Chapman & Hall, London. 195-233.
Resh VH, Myers MJ, Hannaford MJ. 1996b. Macroinvertebrates as Biotic Indicators of Environmental Quality. In Methods in Stream Ecology, Hauer FR and Lamberti GA (eds). Academic Press, Inc.
Resh VH, Unzicker JD. 1975. Water quality monitoring and aquatic organisms: the importance of species identification. Journal of the Water pollution Control Federation 47: 9-19.
Reynolds JD. 1982. Ecology of Turloughs (Vanishing Lakes) in the Burren, Western Ireland. In Transactions XIVth International Congress of Game Biologists, O'Gorman F and Rochford J (eds). Vol. 14 Irish Wildlife Publications, Dublin. 183-188.
Reynolds JD. 1985a. Cladocera from the Burren Turloughs at Mullagh More, Co. Clare. Bulletin of the Irish Biogeographical Society 9: 51-54.
Reynolds JD. 1985b. Karstic freshwater habitats of the Aran Islands, Co Galway, with preliminary notes on their fauna. Irish Naturalists' Journal 21: 430-435.
Reynolds JD. 1996. Turloughs, their significance and possibilities for conservation. In The Conservation of Aquatic Systems, Reynolds JD (ed). Royal Irish Academy: Dublin. 38-46.
Reynolds JD. 1997. Invertebrate Surveys of S.E. Galway Turloughs. Baseline Report. The Office of Public Works, Dublin.
Reynolds JD. 2000. Invertebrate communities of turloughs (temporary lakes) in south-east Galway, Ireland. Verh. Internat. Verein. Limnol. 27: 1679-1694.
Reynolds JD. 2003. Fauna of turloughs and other wetlands. In Wetlands of Ireland, Otte ML (ed). University College Dublin Press, Dublin. 143-150.
Reynolds JD, Duigan C, Marnell F, O'Connor Á. 1998. Extreme and ephemeral water bodies in Ireland. In Studies in Irish Limnology - Essays on the occasion of the XXVII Congress of Societas Internationalis Limnologiae (SIL), Giller PS (ed). The Marine Institute: Dublin. 67-99.
138
Reynolds JD, Marnell F. 1999. New records of Eurycercus glacialis (Cladocera: Chydoridae) in turloughs in south-east Galway. Irish Naturalists' Journal 26: 177-180.
Reynolds JD, Murphy M, O'Connor Á. 2004. Early season cladoceran diversity of atlantic temporary ponds (turloughs). Archives des Sciences 57: 97-104.
Reynoldson TB, Young JO. 2000. A key to the freshwater triclads of Britain and Ireland with notes on their ecology. Freshwater Biological Association, Ambleside, U.K.
Richoux P. 1982. Coléoptère aquatiques. Associations Française de Limnologie.
Rosenberg DM, Resh VH. 1993a. Freshwater Biomonitoring and Benthic Macroinvertebrates. Chapman and Hall, London.
Rosenberg DM, Resh VH. 1993b. Introduction to Freshwater Biomonitoring and Benthic Macroinvetebrates. In Freshwater Biomonitoring and Benthic Macronivertebrates, Rosenberg DM and Resh VH (eds). Chapman and Hall: London. 1-9.
Rundle SD, Ormerod SJ. 1991. The influence of chemistry and habitat features on the microcrustacea of some upland Welsh streams. Freshwater Biology 26: 439-451.
Savage AA. 1989. Adults of the British aquatic Hemiptera Heteroptera - A key with ecological notes. Freshwater Biological Association, Ambleside, U.K.
Savage AA. 1999. Key to the larvae of British Corixidae. Freshwater Biological Association, Ambleside, U.K.
Scheffer M, van Geest GJ, Zimmer K, Jeppensen E, Sondergaard M, Butler MG, Hanson MA, Declerck S, De Meester L. 2006. Small habitat size and isolation can promote species richness; second-order effects on biodiversity in shallow lakes and ponds. Oikos 112: 227-231.
Schneider DW. 1999. Snowmelt Ponds in Wisconsin - Influence of Hydroperiod on Invertebrate Community Structure. In Invertebrates in Freshwater Wetlands of North America, Batzer DP, Rader RB and Wissinger SA (eds). John Wiley & Sons, Inc.: New York. 279-318.
Schneider DW, Frost TM. 1996. Habitat Duration and Community Structure in Temporary Ponds. Journal of the North American Benthological Society 15: 64-86.
Scourfield DJ, Harding JP. 1966. A Key to the British Species of Freshwater Cladocera, with notes on their Ecology. Freshwater Biological Association, Ambleside, U.K.
139
Sheehy Skeffington M, Gormally M. 2007. Turloughs: A mosaic of biodiversity and management systems unique to Ireland. Acta Carsologica 36: 217-222.
Sheehy Skeffington M, Moran J, O'Connor Á, Regan EC, Coxon CE, Sott NE, Gormally M. 2006. Turloughs - Ireland’s unique wetland habitat. Biological Conservation 133: 265-290.
Shirt DB. 1987. British Red Data Books 2: Insects. Nature Conservancy Council. HMSO, London.
Sládeček V. 1983. Rotifers as indicators of water quality. Hydrobiologia 100: 169-201.
Solimini AG, Della Bella V, Bazzanti M. 2005. Macroinvertebrate size spectra of Mediterranean ponds with differing hydroperiod length. Aquatic Conservation: Marine and Freshwater Ecosystems 15: 601-611.
Solimini AG, Free G, Donohue I, Irvine K, Pusch MT, Rossaro B, Sandin L, Cardoso AC. 2006. Using benthic Macroinvertebrates to Assess Ecological Status of Lakes: Current Knowledge and Way Forward to Support WFD Implementation. Office for Official Publications of the European Communities, Luxembourg.
Sondergaard M, Jeppesen E, Peder Jensen J, Lildal Amsinck S. 2005. Water Framework Directive: ecological classification of Danish lakes. Journal of Applied Ecology 42: 616-629.
Sousa WP. 1984. The Role of Disturbance in Natural Communities. Annual Review of Ecology and Systematics 15: 353-391.
Southern Water Global. 1998. An investigation of the flooding problems in the Gort-Ardrahan area of South Galway. Final Report, April 1988. Produced by Southern Water Global and Jennings O’Donovan and Partners for the Office of Public Works, Dublin.
Spencer M, Blaustein L, Schwartz SS, Cohen JE. 1999. Species richness and the proportion of predatory animal species in temporary freshwater pools: relationships with habitat size and permanence. Ecology Letters 2: 157-166.
SPSS-Inc. 2006. SPSS 15.0 for Windows. http://www.spss.com/.
Standing Committee of Analysts. 1983. The determination of chlorophyll a in aquatic environments. HMSO, London.
Sterner RW. 1989. The role of grazers in phytoplankton succession. In Plankton Ecology, Succession in Plankton Communities, Sommer U (ed). Springer Verlag, Berlin.
140

Stoffels RJ, Clarke KR, Closs GP. 2005. Spatial scale and benthic community organisation in the littoral zones of large oligotrophic lakes: potential for cross-scale interactions. Freshwater Biology 50: 1131-1145.
Stone L, Roberts A. 1990. The checkerboard score and species distributions. Oecologia 85: 74-79.
Studinski J, Grubbs S. 2007. Environmental factors affecting the distribution of aquatic invertebrates in temporary ponds in Mammoth Cave National Park, Kentucky, USA. Hydrobiologia 575: 211-220.
Sweeney J, Brereton T, Byrne C, Charlton R, Emblow C, Fealy R, Holden N, Jones M, Donnelly A, Moore S, Purser P, Byrne K, Farrell E, Mayes E, Minchin D, Wilson J, Wilson J. 2003. CLIMATE CHANGE - Scenarios & Impacts for Ireland (2000-LS-5.2.1-M1). Department of Geography, National University of Ireland, Maynooth.
Tavernini S, Mura G, Rossetti G. 2005. Factors Influencing the Seasonal Phenology and Composition of Zooplankton Communities in Mountain Temporary Pools. International Review of Hydrobiology 90: 358-375.
ter Braak CJF, Šmilauer P. 2002. CANOCO Reference Manual and CanoDraw for Windows User's Guide: Software for Canonical Community Ordination (version 4.5). Microcomputer Power, Ithaca, NY, USA.
Tolonen KT, Hämäläinen H, Holopainen IJ, Karjalainen J. 2001. Influences of habitat type and environmental variables on littoral macroinvertebrate communities in a large lake system. Archiv für Hydrobiologie 152: 39-67.
Tolonen KT, Hämäläinen H, Holopainen IJ, Mikkonen K, Karjalainen J. 2003. Body size and substrate association of littoral insects in relation to vegetation structure. Hydrobiologia 499: 179-190.
Tolonen KT, Holopainen IJ, Hämäläinen H, Rahkola-Sorsa M, Ylöstalo P, Mikkonen K, Karjalainen J. 2005. Littoral species diversity and biomass: concordance among organismal groups and the effects of environmental variables. Biodiversity and Conservation 14: 961-980.
Trigal C, Garcia-Criado F, Alaez C-F. 2007. Macroinvertebrate communities of mediterranean ponds (North Iberian Plateau): importance of natural and human-induced variability. Freshwater Biology 52: 2042-2055.
Trigal C, García-Criado F, Fernández-Aláez C. 2006. Among-habitat and Temporal Variability of Selected Macroinvertebrate Based Metrics in a Mediterranean Shallow Lake (NW Spain). Hydrobiologia 563: 371-384.
Tynan S, Gill M, Johnston P. 2005. Development of a methodology for the characterisation of a karstic groundwater body with particular emphasis on the linkage with associated ecosystems such as turlough ecosystems (2002-W-DS-08-M1) - Final Report. Environmental Protection Agency, Dublin.
141

Vadeboncoeur Y, Vander Zanden MJ, Lodge DM. 2002. Putting the Lake Back Together: Reintegrating Benthic Pathways into Lake Food Web Models. BioScience 52: 44-54.
van den Berg MS, Coops H, Noordhuis R, van Schie J, Simons J. 1997. Macroinvertebrate communities in relation to submerged vegetation in two Chara-dominated lakes. Hydrobiologia 342-343: 143-150.
Van den Brink FWB, Van Katwijk MM, Van der Velde G. 1994. Impact of hydrology on phyto- and zooplankton community composition in floodplain lakes along the Lower Rhine and Meuse. J. Plankton Res. 16: 351-373.
Visser M, Moran J, Regan E, Gormally M, Skeffington MS. 2007. The Irish agri-environment: How turlough users and non-users view converging EU agendas of Natura 2000 and CAP. Land Use Policy 24: 362-373.
Visser M, Regan E, Moran J, Gormally M, Sheehy Skeffington M. 2006. The rise and fall of turlough typologies: a call for a continuum concept. Wetlands 26: 745-764.
Wallace ID, Wallace B, Philipson GN. 2003. Keys to the case-bearing caddis larvae of Britain and Ireland. Freshwater Biological Association, Ambleside, U.K.
Ward D, Blaustein L. 1994. The Overriding Influence of Flash Floods on Species-Area Curves in Ephemeral Negev Desert Pools: A Consideration of the Value of Island Biogeography Theory. Journal of Biogeography 21: 595-603.
Warren PH. 1989. Spatial and Temporal Variation in the Structure of a Freshwater Food Web. Oikos 55: 299-311.
Waterkeyn A, Grillas P, Vanschoenwinkel B, Brendonck L. 2008. Invertebrate community patterns in Mediterranean temporary wetlands along hydroperiod and salinity gradients. Freshwater Biology 53: 1808-1822.
Weatherhead MA, James MR. 2001. Distribution of macroinvertebrates in relation to physical and biological variables in the littoral zone of nine New Zealand lakes. Hydrobiologia 462: 115-129.
Wellborn GA, Skelly DK, Werner EE. 1996. Mechanisms creating community structure across a freshwater habitat gradient. Annual Review of Ecology and Systematics 27: 337-363.
Wetzel RG. 2001. Limnology. Lake and River Ecosystems. 3rd Edition. Academic Press.
White J. 2000. Littoral Macroinvertebrates in Lakes: Patterns of Distribution and Potential Use in Ecological Assessment, Trinity College Dublin. PhD-thesis.
142

White J, Irvine K. 2003. The use of littoral mesohabitats and their macroinvertebrate assemblages in the ecological assessment of lakes. Aquatic Conservation: Marine and Freshwater Ecosystems 13: 331-351.
White PS, Pickett STA. 1985. Natural Disturbance and Patch Dynamics: An Introduction. In The Ecology of Natural Disturbance and Patch Dynamics, Pickett STA and White PS (eds). Academic Press, Inc.: Orlando. 3-13.
Wiggins GB. 1980. Evolutionary and ecological strategies of animals in annual temporary pools. Archive für Hydrobiologie Supplement 58: 97-206.
Wilbur HM. 1987. Regulation of Structure in Complex Systems: Experimental Temporary Pond Communities. Ecology 68: 1437-1452.
Williams DD. 1987. The Ecology of Temporary Waters. Timber Press, Portland, Oregon.
Williams DD. 1996. Environmental Constraints in Temporary Fresh Waters and their Consequences for the Insect Fauna. Journal of the North American Benthological Society 15: 634-650.
Williams DD. 1997. Temporary ponds and their invertebrate communities. Aquatic Conservation: Marine and Freshwater Ecosystems 7: 105-117.
Williams DD. 2006. The biology of temporary waters. Oxford University Press, Oxford, New York.
Williams P, Whitfield M, Biggs J, Bray S, Fox G, Nicolet P, Sear D. 2003. Comparative biodiversity of rivers, streams, ditches and ponds in an agricultural landscape in Southern England. Biological Conservation 115: 329-341.
Working Group on Groundwater; Sub-committee on Turloughs. 2004. Guidance on the assessment of pressures and impacts on groundwater dependent terrestrial ecosystems - Risk Assessment Sheet GWDTERA2a - Turloughs. WFD Pressures and Impacts Assessment Methodology Guidance document no. GW9.
Yılmaz F, Külköylüoğlu O. 2006. Tolerance, optimum ranges, and ecological requirements of freshwater Ostracoda (Crustacea) in Lake Aladağ (Bolu, Turkey). Ecological Research 21: 165-173.
143