guidance notes on global performance analysis for floating … · 2019-11-14 · , api rp 2t, api...
TRANSCRIPT

Guidance Notes on Global Performance Analysis for Floating Offshore Wind Turbine Installations
GUIDANCE NOTES ON
GLOBAL PERFORMANCE ANALYSIS FOR FLOATING OFFSHORE WIND TURBINE INSTALLATIONS
FEBRUARY 2014
American Bureau of Shipping Incorporated by Act of Legislature of the State of New York 1862
Copyright 2014 American Bureau of Shipping ABS Plaza 16855 Northchase Drive Houston, TX 77060 USA

ii ABS GUIDANCE NOTES ON GLOBAL PERFORMANCE ANALYSIS FOR FLOATING OFFSHORE WIND TURBINE INSTALLATIONS . 2014
F o r e w o r d
Foreword The Guidance Notes contained herein should be used in conjunction with the ABS Guide for Building and Classing Floating Offshore Wind Turbine Installations (FOWTI Guide).
These Guidance Notes provide suggested global performance analysis methodologies, modeling strategies and numerical simulation approaches for floating offshore wind turbines. These Guidance Notes do not set additional design requirements and criteria other than those specified in the FOWTI Guide, and should be used as a supporting document to the FOWTI Guide.
These Guidance Notes become effective on the first day of the month of publication.
Users are advised to check periodically on the ABS website www.eagle.org to verify that this version of these Guidance Notes is the most current.
We welcome your feedback. Comments or suggestions can be sent electronically by email to [email protected].

ABS GUIDANCE NOTES ON GLOBAL PERFORMANCE ANALYSIS FOR FLOATING OFFSHORE WIND TURBINE INSTALLATIONS . 2014 iii
T a b l e o f C o n t e n t s
GUIDANCE NOTES ON
GLOBAL PERFORMANCE ANALYSIS FOR FLOATING OFFSHORE WIND TURBINE INSTALLATIONS
CONTENTS SECTION 1 Introduction ............................................................................................ 1
1 General ............................................................................................... 1 3 Applications ......................................................................................... 1 5 Terms and Definitions ......................................................................... 1
5.1 Terminology ..................................................................................... 1 5.3 Abbreviations ................................................................................... 6
7 References .......................................................................................... 6 SECTION 2 Characteristics of Floating Offshore Wind Turbines .......................... 8
1 General ............................................................................................... 8 3 Floating Support Structures ................................................................ 8
3.1 TLP-Type Floating Support Structures ............................................ 8 3.3 Spar-Type Floating Support Structures ........................................... 9 3.5 Column-Stabilized (Semi-submersible) Floating Support
Structures ...................................................................................... 10 3.7 Other Types of Floating Support Structures .................................. 10
5 Stationkeeping Systems ................................................................... 10 5.1 General.......................................................................................... 10 5.3 Catenary Moorings ........................................................................ 11 5.5 Taut Moorings ............................................................................... 11 5.7 Tendons ........................................................................................ 11
7 RNA and Control and Safety Systems .............................................. 12 9 Coupling Effects ................................................................................ 12
9.1 General.......................................................................................... 12 9.3 Aero-elastic Coupling .................................................................... 12 9.5 Aero-control Coupling .................................................................... 12 9.7 Tower-Hull and Mooring Coupling ................................................. 12 9.9 Hull-Mooring Coupling ................................................................... 13 9.11 Other Coupling .............................................................................. 13
TABLE 1 Representative Natural Periods of Typical FOWT Floating
Support Structures .................................................................... 8

iv ABS GUIDANCE NOTES ON GLOBAL PERFORMANCE ANALYSIS FOR FLOATING OFFSHORE WIND TURBINE INSTALLATIONS . 2014
SECTION 3 Modeling of Floating Offshore Wind Turbines ................................... 14 1 General ............................................................................................. 14 3 Modeling of the Hull .......................................................................... 14
3.1 Hydrostatic Loads .......................................................................... 14 3.3 Wave Loads on the Large-Volume Floating Hull ........................... 15 3.5 Wind Loads, Current Loads and Hull VIM ...................................... 16 3.7 Instability ........................................................................................ 16
5 Modeling of Flexibility of Tower ........................................................ 16 7 Modeling of Stationkeeping System ................................................. 16
7.1 General .......................................................................................... 16 7.3 Mooring Line Nonlinearity .............................................................. 17 7.5 Finite Element Analysis Approach ................................................. 17
9 Modeling of Dynamics of Drive Trains .............................................. 18 11 Modeling of Rotor Blade and Control and Safety Systems .............. 18
11.1 General .......................................................................................... 18 11.3 Gravitational and Inertia Loads ...................................................... 18 11.5 Aerodynamic Loads ....................................................................... 19 11.7 Actuation Loads (Operational Loads) ............................................ 19
13 Modeling of Wind Farm Wake Effects .............................................. 20 15 Electrical Cable Considerations ........................................................ 20
SECTION 4 Determination of Environmental Loads .............................................. 21
1 General ............................................................................................. 21 3 Aerodynamic Loads on RNA ............................................................. 21 5 Typical Environmental Loads on Mooring Lines ............................... 21
5.1 Current Induced Loads .................................................................. 21 5.3 Ice-induced Loads ......................................................................... 22 5.5 Vortex-induced Vibrations of the Mooring Lines ............................ 22 5.7 Direct Wave Loads on Mooring Lines ............................................ 22 5.9 Marine Growth ............................................................................... 22
7 Typical Environmental Loads on Floating Support Structures .......... 22 7.1 Wind Loads .................................................................................... 22 7.3 Wave Loads ................................................................................... 23 7.5 Current Loads ................................................................................ 23 7.7 Marine Growth ............................................................................... 23 7.9 Vortex-Induced Motions (VIM) of the Floating Support
Structure ........................................................................................ 24 7.11 Directional Distribution ................................................................... 24
9 Ice and Snow Accumulation Induced Loads ..................................... 24 11 Earthquake Loads ............................................................................. 24 13 Ice Loads ........................................................................................... 25
SECTION 5 Definition of Analysis Methodologies ................................................. 26
1 Frequency-Domain and Time-Domain Analysis ............................... 26 1.1 Frequency-Domain Analysis .......................................................... 26 1.3 Time-Domain Analysis ................................................................... 26 1.5 Combined Time-Domain and Frequency-Domain Analysis ........... 27

ABS GUIDANCE NOTES ON GLOBAL PERFORMANCE ANALYSIS FOR FLOATING OFFSHORE WIND TURBINE INSTALLATIONS . 2014 v
3 Quasi-Static and Dynamic Analysis .................................................. 27 3.1 Quasi-Static Analysis .................................................................... 27 3.3 Dynamic Analysis .......................................................................... 27
5 Coupled, Semi-Coupled, and Uncoupled Analysis ........................... 28 5.1 Coupled Analysis ........................................................................... 28 5.3 Semi-Coupled Analysis ................................................................. 28 5.5 Uncoupled Analysis ....................................................................... 28
SECTION 6 Global Motion Analysis ........................................................................ 29
1 General ............................................................................................. 29 3 Static and Mean Responses ............................................................. 29 5 Low Frequency Motions .................................................................... 30 7 Wave Frequency Motions ................................................................. 30 9 High Frequency Motions ................................................................... 30 11 Tower and Turbine RNA Load Induced Vibrations ........................... 30 13 Damping ............................................................................................ 30
13.1 Damping of Low Frequency Motions ............................................. 30 13.3 Damping of High Frequency Motions ............................................ 31
15 Analysis Methods .............................................................................. 31 15.1 Frequency-Domain Approach ........................................................ 31 15.3 Time-Domain Approach................................................................. 32 15.5 Combined Time-Domain and Frequency-Domain Approach. ........ 32
SECTION 7 Air Gap Analysis .................................................................................. 33
1 General ............................................................................................. 33 3 Air Gap Analysis Methods................................................................. 33
3.1 Frequency-Domain Analysis .......................................................... 33 3.3 Time-Domain Analysis .................................................................. 33 3.5 Combined Time-Domain and Frequency-Domain Analysis ........... 34 3.7 Other Considerations .................................................................... 34
SECTION 8 Mooring Strength Analysis .................................................................. 35
1 General ............................................................................................. 35 3 Mooring Strength Analysis Methods ................................................. 35
3.1 Frequency-Domain Analyses for Spread Mooring Systems .......... 36 3.3 Frequency-Domain Analyses for Single Point Mooring
Systems ......................................................................................... 36 3.5 Time-Domain Analyses ................................................................. 36 3.7 Combined Time-Domain and Frequency-Domain Analyses .......... 36 3.9 Maximum and Minimum Tendon Tensions .................................... 37
5 Suggested Time-Domain Analysis Procedure .................................. 37 7 Design Checks .................................................................................. 37 9 Line Length and Geometry Constraints ............................................ 37 11 Anchor Forces ................................................................................... 38

vi ABS GUIDANCE NOTES ON GLOBAL PERFORMANCE ANALYSIS FOR FLOATING OFFSHORE WIND TURBINE INSTALLATIONS . 2014
SECTION 9 Mooring Fatigue Analysis .................................................................... 39 1 General ............................................................................................. 39 3 T-N Curve .......................................................................................... 40 5 Accumulated Fatigue Damage.......................................................... 40 7 Time-Domain Fatigue Analysis Method ............................................ 41 9 Frequency-Domain Fatigue Analysis Method ................................... 41 11 Tendon Fatigue Analysis .................................................................. 41 13 Fatigue Design Checks ..................................................................... 42
SECTION 10 Suggestions for Numerical Simulations ............................................. 43
1 General ............................................................................................. 43 3 Time Step .......................................................................................... 43 5 Initial Transient Response ................................................................ 43 7 Wind Generation and Grid Size ........................................................ 44 9 Simulation of Wave Conditions ......................................................... 44 11 Flexibility of RNA and Tower ............................................................. 45 13 Simulation Length and Number of Random Seeds .......................... 45 15 Analysis Methods and Tools ............................................................. 47 TABLE 1 Adjustment of Wind Conditions with Different Averaging
Time Durations ........................................................................ 44 TABLE 2 Adjustment of the Significant Wave Height ............................. 45 TABLE 3 Suggested Minimum DOFs for Modeling Flexibility of the
RNA and the Tower................................................................. 45 TABLE 4 Suggested Simulation Time Duration and Number of
Random Seeds for the DLCs .................................................. 47 TABLE 5 Suggested Analysis Methods for the DLCs ............................ 48

ABS GUIDANCE NOTES ON GLOBAL PERFORMANCE ANALYSIS FOR FLOATING OFFSHORE WIND TURBINE INSTALLATIONS . 2014 1
S e c t i o n 1 : I n t r o d u c t i o n
S E C T I O N 1 Introduction
1 General Global performance analyses determine the global effects of environmental conditions and other loads on the Floating Offshore Wind Turbine (FOWT) and its components including the tower, hull structure, mooring lines or tendons, anchors, export electrical cable, etc. Global performance analyses should be carried out for all critical conditions in the pre-service and in-service phases, represented by the design load conditions specified in Chapter 5, Section 2 of the ABS Guide for Building and Classing Floating Offshore Wind Turbine Installations (FOWTI Guide).
Because significant interactions could occur among the Rotor-Nacelle Assembly (RNA) and control system, the floating support structure and the stationkeeping system, an integrated (‘coupled’) model including all these components is recommended to be used for global performance analyses. An alternative method, where the dynamic analyses of the stationkeeping system are performed separately by using the responses of the floating support structure as boundary conditions, may also be acceptable, provided that the coupling effect of the stationkeeping system and the floating support structure is adequately taken into account.
The global performance analysis software should have the capability of considering complex interactions among aerodynamic loads, hydrodynamic loads, actions of turbine safety and control systems and structural dynamic responses of the FOWT. The analysis procedures should reflect the application limits of the selected software. Both publically available, industry-recognized software and in-house software may be used for the analyses. However, in-house software has to be adequately calibrated against model tests, field tests or the industry-recognized software.
General guidance on global performance analyses of the floating support structure and the stationkeeping systems can be found in:
• ABS Rules for Building and Classing Floating Production Installations (FPI Rules), API RP 2T, API RP 2FPS and ISO 19904-1 for the design of floating offshore structures
• API RP 2SK, API RP 2SM and ISO 19901-7 for catenary mooring and taut leg mooring systems. API RP 2T for TLP tendon systems. References are also made to other appropriate ABS Rules, Guides and Guidance Notes such as those listed in Subsection 1/7.
3 Applications These Guidance Notes provide global performance analysis methodologies, modeling strategies and suggestions for numerical simulations for FOWTs. These Guidance Notes do not set additional design requirements and criteria other than those specified in the FOWTI Guide, and should be used as a supporting document to the FOWTI Guide. The global performance analysis guidelines provided in these Guidance Notes are only applicable to FOWTs.
5 Terms and Definitions
5.1 Terminology 5.1.1 Added Mass
Effective addition to system mass, which is proportional to the mass of displaced water.
5.1.2 Air Gap Clearance between the highest water surface that occurs during design environmental conditions and the lowest exposed structures not designed to withstand wave impingement.

Section 1 Introduction
2 ABS GUIDANCE NOTES ON GLOBAL PERFORMANCE ANALYSIS FOR FLOATING OFFSHORE WIND TURBINE INSTALLATIONS . 2014
5.1.3 Catenary Mooring Mooring system where the restoring action is provided by the distributed weight of mooring lines.
5.1.4 Cut-In Wind Speed (Vin) The lowest 10-minute mean wind speed at Hub Height at which the wind turbine starts to produce power in the case of steady wind without turbulence.
5.1.5 Cut-Out Wind Speed (Vout) The highest 10-minute mean wind speed at Hub Height at which the wind turbine is designed to produce power in the case of steady wind without turbulence.
5.1.6 Design Life Assumed period for which a structure, a structural component, a system or equipment is expected to be used for its intended purpose with anticipated maintenance, but without substantial repair being necessary.
5.1.7 Dip and Thrash Zone A chain or wire rope section above and close to the seafloor that may touch the seabed due to the motions of the Floating Support Structure.
5.1.8 Dynamic Positioning (DP) Stationkeeping technique primarily using a system of automatically controlled on-board thrusters to generate appropriate thrust vectors to counter the environmental actions and maintain an intended position within prescribed tolerances.
5.1.9 Emergency Shutdown Rapid shutdown of the wind turbine triggered by a protection function or by manual intervention.
5.1.10 Floating Offshore Wind Turbine (FOWT) Wind Turbine consisting of the Rotor-Nacelle Assembly (RNA), the Floating Support Structure and the Stationkeeping System.
5.1.11 Floating Offshore Wind Turbine Installation (FOWTI) A Floating Offshore Wind Turbine Installation encompasses three principal areas: the Floating Support Structure (see 1/5.1.12) for carrying the wind turbine RNA (see 1/5.1.33), the Stationkeeping System (see 1/5.1.43) and the onboard machinery, equipment and systems that are not part of the RNA.
In these Guidance Notes, the Floating Offshore Wind Turbine Installation does not include the RNA.
5.1.12 Floating Support Structure A Floating Support Structure of an offshore wind turbine is a site dependent offshore structure supported by buoyancy and maintained on location by the Stationkeeping System. The Floating Support Structure consists of the Tower (see 1/5.1.48) and the Hull (see 1/5.1.15) structure.
5.1.13 Foundation System (for Tendons) Structural, mechanical and geotechnical components which are located on and beneath the sea floor and transfer the loads acting on the TLP Tendons into the sea bed.
5.1.14 Gust Brief rise and fall in wind speed lasting less than 1 minute.
5.1.15 Hull Combination of connected buoyant structural components such as columns, pontoons and intermediate structural braces; see also Monohull (see 1/5.1.23).

Section 1 Introduction
ABS GUIDANCE NOTES ON GLOBAL PERFORMANCE ANALYSIS FOR FLOATING OFFSHORE WIND TURBINE INSTALLATIONS . 2014 3
5.1.16 Hub Height Height of the center of the swept area of the wind turbine rotor above the Still Water Level.
5.1.17 Idling Condition of a wind turbine that is rotating slowly and not producing power.
5.1.18 Load External load applied to the structure (direct load) or an imposed deformation or acceleration (indirect load).
5.1.19 Load Effect Effect of a single load or combination of loads on a structural component or system, e.g. internal force, stress, strain, motion etc.
5.1.20 Mean Sea Level or Mean Still Water Level (MSL) Average level of the sea over a period long enough to remove variations due to waves, tides and storm surges (see also 4-5/Figure 1 of the FOWTI Guide).
5.1.21 Mean Wind Speed Statistical mean value of the instantaneous wind speed over a specified time interval.
5.1.22 Minimum Breaking Strength (MBS) Certified strength of a chain, wire rope, fiber rope or accessories.
5.1.23 Monohull Floating structure consisting of a single, continuous, buoyant hull, and geometrically similar to an ocean-going ship or barge.
5.1.24 Mooring Components General class of components used in the Stationkeeping System.
5.1.25 Normal Shutdown Wind turbine shutdown operation in which all stages are under the control of the control system.
5.1.26 Offshore Wind Farm A group of wind turbines installed at an offshore site. An Offshore Wind Farm may also include other installations such as transformer/converter platforms, meteorological measurement facilities, electrical cables, accommodation units, etc.
5.1.27 Omni-directional (Wind, Waves or Currents) Acting in all directions.
5.1.28 Parked Condition of a wind turbine that is either in the Standstill or Idling condition, depending on the design of the wind turbine.
5.1.29 Pretension Tension applied to a mooring line or tendon when the Floating Support Structure at its static equilibrium position in mean still water and still air.
5.1.30 Rated Power Quantity of power assigned, generally by a manufacturer, for a specified operating condition of a component, device, or equipment. For wind turbines, it is the maximum continuous electrical power output which a wind turbine is designed to achieve under normal operating and external conditions.

Section 1 Introduction
4 ABS GUIDANCE NOTES ON GLOBAL PERFORMANCE ANALYSIS FOR FLOATING OFFSHORE WIND TURBINE INSTALLATIONS . 2014
5.1.31 Rated Wind Speed (Vr) Minimum 10-minute mean wind speed at Hub Height at which a wind turbine's Rated Power is achieved in the case of steady wind without turbulence.
5.1.32 Return Period (Recurrence Period) A return period is the average time duration between occurrences of an event or of a particular value being exceeded. A return period in years is equal to the reciprocal of the annual probability of exceedance of an event or of a particular value of a random parameter such as wind speed, wave height or sea elevation.
5.1.33 Rotor-Nacelle Assembly (RNA) The Rotor-Nacelle Assembly (RNA) of a horizontal axis wind turbine, carried by the Floating Support Structure, consists of:
i) The Rotor components, including blades, hub, shaft, and spinner; and
ii) The Nacelle, a housing which contains the mainframe, generator frame, drive train components, electrical generator components, wind turbine control and protection components and other elements on top of the Tower.
5.1.34 Ringing High frequency vertical vibration of the TLP spring-mass system excited by impulsive loading.
5.1.35 Semi-submersible Floating structure normally consisting of a deck structure connected to submerged pontoons through a number of widely spaced, large cross-section supporting columns.
5.1.36 Set-down Increase in the draft of a floating structure (for example, TLP) with the increase in the offset due to mooring or tendon system restraint.
5.1.37 Single Point Mooring Mooring system that allows the floating structure to which it is connected to vary its heading (weathervane).
5.1.38 Spar Deep-draft, small water-plane area floating structure.
5.1.39 Splash Zone Part of the mooring lines or tendons of the Stationkeeping System above and below the Mean Sea Level and regularly subjected to wetting due to wave actions, motions of the Floating Support Structure and, if applicable, tide and draft variations. Areas which are only wetted during major storms are not included.
5.1.40 Spread Mooring Mooring system consisting of multiple mooring lines terminated at different locations on a floating structure and extending outwards, providing an almost constant heading to the Floating Support Structure.
5.1.41 Springing High frequency vertical vibration of the TLP spring-mass system excited by cyclic loading at or near the TLP pitch or heave resonant periods.
5.1.42 Standstill Condition of a wind turbine that is not rotating.

Section 1 Introduction
ABS GUIDANCE NOTES ON GLOBAL PERFORMANCE ANALYSIS FOR FLOATING OFFSHORE WIND TURBINE INSTALLATIONS . 2014 5
5.1.43 Stationkeeping System System capable of: limiting the excursions of the Floating Support Structure within prescribed limits, maintaining the intended orientation, and helping to limit motions at Tower top.
5.1.44 Still Water Levels (SWL) Abstract water levels used for the calculation of wave kinematics and wave crest elevation. See 4-5/Figure 1 of the ABS FOWTI Guide. Still Water Levels, which can be either above or below the Mean Sea Level, are calculated by adding to and subtracting from the effect of tide and surge on the Mean Sea Level.
5.1.45 Tendon A system of components, which form a link between the Hull structure and the Foundation System for the purpose of restraining motion of the TLP-type Floating Support Structure within specified limits in response to environmental and other loading.
5.1.46 Tendon Connector Device used to connect a tendon to the TLP Hull (top connector) or to the foundation template (bottom connector).
5.1.47 Tension Leg A collective group of tendons associated with one column of the platform.
5.1.48 Tower The structural component or assembly that connects the Hull structure to the Rotor-Nacelle Assembly.
5.1.49 Turbulence Intensity Ratio of the wind speed standard deviation to the mean wind speed, determined from the same set of measured data samples of wind speed, and taken over a specified period of time.
5.1.50 Taut-line Mooring Mooring system where the restoring action is provided by elastic deformation of mooring lines.
5.1.51 Thruster-assisted Mooring Stationkeeping system consisting of mooring lines and thrusters.
5.1.52 Tropical Cyclone (Hurricane, Typhoon) A tropical storm with sustained wind speeds in excess of 33 m/s (64 knots or 74 mph). Such a storm is called a hurricane, typhoon, or cyclone based on the storm location. For example, tropical cyclones are typically referred to as hurricanes in the Gulf of Mexico and North Atlantic, while in the South China Sea and Northwest Pacific they are called typhoons. In the South Pacific and South Indian Ocean, however, they are commonly referred to as cyclones.
5.1.53 Uni-directional (Wind, Waves or Currents) Acting in a single directions.
5.1.54 Vortex Induced Motion (VIM) The motion of the Hull structure induced by vortex when the hull is exposed to a current.
5.1.55 Vortex Induced Vibration (VIV) A phenomenon of the vibration of cylindrical structures exposed to a current. Cylindrical structures exposed to a current may create alternating eddies, or vortices, at a regular period. The eddies create alternating lift and drag forces on the cylinder. When a natural period of a structure falls close to the period of vortex shedding, oscillations of the structure can occur.
5.1.56 Water Depth Vertical distance between the sea floor and the Still Water Level.

Section 1 Introduction
6 ABS GUIDANCE NOTES ON GLOBAL PERFORMANCE ANALYSIS FOR FLOATING OFFSHORE WIND TURBINE INSTALLATIONS . 2014
5.1.57 Wind Profile (Wind Shear Law) Mathematical expression for assumed wind speed variation with height above the Still Water Level.
5.1.58 Weathervaning Process by which a floating support structure passively varies its heading in response to time-varying environmental actions.
5.1.59 Yawing Rotation of the rotor axis about a vertical axis for horizontal axis wind turbines.
5.1.60 Yaw Misalignment Horizontal deviation of the wind turbine rotor axis from the wind direction.
5.3 Abbreviations ABS American Bureau of Shipping
API American Petroleum Institute
BEM Blade Element Momentum method
DOF Degree Of Freedom
FE(M) Finite Element (Method)
FOWT Floating Offshore Wind Turbine
FOWTI Floating Offshore Wind Turbine Installation
IEC International Electrotechnical Commission
ISO International Organization for Standardization
QTF Quadratic Transfer Function
RAO Response Amplitude Operator
RNA Rotor-Nacelle Assembly
TLP Tension Leg Platform
VIM Vortex Induced Motion
VIV Vortex Induced Vibration
7 References i) ABS Guide for Building and Classing Floating Offshore Wind Turbine Installations (FOWTI Guide)
ii) ABS Rules for Building and Classing Floating Production Installations (FPI Rules)
iii) ABS Rules for Building and Classing Mobile Offshore Drilling Units (MODU Rules)
iv) ABS Rules for Building and Classing Single Point Moorings (SPM Rules)
v) ABS Guidance Notes on the Application of Fiber Rope for Offshore Mooring
vi) API RP 2FPS, Recommended Practice for Planning, Designing, and Constructing Floating Production Systems
vii) API RP 2N, Recommended Practice for Planning, Designing, and Constructing Structures and Pipelines for Arctic Conditions
viii) API RP 2SK, Recommended Practice for Design and Analysis of Stationkeeping Systems for Floating Structures
ix) API RP 2SM, Recommended Practice for Design, Manufacture, Installation, and Maintenance of Synthetic Fiber Ropes for Offshore Mooring

Section 1 Introduction
ABS GUIDANCE NOTES ON GLOBAL PERFORMANCE ANALYSIS FOR FLOATING OFFSHORE WIND TURBINE INSTALLATIONS . 2014 7
x) API RP 2T, Recommended Practice for Planning, Designing, and Constructing Tension Leg Platforms
xi) IEC 61400-1, Wind Turbines – Part 1: Design Requirements
xii) IEC 61400-3, Wind Turbines – Part 3: Design Requirements for Offshore Wind Turbines
xiii) ISO 19901-7, Petroleum and natural gas industries – Specific Requirements for Offshore Structures, Part 7: Stationkeeping Systems for Floating Offshore Structures and Mobile Offshore Units
xiv) ISO 19904-1, Petroleum and natural gas industries – Floating Offshore Structures, Part 1: Monohulls, Semi-submersibles and Spars
xv) ISO 19906, Petroleum and natural gas industries – Arctic Offshore Structures

8 ABS GUIDANCE NOTES ON GLOBAL PERFORMANCE ANALYSIS FOR FLOATING OFFSHORE WIND TURBINE INSTALLATIONS . 2014
S e c t i o n 2 : C h a r a c t e r i s t i c s o f F l o a t i n g O f f s h o r e W i n d T u r b i n e s
S E C T I O N 2 Characteristics of Floating Offshore Wind Turbines
1 General An FOWT consists of a number of main subsystems including the floating support structure (hull structure and tower), the turbine RNA and safety and control system, as well as the stationkeeping system including mooring (or tendon) system and anchoring systems. This section describes the key issues and characteristics of the main FOWT subsystems relevant to global performance analyses. Representative coupling effects between the components of the FOWT are also identified.
3 Floating Support Structures The floating support structure consists of the hull structure and the tower. A common feature of the differing types of hull structures is that they utilize excess buoyancy to support the tower and the RNA and to provide mooring (or tendon) system tension. For this reason, the design of the floating support structure tends to be weight sensitive.
Depending on specific site conditions, ocean waves typically contain first-order energy in the range 3 to 30s. For the floating support structure, the natural periods of different modes of motion are of primary interest and, to a large extent, reflect the design philosophy. Typical motion natural periods of different types of floating support structure are summarized in Section 2, Table 1.
TABLE 1 Representative Natural Periods of Typical FOWT Floating Support Structures
Motions Natural Periods (seconds)
Spar-Type Semi-submersible-Type TLP-Type Surge >40 >40 >40
Sway >40 >40 >40
Heave 20-50 17-40 <5
Roll 25-60 25-50 <5
Pitch 25-60 25-50 <5
Yaw >3 >3 >3
3.1 TLP-Type Floating Support Structures A TLP-type floating support structure is a vertically moored, buoyant structural system wherein the excess buoyancy of the hull maintains tension in the stationkeeping system.
A TLP-type floating support structure consists of the structural components of the hull connecting to the tendon system. It may also include a column top frame and topside deck. The hull consists of buoyant pontoons and columns. The tops of the columns may be connected to the tower directly or to a column top frame or a topside deck forming the global strength of the hull. The tendon system consists of a vertical mooring system that forms the link between the hull and the foundation for the purpose of mooring the floating support structure. The foundation system is used to anchor the tendons to the seafloor.
The TLP-type floating support structure differs fundamentally from the other floating structure concepts, mostly because of the following reasons:

Section 2 Characteristics of Floating Offshore Wind Turbines
ABS GUIDANCE NOTES ON GLOBAL PERFORMANCE ANALYSIS FOR FLOATING OFFSHORE WIND TURBINE INSTALLATIONS . 2014 9
• Tendon stiffness, rather than the ‘water-plane’ stiffness, governs the vertical motions.
• It is normally weight sensitive.
• It has low restraint to horizontal motions (surge, sway and yaw), but is highly restrained in the vertical direction (heave, roll and pitch).
• Higher order wave forces at different sum-frequencies may introduce resonant (springing) or transient (ringing) responses in the vertical direction. These effects may significantly increase tendon loads.
• Restrained by the tendon system, the TLP-type floating support structure moves along a spherical surface. This gives rise to the set-down effect, which is a kinematic coupling between the horizontal surge/sway motions and the vertical heave motion. The magnitude of the set-down affects the wave air-gap, tendon forces and electrical cable responses.
The TLP-type floating support structure generally experiences horizontal wave frequency motions of the same order of magnitude as those of a semi-submersible of comparable size. On the other hand, the TLP-type floating support structure behaves like a fixed structure with practically no wave frequency vertical motion responses, because the wave frequency forces are counteracted by the stiffness of the tendon system.
The flexibility of the tower could have significant influences on the natural periods of roll and pitch motions of the TLP-type floating support structure. The high frequency loads due to the rotor rotations and aeroelastic responses of the RNA and the tower could introduce resonant and/or transient responses in the vertical motions, which could significantly increase the tendon loads.
3.3 Spar-Type Floating Support Structures A Spar-type floating support structure is a deep draft, vertical floating structure, usually of cylindrical shape, supporting the tower and a topside structure (if any) and moored to the seafloor.
A Spar-type floating support structure typically consists of an upper hull, mid-section and lower hull. The upper hull serves to provide buoyancy to support the topside and provides spaces for variable ballast. The mid-section connects the upper hull with the lower hull. The mid-section can be a cylindrical column or a truss space frame with heave plates. The heave plates are a series of horizontal decks between each bay of the truss space frame and are designed to limit heave motions by providing added mass and hydrodynamic damping. The lower hull normally consists of a fixed ballast tank and, in the case of a truss Spar, a flotation tank. The fixed ballast tank provides temporary buoyancy during a horizontal wet tow and provides the needed ballast in upending by flooding the tank. After upending, the ballast water may be replaced by fixed ballast (a substance with a density higher than water) to lower the Spar’s center of gravity. The ballast in the fixed ballast tank results in a vertical center of gravity well below the center of buoyancy, which provides the Spar with sound stability, as well as desired motion characteristics. The flotation tank is located adjacent to the fixed ballast tank to provide additional buoyancy for wet tow and ballast in upending.
With a deep draft, the Spar-type floating support structure has a large area exposed to current forces, which is usually the dominant mean force on a Spar. Low frequency vortex induced oscillations may increase the effective drag leading to even higher mean current forces. By installing strakes on the Spar hull, the vortex induced cross-flow oscillation can be mitigated. However, the strakes increase the added mass and the drag forces on the Spar.
The Spar-type floating support structure is usually compliant to surge, sway, heave, roll, pitch, and yaw motions. The natural periods of motions in all six degrees of freedom are usually outside the range of wave periods. In addition, the Spar-type floating support structure has a low level of vertical wave excitation due to its large draft, which exploits the fact that the first order wave motions and dynamic pressures decay exponentially with depth. These result in very small heave motions.
Due to relatively small wave frequency motions, the Spar-type floating support structure is generally not subjected to large dynamic mooring line forces, although their actual effect has to be evaluated by considering the actual location of the fairlead and the increase in horizontal wave frequency motion towards the waterline.
The mooring system for the Spar-type floating support structure can be in the form of catenary moorings, semi-taut-line moorings or taut-line moorings. The motions and mooring loads of the catenary moored Spar-type floating support structure are normally insensitive to the high frequency loads generated by the rotor rotations and aeroelastic responses of the RNA and the tower.

Section 2 Characteristics of Floating Offshore Wind Turbines
10 ABS GUIDANCE NOTES ON GLOBAL PERFORMANCE ANALYSIS FOR FLOATING OFFSHORE WIND TURBINE INSTALLATIONS . 2014
Since the Spar-type floating support structure has a slender hull in the vertical direction and the mooring system tends to have relatively low yaw stiffness, the Spar-type FOWT may experience yaw instability which should be avoided.
3.5 Column-Stabilized (Semi-submersible) Floating Support Structures A column-stabilized floating support structure, also known as the Semi-submersible floating support structure, consists of a topside structure connected to the underwater hull or footings by columns or caissons. The floating support structure depends upon the buoyancy of columns or caissons for flotation and stability. Lower hulls or footings are normally provided at the bottom of the columns for additional buoyancy. The topside structure can be of an enclosed hull type or an open space frame truss construction. The topside structure is interconnected with the stability columns of the hull to form the overall strength. The tower may be connected directly to a column or caisson or to the topside structure.
Current forces could be significant on column-stabilized floating support structure due to the bluff shapes of their underwater columns and pontoons.
The column-stabilized floating support structure is characterized by having free modes of motion, which means that all natural periods of motion are outside the range of energetic wave periods. However, the wave frequency motions of the column-stabilized floating support structure may be significant, especially in extreme environmental conditions.
For the column-stabilized floating support structure, wave impact underneath the deck due to insufficient air-gap may influence the global motions and local structural responses.
The spread mooring system in the form of the catenary, semi-taut lines or taut lines is normally adopted as the stationkeeping system for the column-stabilized floating support structure. The column-stabilized floating support structure with the catenary mooring system may experience significant dynamic mooring loads due to the wave frequency responses. The motions and mooring loads of the catenary moored column-stabilized floating support structure are normally insensitive to the high frequency loads generated by the rotor rotations and aeroelastic responses of the RNA and the tower.
3.7 Other Types of Floating Support Structures For the floating support structure having a hull configuration or a hull-mooring combination that does not belong to the those described above, general guidance may be found in ABS FPI Rules, API RP 2T, API RP 2FPS, ISO 19904-1, API RP 2SK and ISO 19901-7, as well as other appropriate ABS Rules, Guides and Guidance Notes for the design of floating offshore structures (see 1/7).
5 Stationkeeping Systems
5.1 General An FOWT stationkeeping system is primarily designed to keep the FOWT within its position tolerances. It is also required to assist in achieving motion limits imposed by operational requirements of the RNA. Because the turbine RNA could exert large yaw moments to the floating support structure that normally has small yaw stiffness, the stationkeeping system may also need to be designed to provide sufficient yaw stiffness to mitigate the FOWT yaw motions.
A stationkeeping system includes a mooring (tendon) system and an anchoring system. The mooring system provides resistance to environmental loading by mobilizing reaction forces as the result of the gross change in mooring geometry. It essentially works as a collection of spring mechanisms where displacements of the floating support structure from its neutral equilibrium position introduce restoring forces to react to the applied loading. Each mooring line acts as a tension spring and provides its intended functions through one of the following two mechanisms:
• Hanging catenary effect due to gravity acting vertically on the mooring line
• Line elastic effect due to elastic stretch over the length of the mooring line
When FOWTs are expected to be deployed in relatively shallow water, in order for the mooring systems to have the required stiffness, fiber ropes, clump weights and buoys may be used in addition to chains and wire ropes.

Section 2 Characteristics of Floating Offshore Wind Turbines
ABS GUIDANCE NOTES ON GLOBAL PERFORMANCE ANALYSIS FOR FLOATING OFFSHORE WIND TURBINE INSTALLATIONS . 2014 11
5.3 Catenary Moorings The geometry of catenary moorings is related to the following parameters:
• Submerged weight of the suspended lines
• Horizontal mooring load
• Line tension
• Line slope at fairlead
The compliance of the catenary mooring line allowing for wave-induced floating support structure motions is provided by a combination of geometrical change and axial elasticity of the lines. Large line geometrical changes could lead to significant dynamic responses in the catenary mooring system due to the large transverse drag loads.
The mooring lines in a catenary mooring system are commonly composed of steel rope and chain segments. If necessary, clump weights and buoys may be used to achieve desired line configurations.
5.5 Taut Moorings In a taut mooring system, the mooring lines are nearly straight between the anchor and the fairlead and an uplift force is exerted on the anchor. The compliance of the mooring line allowing for wave-induced floating support structure motions is provided mainly by line elasticity.
Transverse geometric changes in a taut mooring system are typically much smaller than those in a catenary mooring system. Therefore, dynamic effects due to line drag loads are moderate.
Synthetic ropes have been used as mooring lines in taut mooring systems to provide required stiffness and low weight. Compared to steel ropes, synthetic ropes exhibit more complex stiffness characteristics (e.g., hysteresis), which may significantly alter dynamic effects (see the ABS Guidance Notes on the Application of Fiber Rope for Offshore Mooring).
5.7 Tendons The TLP tendons are the vertical mooring lines similar to those in taut mooring systems. The main difference is that tendons are traditionally made of tubes that are hardly compliant in the axial direction. The TLP tendon system acts as an inverted pendulum, where the stationkeeping capacity is governed by tendon length and pretension.
By restraining the FOWT at a draft deeper than what is required to balance its weight, the tendons are typically under a continuous tensile load that provides a horizontal restoring force when the hull is displaced laterally from its equilibrium position. With very high stiffness in the axial direction, the tendon system limits heave, pitch, and roll responses of the hull to small amplitudes while its relatively compliant transverse restraints can be designed to achieve surge, sway, and yaw responses within operationally acceptable limits.
The tendons may take one of several forms, for example:
• Tubular Members with Threaded or other Mechanical Connectors. These members may be designed to be completely void, partially void, or fully flooded. The tubular member and the connectors may be fabricated as one piece, or assembled from separate tubular segments that are joined with threaded connectors. The tendon components may be made of metal or fiber reinforced composites, with either integral or metallic connectors.
• Tubular or Solid Rod Members with Welded Connections. The tubular members are fabricated from seamless or rolled and welded steel and are designed to be welded together, prior to or during offshore installation, to form a continuous tendon element.
• Tendon Strands. These tendons are fabricated from small diameter high tensile strength wire or fiber strands and are formed into bundles. These tendons are designed to be installed offshore using a continuous one-piece spooling operation to minimize the need for intermediate connectors.

Section 2 Characteristics of Floating Offshore Wind Turbines
12 ABS GUIDANCE NOTES ON GLOBAL PERFORMANCE ANALYSIS FOR FLOATING OFFSHORE WIND TURBINE INSTALLATIONS . 2014
7 RNA and Control and Safety Systems The RNA consists of the rotor and nacelle assembly, which includes all the associated mechanical, electrical and control equipment and systems. A rotor may consist of two, three or more blades typically made of fiber reinforced composites. A minimum clearance between the rotor blades and other parts of the FOWT and the expected highest wave elevation should be maintained. A deformation analysis should be performed by dynamic and aeroelastic means. The motions of the FOWT should be accounted for.
The RNA control and safety system can optimize operations and keep the FOWT in a safe condition in the event of malfunction. The control system keeps the FOWT within the normal operating limits. The safety function of the system logically subordinates to the control function and is brought into action after safety-relevant limiting values have been exceeded or if the control function is incapable of keeping the FOWT within the normal operating limits. For detailed descriptions of control and safety systems, refer to IEC 61400-1 and IEC 61400-3.
Due to its influence on mechanical loads, the performance of the control and safety system is critical not only for the safety of service personnel and normal operations but the integrity of structures and stationkeeping of the FOWT. The load-relevant functions of the control and safety system, which lead to various RNA operational conditions, should be considered in the load analysis.
9 Coupling Effects
9.1 General Coupling effects that should be considered in FOWT global performance analyses include:
• Aero-elastic coupling effects
• Aero-control coupling effects
• Tower-hull and mooring (or tendon) coupling effects
• Hull-mooring (or tendon) coupling effects
• Other coupling effects
The way of simulating these coupling effects is highly dependent on the actual software and analysis approaches employed in global performance analyses and has to be evaluated on a case by case basis.
9.3 Aero-elastic Coupling Aero-elastic coupling are interactions between the aerodynamic loads on the rotor blades and the tower and the structural deformation due to the elasticity of the rotor blades, tower and drive train, etc., of the RNA. In the calculation of aerodynamic loads on rotor blades, the aero-elastic coupling effects should be considered.
9.5 Aero-control Coupling Aero-control coupling are interactions between the behavior of the control system and aerodynamic loads on the rotor blade.
9.7 Tower-Hull and Mooring Coupling The coupling between the tower-hull and the mooring system mainly includes:
• Influences of the hull and the mooring system on the tower modal shapes and natural frequencies
• Influences of the tower flexibility on the hull pitch and roll motion, particularly for the TLP-type FOWT

Section 2 Characteristics of Floating Offshore Wind Turbines
ABS GUIDANCE NOTES ON GLOBAL PERFORMANCE ANALYSIS FOR FLOATING OFFSHORE WIND TURBINE INSTALLATIONS . 2014 13
9.9 Hull-Mooring Coupling Hull-mooring coupling is the interaction between the mooring line restoring, damping and inertia forces and the hull mean position and dynamic responses.
• Restoring forces include static restoring force from the mooring and electrical cable system as a function of hull offset; current loading and its effects on the restoring force of the mooring and electrical cable system; and seafloor frictions if mooring lines and/or electrical cables have contact with the sea floor.
• Damping from the mooring lines and electrical cables due to their dynamics, current drag, etc.
• Additional inertia forces due to the mooring and electrical cable system
More discussions on this coupling effect can be found in API RP 2SK for applications in floating offshore structures.
9.11 Other Coupling Other coupling phenomena relevant to an FOWT may also exist, such as:
• Interaction between hull motions and behavior of the control system
• Interaction between hull motions and aerodynamic loads on the rotor blades
• Interaction between hull motions and wind, wave and current loads on the hull
• Change in hydrodynamic loads, added mass and damping on hull as the hull is offset and set-down
• Ringing and springing responses (TLP tendons)
• Loop current/VIV effects/responses

14 ABS GUIDANCE NOTES ON GLOBAL PERFORMANCE ANALYSIS FOR FLOATING OFFSHORE WIND TURBINE INSTALLATIONS . 2014
S e c t i o n 3 : M o d e l i n g o f F l o a t i n g O f f s h o r e W i n d T u r b i n e s
S E C T I O N 3 Modeling of Floating Offshore Wind Turbines
1 General In general, dynamic analyses should be carried out to evaluate dynamic responses of the FOWT subjected to site-specific external conditions and operating conditions. While various simplified analysis methods may be used in the preliminary design, an integrated (coupled) dynamic analysis approach is recommended for the final detailed design. Prototype tests and model tests may be used to supplement the load calculation.
For the purpose of motion and load calculations in the global performance analysis, modeling of an FOWT can be divided into the following areas:
• Modeling of the hull
• Modeling of flexibility of the tower
• Modeling of stationkeeping systems
• Modeling of rotor blades and control and safety systems
• Modeling of dynamics of drive trains
• Modeling of wind farm wake effects
The external conditions to be considered in global performance analysis include:
• Environmental conditions
• Electrical network conditions
In addition, various fault conditions relevant to the electrical system, control and safety systems and mechanical components should be properly modeled in the analysis.
3 Modeling of the Hull The hull in general can be modeled as a rigid body with 6 degrees of freedom (6 DOFs) motions. Modeling of the hull should consider the following loads and load effects:
• Hydrostatic loads
• Gravitational and inertial loads
• Wind, wave and current loads
• Other load effects, such as hull VIM and VIV
3.1 Hydrostatic Loads Balancing mass with buoyancy in the vertical direction is usually the starting point for hydrodynamic analyses. The vertical component of mooring pretensions is part of this load balancing.
Buoyancy of a large-volume floating hull can be calculated directly using the wetted surface of the panel element model created for radiation/diffraction analyses. When an analysis model includes both the panel elements and Morison elements, the buoyancy could still be calculated by most commercial software if actual locations and dimensions of the Morison elements are provided.
Correct modeling of metacentric heights (GML, GMT) is as important as modeling the location of the center of buoyancy. Free surface effects in partially filled internal tanks should be taken into account in determination of metacentric heights.

Section 3 Modeling of Floating Offshore Wind Turbines
ABS GUIDANCE NOTES ON GLOBAL PERFORMANCE ANALYSIS FOR FLOATING OFFSHORE WIND TURBINE INSTALLATIONS . 2014 15
Stiffness contributions from moorings and cables should be appropriately taken into account. The mass distribution of the hull can be represented by either a global mass matrix or a detailed mass distribution (e.g. FE model). The input coordinate system normally depends on the software employed and its origin may be placed at the vertical center of gravity or on the still water plane. Proper input of roll and pitch radii of gyration is critical and requires a correct definition of reference axis systems.
3.3 Wave Loads on the Large-Volume Floating Hull The typical hulls are large-volume floating structures that are inertia-dominated with respect to global motion behavior. Radiation/diffraction analyses are commonly used to determine the wave loads on such hulls. Some types of hull, for instance Semi-submersibles and truss Spars, may also have slender members/ braces for which the Morison load model is more appropriate.
A linear radiation/diffraction analysis is usually sufficient. The term ‘linear’ means that the average wetted area of a floating structure (up to the water line) is used in the analysis. The main output of a radiation/ diffraction analysis gives first-order excitation forces, hydrostatics, potential damping, added mass, first-order motions in 6 DOFs and second-order drift forces/moments. Such an analysis can also provide information relevant to the slowly varying responses in roll and pitch that is important for FOWTs based on Spars or other deep-draft floating structures, large Semi-submersibles and TLPs.
Low frequency vessel motions are caused, in part, by nonlinear second order drift forces. If the natural period of FOWT motions is long (for instance, larger than 25 seconds), a linear frequency-domain solution may be achieved by Newman’s approximation, which eliminates the off-diagonal terms in the QTF (Quadratic Transfer Function) matrix. Newman’s approximation generally gives satisfactory results for low frequency motions in the horizontal plane where the natural periods of FOWT motions are much longer than the wave periods. For low frequency motions in the vertical plane, for example the pitch motion of a Spar, Newman’s approximation may underestimate the second order drift forces. If such response is deemed important for the design, time-domain analyses using a full QTF matrix may be required. When the full QTF matrix approach is used, special attention should be paid to establishing a consistent damping level.
Second-order wave forces at the sum-frequencies in a random sea-state could excite resonant responses in heave, roll and pitch of the TLP-type FOWTs. Such resonant response, also known as springing, is a stationary time-harmonic oscillation of the TLP-type FOWTs at a resonance period of one of the vertical modes (i.e. heave, roll, pitch). In addition, the TLP-type FOWTs in deep water may experience very large resonant high frequency transient ringing response. Time-domain analysis is typically performed to evaluate these high frequency responses. There exist methods and computer tools for calculating the sum-frequency QTF. The important aspects to be considered for springing analyses include:
• Discretization (mesh) of wetted surface geometry
• Discretization of free surface and its extension
• Number of frequency pairs in the QTF matrix
• Damping level for the tendon axial response
Wave periods and wave headings should be selected such that motions and forces/moments can be described as correctly as possible. Cancellation, amplification and resonance effects should be properly captured. Modeling principles related to the panel mesh (size) should in general be followed, e.g.:
• Diagonal length in panel elements should not to be larger 20% of the smallest wave length analyzed.
• Fine panel mesh should be applied in areas with abrupt changes in geometry.
• Finer panel mesh should be applied towards the water-line in order to capture correct wave drift excitations.
Hydrodynamic interactions between multiple (n) floating structures in close proximity may also be solved using radiation/diffraction analyses, where the floating structures are normally solved in an integrated system with motions in n × 6 DOFs.

Section 3 Modeling of Floating Offshore Wind Turbines
16 ABS GUIDANCE NOTES ON GLOBAL PERFORMANCE ANALYSIS FOR FLOATING OFFSHORE WIND TURBINE INSTALLATIONS . 2014
3.5 Wind Loads, Current Loads and Hull VIM Wind loading is important for assessing global performance of the FOWT. Wind loading on the RNA usually is calculated using blade element momentum method (BEM) or other appropriate methods. Wind loading on the hull structure may be determined based on windage areas and appropriate drag coefficients and is often verified using wind tunnel tests.
Current conditions vary greatly in magnitude and direction at different site locations. In general, only measurements can provide sufficient background for determination of design current speeds and directions. Currents may induce VIV motions of the hull (i.e., hull VIM) as well as VIV oscillations of the mooring lines and, therefore, has to be suitably considered. It is also important to apply appropriate drag coefficients with due attention to conditions of the loading area as well as the damping effect. Sensitivity checks using different sets of drag coefficients are therefore recommended.
Hull VIM can affect the mooring system design as well as the electrical cable design in terms of both extreme loading and fatigue loading. Since VIV is a strongly non-linear phenomenon, model testing has often been used to determine the hull VIM responses and calibrate the numerical simulations.
3.7 Instability Mathieu’s instability may occur for dynamic systems with time dependent stiffness. Several effects may cause such time dependent stiffness. Specifically for the FOWT, there are two scenarios that may trigger instability:
• Non-constant heave stiffness caused by the geometric shape of the hull
• Non-constant pitch stiffness caused by a nonlinear heave coupling term
The heave/pitch-coupled instability in the second scenario could be critical for a single column hull with relatively low heave damping.
Instability can be identified through numerical simulations and/or model and field testing.
5 Modeling of Flexibility of Tower The tower can generally be modeled based on linear elastic theory. However, non-linear relationships between loads and load effects should be properly accounted for, where they are deemed important. Structural damping of the tower should be properly determined.
The wind loads on the tower should be included. When wind loads on the FOWT are analyzed, the influence of the tower shadow or tower upwind effects on the wind field perturbation should be properly modeled.
The dynamic structural response of the tower may be obtained by modal superposition. Sufficient modes should be included in the analysis. As a minimum, the first few orders bending modes should be included. If the tower does not have sufficient torsional stiffness, torsional modes should also be included in the modeling. Modal analyses of the tower should take into account influences of floating foundations.
For some types of FOWTs, such as a catenary-moored Spar-type or Semi-submersible-type FOWT, the tower may be modeled as part of the rigid body of the floating support structure in preliminary mooring system designs. However, the tower flexibility should be adequately modeled for the final detailed design.
7 Modeling of Stationkeeping System
7.1 General There are mainly two approaches for mooring system analysis (i.e., quasi-static analysis and dynamic analysis). Both methods can be pursued in either the frequency domain or the time domain. The time-domain dynamic method is usually required to account for nonlinearity and dynamic effects of the mooring (or tendon) system.
The formulation for modeling the mooring (or tendon) system is mainly based on the finite element method (FEM) or the lumped-mass method.

Section 3 Modeling of Floating Offshore Wind Turbines
ABS GUIDANCE NOTES ON GLOBAL PERFORMANCE ANALYSIS FOR FLOATING OFFSHORE WIND TURBINE INSTALLATIONS . 2014 17
7.3 Mooring Line Nonlinearity There are four primary nonlinear effects that could greatly affect mooring line behaviors:
• Nonlinear Stretching Behavior of the Mooring Line. The strain or tangential stretch of the mooring line is a function of the tension magnitude. Nonlinearity occurs mostly in synthetic materials such as polyester, while chain and wire rope can be regarded as linear. In many cases, this nonlinearity is simplified by a linearized behavior using a representative tangent or secant modulus.
• Changes in Geometry. The geometric nonlinearity is associated with large variations of the mooring line shape.
• Fluid Loading. The Morison equation is most frequently used to represent fluid loading effects on mooring lines. The drag force on the line is nonlinear because it is proportional to the square of the relative velocity between the fluid and the line.
• Bottom Effects. In many mooring designs, a considerable portion of the mooring line is in contact with the seafloor. The interaction between the line and the seafloor is usually considered to be a nonlinear frictional process. In addition, the length of grounded line segment constantly changes, causing an interaction between this nonlinearity and the geometric nonlinearity.
In the time-domain method, it is possible to model the non-linear effects described above - the elastic stretch can be mathematically modeled, the full Morison equation can be implemented, the position of the mooring line can be updated at each time step, and the bottom interaction can be simulated using a frictional model. Such a time-domain analysis requires recalculating mass, damping, and stiffness matrices and loading at each time step. Hence, the computation can become complex and time consuming.
The frequency-domain method, on the other hand, is always linear because of the principle of linear superposition. Hence, all sources of non-linearity should be simplified by either a direct linearization approach or an iterative linearization approach.
7.5 Finite Element Analysis Approach The Finite Element (FE) method can be an effective approach for modeling mooring (or tendon) systems in the global performance analysis. The important features that are desirable for adequate modeling and analysis of mooring (or tendon) systems normally include:
• 3D formulation
• Conventional small strain slender beam and bar elements capable of considering material and geometric stiffness and nonlinear material properties
• Hull/mooring (or tendon) connection formulation
• Seafloor/mooring line contact formulation
• Seabed/tendon connection formulation
• Structural damping formulation
• Hydrodynamic loading according to the Morison equation expressed by the relative water/structure velocity and acceleration
• Regular and irregular loading due to waves and hull structure motions.
• Current modeling
• Capability of modeling mooring components such as swivels, hinges, buoyancy modules, clump weights, flex-joints, etc.
• Capability of modeling constant (or variable) line tension devices
• Nonlinear static analysis
• Eigenvalue analysis
• Nonlinear time-domain dynamic analysis

Section 3 Modeling of Floating Offshore Wind Turbines
18 ABS GUIDANCE NOTES ON GLOBAL PERFORMANCE ANALYSIS FOR FLOATING OFFSHORE WIND TURBINE INSTALLATIONS . 2014
The computational efforts of nonlinear time-domain dynamic analysis can be substantial. This is in particular the case for irregular wave analyses where long simulations are typically required to estimate extreme responses with sufficient statistical confidence. It is therefore beneficial to apply simplified analysis approaches as a supplement to achieve more efficient computer analyses (e.g., linearized time-domain analysis, frequency-domain analysis, etc.).
9 Modeling of Dynamics of Drive Trains For the purpose of global performance analysis, drive train dynamics should be properly considered. As a minimum the torsional mode of the drive train should be included in the analysis.
The drive train includes all torque-transmitting components from the rotor to the generator including the elastic mounting of the drive train. The parameterization assumptions of the drive train model used in the global load calculation should be verified by the calculation using more detailed drive train models. In most cases, the controlling parameters are ‘resulting drive train stiffness’ and ‘moment of inertia of generator rotor’. The verification can also be carried out through the comparison of the first eigen-frequency obtained from the detailed drive train model to the corresponding value derived from the global load simulation model. Other verification techniques can also be used, if appropriate.
11 Modeling of Rotor Blade and Control and Safety Systems
11.1 General The rotor blades can in general be modeled based on linear elastic theory. However, non-linear relationships between loads and load effects should be properly accounted for, where they are deemed important. As a minimum, the edgewise and flapwise bending degrees of freedom should be considered in the evaluation of aero-elastic responses. Structural damping of the rotor blades should also be properly selected.
Modeling of rotor blades and control and safety systems should include the following loads and load effects:
• Gravitational and inertial loads
• Aerodynamic loads
• Actuation loads (or operational loads)
• Other loads (such as wake loads, impact loads, ice load, etc.)
The influence of the control system on the loads, especially aerodynamic loads should be properly modeled. The interaction of the turbine control system with the low frequency motions of the hull structure should be incorporated into the control system design and load analysis. Resonance and dynamic amplification of motions due to control system actions should be avoided.
The combined effects of inertial, gravitational and aerodynamic loads of the RNA for a three-blade horizontal axis wind turbine include the following frequency components:
• Rotor rotation frequencies (1P)
• Blade passing frequencies (3P)
• Harmonics of 1P and 3P (2P, 6P, 9P, etc.)
• Natural frequencies of rotor blades
• Natural frequencies of other RNA components
11.3 Gravitational and Inertia Loads Gravitational and inertial loads are static and dynamic loads that could be induced by gravity, vibrations, rotations and seismic activities.
In dynamic analyses, structural dynamics properties and the coupling of vibratory modes should be properly modeled. The following items should be taken into account:

Section 3 Modeling of Floating Offshore Wind Turbines
ABS GUIDANCE NOTES ON GLOBAL PERFORMANCE ANALYSIS FOR FLOATING OFFSHORE WIND TURBINE INSTALLATIONS . 2014 19
• Elasticity of the blades
• Elasticity of the drive train and generator (drive train dynamics)
• Elasticity of the tower
• Global motions of the floating support structures
• Mass eccentricity of the rotor
• Helideck dynamics (if relevant)
• Stiffness of the floating support structure and mooring system (if relevant)
• Elastic mounting of the machinery, vibration dampers (if relevant)
11.5 Aerodynamic Loads The aerodynamic loads on rotor blades are dependent upon:
• Rotational speed of the rotor
• Average wind speed across the rotor plane
• Turbulence intensity
• Density of the air
• Aerodynamic shapes of the offshore wind turbine components and their interactive effects, including the aeroelastic effects
The calculation method for aerodynamic loads on rotor blades is normally based on the blade element momentum theory (BEM). Other methods such as potential flow method, computational fluid dynamics (CFD), etc., may also be used. In addition, aerodynamic loads on the nacelle should be taken into account, if deemed important.
The following aspects should be taken into account regarding wind loads on the RNA:
• Wind field perturbations due to the offshore wind turbine itself (wake-induced velocities, tower shadow, tower upwind effect etc.)
• The influence of three-dimensional flow on the blade aerodynamic characteristics (e.g., three-dimensional stall and aerodynamic tip loss)
• Dynamic stall effects of the airflow for the profiles used
• Unsteady aerodynamic effects
• Aeroelastic effects
• Aerodynamic asymmetries that can arise through production or assembly tolerances of the rotor blades
11.7 Actuation Loads (Operational Loads) Actuation loads (or operational loads) are generated by the operation and control of the RNA. The main source of actuation loads are the rotor speed control and/or the torque control through pitching the blades or adjusting other aerodynamic devices. Actuation loads also include the mechanical braking loads as well as the transient loads arising during the start and shutdown of the rotor, engagement and disengagement of the generator, and nacelle yaw movements. As a minimum, the following should be taken into account:
• Static and load-dependent bearing friction moments (especially those at the blade pitch bearing and the yaw bearing)
• Behavior of the control and safety systems of the RNA

Section 3 Modeling of Floating Offshore Wind Turbines
20 ABS GUIDANCE NOTES ON GLOBAL PERFORMANCE ANALYSIS FOR FLOATING OFFSHORE WIND TURBINE INSTALLATIONS . 2014
13 Modeling of Wind Farm Wake Effects Within an offshore wind farm, the turbulence intensity associated with wake flow may be considerably higher than the ambient turbulence intensity. In addition, wake flow is characterized by a reduced mean wind speed and an increased shear profile. In the absence of detailed analysis of the wind characteristics within an offshore wind farm, the design calculation may be performed using increased turbulence intensity based on the past experience and recognized calculation methods.
The mutual influence of offshore wind turbines through the wake interaction behind the rotor should be considered in a wind farm configuration up to a distance of at least 10 rotor diameters from another FOWT. Reference can be made to IEC 61400-1 for guidance on the wake effects from neighboring wind turbines.
As appropriate, the global yawing moment exerted on the floating support structure due to unbalanced rotor aerodynamic loads caused by the shade effect or the wake effect of neighboring FOWTs should also be considered. Such global yawing moment may be assessed separately and added to the total RNA aerodynamic loads.
15 Electrical Cable Considerations The electrical cable system for exporting generated electricity could have a long suspended segment extending from its connecting point on the hull to the seafloor. The electrical cable interacts with the floating support structure and the mooring in several aspects. Wave and current actions on the cable could increase the environmental actions to be resisted by the mooring, while the cable system stiffness provides assistance to the mooring. Furthermore, damping from the cable system decreases the low frequency motions and in turn reduces the mooring tensions. The net result of these effects depends on a number of factors such as type of the cable and water depth. Mooring design should consider the cable loads, stiffness and damping unless it can be demonstrated that neglecting the cable in global performance analyses results in a more conservative mooring design.

ABS GUIDANCE NOTES ON GLOBAL PERFORMANCE ANALYSIS FOR FLOATING OFFSHORE WIND TURBINE INSTALLATIONS . 2014 21
S e c t i o n 4 : D e t e r m i n a t i o n o f E n v i r o n m e n t a l L o a d s
S E C T I O N 4 Determination of Environmental Loads
1 General Model or on-site test data may be employed to establish environmental loads. Alternatively, environmental loads may be determined using analytical methods compatible with the environmental condition models established in compliance with Chapter 4 of the FOWTI Guide. Any recognized load calculation method may be employed provided it has proven sufficiently accurate in practice, and it is shown to be appropriate to the system’s characteristics and site conditions.
3 Aerodynamic Loads on RNA Aerodynamic loads induced by airflow passing through the rotor are determined by the mean wind speed and turbulence across the rotor plane, rotor rotational speed, air density and aerodynamic shapes of wind turbine components as well as interactive effects such as aero-elasticity and rotational sampling. Aerodynamic loads due to these effects should be calculated using recognized methods and computer programs. Guidelines for calculation of aerodynamic loads and other loads and load effects on the RNA for the purpose of the global performance analysis are given in Subsection 3/11.
The 10-minute mean wind speed at hub height (i.e., Vhub as defined in 4-2/3 of the FOWTI Guide) and the wind models defined in Chapter 4, Section 2 of the FOWTI Guide are used in the definition of design load conditions in Chapter 5, Section 2 of the FOWTI Guide.
For FOWTs installed in a wind farm, the potential shadow effect and wake effect on the loads should be considered for both the strength and fatigue analyses. Guidelines for modeling of wind farm wake effects can be found in Subsection 3/13.
5 Typical Environmental Loads on Mooring Lines Mooring lines are typically modeled as slender cylindrical members. The environmental loads directly acting on mooring lines should be considered as follows.
5.1 Current Induced Loads Current loads could be particularly important for locations with high currents. Loads on mooring lines due to currents can be calculated as:
F = 1/2ρwCddv2
where
F = force per unit length normal to the local mooring line, in N/m (lb/ft)
ρw = density of the seawater, in kg/m3 (slug/ft3)
Cd = drag coefficient
d = nominal diameter of the mooring line, in m (ft)
v = component of current velocity normal to the local mooring line, in m/s (ft/s)
Where there are high currents, the drag coefficient should be adjusted for the presence of vortex-induced vibrations.

Section 4 Determination of Environmental Loads
22 ABS GUIDANCE NOTES ON GLOBAL PERFORMANCE ANALYSIS FOR FLOATING OFFSHORE WIND TURBINE INSTALLATIONS . 2014
5.3 Ice-induced Loads The effect of ice loads on the mooring system should be considered where applicable.
5.5 Vortex-induced Vibrations of the Mooring Lines For the smooth, cylindrical mooring lines, possible occurrences of vortex-induced vibration (VIV) and in particular its effect on the drag coefficients should be considered.
5.7 Direct Wave Loads on Mooring Lines Direct wave loads on mooring lines may be neglected.
5.9 Marine Growth The type and accumulation rate of marine growth at the design site can affect mass, weight, hydrodynamic diameters, and drag coefficients of mooring lines. This should be taken into consideration for mooring systems not subject to regular marine growth removal.
7 Typical Environmental Loads on Floating Support Structures Floating support structure offset and motions are the main source of indirect loads on FOWT stationkeeping systems. For the purpose of assessing their effects and relative influences on the stationkeeping system design, environmental loads and load effects of the floating support structures are categorized into the following types according to their frequency range.
• Steady loads such as wind, current and wave drift forces that are constant in magnitude and direction for the duration of interest.
• Low frequency cyclic loads (often referred to as slow drift) with characteristic periods between 1 and 10 minutes. Low frequency cyclic loads typically induce dynamic excitations of the floating support structures at their natural periods of surge, sway, yaw and, in the case of the Spar-type FOWTs, pitch and roll.
• Wave frequency cyclic loads with typical periods ranging from 3 to 30 seconds. Wave frequency cyclic loads result in wave frequency motions, which are normally independent of mooring stiffness. The approach of neglecting mooring stiffness in wave frequency motion calculations is considered relatively conservative. However for small floating structures such as buoys where the first order wave loads are not large, accounting for mooring stiffness can yield more realistic wave frequency motions. In addition, if the natural period of the FOWT is close to the wave periods, the wave frequency motions could be dependent on the mooring stiffness. In this case the effect of stiffness should be properly accounted for.
• High-frequency cyclic loads with characteristic periods from 1 to 5 seconds. High-frequency cyclic loads typically induce dynamic excitation of the TLP-type floating support structures at their natural periods of heave, roll and pitch.
• High frequency vibration due to tower and RNA dynamic loads with frequency higher than 0.5 hz (periods lower than 2 seconds). Such high frequency loads may be transmitted to the TLP-type floating support structure and its tendon system.
Calculation of environmental loads on the floating offshore structure can be found in API RP2SK, API RP 2T, and ISO 19901-7, with general guidance given below.
7.1 Wind Loads Wind loads and local wind pressures should be determined on the basis of analytical methods or wind tunnel tests on a representative model of an FOWT. Static and dynamic wind load effects generated directly by the inflowing wind and indirectly by the wind generated motions of the FOWT and the operations of the FOWT should be taken into account.

Section 4 Determination of Environmental Loads
ABS GUIDANCE NOTES ON GLOBAL PERFORMANCE ANALYSIS FOR FLOATING OFFSHORE WIND TURBINE INSTALLATIONS . 2014 23
For wind drag loads normal to flat surfaces, such as nacelle and boat landing, or normal to the axis of members not having flat surfaces, such as the tower and the floating support structure, the wind loading can be considered either as a steady wind force or as a combination of steady and time-varying load calculated from a suitable wind spectrum. Where one structural member shields another from direct exposure to the wind, shielding may be taken into account. Generally, the two structural components should be separated by not more than seven times the width of the windward component for a reduction to be taken in the wind load on the leeward member.
Cyclic loads due to vortex induced vibrations of structural members should be investigated if applicable. Both drag and lift components of load due to vortex induced vibrations should be taken into account. The effects of wind loading on structural members or components that are not normally exposed to wind loads after installation should be considered where applicable. This would especially apply to load-out or transportation phases.
7.3 Wave Loads For structures consisting of slender members that do not significantly alter the incident wave field, semi-empirical formulations, such as Morison’s equation, may be used. For calculation of wave forces on structural configurations that significantly alter the incident wave field, appropriate methods which account for both the incident wave force (e.g., Froude-Krylov force) and the forces resulting from wave diffraction should be used. In general, Morison’s equation is applicable for structures comprising slender members with diameters (or equivalent diameters giving the same cross-sectional areas parallel to the flow) less than 20 percent of the wave lengths.
For the floating support structure consisting of large (columns and pontoons) and small (brace members) cylindrical members, a combination of diffraction and Morison’s equation may be used for calculation of hydrodynamic characteristics and hydrodynamic loading. Alternatively, suitable model test results or full scale measurements can be used.
For installation sites where the ratio of water depth to wave length is less than 0.25, nonlinear effects of wave action should be taken into account. This may be fulfilled by modifying linear diffraction theory to account for nonlinear effects or by performing model tests. Wave force calculations should account for shallow water effects which increase current due to blockage effects, change the system natural frequency due to nonlinear behavior of moorings and alter wave kinematics.
7.5 Current Loads Current induced loads on immersed structural members should be determined based on analytical methods, model test data or full-scale measurements. When currents and waves are superimposed, the current velocity should be added vectorially to the wave induced particle velocity prior to computation of the total force. Current profiles used in the design should be representative of the expected conditions at the installation site. Where appropriate, flutter and dynamic amplification due to vortex shedding should be taken into account.
7.7 Marine Growth Marine growth could affect the hydrodynamic loads through:
• Increased hydrodynamic diameter
• Increased surface roughness used in the determination of hydrodynamic coefficients (e.g., lift, drag and inertia coefficients)
• Increased permanent load and inertial mass.
The amount of accumulation assumed for design should reflect the extent of and interval between cleaning of submerged structural parts.

Section 4 Determination of Environmental Loads
24 ABS GUIDANCE NOTES ON GLOBAL PERFORMANCE ANALYSIS FOR FLOATING OFFSHORE WIND TURBINE INSTALLATIONS . 2014
7.9 Vortex-Induced Motions (VIM) of the Floating Support Structure Floating support structures consisting of large diameter cylindrical components such as Spars, Semi-submersibles, and TLPs can experience low frequency motions due to vortex shedding in the presence of currents. These vortex-induced motions (VIM) are most prominent for Spars where most of the industry experience has been acquired. Nevertheless, multi-column floating structures such as semi-submersibles and TLPs can also experience VIM and this effect should be taken into account in the design.
VIM could have three primary effects on the mooring design:
• Increase in the average in-line drag coefficient
• Large low frequency VIM motion amplitudes relative to the total floating support structure responses
• Additional low frequency oscillating mooring line tensions
These effects should be taken into account for strength and fatigue design of FOWT stationkeeping systems. The occurrence of the Loop Current and associated eddies in the Gulf of Mexico make consideration of VIM particularly important for this geographic area. For example, unlike other extreme events, e.g. winter storms and hurricanes, the Loop Current and associated eddies could affect a particular site for an extended period of time and thus cause a significant fatigue damage accumulation in mooring components.
7.11 Directional Distribution The floating support structure offsets and motions used in the stationkeeping system design should be evaluated for the most unfavorable combinations of wind direction, wave direction and current direction, consistent with the site-specific metocean characteristics. The ability of the floating support structure to change heading in response to changing environmental conditions may be taken into account.
9 Ice and Snow Accumulation Induced Loads At locations where FOWTs are subjected to ice and snow accumulation, increased weight and change in effective area of structural members due to accumulated ice and snow should be considered. Particular attention should be paid to possible increases in aerodynamic and hydrodynamic loading due to the change in size and surface roughness of both non-rotating and rotating parts of an offshore wind turbine caused by ice and snow accumulation.
11 Earthquake Loads For a FOWT supported by a tendon system and located in a seismically active area, the Strength Level and Ductility Level earthquake induced ground motions (see 4-6/9 of the ABS FOWTI Guide) should be determined based on seismic data applicable to the installation site. Reference should be made to API RP 2T for designing the tendon systems against earthquake loading.
Earthquake ground motions should be described by either applicable ground motion records or response spectra consistent with the return period appropriate to the design life of the structure. Available standardized spectra applicable to the region of the installation site are acceptable provided such spectra reflect site-specific conditions affecting frequency content, energy distribution, and duration. These conditions include:
• The type of active faults in the region
• The proximity of the site to the potential source faults
• The attenuation or amplification of ground motion between the faults and the site
• The soil conditions at the site
As appropriate, effects of soil liquefaction, shear failure of soft mud and loads due to acceleration of the hydrodynamic added mass by the earthquake, submarine slide, tsunamis and earthquake generated acoustic shock waves should be taken into account.

Section 4 Determination of Environmental Loads
ABS GUIDANCE NOTES ON GLOBAL PERFORMANCE ANALYSIS FOR FLOATING OFFSHORE WIND TURBINE INSTALLATIONS . 2014 25
13 Ice Loads Ice loads acting on an FOWT are both static and dynamic loads. Static loads are normally generated by temperature fluctuations or changes in water level in a fast ice cover. Dynamic loads are caused by moving ice interactions with the floating support structure. The global forces exerted by ice on the global floating support structure and local concentrated loads on structural elements should be considered. The effects of rubble piles on the development of larger areas and their forces on the floating support structure should be considered. Further reference is made to API RP 2N and ISO 19906.

26 ABS GUIDANCE NOTES ON GLOBAL PERFORMANCE ANALYSIS FOR FLOATING OFFSHORE WIND TURBINE INSTALLATIONS . 2014
S e c t i o n 5 : D e f i n i t i o n o f A n a l y s i s M e t h o d o l o g i e s
S E C T I O N 5 Definition of Analysis Methodologies
1 Frequency-Domain and Time-Domain Analysis
1.1 Frequency-Domain Analysis Frequency-domain analysis refers to calculation of loads and responses in the frequency domain by solving the equations of motion using methods of harmonic analysis or methods of Laplace and Fourier transformations. It generally includes the following types of analysis:
• Wave load calculation in the frequency domain
• Motion analysis in the frequency domain
• Air gap analysis in the frequency domain
• Mooring analysis in the frequency domain
In the calculation of FOWT wave frequency responses, linear wave theory is usually employed, while more sophisticated methods may be employed to model finite amplitude waves. The low frequency motion analysis should be carried out to evaluate the responses to wind dynamics and wave drift forces. The damping levels used in such analyses should be properly determined and documented. For the TLP-type floating support structure, where second-order sum-frequency effects are deemed significant, the high frequency springing responses of the floating support structure and tendons should be evaluated.
Frequency-domain analyses for evaluating aerodynamic responses of the RNA and effects of turbine control systems should be properly formulated. Preferably, combined aerodynamic, hydrodynamic and control system actions in the frequency domain are used in the calculation of FOWT dynamic responses.
Frequency-domain analyses, by nature, cannot capture nonlinear dynamic interactions among the components and subsystems of the FOWT. Methods of approximating nonlinearity in the frequency domain and their limitations should be investigated to justify that they can provide acceptable solutions for the intended application. Frequency-domain analyses are also unable to take into account transient responses as well as nonlinear aerodynamic and hydrodynamic load effects. Because of these limitations, most of currently available simulation software for FOWTs is based on the time-domain analysis approach as described in 5/1.3. Frequency-domain analyses are normally performed to calculate the hydrodynamic coefficients which are used as input to time-domain analyses.
1.3 Time-Domain Analysis Time-domain analysis refers to calculation of the loads and responses in the time domain. It generally includes the following types of analysis:
• Motion analysis in the time domain
• Air gap analysis in the time domain
• Mooring analysis in the time domain
Time-domain analyses consist of numerically solving the equations of motion in the time domain for the FOWT subjected to environmental conditions and the RNA operational loads. As the input to time-domain analyses, time series of wind and wave conditions are generated to simulate turbulent wind conditions and stochastic wave elevations and kinematics.

Section 5 Definition of Analysis Methodologies
ABS GUIDANCE NOTES ON GLOBAL PERFORMANCE ANALYSIS FOR FLOATING OFFSHORE WIND TURBINE INSTALLATIONS . 2014 27
Time-domain analyses are the preferable approach for FOWT global performance analyses, primarily because they can provide a rational means of modeling the nonlinear and transient effects in FOWT global responses. These nonlinear effects include, but are not limited to, hydrodynamic drag forces, finite wave amplitude effects, nonlinear restoring forces from moorings as described in 3/7.3, and effects of motion suppression devices or components (e.g., heave plates). Time-domain analyses also allow modeling of the coupling effects among responses of the turbine RNA, the floating support structure, the stationkeeping system and the export electrical cable.
Time-domain analyses should be carried out for a sufficiently long time to achieve stationary statistics, particularly for low frequency responses. Multiple realizations of an individual set of stochastic site conditions may be necessary in order to generate adequate data for statistical analysis and to verify consistency of the simulation. The most probable maximum responses should be predicted using appropriate distribution curve fitting or other recognized statistical techniques.
For the TLP-type floating support structure, the ringing (the high frequency vertical vibration excited by impulsive loading) and the springing (the high frequency vertical vibration excited by cyclic loading at or near the resonant periods) responses of the TLP hull and the tendon should be considered as appropriate. Further guidance on high frequency ringing and spring analyses can be found in API RP 2T.
The effect of Vortex Induced Motions (VIM, see 4/7.9) for the floating support structure in the form of Spar, single column TLP or other types of deep-draft hull structure should be taken into account as appropriate.
1.5 Combined Time-Domain and Frequency-Domain Analysis Combined time- and frequency-domain analysis refers to the approach where first-order wave frequency responses are computed in the frequency domain and other dynamic responses are computed in the time domain. Total dynamic responses are the combination of relevant responses obtained from frequency-domain and time-domain analyses. This approach can be used in the following analysis:
• Motion analysis
• Air gap analysis
• Mooring analysis
To reduce the complexity and computational effort associated with full time-domain simulations, combined time- and frequency-domain analyses are often employed. Typically, the mean and low frequency responses (hull displacements, mooring line tensions, anchor loads, etc.) are computed in the time domain while the wave frequency responses are solved separately in the frequency domain. The frequency-domain solution of wave frequency responses is normally processed to obtain either statistical peak values or time series, which are then superimposed on the mean and low frequency responses.
3 Quasi-Static and Dynamic Analysis
3.1 Quasi-Static Analysis In quasi-static analyses, the mooring system is modeled quasi-statically and wave actions are taken into account by statically offsetting the hull using wave-induced hull motions. Dynamic actions on the mooring lines associated with mass, damping and fluid accelerations are neglected. Past experience has shown that the reliability of mooring system designs based on quasi-static analyses can vary widely depending on the hull type, water depth and mooring line configuration.
3.3 Dynamic Analysis Dynamic analysis of the mooring system accounts for the time-varying effects due to mass, damping and fluid accelerations. Time-varying fairlead motions are calculated from the hull structure’s surge, sway, heave, roll, pitch, and yaw motions. Dynamic models are used to predict the mooring line responses to fairlead motions.
Either frequency-domain or time-domain analyses can be used to predict dynamic responses of the mooring system.

Section 5 Definition of Analysis Methodologies
28 ABS GUIDANCE NOTES ON GLOBAL PERFORMANCE ANALYSIS FOR FLOATING OFFSHORE WIND TURBINE INSTALLATIONS . 2014
5 Coupled, Semi-Coupled, and Uncoupled Analysis
5.1 Coupled Analysis There are various types of interaction, also known as coupling, among subsystems of the FOWT as described in Subsection 2/9. A coupled analysis means a fully coupled analysis (or an integrated analysis) in the time domain. More specifically, the complete system of equations accounting for the rigid body model of the hull structure, elastic models of tower and turbine RNA, the slender body model for the cables and mooring lines, as well as the control system are solved simultaneously using a non-linear time-domain approach for dynamic analyses.
When an integrated (coupled) model is used for global performance analyses, coupling effects among responses of the turbine RNA, the floating support structure, the stationkeeping system and the subsea electrical cable can be taken into account at each incremental analysis time step. A more realistic simulation of the effects of the turbine control system and turbine’s operating conditions can also be achieved using this approach.
5.3 Semi-Coupled Analysis In a semi-coupled analysis, the coupling effects between aero-elastic and aero-control (servo) are neglected. The tower and the RNA are modeled as part of the hull as a rigid body. The aerodynamic loads are modeled by the wind forces applied at the top of the tower. Effects of the control system should be suitably considered in deriving the aerodynamic loads on the RNA. The aero-control (servo) coupling effects may be approximately represented by the rotor thrust force whose magnitude is expressed as a function of wind speed and the RNA’s operational condition. In the parked condition, nacelle yaw misalignment may be included by using appropriate wind force drag coefficients and windage areas.
The hull, mooring system and, if needed, subsea cables are dynamically coupled in this approach.
5.5 Uncoupled Analysis In an uncoupled analysis, the system of equations accounting for the rigid body motions is solved in the time domain. The tower and the RNA are modeled as part of the hull as a rigid body. Effects of the control system should be suitably considered in deriving the aerodynamic loads on the RNA. The aero-control (servo) coupling effects may be approximately represented by the rotor thrust force whose magnitude is expressed as a function of wind speed and the RNA’s operational condition. The effect of the mooring and subsea cable systems are modeled quasi-statically using non-linear springs based on the quasi-static restoring force characteristics. All other coupling effects between the hull and the mooring system (e.g., contributions from damping and current loading on the mooring lines) need to be pre-calculated and provided as direct input to the analysis.
The same load model may be applied for the hull in coupled, semi-coupled or uncoupled analyses.

ABS GUIDANCE NOTES ON GLOBAL PERFORMANCE ANALYSIS FOR FLOATING OFFSHORE WIND TURBINE INSTALLATIONS . 2014 29
S e c t i o n 6 : G l o b a l M o t i o n A n a l y s i s
S E C T I O N 6 Global Motion Analysis
1 General Dynamic global motions of FOWTs can be simulated using frequency-domain analyses, time-domain analyses or combined frequency and time-domain analyses, as described in Subsection 5/1. All three approaches include various techniques of approximation and therefore may not yield consistent results. It is recommended that the approach selected for the mooring design be verified by model testing, full-scale testing, or the use of a different analytical approach.
FOWT global motions contain the following components:
• Static and mean responses due to wind, wave and current
• Low frequency motions induced by wave/current effects and dynamic wind loads
• Wave frequency motions induced by waves
• High frequency motions induced by waves for the TLP-type floating support structures
• Vibrations induced by the loads exerted by the tower and the RNA, if applicable
• Hull VIM, if applicable (see 4/7.9)
The steady or mean forces result in the mean offset of the FOWT. The low frequency forces excite the motions which are at frequencies lower than wave frequencies but close to the surge, sway or yaw natural frequencies of the floating support structure. The wave frequency forces excite wave frequency surge and sway motions. Because of its weathervaning nature, the FOWT with a single point mooring may experience large low frequency yaw motions. These yaw motions may significantly affect FOWT and mooring system responses, and therefore should be taken into account in global motion analyses and model testing.
Global motion analyses are normally performed in conjunction with mooring (or tendon) analyses. However, they may also be carried out separately when only global motions are of interest. In such cases, either the quasi-static or the dynamic analysis approach can be used to analyze the mooring system in global motion analyses. If the quasi-static analysis approach is used, special attention should be given to the appropriate simulation of the coupling effects.
3 Static and Mean Responses Static and mean response analyses are carried out to determine the static equilibrium position with no wind, wave, or current present as well as the mean positions with steady environmental loads acting on the FOWT. The determination of the equilibrium and mean positions is essential before any dynamic analyses are undertaken.
The following steady forces should be taken into account in the analysis:
• Mean Wind Forces. Mean wind forces should be calculated using the average wind speed measured for an extended period, normally on the order of one hour, under a given design environmental condition.
• Current Forces. The drag forces on the mooring lines (or tendons) and cables subject to the current under a given design environmental condition should be included in the calculation of total steady forces.
• Steady Wave Drift Forces. Steady wave drift forces acting on the hull due to wave diffractions and second-order viscous effects. The interaction between waves and currents can also result in steady forces which should be considered.

Section 6 Global Motion Analysis
30 ABS GUIDANCE NOTES ON GLOBAL PERFORMANCE ANALYSIS FOR FLOATING OFFSHORE WIND TURBINE INSTALLATIONS . 2014
5 Low Frequency Motions Low frequency motions of FOWTs can be obtained using either frequency-domain or time-domain analyses.
In frequency-domain analyses, assuming that low frequency wind and wave forces are independent, the total low frequency force spectrum is given by the sum of the low frequency wave force spectrum and the low frequency wind force spectrum. This total force spectrum can then be multiplied by appropriate motion transfer functions to obtain desired motions.
In time-domain analyses, because low frequency motions are dominated by the surge, sway and yaw resonances with natural periods typically ranging from 60 to 150 seconds, a long simulation duration is required to obtain a sufficient number of cycles for developing an accurate estimate of the statistical extreme. Time histories of low frequency forces could be generated either from wind and wave force spectra or directly from wind velocity and wave profile time histories.
The estimation of damping is important because low frequency motions are dominated by resonant responses. Further discussion of damping is provided in Subsection 6/13.
7 Wave Frequency Motions Wave frequency motions are induced by first-order wave forces. Wave frequency motions can be obtained using either the frequency or time-domain analyses.
9 High Frequency Motions High frequency motions are induced by second and higher order wave forces. High frequency motions can be obtained using either the frequency or time-domain methods.
11 Tower and Turbine RNA Load Induced Vibrations Due to the flexibility of the tower and the RNA, there are high frequency load components at the natural frequencies of the tower and the RNA. These loads may be transmitted to the hull and result in hull vibrations.
13 Damping
13.1 Damping of Low Frequency Motions Low frequency motions of a moored FOWT are narrow banded in the frequency domain because they are dominated by the resonant responses at the natural frequency of the moored FOWT. Amplitudes of low frequency motions are highly dependent on the stiffness of the mooring system and damping. There is a substantial degree of uncertainty in the estimation of low frequency motions, particularly in the area of damping that could in general come from five sources:
• Aerodynamic damping
• Viscous damping of the floating support structure (tower and hull structure), including wind, wave, and current drag
• Wave drift damping of the floating support structure
• Mooring system damping
• Cable system damping
The technology for estimating viscous damping has well been established, and viscous damping is normally included in the low frequency motion calculations. Wave drift damping, mooring system damping, and cable system damping, however, are more complex and are sometimes neglected because of a lack of understanding. Nevertheless, these damping components could be important and neglecting them may lead to significant over-estimation of low frequency motions. Where low frequency motions are considered important, it may be warranted to evaluate the damping from all these sources either by appropriate analytical approaches or model testing.

Section 6 Global Motion Analysis
ABS GUIDANCE NOTES ON GLOBAL PERFORMANCE ANALYSIS FOR FLOATING OFFSHORE WIND TURBINE INSTALLATIONS . 2014 31
13.3 Damping of High Frequency Motions The TLP-type FOWT could experience high frequency motions and vibrations in the vertical motion modes including heave, roll and pitch motions. Damping in the vertical motion modes is affected by structural and soil damping, as well as hydrodynamic and aerodynamic damping, and should be estimated either by appropriate analytical approaches or model testing. This is especially important in the calculation of the springing and ringing responses, and the tower and the RNA induced vibrations that could contribute significantly to the tendon fatigue damage.
15 Analysis Methods For global motion analysis the following approaches may be used:
Frequency-domain analyses
Time-domain analyses
Combined time-domain and frequency-domain analyses
15.1 Frequency-Domain Approach Mean, low frequency, and wave frequency responses of FOWTs are calculated separately in frequency-domain analyses. The mean responses are calculated by the static equilibrium or mean position. The low frequency motions and set-down associated with offset are calculated in the frequency domain with appropriate consideration of damping effects from wind and current and mooring/cable. The wave frequency responses due to wave radiation/diffraction and wave asymmetry effects are calculated with consideration of wave loads only. Damping effects from wind and current and mooring/cable should be properly modeled. Total motions are obtained by combining the mean, wave and low frequency motions.
When the frequency-domain approach is used to compute the hull motion responses, the extreme values of the motion responses are defined as the mean plus or minus the maximum estimated value of the time-varying excursion due to combined wave frequency and low frequency hull motions.
The extreme values of the hull motion, Smax and Smin can be determined by:
Smax = Smean + MAX(Sdyn1, Sdyn2)
Smin = Smean MAX(Sdyn1, Sdyn2)
Sdyn1 = Slfmax + Swfsig
Sdyn2 = Swfmax + Slfsig
where
MAX = the larger of the absolute values of the terms in parenthesis
Smax = maximum hull motion
Smin = minimum hull motion
Smean = mean hull motion
Slfmax = maximum expected value of low frequency hull motion
Slfsig = significant value of low frequency hull motion
Swfmax = maximum expected value of wave frequency hull motion
Swfsig = significant value of wave frequency hull motion
The total offset should be defined as the vector sum of the individual offset components of different degrees of freedom (e.g., surge and sway). The total heel should be defined as the vector sum of the individual component angles of different degrees of freedom (e.g., roll and pitch).

Section 6 Global Motion Analysis
32 ABS GUIDANCE NOTES ON GLOBAL PERFORMANCE ANALYSIS FOR FLOATING OFFSHORE WIND TURBINE INSTALLATIONS . 2014
15.3 Time-Domain Approach The fully coupled, semi-coupled and uncoupled analysis methods can be used when FOWT global motion analyses are carried out in the time domain. In the case of semi-coupled and uncoupled analyses, the applied damping level should be calibrated by fully coupled analyses and/or model testing. When the tower accelerations are of interest, a fully coupled analysis should be used and flexibility of the tower should be properly considered.
15.5 Combined Time-Domain and Frequency-Domain Approach. FOWT mean, low frequency and wave frequency responses are calculated separately when combined time-domain and frequency-domain analyses are employed in global motion analyses. The mean responses are calculated by the static equilibrium or mean position. The wave frequency responses due to wave radiation/ diffraction and wave asymmetry effects are calculated with consideration of wave loads only in the frequency domain. Damping effects from wind and current, and mooring/cable should be properly considered. The low frequency motions and set-down associated with offset are calculated in the time domain. The total motions are obtained by combining the mean, wave and low frequency motions.

ABS GUIDANCE NOTES ON GLOBAL PERFORMANCE ANALYSIS FOR FLOATING OFFSHORE WIND TURBINE INSTALLATIONS . 2014 33
S e c t i o n 7 : A i r G a p A n a l y s i s
S E C T I O N 7 Air Gap Analysis
1 General Air gap analysis should be performed for the design load cases associated with the extreme environmental conditions (i.e., DLC 1.6, 6.2, 6.3 as defined in 5-2/Table 1 of the FOWTI Guide) and the survival load cases (see 5-2/Table 2 of the FOWTI Guide). The most important parameters to be evaluated in the air gap analysis are the wave crest height and the hull roll, pitch and heave motions.
In the air gap analysis, the following global hull motions should be considered:
• Static and mean responses due to wind, wave and current
• Low frequency motions induced by wave/current effects and dynamic wind loads
• Wave frequency motions induced by waves
High frequency motions and vibrations, as well as the tower flexibility, may be neglected for the air gap analysis.
For the wave crest height, the nonlinearity of wave profile, wave diffraction and run-up, tide and water level effects, and variations of draft of the floating support structure should be considered.
General guidance for air gap and wave crest effects assessment can be found in in API RP 2FPS for semi-submersibles and spars and API RP 2T for TLPs.
3 Air Gap Analysis Methods For the air gap analysis the following methods may be used:
• Frequency-domain analyses
• Time-domain analyses
• Combined time-domain and frequency-domain analyses
3.1 Frequency-Domain Analysis FOWT mean, low frequency, and wave frequency responses are calculated separately in frequency-domain analyses. The mean responses are calculated by the static equilibrium or mean position. The low frequency motions and set-down associated with offset are calculated in the frequency domain with appropriate consideration of damping effects from wind and current and mooring/cable. The wave frequency responses due to wave radiation/diffraction and wave asymmetry effects are calculated with consideration of wave loads only. Damping effects from wind, current and mooring/cable should be properly modeled. Total motions are obtained by combining the mean, wave frequency and low frequency motions. The air gap is determined based on relative wave elevation and the pitch, roll and set-down of the hull obtained from frequency-domain analyses.
3.3 Time-Domain Analysis Fully coupled, semi-coupled and uncoupled time-domain analyses may be used. In the case of semi-coupled and uncoupled analyses, the applied damping level used in the analyses should be calibrated with fully coupled analysis and/or model testing. Wave surface elevations should be calculated with consideration of the wave radiation/diffraction effects and wave asymmetry effects.

Section 7 Air Gap Analysis
34 ABS GUIDANCE NOTES ON GLOBAL PERFORMANCE ANALYSIS FOR FLOATING OFFSHORE WIND TURBINE INSTALLATIONS . 2014
3.5 Combined Time-Domain and Frequency-Domain Analysis In this method, the wave frequency motions and wave elevation are calculated in the frequency domain with consideration of radiation/ diffraction effects and wave asymmetry effects. The high frequency motions of roll, heave, and pitch for the TLP-type FOWTs may be neglected. The low frequency surge, sway and yaw motions, for Spar-type and semi-submersible-type FOWTs the low frequency pitch, roll and heave motions, and for the TLP-type FOWTs the set-down associated with offset, are calculated in the time domain. The air gap is determined based on relative wave elevation from frequency-domain analyses and the pitch, roll and set-down of the hull obtained from time-domain analyses.
3.7 Other Considerations The dynamic effects and coupling behaviors may not be important for the air gap analysis. As a result, any of the above three methods may be used in both preliminary and final detail designs provided the platform roll, pitch and heave motions are properly calculated. For TLP-type FOWTs, the set-down effect should be considered.
For TLP-type FOWTs, the minimum air gap, also known as the deck clearance, is governed by a combination of an increasing water level and a decreasing deck height. The increasing water level is caused by incident wave elevation, tide, storm surge, and radiation/diffraction effects from the hull. In very steep sea conditions, the diffraction effects could be significant. The decreasing deck elevation is caused by the hull set-down with offset. The hull set-down increases nonlinearly at large offsets, leading to a rapid decrease of the deck clearance with increasing environmental severity. In this case, the correction to the prediction of offset should be made.
Radiated or diffracted waves generally cause local wave impacts on the deck. In some cases, local impacts may need to be accounted for in the design and, as a result, may lead to local structural stiffening, increased weight of the deck, and tendon ringing, which affects the peak loads in the tendons and the porch structure. Increased tendon load responses could also affect the minimum tension, which in turn affects the design pretension.
The deck height could significantly affect the vertical position of the center of gravity and, in turn, the maximum and minimum tendon tensions. The deck elevation also affects the wind load and wind overturning moments. In general, a higher deck contributes adversely to the tendon tensions. On the other hand, if the deck does not have a sufficient air gap, large tendon tension variations could occur when waves strike the deck.

ABS GUIDANCE NOTES ON GLOBAL PERFORMANCE ANALYSIS FOR FLOATING OFFSHORE WIND TURBINE INSTALLATIONS . 2014 35
S e c t i o n 8 : M o o r i n g S t r e n g t h A n a l y s i s
S E C T I O N 8 Mooring Strength Analysis
1 General Mooring strength analyses are performed to predict extreme responses such as line tensions, anchor loads, and hull offsets under the design environment and other external conditions. These extreme global responses are then used to check against allowable values to verify the strength of the system against overloading and the sufficiency of clearance to avoid interference with other structures. The design load conditions and design criteria for stationkeeping systems are given in Chapter 8 of the FOWTI Guide.
The mooring line diameter used in the mooring analysis should be the nominal value (i.e., inclusive of corrosion and wear allowance) when calculating mass, weight and hydrodynamic loads of the mooring line, unless otherwise noted. Installation tolerances of anchor placement and line length should be taken into account in the mooring system design.
Dynamic excitations originating from the floating support structure, including the tower and the hull structure and the RNA, could result in mooring system responses in the following distinct frequency bands:
• Mean responses
• Low frequency responses
• Wave frequency responses
• High frequency responses for the tendons or taut lines
• Vibrations induced by the loads exerted by the tower and the RNA, if applicable.
Responses of the mooring system to mean forces can be predicted by a static model of the mooring system. In general, the responses to low frequency motions can also be predicted by a static model because of the long periods of these motions. The responses to wave and high frequency hull motions and hull vibrations may be predicted by either quasi-static or dynamic analyses. However, the quasi-static analysis method should only be used in preliminary designs. In final detailed designs, dynamic analyses should be employed.
3 Mooring Strength Analysis Methods For the mooring strength analysis the following methods may be used:
• Frequency-domain analyses
• Time-domain analyses
• Combined time-domain and frequency-domain analyses
These methods incorporate different degrees of approximation and are affected by various limitations, and therefore do not necessarily yield consistent results. If verification of the approach selected for the mooring design is required, model test data or an alternative approach of similar reliability should be used.
Because there is no established analytical method for determining FOWT motion responses undergoing VIM, model testing should, in general, be performed if VIM is deemed important in the design. In the case that current loads and VIM are determined to be important, it is usual practice to perform well planned model tests to determine motion amplitudes and drag coefficients for use in mooring designs. Full-scale in-field measurement data may be employed to confirm the scalability of model testing.
In general, time-domain analyses are recommended for the mooring strength analysis. When the effects of high frequency motions and vibrations are expected to be relatively insignificant, frequency-domain analyses may yield satisfactory results and the analysis procedures in this case are similar to those described in API RP 2SK.

Section 8 Mooring Strength Analysis
36 ABS GUIDANCE NOTES ON GLOBAL PERFORMANCE ANALYSIS FOR FLOATING OFFSHORE WIND TURBINE INSTALLATIONS . 2014
3.1 Frequency-Domain Analyses for Spread Mooring Systems When using frequency-domain analyses for the spread mooring system design, the mean position of the hull is first determined from static equilibrium calculations for surge, sway and yaw. The surge, sway and yaw responses to wave and low frequency excitations are then calculated and superimposed to the mean position. The procedure outlined in API RP 2SK may be used.
Where the floating support structure has a small water plane area, alternative procedures incorporating all six DOFs of motion should be used.
To obtain extreme (maximum) values, the combination of different components of the motions and mooring line tensions may follow the approach recommended in API RP 2SK.
3.3 Frequency-Domain Analyses for Single Point Mooring Systems When using frequency-domain analyses for a single point mooring system design, assumptions on the hull's design heading should first be made. The design headings at which the mooring system responses are to be calculated should be determined with consideration of the mean equilibrium heading and low frequency yaw motions. The procedure outlined in API RP 2SK may be used.
3.5 Time-Domain Analyses The following three analysis approaches as defined in Subsection 5/5 may be used for the time-domain mooring strength analysis:
• Fully coupled analysis approach
• Semi-coupled analysis approach
• Uncoupled analysis approach
In general, the fully coupled (integrated) analysis approach is preferred for the following two important advantages:
• Low frequency damping from the hull, mooring lines and cables can be internally generated in the simulation; and
• Coupling between the floating support structure, the turbine RNA and control system, the stationkeeping system, and the cable system can be fully accounted for.
The fully coupled analysis approach should be used with a time-domain mooring analysis tool that is capable of solving the equations of motion for the combined responses of the floating support structure, the turbine RNA and control system, the stationkeeping system, and, if applicable, the cable system.
3.7 Combined Time-Domain and Frequency-Domain Analyses In this approach, the mean and low frequency responses are typically simulated in the time domain to model the nonlinearity of the stiffness of the mooring lines and cables and the nonlinearity of the hull forces due to quadratic terms and yaw angle variations. Constant or variable thruster forces may also be modeled in the time domain. Transient responses resulting from line breaking or thruster failure may be evaluated by specifying the time of failure in the time-domain analysis. Unlike the full time-domain approach, evaluation of low frequency damping cannot be included as part of such simulations because of the absence of wave frequency components. Damping will need to be evaluated separately and treated as an input parameter.
Wave frequency hull motions are calculated separately in the frequency domain using the hull’s motion RAOs and a given wave spectrum. These wave frequency motions may be combined with the low frequency motions in two ways:
• Method 1: The frequency-domain solution of wave frequency hull motions is first transformed to a time history, which is then superimposed to the mean and low frequency hull displacement time histories to obtain the combined hull displacement. In this process, the seed values for generating the wave frequency and low frequency time histories should be the same.
• Method 2: The mean and low frequency motion time histories are statistically analyzed to determine the peak values, which are then combined with the peak values of the wave frequency motions to calculate the maximum hull offset, as described in API RP 2SK.

Section 8 Mooring Strength Analysis
ABS GUIDANCE NOTES ON GLOBAL PERFORMANCE ANALYSIS FOR FLOATING OFFSHORE WIND TURBINE INSTALLATIONS . 2014 37
3.9 Maximum and Minimum Tendon Tensions For the TLP-type FOWTs, the tendon tension can be calculated either in the frequency domain or the time domain. In addition to wind, wave and current loads, tidal effects, and weight variations, the calculation of maximum and minimum tendon tensions should also account for the effect of foundation mis-positioning, individual tendon load sharing differential and tendon VIV. Reference is made to API RP 2T for further guidance. A time-domain fully coupled (integrated) analysis should be used to calculate maximum and minimum tendon tensions.
5 Suggested Time-Domain Analysis Procedure A suggested procedure for FOWT global performance analyses in the time domain is outlined below:
i) Determine environmental criteria relevant to the global performance analysis of a specific FOWT stationkeeping system (see Chapter 8, Section 2 of the ABS FOWTI Guide)
ii) Determine the external electrical network conditions
iii) Identify the mooring pattern, the characteristics of chain, wire and fiber rope to be deployed, and the initial tension
iv) Define corrosion and wear allowance of the chain and wire rope used in analysis
v) Determine the tower dimensions, properties, modal shapes, and wind force coefficients
vi) Define the RNA and control system configuration and create the models to be used in the simulation
vii) Identify the start-up and shut-down procedures and the associated settings of turbine RNA and control system
viii) Identify the fault conditions in the RNA and control system
ix) Define the hull structure’s wind and current force coefficients, and create the hydrodynamic model of the FOWT system including the hull, stationkeeping system and, if necessary, electrical cables
x) Perform time-domain simulations for the expected storm duration using a time-domain mooring analysis program and applying different seed values for generating the wave and wind time histories.
xi) Perform statistical analyses to establish expected extreme values of hull offset, line tension, anchor loads, and grounded line length.
xii) Check the extreme hull offset, line tension, anchor load, and grounded line length from step xi) against the design criteria (see Subsections 8/7, 8/9 and 8/11).
7 Design Checks Extreme line tension values should be checked against the design criteria in 8-3/Table 1 and 8-4/3 of the FOWTI Guide. Minimum breaking strength of the chain should be determined based on the diameter excluding the corrosion and wear allowance.
For the TLP-type FOWT, minimum tendon tension should be checked against the design criteria in 8-3/3 of the FOWTI Guide.
9 Line Length and Geometry Constraints Depending on the type of mooring system, the type of anchors and the mooring line material, a number of line length and geometry parameters should be evaluated and assessed for compliance with design criteria.
For catenary moorings with drag anchors not specifically designed to withstand uplift forces, the minimum length of each grounded line (i.e., the mooring line segment always resting on the sea floor) should be computed and compared with a design criterion to be prescribed on a site-specific basis.
For anchors designed to withstand uplift forces, compliance with appropriate design criteria applicable to that specific type of anchor should be verified.
Section 8 Mooring Strength Analysis
38 ABS GUIDANCE NOTES ON GLOBAL PERFORMANCE ANALYSIS FOR FLOATING OFFSHORE WIND TURBINE INSTALLATIONS . 2014
For some types of mooring line, the grounded line is highly undesirable and, therefore, the portion of the line closest to the anchor is typically replaced by a chain. In such cases, the minimum elevation of the line-to-chain connection should be computed and verified against a minimum elevation criterion prescribed on a site-specific basis.
For some types of mooring lines, exposure to the splash zone or to friction against the fairleads is undesirable and, therefore, the upper portion of the line is typically replaced by a chain. In such cases, the position of the upper termination should be evaluated and compared with a minimum depth criterion prescribed on a site-specific basis.
For the mooring lines in proximity to other underwater and surface installations, additional clearance requirements and geometric constraints may apply. In such cases, displacements at particular points of concern should be verified against applicable design criteria or be prescribed on a site-specific basis.
Guidance on line length and geometry constraints for fiber rope mooring lines can be found in the ABS Guidance Notes on the Application of Fiber Rope for Offshore Mooring.
11 Anchor Forces The highest mooring line tension obtained from the mooring analysis should in general be used to predict the maximum anchor force. Additional considerations should also be given to the case where a smaller mooring line tension acts in a less favorable direction. The results should be verified against the design criteria in 8-5/Table 2 of the FOWTI Guide, as applicable.

ABS GUIDANCE NOTES ON GLOBAL PERFORMANCE ANALYSIS FOR FLOATING OFFSHORE WIND TURBINE INSTALLATIONS . 2014 39
S e c t i o n 9 : M o o r i n g F a t i g u e A n a l y s i s
S E C T I O N 9 Mooring Fatigue Analysis
1 General Typical mooring fatigue analysis procedures are presented below. Alternative procedures may be used, provided they can be demonstrated to achieve at least the same level of reliability to those presented herein.
Miner’s Rule can be used to determine accumulated fatigue damage. For main components of the mooring lines (i.e., chain, wire rope and connecting links), Miner’s Rule may be implemented in terms of tension range (the T-N curve approach) as described below, or stress range (the S-N curve approach). For other structural components of the stationkeeping system, such as anchor pile details and attachments, the S-N approach is normally used.
T-N curves for chain and wire rope can be found in API RP 2SK. Special considerations of fiber rope fatigue analysis can be found in the ABS Guidance Notes on the Application of Fiber Rope for Offshore Mooring.
In addition to the tension-tension induced fatigue, the tension-bending induced fatigue for chain and wire rope should be properly considered according to recognized industry criteria such as API RP 2SK.
As indicated in 8-3/3 of the ABS FOWTI Guide, corrosion and wear should be suitably considered in the fatigue analysis. The general guidance is given in Subsection 9/3 of these Guidance Notes.
In the mooring fatigue analysis, due consideration should be given to the following aspects:
• Dynamic wind effects
• Dynamic wave effects
• Hull VIM, if applicable
• Mooring line/tendon VIV, if applicable
• Transient effects due to the start-up and shut-down of the RNA
• Coupling effects among the subsystems of the FOWT
• Number of RNA start-ups and shut-downs in the FOWT design life
• Duration of each operation such as installation, start-up, power production, shut-down, parked, etc. that contributes to the mooring fatigue damage
Either time- or frequency-domain dynamic analysis approaches may be applied for mooring tension range predictions. It is suggested that time-domain coupled analyses along with rain-flow counting method be used in the mooring fatigue analysis. Alternatively, mooring tension ranges may be obtained from model testing.
In general, quasi-static analyses should not be used to calculate tension ranges due to its deficiency in estimating wave frequency mooring tensions.
Guideline for the mooring fatigue analysis can be found in API RP 2SK and API RP 2T. Appendix H of API RP 2SK and API RP 2T provide guidance on the hull VIM induced mooring fatigue.

Section 9 Mooring Fatigue Analysis
40 ABS GUIDANCE NOTES ON GLOBAL PERFORMANCE ANALYSIS FOR FLOATING OFFSHORE WIND TURBINE INSTALLATIONS . 2014
3 T-N Curve The fatigue life of a mooring line component is calculated by comparing the long-term cyclic loading in that component with its resistance to fatigue damage. For mooring systems, the T-N curve approach is commonly used to determine the number of cycles to failure for a specific mooring component as a function of constant normalized tension range. The T-N curve for a specific type of mooring component is established based on experimental results.
The equation for a representative T-N curve is:
N⋅Tm = K
where
N = number of permissible cycles of tension range ratio, T
T = ratio of tension range (double amplitude) to the reference breaking strength of the component (see the guidance given below)
m = inverse slope of the T-N fatigue curve
K = constant coefficient or mean load dependent coefficient
When determining the reference breaking strength of the mooring chain or connecting links, the diameter for different periods of service life can be established if the corrosion and wear rate can be predicted. If the corrosion and wear rate is uncertain, a conservative approach using the nominal diameter minus the corrosion and wear allowance should be considered for the fatigue analysis. The reference breaking strength for a wire rope should be its minimum breaking strength (MBS).
5 Accumulated Fatigue Damage The total annual fatigue damage is the sum of the fatigue damage arising in a set of design states chosen to discretize the long-term environmental and operational conditions that the mooring system is subjected to:
D = ∑=
=
ki
iiD
1
where
Di = annual fatigue damage of the component in the design state i
The Miner’s Rule should be used to calculate the annual cumulative fatigue damage ratio Di:
Di = ∑j
j
Nn
where
nj = number of tension cycles within the tension range interval j encountered in the design state i per year
Nj = number of cycles to failure under the normalized tension range j per year as determined by the T-N curve
The discretization into i =1,…,k design states should have a sufficient resolution to avoid any significant error due to the discretization. Each design state is defined in terms of the wind, wave, and current parameters and directions as well as the RNA operating condition required to compute the mooring system responses. The probability of occurrence, Pi, should be determined for each design state. The calculated fatigue life of the mooring system is:
L = 1/D (years)

Section 9 Mooring Fatigue Analysis
ABS GUIDANCE NOTES ON GLOBAL PERFORMANCE ANALYSIS FOR FLOATING OFFSHORE WIND TURBINE INSTALLATIONS . 2014 41
The annual fatigue damage accumulated in each individual design state can be computed as:
Di = [ ]mi
i REKn
where
ni = number of tension cycles encountered in the design state i per year
[ ]miRE = expected value of the normalized tension range Ri raised to the power of m in the
design state i per year
m and K are defined in Subsection 9/3.
The number of tension cycles per year in each design state is:
ni = viTi = viPi ⋅ 3.15576 × 10⁷
where
vi = zero up-crossing frequency of the tension spectrum in the design state i, in Hz
Ti = time (portion of years) spent in the design state i per year
Pi = probability of occurrence of the design state i
The effects of pretension and environmental loads due to wind, wave and current as well as the RNA operating conditions should be considered when determining the normalized tension ranges. Total fatigue damage should be calculated with consideration of the fatigue damage from various fatigue load cases as described in Chapter 5, Section 2 of the FOWTI Guide. When suitably qualified, previously used mooring components are considered for re-use, fatigue damage from previous operations should be taken into account.
7 Time-Domain Fatigue Analysis Method The tension ranges are obtained from time series as the results of time-domain dynamic analyses. The number of cycles should be obtained based on the rain-flow counting method.
9 Frequency-Domain Fatigue Analysis Method The frequency-domain dynamic analysis method may be used in the fatigue analysis provided the nonlinear effects are properly linearized. For further guidance on fatigue analyses in the frequency domain, refer to API RP 2SK and API RP 2T.
11 Tendon Fatigue Analysis Either the S-N-curve-based fatigue analysis approach or the fracture mechanics analysis method can be used for tendon fatigue analysis. Total fatigue damage should be calculated by considering the fatigue damage from various fatigue load cases as presented in Chapter 5, Section 2 of the FOWTI Guide.
In addition to the conventional fatigue life calculation using a set of design states based on discretized long-term environmental conditions and the turbine’s operational conditions, the tendon components should demonstrate robustness against low-cycle, high-stress fatigue due to more prolonged events that exceed the probabilistic predictions.
In order to assure a minimum level of robustness, tendon fatigue damage should be assessed for all components considering a single event based on the 50-year return extreme storm, including the ramp-up and ramp down before and after the storm. The duration to consider should be determined by the designer based on the data available and the response characteristics of the components. The unfactored damage accumulated during this event should be no more than 0.02.
Other 50-year return period events that may induce substantial tendon fatigue, such as the Loop Currents in the Gulf of Mexico, should also be considered in the same manner.

Section 9 Mooring Fatigue Analysis
42 ABS GUIDANCE NOTES ON GLOBAL PERFORMANCE ANALYSIS FOR FLOATING OFFSHORE WIND TURBINE INSTALLATIONS . 2014
Damage calculated for single event fatigue should not be added to the damage predicted in the long-term scatter-diagram-based fatigue analysis, nor compared to the associated safety factors. The intent, as a robustness check, is to screen for components that may incur excessive fatigue damage in prolonged extreme environmental conditions.
Fatigue analysis for tendon components should consider local load effects in addition to global loads. Reference is made to API RP 2T for more details for tendon fatigue analysis.
13 Fatigue Design Checks The calculated fatigue life, which is 1/D, should be greater than the design life multiplied by a fatigue design factor (FDF) defined in 8-3/Table 2 and 8-4/3 of the FOWTI Guide.

ABS GUIDANCE NOTES ON GLOBAL PERFORMANCE ANALYSIS FOR FLOATING OFFSHORE WIND TURBINE INSTALLATIONS . 2014 43
S e c t i o n 1 0 : S u g g e s t i o n s f o r N u m e r i c a l S i m u l a t i o n s
S E C T I O N 10 Suggestions for Numerical Simulations
1 General In numerical simulations of global performance analyses, appropriate settings of the following parameters are crucial in order to obtain reliable results:
• Time step
• Transient time or ramp time
• Grid size and range for wind field data generation
• Number of wave components for generating random waves
• For the deterministic events, the onset time of the events
• For the stochastic events, the number of simulations with different random seeds and the time duration of each simulation
• For fatigue sea states, the discretization of fatigue bins
• Setting of the control system, generator, blade pitch, nacelle yaw, rotor azimuth angle, rotor speed and degrees-of-freedoms for drive train, tower and blade flexibilities for different turbine operating or parked conditions
• Parameters for the aerodynamic load calculation, especially the tower shadow model and the static or dynamic stall models
• Wind average speed, turbulence intensity, wind shear for different wind models used in the wind field data generation
Convergence test should be performed to determine:
• time steps in time-domain simulations;
• grid size and range for wind field; and
• number of wind, wave components and seed numbers.
Sensitivity analysis may be performed to determine the discretization of the fatigue bins.
For load cases involving start-up and shut-down of the RNA, analysis procedure should be consistent with the actual operational procedure of the RNA.
3 Time Step Choice of time step is crucial for the stability and accuracy of time-domain solution, and is often dependent on the periods of the responses, degree of nonlinearity, and analysis formulation. Time step should be determined by a sensitivity check.
5 Initial Transient Response The length of a time-domain simulation must allow for transient responses during the initial part of the simulation. The time required for dissipating transient responses is normally a function of the period and damping of the response.

Section 10 Suggestions for Numerical Simulations
44 ABS GUIDANCE NOTES ON GLOBAL PERFORMANCE ANALYSIS FOR FLOATING OFFSHORE WIND TURBINE INSTALLATIONS . 2014
Since initial conditions used for the dynamic analysis could affect the statistics of the response during the starting part of the simulation time duration, the first 5 seconds to 10 minutes (or longer, if necessary, depending on the period and damping of the response) of time history data should be discarded when stochastic wind and/or wave are applied.
7 Wind Generation and Grid Size 10-minute, 1-hour or 3-hour simulation time duration may be used in numerical simulations for the different design load cases (DLCs) and survival load cases (SLCs) (see 10/13). Since statistical values of wind conditions for wind turbine design are normally based on 10-minute averaging time duration, input wind conditions should be adjusted for 1-hour and 3-hour numerical simulations in order to achieve statistical equivalence. In the absence of site-specific data for the wind conditions with an averaging time duration other than 10 minutes, Section 10, Table 1 may be used to calculate the mean wind speed and turbulence intensity at hub height for 1-hour and 3-hour simulations by adjusting the 10-mintue wind conditions at hub height.
TABLE 1 Adjustment of Wind Conditions with Different Averaging Time Durations
Simulation Time Duration 10 minutes 1 hour 3 hours Adjustment factor applied to the 10-minute mean wind speed 1.00 0.95 0.90
Adjustment applied to the 10-minute turbulence intensity (σ10min) 1.00 σ10min + 0.2m/s Case-by-case
Notes: 1 Adjustments are applied to the hub height wind conditions.
2 Adjustment for the turbulence intensity is valid for the wind spectra recommended in IEC 61400-3 (2009). For the API (NPD) wind spectrum, see the guidance provided in this Subsection.
3 For 3-hour simulations, additional guidance is provided in this Subsection.
When using the IEC-recommended wind spectrum to perform a 3-hour simulation, the following methods may be used to generate wind field data:
• Method 1: Use 1-hour mean wind speed and turbulence intensity to generate time series of a turbulent wind field for 3 hours
• Method 2: Use 3-hour mean wind speed and adjust the turbulence intensity (or use site measurement data) to generate time series of turbulent wind field for 3 hours such that the resultant maximum wind loads or load effects match those obtained using either 10-minute or 1-hour simulations.
The adjustment relative to the 10-minute turbulence intensity, as shown in Section 10, Table 1, is applicable to the wind spectra recommended in IEC 61400-3 (2009). When the API (NPD) wind spectrum is used (see 4-2/3.5 of the ABS FOWTI Guide), the adjustment factor of the 1-hour average wind speed relative to 10-minute average wind speed still applies, but the turbulence intensity is a function of the 1-hour wind speed and is embedded in the wind spectrum formulation. When the API wind spectrum is used in 3-hour simulations, the mean wind speed and turbulence intensity may be taken the same as those used in 1-hour simulations.
The wind generation should consider the 3D effects. Sensitivity analysis may be required to determine an appropriate grid size of the 3D wind field.
9 Simulation of Wave Conditions 10-minute, 1-hour or 3-hour simulation time duration may be used in numerical simulations for the different design load cases (DLCs) and survival load cases (SLCs) (see Subsection 10/13). Since statistical values of wave conditions are normally based on 3-hour time window, input wave conditions should be adjusted for 10-minute and 1-hour numerical simulations in order to achieve statistical equivalence. In the absence of site-specific data, the adjustment factors of 10-minute and 1-hour significant wave height relative to 3-hour wave conditions may follow Section 10, Table 2.

Section 10 Suggestions for Numerical Simulations
ABS GUIDANCE NOTES ON GLOBAL PERFORMANCE ANALYSIS FOR FLOATING OFFSHORE WIND TURBINE INSTALLATIONS . 2014 45
TABLE 2 Adjustment of the Significant Wave Height
Simulation Time Duration 10 minutes 1 hour 3 hours
Adjustment factor applied to the significant wave height Hs
1.00 (for simulations using the constrained wave method; or otherwise 18 simulations with
different random seeds)
1.09 1.0
For 10-minute simulations, the wave height is not factored. In order to obtain the same level of extreme value as a 3-hour simulation, 18 simulations (a total of 3 hours long) with different random seeds should be performed and maximum wave height should be taken as the maximum of the 18 simulations. If the constrained wave method is used, the number of random seeds may be reduced. The applicability of the constrained wave method should be verified with 3-hour simulations. The advantage of using 10-mintue simulations is that wind conditions do not need the adjustment.
The number and range of discrete frequencies representing the hull transfer functions should be carefully chosen to cover the peaks in the transfer functions and the area of significant wave excitations. It is also important to identify how the employed computer program handles possible excitations outside the frequency range of the hull transfer functions since this can be a source of error. Small frequency spacing may be required to avoid repeating a time history within one simulation. Variable frequency spacing may also be used, but the repetition period of a time history is more difficult to assess. The number, range, and spacing of discrete frequencies should be determined and verified by sensitivity analyses.
11 Flexibility of RNA and Tower For the tower, rotor blades and drive train, the mass distribution, stiffness, natural frequencies and damping used for the calculation should be specified. In general, the DOFs of the tower, rotor blades, and drive train should be modeled in accordance with Section 10, Table 3, as a minimum.
The stability analysis normally is performed in the design of the RNA. This stability analysis should be used to assist in determining the modes that are important to the load calculations in global performance analyses.
TABLE 3 Suggested Minimum DOFs for Modeling Flexibility of the RNA and the Tower
Components DOFs
Tower 1st and 2nd fore-aft and side-to-side bending modes If necessary, 1st torsional mode should be included.
Each Blade 1st edge-wise, 1st and 2nd flap-wise modes
If necessary, torsional modes should be included. Drive train 1st torsional mode
13 Simulation Length and Number of Random Seeds For the design of floating offshore oil and gas platforms, 3-hour duration is often used for model testing and time-domain global performance analyses. This duration is generally sufficient for calculating standard deviations of wave frequency responses because it represents approximately 1,000 cycles of those responses having a natural period of around 10 seconds. Low frequency responses of floating systems, however, typically have natural periods on the order of several minutes. A 3-hour simulation may contain less than 50 cycles of a low frequency response and therefore is insufficient to provide good statistical confidence for the calculated standard deviation. The required simulation time duration may even be longer for predicting extreme values of responses. In order to obtain statistically meaningful wave frequency extreme responses, for instance, several 3-hour simulations may be needed.

Section 10 Suggestions for Numerical Simulations
46 ABS GUIDANCE NOTES ON GLOBAL PERFORMANCE ANALYSIS FOR FLOATING OFFSHORE WIND TURBINE INSTALLATIONS . 2014
An acceptable length of global performance simulation time duration depends on many factors, such as natural periods of wave frequency and low frequency responses, contribution of wave frequency and low frequency responses to the total response, degree of nonlinearity, system damping, etc. The simulation time duration should be determined and verified by sensitivity check. Recent studies indicate that, for typical floating oil and gas platforms in deep water, five to ten 3-hour simulations with different random seed numbers (equivalent to a continuous 15 to 30 hours simulation) may be needed in order to obtain standard deviations and extreme values of responses with good confidence.
For the design load cases (DLCs) and survival load cases (SLCs) defined in Chapter 5, Section 2 of the FOWTI Guide, time histories of turbulent wind and irregular wave conditions should be long enough to ensure statistical reliability of the estimate of the characteristic responses. In general, at least eighteen 10-minute stochastic realizations (or a continuous 3-hour realization) should be generated for each turbulent wind condition and sea state considered in the simulations. Additional guidance is given below:
• For the DLC 1.2, 1.3, 1.4, 1.5, 2.x, 3.x, 4.x, 5.1, as defined in 5-2/Table 1 of the FOWTI Guide, at least one set of eighteen 10-minute stochastic realizations should be generated for each wind condition and sea state considered in the simulations. Three to six sets of eighteen 10-minute simulations are recommended for the DLC 1.4, 1.5, 2.1, 2.2, 2.3, 3.2, 3.3, 4.2, 4.3 and 5.1 when the RNA involves a transiet event. Fewer realizations may be used if it can be demonstrated that the estimated extreme response is not less than that obtained using 3-hour realizations or a total of 3 hours of realizations.
• For the DLC 1.6, 6.1, 6.2, 6.3 and 7.1 and the SLCs, as defined in 5-2/Table 1 and 5-2/Table 2 of the FOWTI Guide, at least six 1-hour stochastic realizations should be generated for each turbulent wind and sea state considered in the simulations. Six 3-hour simulations are recommended for the DLC 6.1, 6.2, 6.3 and 7.1 and the SLCs when the RNA is in the parked conditions. Realizations with a shorter simulation time duration may be assumed if it can be demonstrated that the estimated extreme response is not less than that obtained using 1-hour or 3-hour realizations.
The values of mean wind speed, turbulence standard deviation and significant wave height referenced in the DLCs and the SLCs requiring dynamic simulations should be appropriate to the chosen simulation time duration. More specifically:
• For the DLC 1.6, 6.1, 6.2, 6.3 and 7.1 and the SLCs, as defined in 5-2/Table 1 and 5-2/Table 2 of the FOWTI Guide, the values of mean wind speed, turbulence standard deviation and significant wave height should be adjusted for different simulation time durations in accordance with Subsections 10/7 and 10/9 of these Guidance Notes.
• For the load cases using 10-minute simulations, at least 18 simulations (a total of 3 hours) should in general be performed. No adjustment is needed provided the wind conditions are based on a 10-mintue averaging time duration.
The suggested simulation time duration and number of random seeds for each DLC are summarized in Section 10, Table 4. The suggested values for the DLC 6.1 may also be applied to the SLCs. The extreme statistical values for different load cases may be obtained as follows:
• For the DLC 1.4, 1.5, 2.3, 3.2, 3.3, 4.2 and 4.3 with the occurrence of events such as the extreme wind gust, extreme wind shear, severe sea state, etc., the maximum value of a response should be determined based on the transient value in each set of 18 10-minute simulations computed randomly in the worst case. The occurrence of the event can be at any moment during the simulation. For multiple sets of simulations, the maximum value of a response should be determined based on the average of the maximum responses of each set of simulations.
• For the DLC 1.3 with the turbulent wind together with irregular sea states, among all combinations of wind and wave conditions, the largest mean value of the maximum responses of stochastic realizations should be taken.
• For the DLC 2.1, 2.2 and 5.1 with the turbulent wind together with irregular sea states and with the occurrence of events such as a fault or a shutdown, the maximum value of a response should be determined based on the mean value of the largest half of the maximum responses in each set of 18 10-minute simulations computed randomly in the worst case. The occurrence of the event can be at any moment during the simulation. For multiple sets of simulations, the maximum value of a response should be determined based on the average of the maximum responses of each set of simulations.
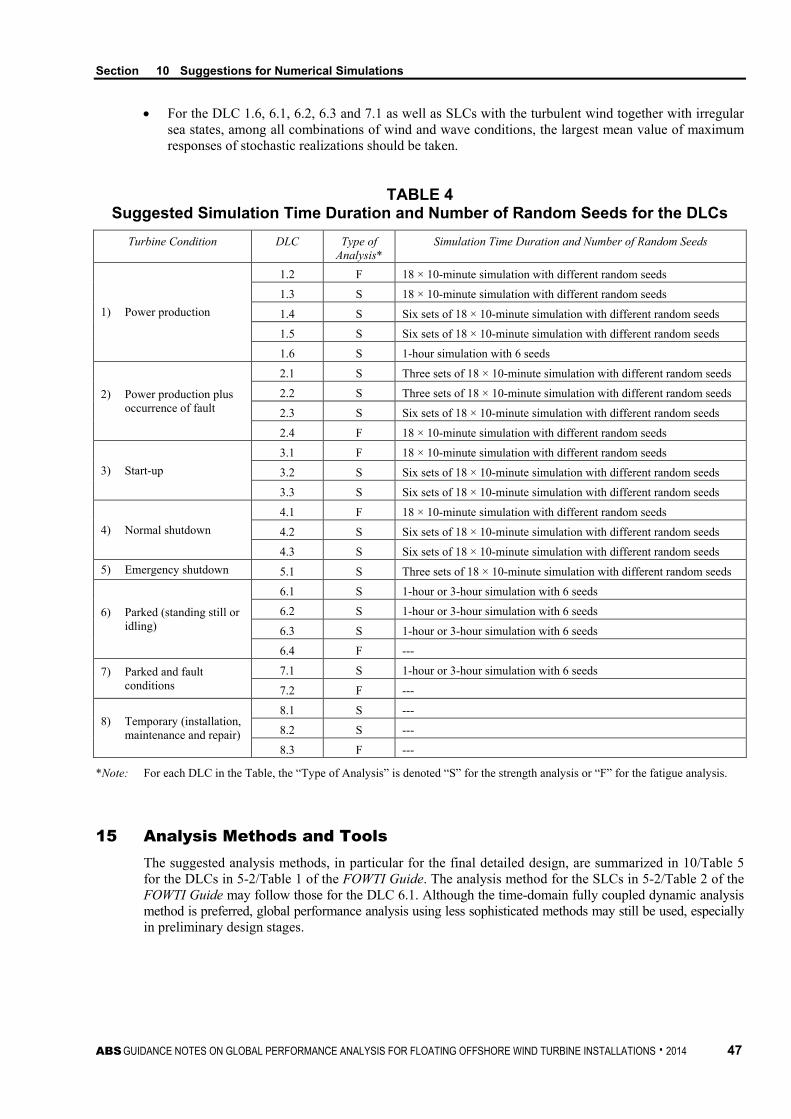
Section 10 Suggestions for Numerical Simulations
ABS GUIDANCE NOTES ON GLOBAL PERFORMANCE ANALYSIS FOR FLOATING OFFSHORE WIND TURBINE INSTALLATIONS . 2014 47
• For the DLC 1.6, 6.1, 6.2, 6.3 and 7.1 as well as SLCs with the turbulent wind together with irregular sea states, among all combinations of wind and wave conditions, the largest mean value of maximum responses of stochastic realizations should be taken.
TABLE 4 Suggested Simulation Time Duration and Number of Random Seeds for the DLCs
Turbine Condition DLC Type of Analysis*
Simulation Time Duration and Number of Random Seeds
1) Power production
1.2 F 18 × 10-minute simulation with different random seeds
1.3 S 18 × 10-minute simulation with different random seeds
1.4 S Six sets of 18 × 10-minute simulation with different random seeds
1.5 S Six sets of 18 × 10-minute simulation with different random seeds
1.6 S 1-hour simulation with 6 seeds
2) Power production plus occurrence of fault
2.1 S Three sets of 18 × 10-minute simulation with different random seeds
2.2 S Three sets of 18 × 10-minute simulation with different random seeds
2.3 S Six sets of 18 × 10-minute simulation with different random seeds
2.4 F 18 × 10-minute simulation with different random seeds
3) Start-up 3.1 F 18 × 10-minute simulation with different random seeds
3.2 S Six sets of 18 × 10-minute simulation with different random seeds
3.3 S Six sets of 18 × 10-minute simulation with different random seeds
4) Normal shutdown 4.1 F 18 × 10-minute simulation with different random seeds
4.2 S Six sets of 18 × 10-minute simulation with different random seeds
4.3 S Six sets of 18 × 10-minute simulation with different random seeds 5) Emergency shutdown 5.1 S Three sets of 18 × 10-minute simulation with different random seeds
6) Parked (standing still or idling)
6.1 S 1-hour or 3-hour simulation with 6 seeds
6.2 S 1-hour or 3-hour simulation with 6 seeds
6.3 S 1-hour or 3-hour simulation with 6 seeds
6.4 F ---
7) Parked and fault conditions
7.1 S 1-hour or 3-hour simulation with 6 seeds
7.2 F ---
8) Temporary (installation, maintenance and repair)
8.1 S ---
8.2 S ---
8.3 F ---
*Note: For each DLC in the Table, the “Type of Analysis” is denoted “S” for the strength analysis or “F” for the fatigue analysis.
15 Analysis Methods and Tools The suggested analysis methods, in particular for the final detailed design, are summarized in 10/Table 5 for the DLCs in 5-2/Table 1 of the FOWTI Guide. The analysis method for the SLCs in 5-2/Table 2 of the FOWTI Guide may follow those for the DLC 6.1. Although the time-domain fully coupled dynamic analysis method is preferred, global performance analysis using less sophisticated methods may still be used, especially in preliminary design stages.
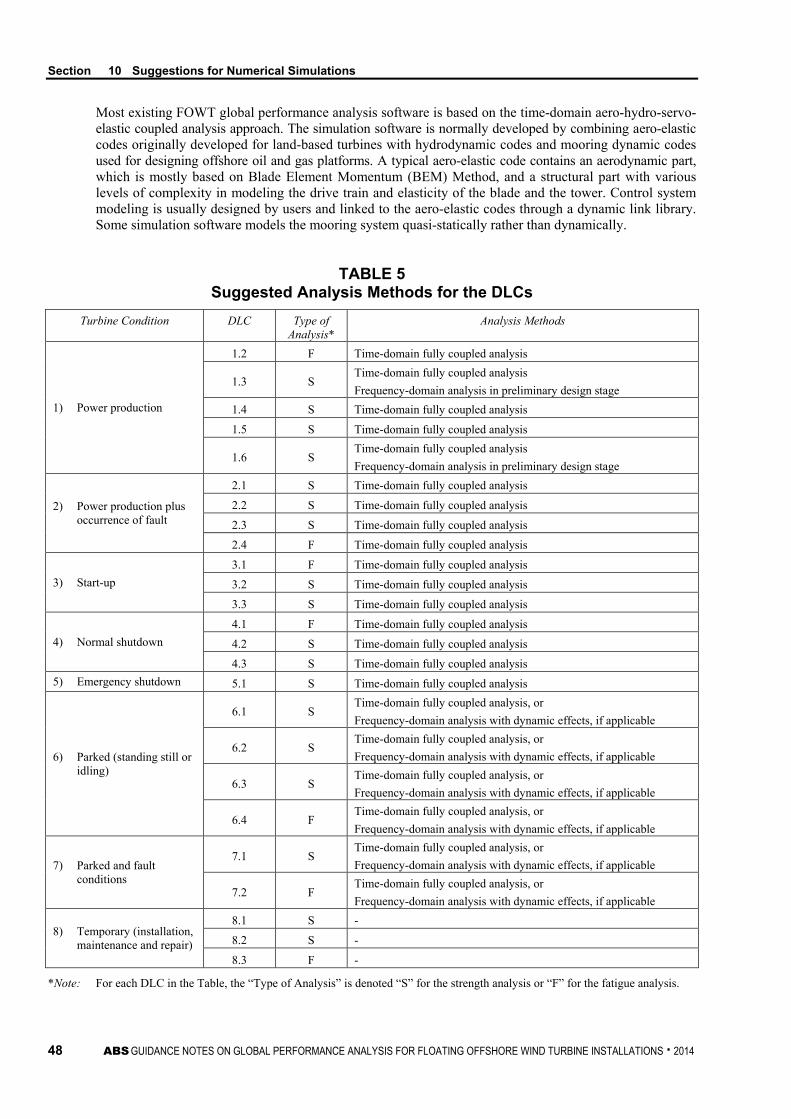
Section 10 Suggestions for Numerical Simulations
48 ABS GUIDANCE NOTES ON GLOBAL PERFORMANCE ANALYSIS FOR FLOATING OFFSHORE WIND TURBINE INSTALLATIONS . 2014
Most existing FOWT global performance analysis software is based on the time-domain aero-hydro-servo-elastic coupled analysis approach. The simulation software is normally developed by combining aero-elastic codes originally developed for land-based turbines with hydrodynamic codes and mooring dynamic codes used for designing offshore oil and gas platforms. A typical aero-elastic code contains an aerodynamic part, which is mostly based on Blade Element Momentum (BEM) Method, and a structural part with various levels of complexity in modeling the drive train and elasticity of the blade and the tower. Control system modeling is usually designed by users and linked to the aero-elastic codes through a dynamic link library. Some simulation software models the mooring system quasi-statically rather than dynamically.
TABLE 5 Suggested Analysis Methods for the DLCs
Turbine Condition DLC Type of Analysis*
Analysis Methods
1) Power production
1.2 F Time-domain fully coupled analysis
1.3 S Time-domain fully coupled analysis Frequency-domain analysis in preliminary design stage
1.4 S Time-domain fully coupled analysis
1.5 S Time-domain fully coupled analysis
1.6 S Time-domain fully coupled analysis Frequency-domain analysis in preliminary design stage
2) Power production plus occurrence of fault
2.1 S Time-domain fully coupled analysis
2.2 S Time-domain fully coupled analysis
2.3 S Time-domain fully coupled analysis
2.4 F Time-domain fully coupled analysis
3) Start-up 3.1 F Time-domain fully coupled analysis
3.2 S Time-domain fully coupled analysis
3.3 S Time-domain fully coupled analysis
4) Normal shutdown 4.1 F Time-domain fully coupled analysis
4.2 S Time-domain fully coupled analysis
4.3 S Time-domain fully coupled analysis 5) Emergency shutdown 5.1 S Time-domain fully coupled analysis
6) Parked (standing still or idling)
6.1 S Time-domain fully coupled analysis, or Frequency-domain analysis with dynamic effects, if applicable
6.2 S Time-domain fully coupled analysis, or Frequency-domain analysis with dynamic effects, if applicable
6.3 S Time-domain fully coupled analysis, or Frequency-domain analysis with dynamic effects, if applicable
6.4 F Time-domain fully coupled analysis, or Frequency-domain analysis with dynamic effects, if applicable
7) Parked and fault conditions
7.1 S Time-domain fully coupled analysis, or Frequency-domain analysis with dynamic effects, if applicable
7.2 F Time-domain fully coupled analysis, or Frequency-domain analysis with dynamic effects, if applicable
8) Temporary (installation, maintenance and repair)
8.1 S -
8.2 S -
8.3 F -
*Note: For each DLC in the Table, the “Type of Analysis” is denoted “S” for the strength analysis or “F” for the fatigue analysis.