guest-guest interactions between small molecules and...
TRANSCRIPT
Guest-Guest Interactions between Small Molecules and THF in Binary Clathrate Hydrates
Tim Strobel CHGN 504
Term Project April 26th, 2006
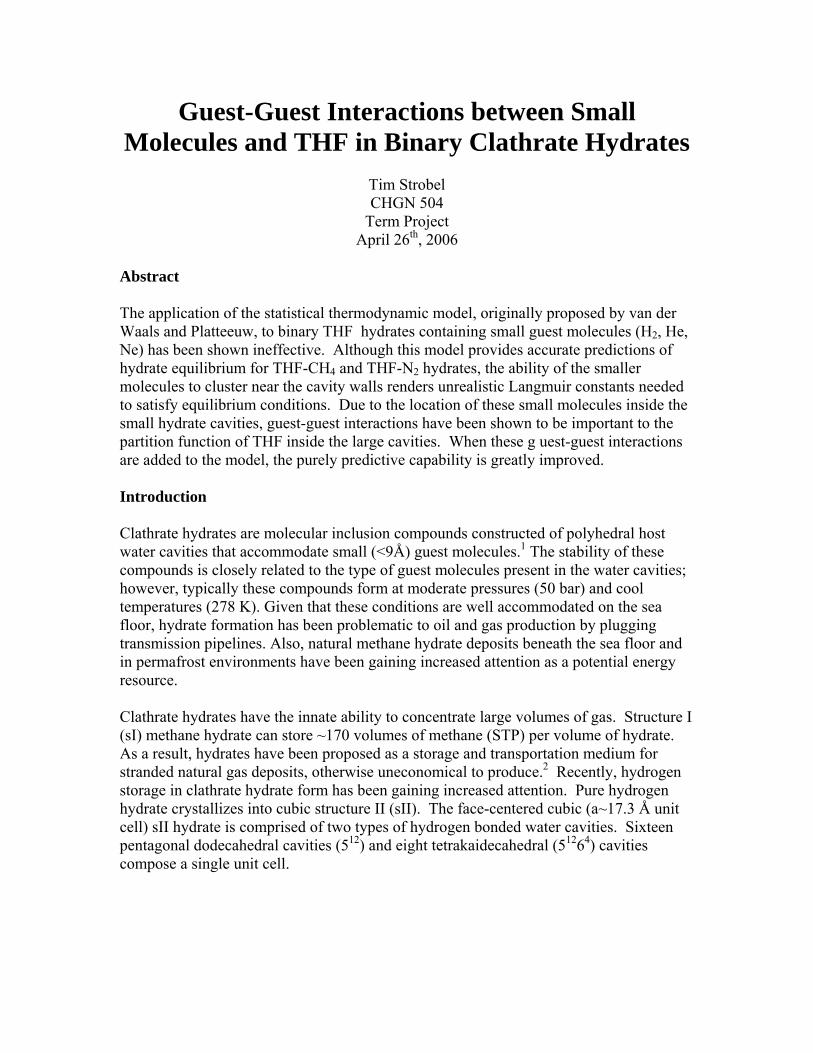
Abstract The application of the statistical thermodynamic model, originally proposed by van der Waals and Platteeuw, to binary THF hydrates containing small guest molecules (H2, He, Ne) has been shown ineffective. Although this model provides accurate predictions of hydrate equilibrium for THF-CH4 and THF-N2 hydrates, the ability of the smaller molecules to cluster near the cavity walls renders unrealistic Langmuir constants needed to satisfy equilibrium conditions. Due to the location of these small molecules inside the small hydrate cavities, guest-guest interactions have been shown to be important to the partition function of THF inside the large cavities. When these g uest-guest interactions are added to the model, the purely predictive capability is greatly improved. Introduction Clathrate hydrates are molecular inclusion compounds constructed of polyhedral host water cavities that accommodate small (<9Å) guest molecules.1 The stability of these compounds is closely related to the type of guest molecules present in the water cavities; however, typically these compounds form at moderate pressures (50 bar) and cool temperatures (278 K). Given that these conditions are well accommodated on the sea floor, hydrate formation has been problematic to oil and gas production by plugging transmission pipelines. Also, natural methane hydrate deposits beneath the sea floor and in permafrost environments have been gaining increased attention as a potential energy resource. Clathrate hydrates have the innate ability to concentrate large volumes of gas. Structure I (sI) methane hydrate can store ~170 volumes of methane (STP) per volume of hydrate. As a result, hydrates have been proposed as a storage and transportation medium for stranded natural gas deposits, otherwise uneconomical to produce.2 Recently, hydrogen storage in clathrate hydrate form has been gaining increased attention. Pure hydrogen hydrate crystallizes into cubic structure II (sII). The face-centered cubic (a~17.3 Å unit cell) sII hydrate is comprised of two types of hydrogen bonded water cavities. Sixteen pentagonal dodecahedral cavities (512) and eight tetrakaidecahedral (51264) cavities compose a single unit cell.
sII
51264512
16/cell 8/cell
136 H2O
sII
51264512
16/cell 8/cell
136 H2O
Figure 1. sII hydrate
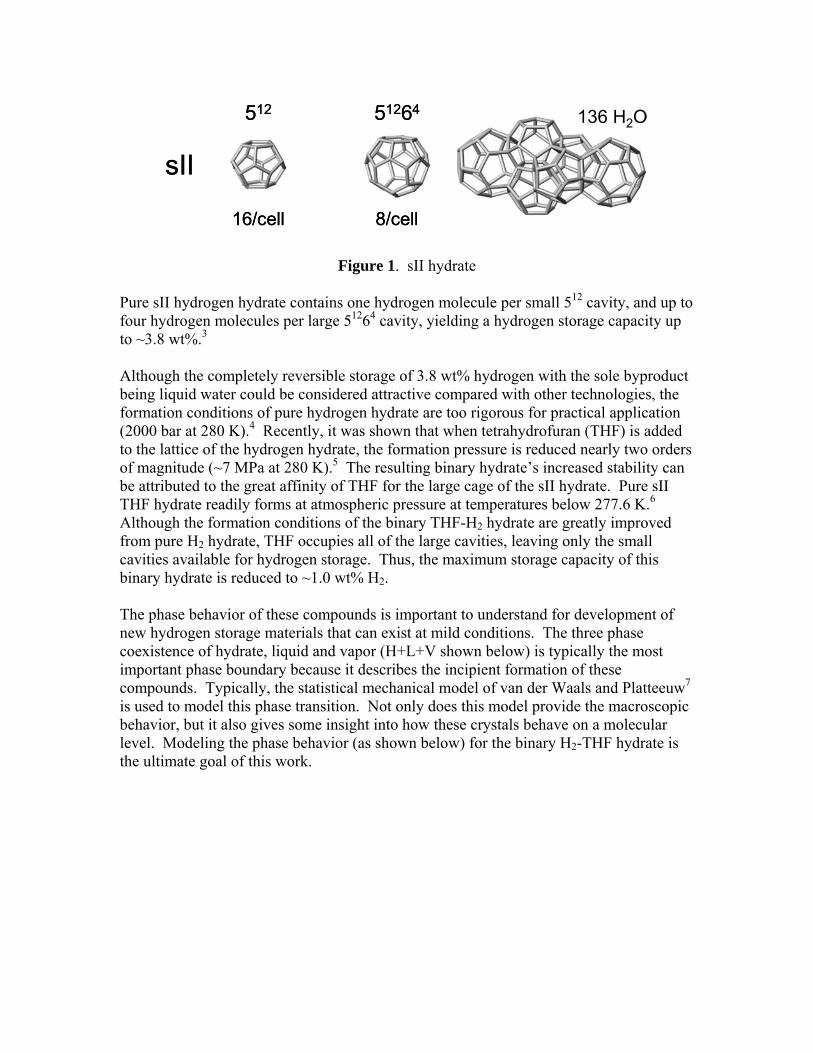
Pure sII hydrogen hydrate contains one hydrogen molecule per small 512 cavity, and up to four hydrogen molecules per large 51264 cavity, yielding a hydrogen storage capacity up to ~3.8 wt%.3 Although the completely reversible storage of 3.8 wt% hydrogen with the sole byproduct being liquid water could be considered attractive compared with other technologies, the formation conditions of pure hydrogen hydrate are too rigorous for practical application (2000 bar at 280 K).4 Recently, it was shown that when tetrahydrofuran (THF) is added to the lattice of the hydrogen hydrate, the formation pressure is reduced nearly two orders of magnitude (~7 MPa at 280 K).5 The resulting binary hydrate’s increased stability can be attributed to the great affinity of THF for the large cage of the sII hydrate. Pure sII THF hydrate readily forms at atmospheric pressure at temperatures below 277.6 K.6 Although the formation conditions of the binary THF-H2 hydrate are greatly improved from pure H2 hydrate, THF occupies all of the large cavities, leaving only the small cavities available for hydrogen storage. Thus, the maximum storage capacity of this binary hydrate is reduced to ~1.0 wt% H2. The phase behavior of these compounds is important to understand for development of new hydrogen storage materials that can exist at mild conditions. The three phase coexistence of hydrate, liquid and vapor (H+L+V shown below) is typically the most important phase boundary because it describes the incipient formation of these compounds. Typically, the statistical mechanical model of van der Waals and Platteeuw7 is used to model this phase transition. Not only does this model provide the macroscopic behavior, but it also gives some insight into how these crystals behave on a molecular level. Modeling the phase behavior (as shown below) for the binary H2-THF hydrate is the ultimate goal of this work.
Experimental dataPrediction
Temperature
Pre
ssur
e
L+V
H+L+V
H+V
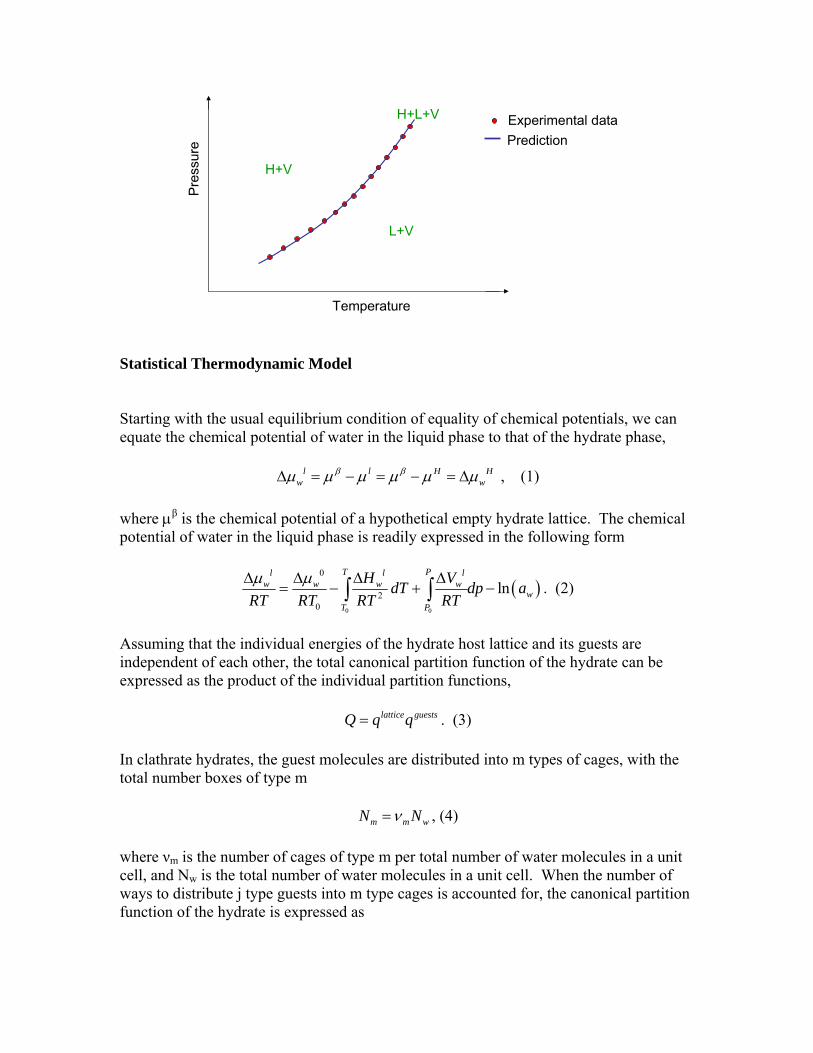
Statistical Thermodynamic Model Starting with the usual equilibrium condition of equality of chemical potentials, we can equate the chemical potential of water in the liquid phase to that of the hydrate phase,
l l H Hw w
β βµ µ µ µ µ µ∆ = − = − = ∆ , (1)
where µβ is the chemical potential of a hypothetical empty hydrate lattice. The chemical potential of water in the liquid phase is readily expressed in the following form
( )0 0
0
20
lnT Pl l l
w w w ww
T P
H VdT dp aRT RT RT RTµ µ∆ ∆ ∆ ∆
= − + −∫ ∫ . (2)
Assuming that the individual energies of the hydrate host lattice and its guests are independent of each other, the total canonical partition function of the hydrate can be expressed as the product of the individual partition functions,
lattice guestsQ q q= . (3)
In clathrate hydrates, the guest molecules are distributed into m types of cages, with the total number boxes of type m
m m wN Nν= , (4)
where νm is the number of cages of type m per total number of water molecules in a unit cell, and Nw is the total number of water molecules in a unit cell. When the number of ways to distribute j type guests into m type cages is accounted for, the canonical partition function of the hydrate is expressed as
,,
, ,
( )!exp( )! !
j mNw m wj m
m jm w j m j mj j
A NQ qkT N N N
β υυ
⎡ ⎤⎛ ⎞− ⎢ ⎥= ⎜ ⎟ ⎢ ⎥−⎝ ⎠ ⎢ ⎥⎣ ⎦
∏ ∏∑ ∏. (5)
With the statistical thermodynamic relationship
expN
NQkTµ⎛ ⎞Ξ = ⎜ ⎟
⎝ ⎠∑ , (6)
and by defining the absolute chemical activity, λ, as
expkTµλ ⎛ ⎞≡ ⎜ ⎟
⎝ ⎠, (7)
the canonical partition function is transformed into the grand canonical partition function
,exp 1m wN
wj m j
jm
A qkT
υβ
λ⎛ ⎞⎛ ⎞−
Ξ = +⎜ ⎟⎜ ⎟⎝ ⎠ ⎝ ⎠
∑∏ . (8)
The chemical potential of water in the hydrate phase is obtained by taking the derivative
, ,
ln
j
Hw
w T VkT N
λ
µ ⎛ ⎞∂ Ξ= −⎜ ⎟∂⎝ ⎠
, (9)
yielding the following expression obtained by van der Waals and Platteeuw in 1959
,ln 1H
wm j m j
m jq
kTµ υ λ
⎛ ⎞∆= +⎜ ⎟
⎝ ⎠∑ ∑ . (10)
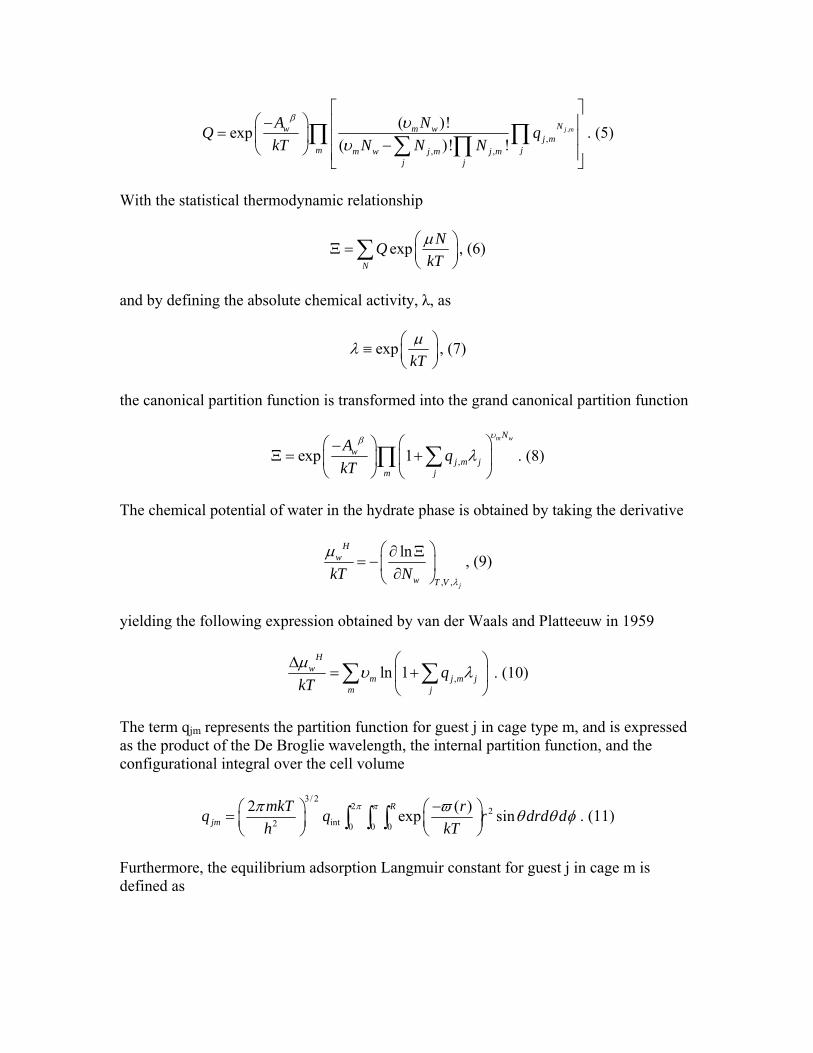
The term qjm represents the partition function for guest j in cage type m, and is expressed as the product of the De Broglie wavelength, the internal partition function, and the configurational integral over the cell volume
3/ 2
2 2int2 0 0 0
2 ( )exp sinR
jmmkT rq q r drd dh kT
π ππ ϖ θ θ φ−⎛ ⎞ ⎛ ⎞= ⎜ ⎟ ⎜ ⎟⎝ ⎠ ⎝ ⎠∫ ∫ ∫ . (11)
Furthermore, the equilibrium adsorption Langmuir constant for guest j in cage m is defined as
32
int22
jmjm
qC
mkTkT qh
π≡
⎛ ⎞⎜ ⎟⎝ ⎠
. (12)
Because most hydrate cages can be approximated as spherical, Equation 11 can be simplified using the spherical cell approximation of Lennard Jones and Devonshire.8 If b is the average distance between nearest neighbors and φ(b) is the mutual potential energy at this distance apart, if one particle is kept fixed while the other is swept about a sphere of radius r, the average potential of the particles is given by
( )1
2 2 2
0
1( ) 2 cos sin2
r r b br dπ
ϕ ϕ θ θ θ⎡ ⎤
= + −⎢ ⎥⎣ ⎦
∫ . (13)
If z is the average number of nearest neighbors, the average potential energy within the cell (r < b) may be written as
( ) ( )r z rω ϕ= . (14)
Performing this spherical averaging on the Kihara potential9
12 6
( ) for r 2a
2 2( ) 4 for r > 2a2 2
r
a arr a r a
ϖ
σ σϖ ε
= ∞ ≤
⎛ ⎞− −⎛ ⎞ ⎛ ⎞= −⎜ ⎟⎜ ⎟ ⎜ ⎟⎜ ⎟− −⎝ ⎠ ⎝ ⎠⎝ ⎠
, (15)
where ε is the maximum attractive potential, σ is the soft core radius, and a is the hard core radius, and combining Equations (11-12) provides a simplified Langmuir constant
2
0
4 ( )exp R
jmrC r dr
kT kTπ ω⎡ ⎤= −⎢ ⎥⎣ ⎦∫ , (16)
where,
12 610 11 4 5
11 5( ) 2 a ar zR r R R r Rσ σω ε δ δ δ δ
⎡ ⎤⎛ ⎞ ⎛ ⎞= + − +⎢ ⎜ ⎟ ⎜ ⎟⎥⎝ ⎠ ⎝ ⎠⎣ ⎦
, (17)
and
1 1 1N N
N r a r aN R R R R
δ− −⎡ ⎤⎛ ⎞ ⎛ ⎞= − − − + −⎢ ⎥⎜ ⎟ ⎜ ⎟
⎝ ⎠ ⎝ ⎠⎢ ⎥⎣ ⎦, (18)
and R is the average cage radius.
For typical single component hydrate phase boundary calculations, Equations 2 and 10 are equated
( )0 0
0
20
ln ln 1T Pl l
w w ww m jm j
m jT P
H VdT dp a C fRT RT RTµ υ
⎛ ⎞∆ ∆ ∆− + − = +⎜ ⎟
⎝ ⎠∑ ∑∫ ∫ , (19)
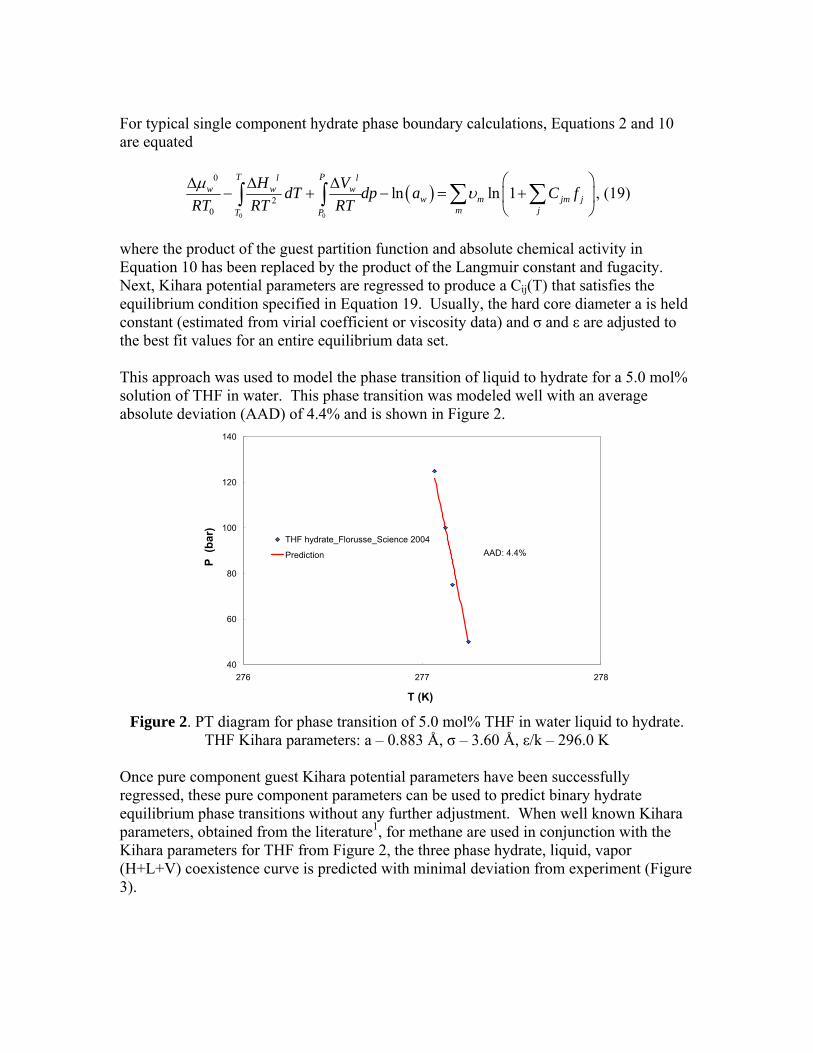
where the product of the guest partition function and absolute chemical activity in Equation 10 has been replaced by the product of the Langmuir constant and fugacity. Next, Kihara potential parameters are regressed to produce a Cij(T) that satisfies the equilibrium condition specified in Equation 19. Usually, the hard core diameter a is held constant (estimated from virial coefficient or viscosity data) and σ and ε are adjusted to the best fit values for an entire equilibrium data set. This approach was used to model the phase transition of liquid to hydrate for a 5.0 mol% solution of THF in water. This phase transition was modeled well with an average absolute deviation (AAD) of 4.4% and is shown in Figure 2.
40
60
80
100
120
140
276 277 278
T (K)
P (b
ar)
THF hydrate_Florusse_Science 2004
Prediction AAD: 4.4%
Figure 2. PT diagram for phase transition of 5.0 mol% THF in water liquid to hydrate.
THF Kihara parameters: a – 0.883 Å, σ – 3.60 Å, ε/k – 296.0 K
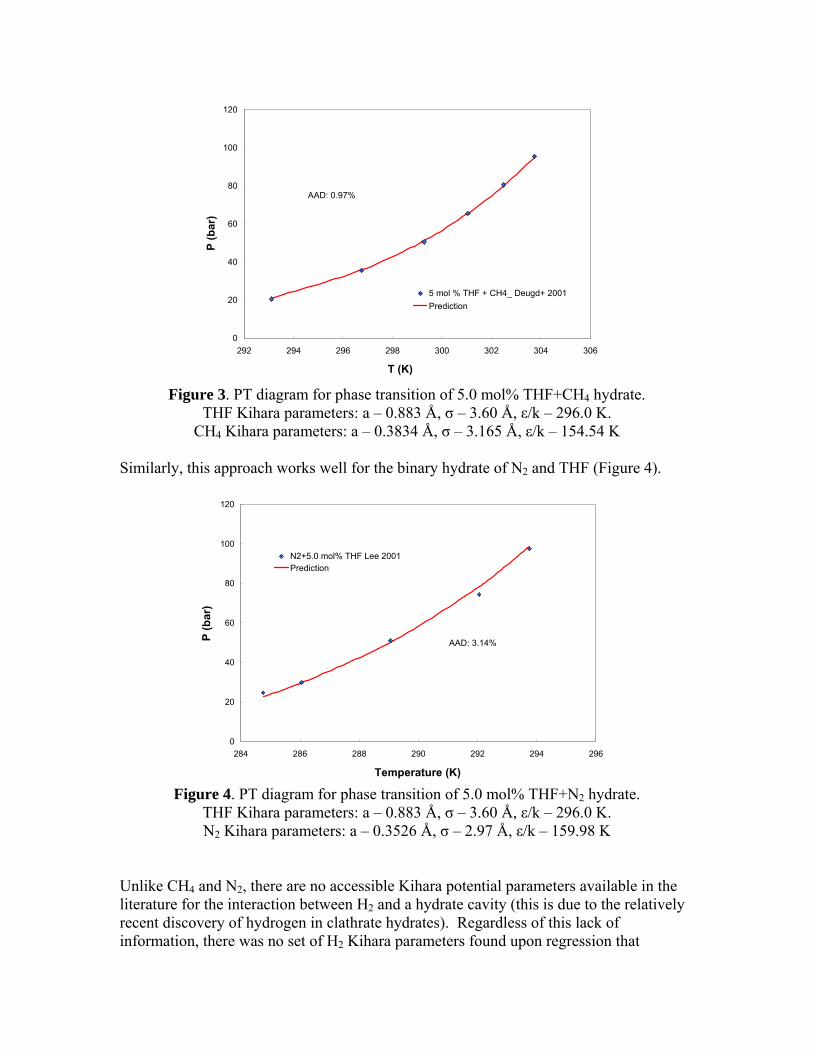
Once pure component guest Kihara potential parameters have been successfully regressed, these pure component parameters can be used to predict binary hydrate equilibrium phase transitions without any further adjustment. When well known Kihara parameters, obtained from the literature1, for methane are used in conjunction with the Kihara parameters for THF from Figure 2, the three phase hydrate, liquid, vapor (H+L+V) coexistence curve is predicted with minimal deviation from experiment (Figure 3).
0
20
40
60
80
100
120
292 294 296 298 300 302 304 306
T (K)
P (b
ar)
5 mol % THF + CH4_ Deugd+ 2001Prediction
AAD: 0.97%
Figure 3. PT diagram for phase transition of 5.0 mol% THF+CH4 hydrate.
THF Kihara parameters: a – 0.883 Å, σ – 3.60 Å, ε/k – 296.0 K. CH4 Kihara parameters: a – 0.3834 Å, σ – 3.165 Å, ε/k – 154.54 K
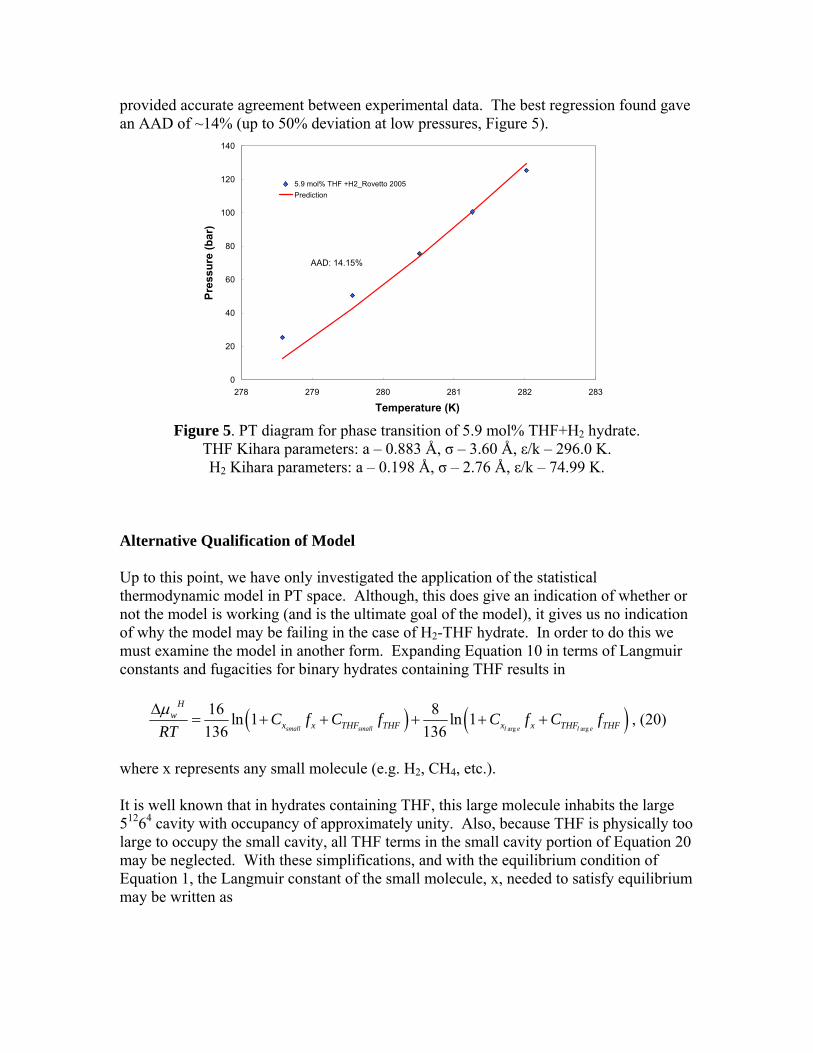
Similarly, this approach works well for the binary hydrate of N2 and THF (Figure 4).
0
20
40
60
80
100
120
284 286 288 290 292 294 296
Temperature (K)
P (b
ar)
N2+5.0 mol% THF Lee 2001Prediction
AAD: 3.14%
Figure 4. PT diagram for phase transition of 5.0 mol% THF+N2 hydrate.
THF Kihara parameters: a – 0.883 Å, σ – 3.60 Å, ε/k – 296.0 K. N2 Kihara parameters: a – 0.3526 Å, σ – 2.97 Å, ε/k – 159.98 K
Unlike CH4 and N2, there are no accessible Kihara potential parameters available in the literature for the interaction between H2 and a hydrate cavity (this is due to the relatively recent discovery of hydrogen in clathrate hydrates). Regardless of this lack of information, there was no set of H2 Kihara parameters found upon regression that
provided accurate agreement between experimental data. The best regression found gave an AAD of ~14% (up to 50% deviation at low pressures, Figure 5).
0
20
40
60
80
100
120
140
278 279 280 281 282 283
Temperature (K)
Pres
sure
(bar
)
5.9 mol% THF +H2_Rovetto 2005Prediction
AAD: 14.15%
Figure 5. PT diagram for phase transition of 5.9 mol% THF+H2 hydrate.
THF Kihara parameters: a – 0.883 Å, σ – 3.60 Å, ε/k – 296.0 K. H2 Kihara parameters: a – 0.198 Å, σ – 2.76 Å, ε/k – 74.99 K.
Alternative Qualification of Model Up to this point, we have only investigated the application of the statistical thermodynamic model in PT space. Although, this does give an indication of whether or not the model is working (and is the ultimate goal of the model), it gives us no indication of why the model may be failing in the case of H2-THF hydrate. In order to do this we must examine the model in another form. Expanding Equation 10 in terms of Langmuir constants and fugacities for binary hydrates containing THF results in
( ) ( )arg arg
16 8ln 1 ln 1136 136small small l e l e
Hw
x x THF THF x x THF THFC f C f C f C fRTµ∆
= + + + + + , (20)
where x represents any small molecule (e.g. H2, CH4, etc.). It is well known that in hydrates containing THF, this large molecule inhabits the large 51264 cavity with occupancy of approximately unity. Also, because THF is physically too large to occupy the small cavity, all THF terms in the small cavity portion of Equation 20 may be neglected. With these simplifications, and with the equilibrium condition of Equation 1, the Langmuir constant of the small molecule, x, needed to satisfy equilibrium may be written as
( )arg
136 8exp ln 1 116 136 l e
small
lw
THF THF
xx
C fRT
Cf
µ⎧ ⎫⎡ ⎤∆⎪ ⎪− + −⎨ ⎬⎢ ⎥⎪ ⎪⎣ ⎦⎩ ⎭= . (21)
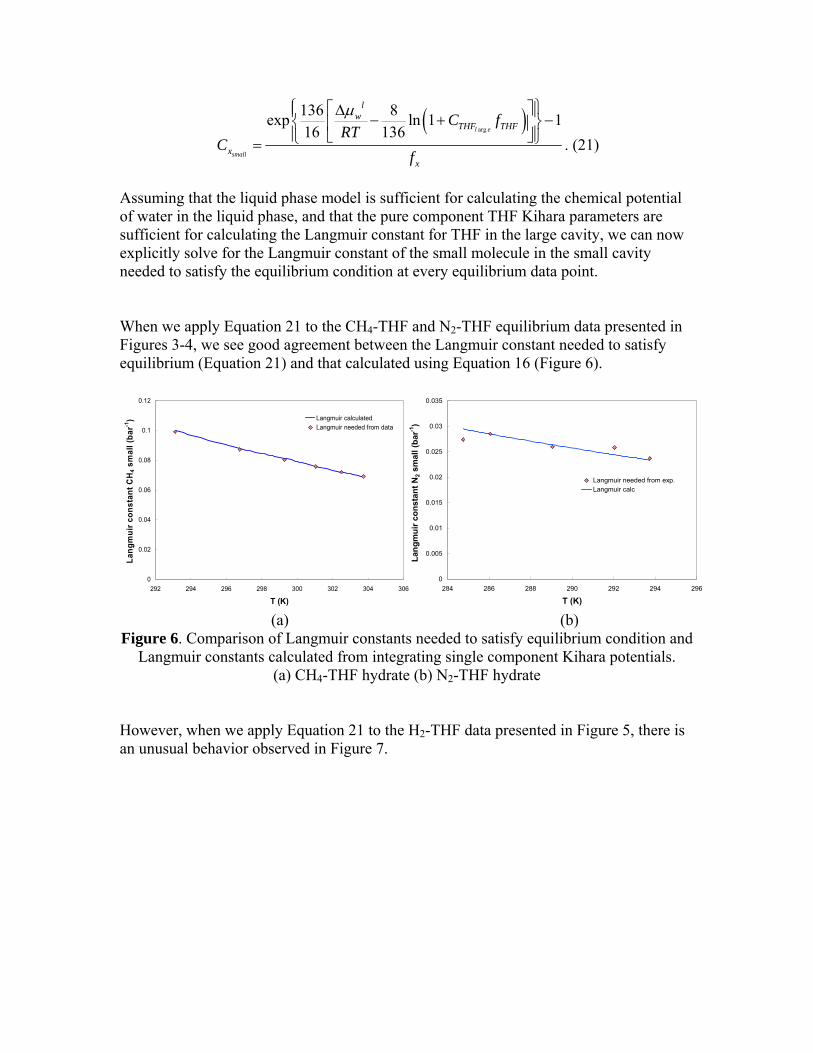
Assuming that the liquid phase model is sufficient for calculating the chemical potential of water in the liquid phase, and that the pure component THF Kihara parameters are sufficient for calculating the Langmuir constant for THF in the large cavity, we can now explicitly solve for the Langmuir constant of the small molecule in the small cavity needed to satisfy the equilibrium condition at every equilibrium data point. When we apply Equation 21 to the CH4-THF and N2-THF equilibrium data presented in Figures 3-4, we see good agreement between the Langmuir constant needed to satisfy equilibrium (Equation 21) and that calculated using Equation 16 (Figure 6).
0
0.005
0.01
0.015
0.02
0.025
0.03
0.035
284 286 288 290 292 294 296
T (K)
Lang
mui
r con
stan
t N2 s
mal
l (ba
r-1)
Langmuir needed from exp.Langmuir calc
0
0.02
0.04
0.06
0.08
0.1
0.12
292 294 296 298 300 302 304 306
T (K)
Lang
mui
r con
stan
t CH
4 sm
all (
bar-1
) Langmuir calculatedLangmuir needed from data
(a) (b)
Figure 6. Comparison of Langmuir constants needed to satisfy equilibrium condition and Langmuir constants calculated from integrating single component Kihara potentials.
(a) CH4-THF hydrate (b) N2-THF hydrate However, when we apply Equation 21 to the H2-THF data presented in Figure 5, there is an unusual behavior observed in Figure 7.
0
0.001
0.002
0.003
0.004
278 279 280 281 282 283
T (K)
Lang
mui
r con
stan
t H2 (
bar-1
)Langmuir needed from dataLangmuir calculated
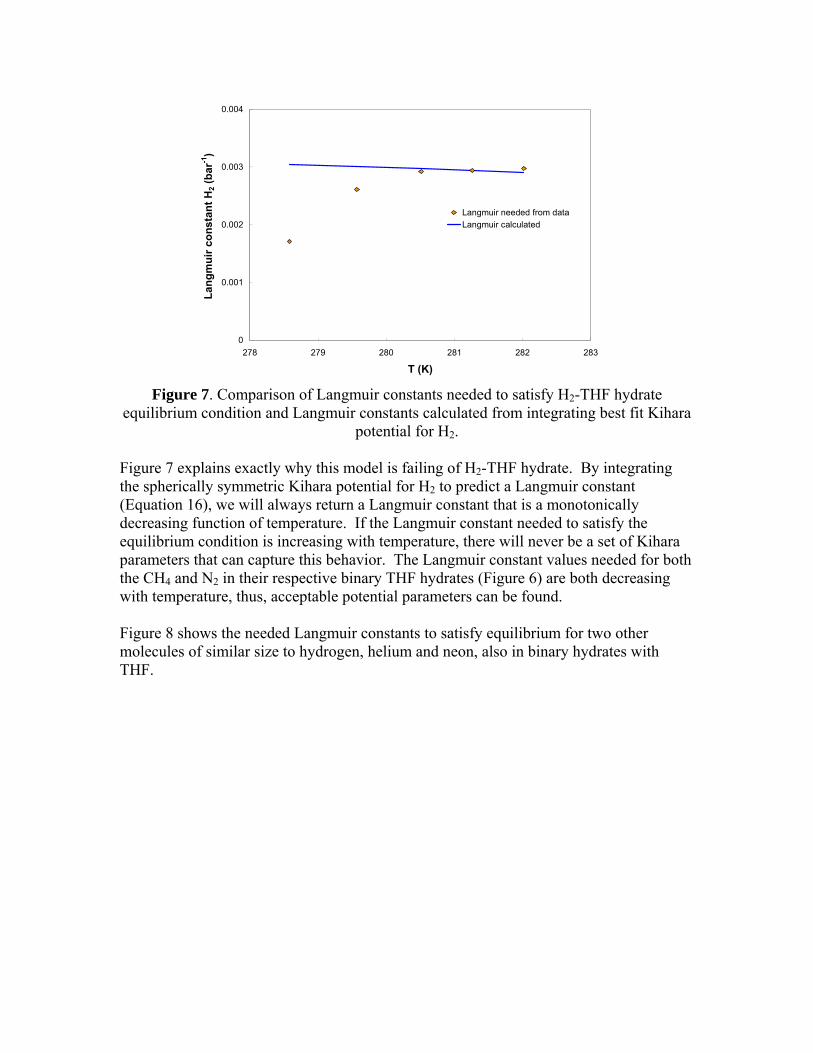
Figure 7. Comparison of Langmuir constants needed to satisfy H2-THF hydrate
equilibrium condition and Langmuir constants calculated from integrating best fit Kihara potential for H2.
Figure 7 explains exactly why this model is failing of H2-THF hydrate. By integrating the spherically symmetric Kihara potential for H2 to predict a Langmuir constant (Equation 16), we will always return a Langmuir constant that is a monotonically decreasing function of temperature. If the Langmuir constant needed to satisfy the equilibrium condition is increasing with temperature, there will never be a set of Kihara parameters that can capture this behavior. The Langmuir constant values needed for both the CH4 and N2 in their respective binary THF hydrates (Figure 6) are both decreasing with temperature, thus, acceptable potential parameters can be found. Figure 8 shows the needed Langmuir constants to satisfy equilibrium for two other molecules of similar size to hydrogen, helium and neon, also in binary hydrates with THF.
-0.002
-0.001
0
0.001
277.2 277.7 278.2
Temperature (K)
CH
e sm
all c
age
(bar
-1)
0
0.001
0.002
277.5 278.0 278.5 279.0 279.5 280.0
Temperature (K)
CN
e sm
all c
age
(bar
-1)
(a) (b)
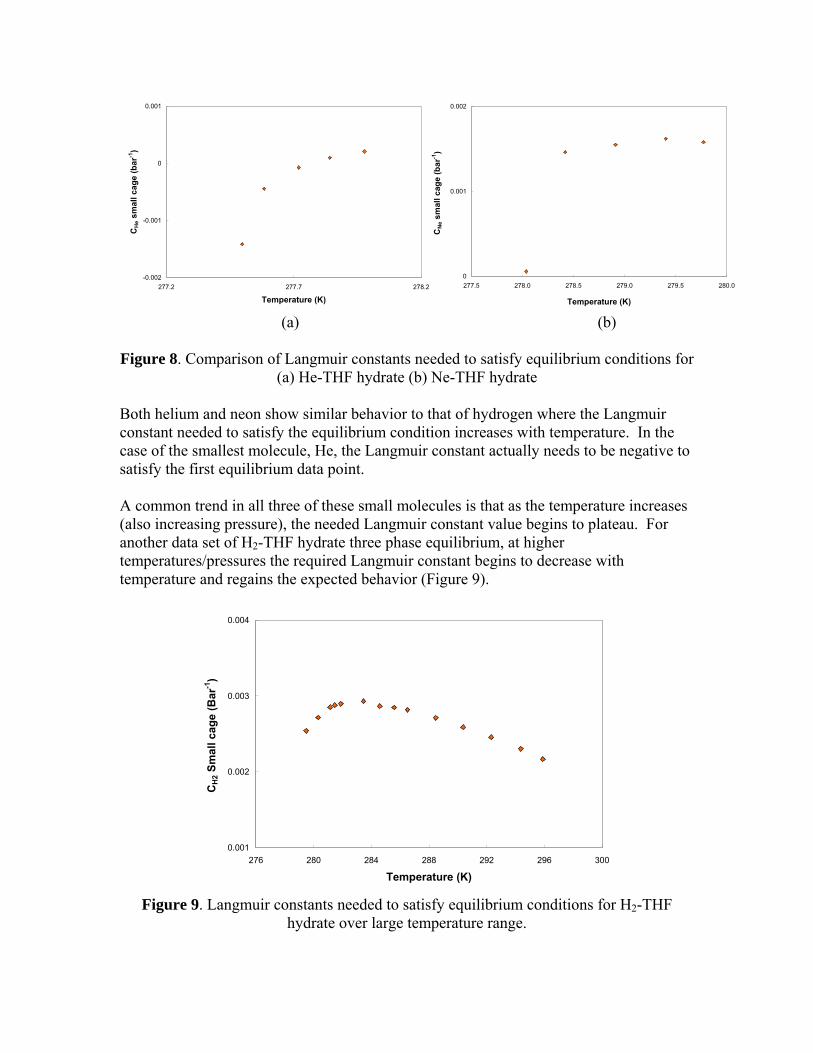
Figure 8. Comparison of Langmuir constants needed to satisfy equilibrium conditions for
(a) He-THF hydrate (b) Ne-THF hydrate
Both helium and neon show similar behavior to that of hydrogen where the Langmuir constant needed to satisfy the equilibrium condition increases with temperature. In the case of the smallest molecule, He, the Langmuir constant actually needs to be negative to satisfy the first equilibrium data point. A common trend in all three of these small molecules is that as the temperature increases (also increasing pressure), the needed Langmuir constant value begins to plateau. For another data set of H2-THF hydrate three phase equilibrium, at higher temperatures/pressures the required Langmuir constant begins to decrease with temperature and regains the expected behavior (Figure 9).
0.001
0.002
0.003
0.004
276 280 284 288 292 296 300
Temperature (K)
CH
2 Sm
all c
age
(Bar
-1)
Figure 9. Langmuir constants needed to satisfy equilibrium conditions for H2-THF
hydrate over large temperature range.
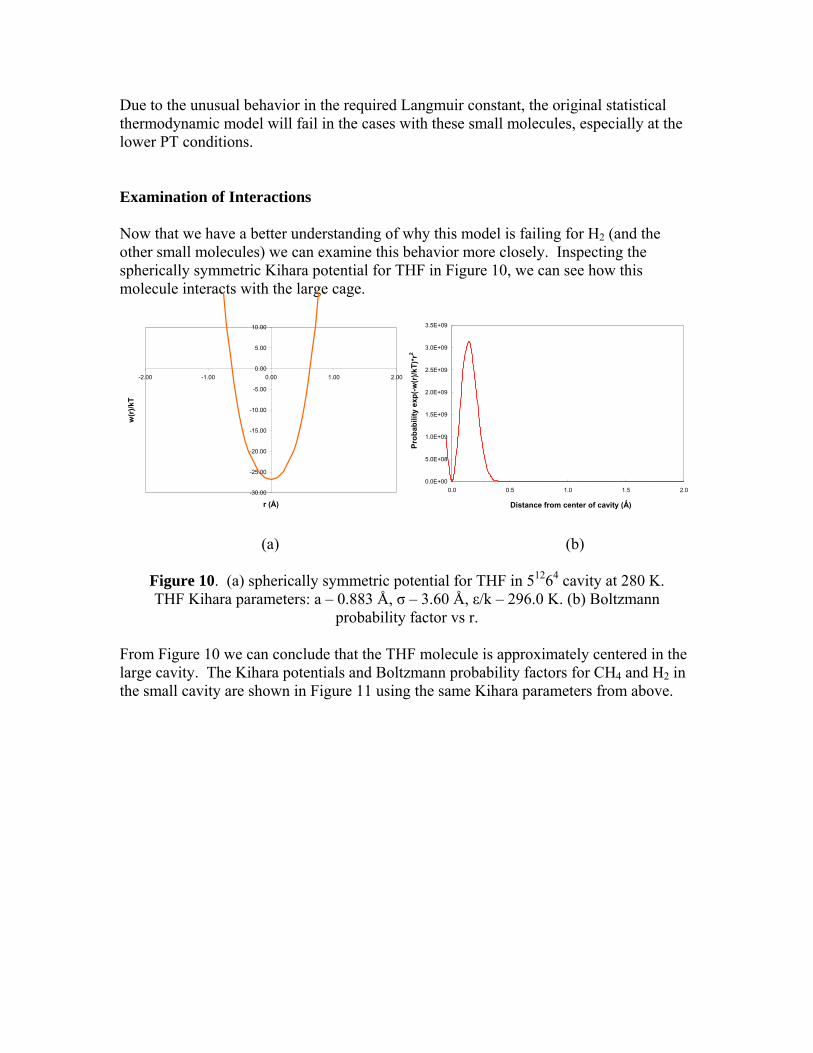
Due to the unusual behavior in the required Langmuir constant, the original statistical thermodynamic model will fail in the cases with these small molecules, especially at the lower PT conditions. Examination of Interactions Now that we have a better understanding of why this model is failing for H2 (and the other small molecules) we can examine this behavior more closely. Inspecting the spherically symmetric Kihara potential for THF in Figure 10, we can see how this molecule interacts with the large cage.
-30.00
-25.00
-20.00
-15.00
-10.00
-5.00
0.00
5.00
10.00
-2.00 -1.00 0.00 1.00 2.00
r (Å)
w(r
)/kT
0.0E+00
5.0E+08
1.0E+09
1.5E+09
2.0E+09
2.5E+09
3.0E+09
3.5E+09
0.0 0.5 1.0 1.5 2.0
Distance from center of cavity (Ǻ)
Prob
abili
ty e
xp(-w
(r)/k
T)*r
2
(a) (b)
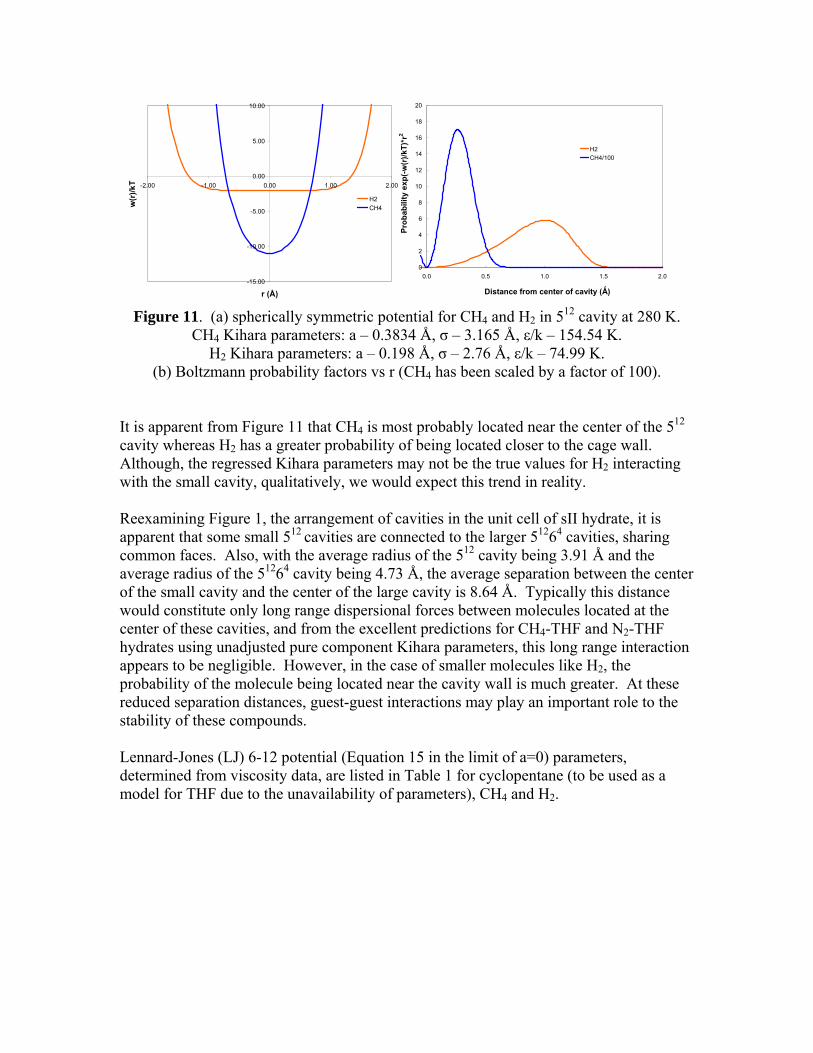
Figure 10. (a) spherically symmetric potential for THF in 51264 cavity at 280 K. THF Kihara parameters: a – 0.883 Å, σ – 3.60 Å, ε/k – 296.0 K. (b) Boltzmann
probability factor vs r.
From Figure 10 we can conclude that the THF molecule is approximately centered in the large cavity. The Kihara potentials and Boltzmann probability factors for CH4 and H2 in the small cavity are shown in Figure 11 using the same Kihara parameters from above.
0
2
4
6
8
10
12
14
16
18
20
0.0 0.5 1.0 1.5 2.0
Distance from center of cavity (Ǻ)
Prob
abili
ty e
xp(-w
(r)/k
T)*r
2
H2CH4/100
-15.00
-10.00
-5.00
0.00
5.00
10.00
-2.00 -1.00 0.00 1.00 2.00
r (Å)
w(r
)/kT
H2CH4
Figure 11. (a) spherically symmetric potential for CH4 and H2 in 512 cavity at 280 K.
CH4 Kihara parameters: a – 0.3834 Å, σ – 3.165 Å, ε/k – 154.54 K. H2 Kihara parameters: a – 0.198 Å, σ – 2.76 Å, ε/k – 74.99 K.
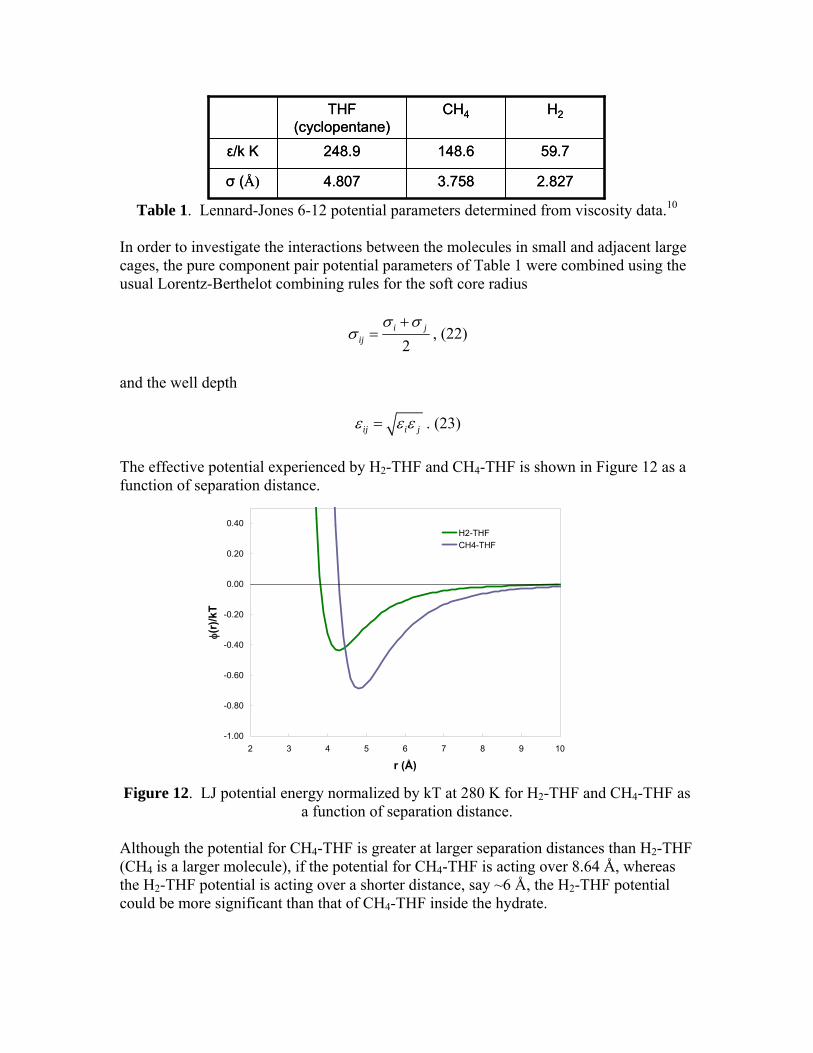
(b) Boltzmann probability factors vs r (CH4 has been scaled by a factor of 100). It is apparent from Figure 11 that CH4 is most probably located near the center of the 512 cavity whereas H2 has a greater probability of being located closer to the cage wall. Although, the regressed Kihara parameters may not be the true values for H2 interacting with the small cavity, qualitatively, we would expect this trend in reality. Reexamining Figure 1, the arrangement of cavities in the unit cell of sII hydrate, it is apparent that some small 512 cavities are connected to the larger 51264 cavities, sharing common faces. Also, with the average radius of the 512 cavity being 3.91 Å and the average radius of the 51264 cavity being 4.73 Å, the average separation between the center of the small cavity and the center of the large cavity is 8.64 Å. Typically this distance would constitute only long range dispersional forces between molecules located at the center of these cavities, and from the excellent predictions for CH4-THF and N2-THF hydrates using unadjusted pure component Kihara parameters, this long range interaction appears to be negligible. However, in the case of smaller molecules like H2, the probability of the molecule being located near the cavity wall is much greater. At these reduced separation distances, guest-guest interactions may play an important role to the stability of these compounds. Lennard-Jones (LJ) 6-12 potential (Equation 15 in the limit of a=0) parameters, determined from viscosity data, are listed in Table 1 for cyclopentane (to be used as a model for THF due to the unavailability of parameters), CH4 and H2.
3.758
148.6
CH4
2.8274.807σ (Å)
59.7248.9ε/k K
H2THF (cyclopentane)
3.758
148.6
CH4
2.8274.807σ (Å)
59.7248.9ε/k K
H2THF (cyclopentane)
Table 1. Lennard-Jones 6-12 potential parameters determined from viscosity data.10
In order to investigate the interactions between the molecules in small and adjacent large cages, the pure component pair potential parameters of Table 1 were combined using the usual Lorentz-Berthelot combining rules for the soft core radius
2i j
ij
σ σσ
+= , (22)
and the well depth
ij i jε ε ε= . (23)
The effective potential experienced by H2-THF and CH4-THF is shown in Figure 12 as a function of separation distance.
-1.00
-0.80
-0.60
-0.40
-0.20
0.00
0.20
0.40
2 3 4 5 6 7 8 9 10
r (Å)
φ(r)
/kT
H2-THFCH4-THF
Figure 12. LJ potential energy normalized by kT at 280 K for H2-THF and CH4-THF as
a function of separation distance. Although the potential for CH4-THF is greater at larger separation distances than H2-THF (CH4 is a larger molecule), if the potential for CH4-THF is acting over 8.64 Å, whereas the H2-THF potential is acting over a shorter distance, say ~6 Å, the H2-THF potential could be more significant than that of CH4-THF inside the hydrate.
Recalling Equation 21, because the partition function for the small molecule is lumped into the Langmuir constant that we already solved for, this would indicate that the partition function for THF will be the most sensitive parameter. This rationale is also physically justifiable noting that presence of THF is attributed to the majority of the stability of these compounds. Reformulating the partition function for THF inside of the large cavity to account for these guest-guest interactions, we have
arg
3/ 2
int2
2 ( ) ( )expl e
cell
gl gg
THFV
mkT r rq q drh kT
π ω ω⎛ ⎞+⎛ ⎞= −⎜ ⎟⎜ ⎟⎝ ⎠ ⎝ ⎠
∫ %. (24)
If we assume that the guest-guest interaction is over a fixed distance, we may remove this potential outside of the integral. Once again evoking the spherical cell approximation, the Langmuir constant for THF in the large cavity becomes
arg
2
0
4 ( )exp expl e
Rgg gl
THFW rC r dr
kT kT kTπ ω⎛ ⎞ ⎛ ⎞
= −⎜ ⎟ ⎜ ⎟⎝ ⎠ ⎝ ⎠
∫ , (25)
where,
12 6
4 ij ijggij
ij ij
Wr rσ σ
ε⎛ ⎞⎛ ⎞ ⎛ ⎞⎜ ⎟= −⎜ ⎟ ⎜ ⎟⎜ ⎟ ⎜ ⎟⎜ ⎟⎝ ⎠ ⎝ ⎠⎝ ⎠
. (26)
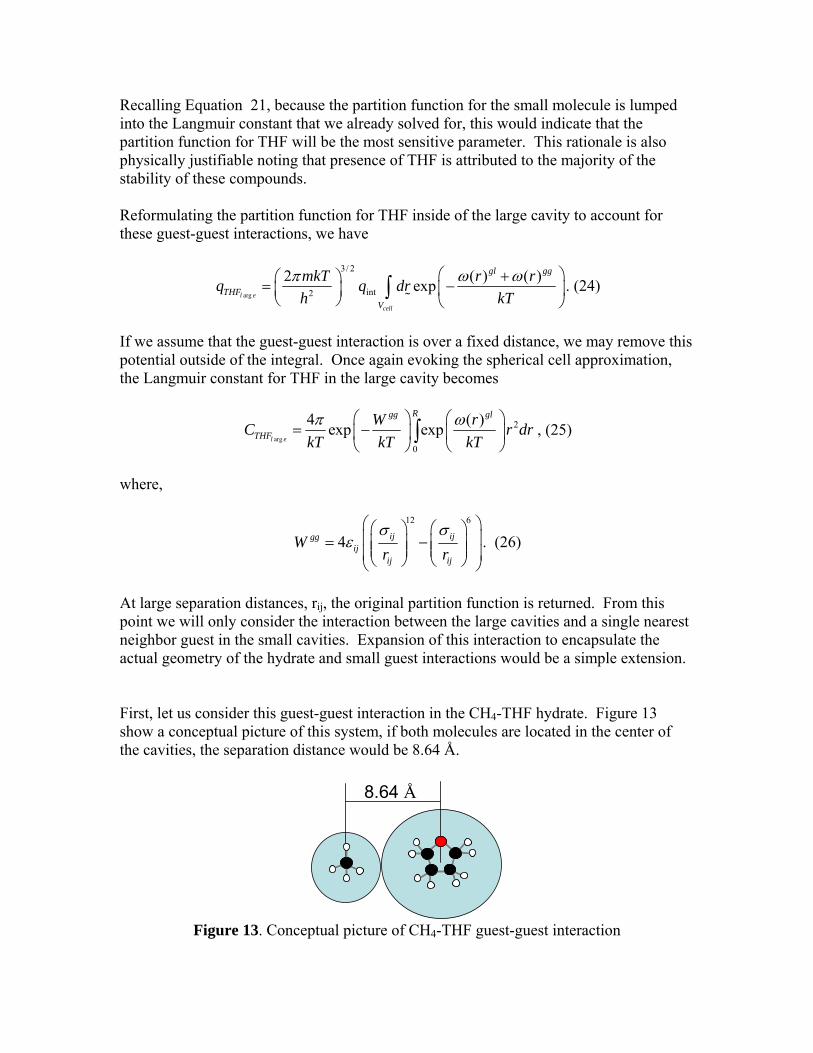
At large separation distances, rij, the original partition function is returned. From this point we will only consider the interaction between the large cavities and a single nearest neighbor guest in the small cavities. Expansion of this interaction to encapsulate the actual geometry of the hydrate and small guest interactions would be a simple extension. First, let us consider this guest-guest interaction in the CH4-THF hydrate. Figure 13 show a conceptual picture of this system, if both molecules are located in the center of the cavities, the separation distance would be 8.64 Å.
8.64 Å
Figure 13. Conceptual picture of CH4-THF guest-guest interaction
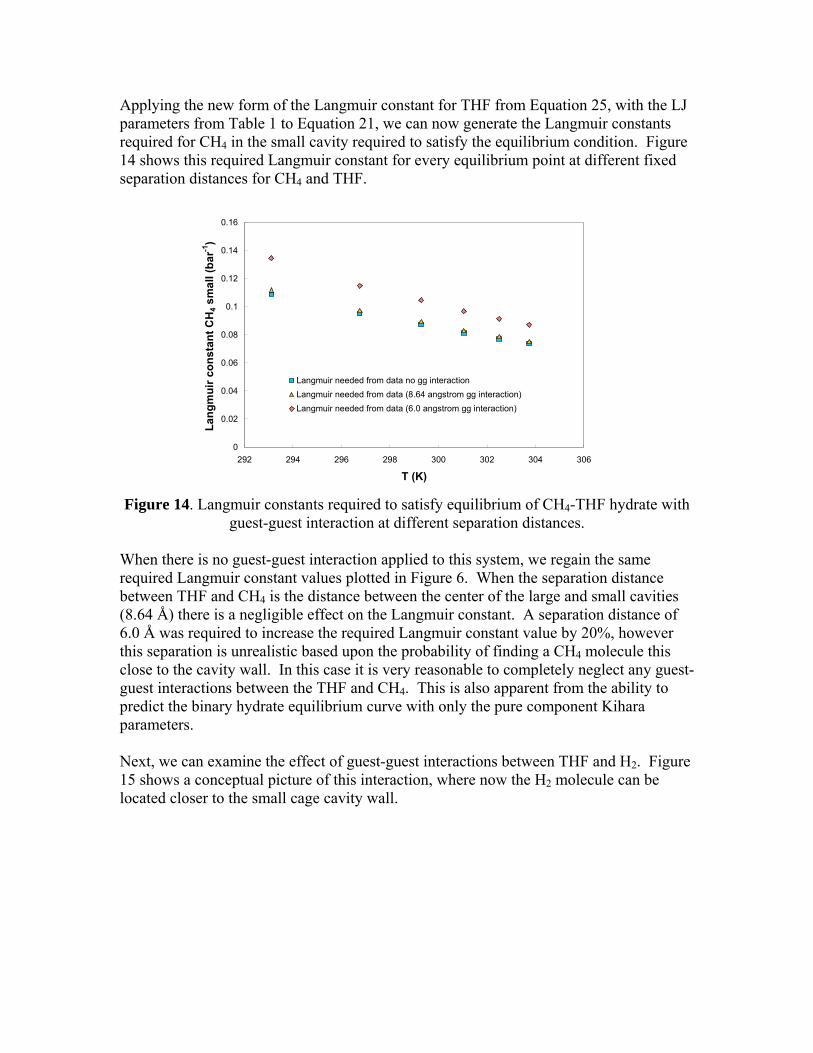
Applying the new form of the Langmuir constant for THF from Equation 25, with the LJ parameters from Table 1 to Equation 21, we can now generate the Langmuir constants required for CH4 in the small cavity required to satisfy the equilibrium condition. Figure 14 shows this required Langmuir constant for every equilibrium point at different fixed separation distances for CH4 and THF.
0
0.02
0.04
0.06
0.08
0.1
0.12
0.14
0.16
292 294 296 298 300 302 304 306
T (K)
Lang
mui
r con
stan
t CH
4 sm
all (
bar-1
)
Langmuir needed from data no gg interactionLangmuir needed from data (8.64 angstrom gg interaction)Langmuir needed from data (6.0 angstrom gg interaction)
Figure 14. Langmuir constants required to satisfy equilibrium of CH4-THF hydrate with
guest-guest interaction at different separation distances.
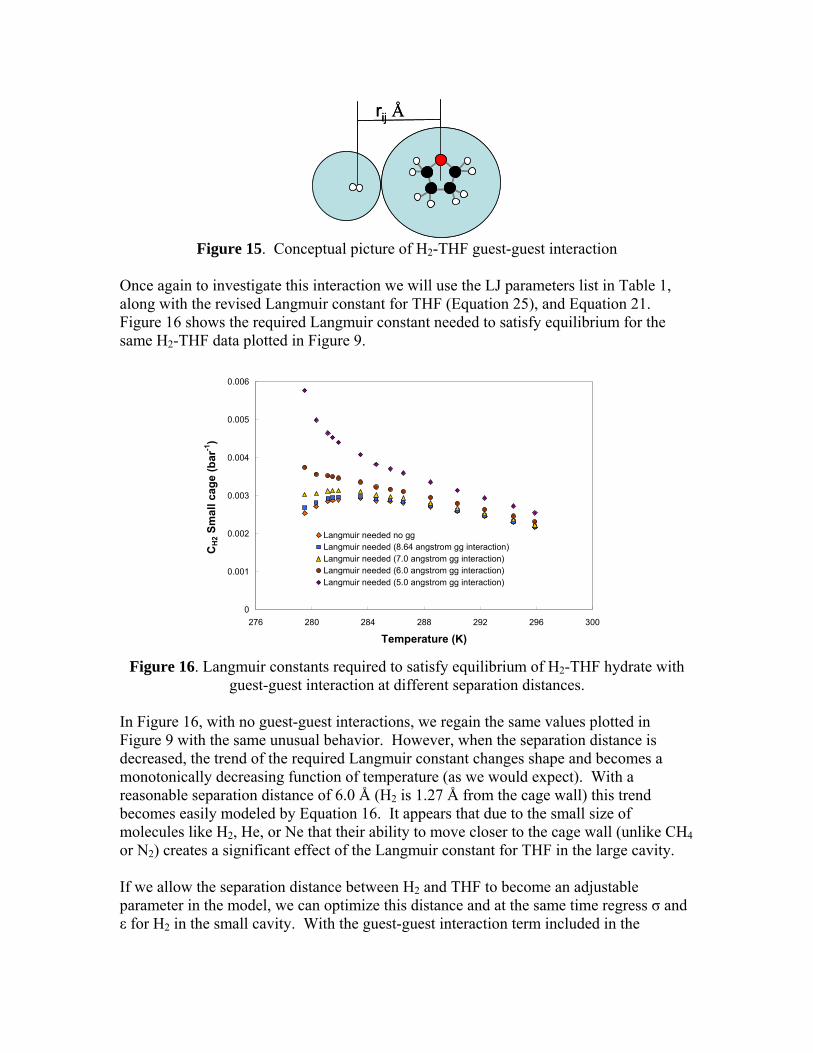
When there is no guest-guest interaction applied to this system, we regain the same required Langmuir constant values plotted in Figure 6. When the separation distance between THF and CH4 is the distance between the center of the large and small cavities (8.64 Å) there is a negligible effect on the Langmuir constant. A separation distance of 6.0 Å was required to increase the required Langmuir constant value by 20%, however this separation is unrealistic based upon the probability of finding a CH4 molecule this close to the cavity wall. In this case it is very reasonable to completely neglect any guest-guest interactions between the THF and CH4. This is also apparent from the ability to predict the binary hydrate equilibrium curve with only the pure component Kihara parameters. Next, we can examine the effect of guest-guest interactions between THF and H2. Figure 15 shows a conceptual picture of this interaction, where now the H2 molecule can be located closer to the small cage cavity wall.
rij Årij Å
Figure 15. Conceptual picture of H2-THF guest-guest interaction
Once again to investigate this interaction we will use the LJ parameters list in Table 1, along with the revised Langmuir constant for THF (Equation 25), and Equation 21. Figure 16 shows the required Langmuir constant needed to satisfy equilibrium for the same H2-THF data plotted in Figure 9.
0
0.001
0.002
0.003
0.004
0.005
0.006
276 280 284 288 292 296 300
Temperature (K)
CH
2 Sm
all c
age
(bar
-1)
Langmuir needed no ggLangmuir needed (8.64 angstrom gg interaction)Langmuir needed (7.0 angstrom gg interaction)Langmuir needed (6.0 angstrom gg interaction)Langmuir needed (5.0 angstrom gg interaction)
Figure 16. Langmuir constants required to satisfy equilibrium of H2-THF hydrate with
guest-guest interaction at different separation distances.
In Figure 16, with no guest-guest interactions, we regain the same values plotted in Figure 9 with the same unusual behavior. However, when the separation distance is decreased, the trend of the required Langmuir constant changes shape and becomes a monotonically decreasing function of temperature (as we would expect). With a reasonable separation distance of 6.0 Å (H2 is 1.27 Å from the cage wall) this trend becomes easily modeled by Equation 16. It appears that due to the small size of molecules like H2, He, or Ne that their ability to move closer to the cage wall (unlike CH4 or N2) creates a significant effect of the Langmuir constant for THF in the large cavity. If we allow the separation distance between H2 and THF to become an adjustable parameter in the model, we can optimize this distance and at the same time regress σ and ε for H2 in the small cavity. With the guest-guest interaction term included in the
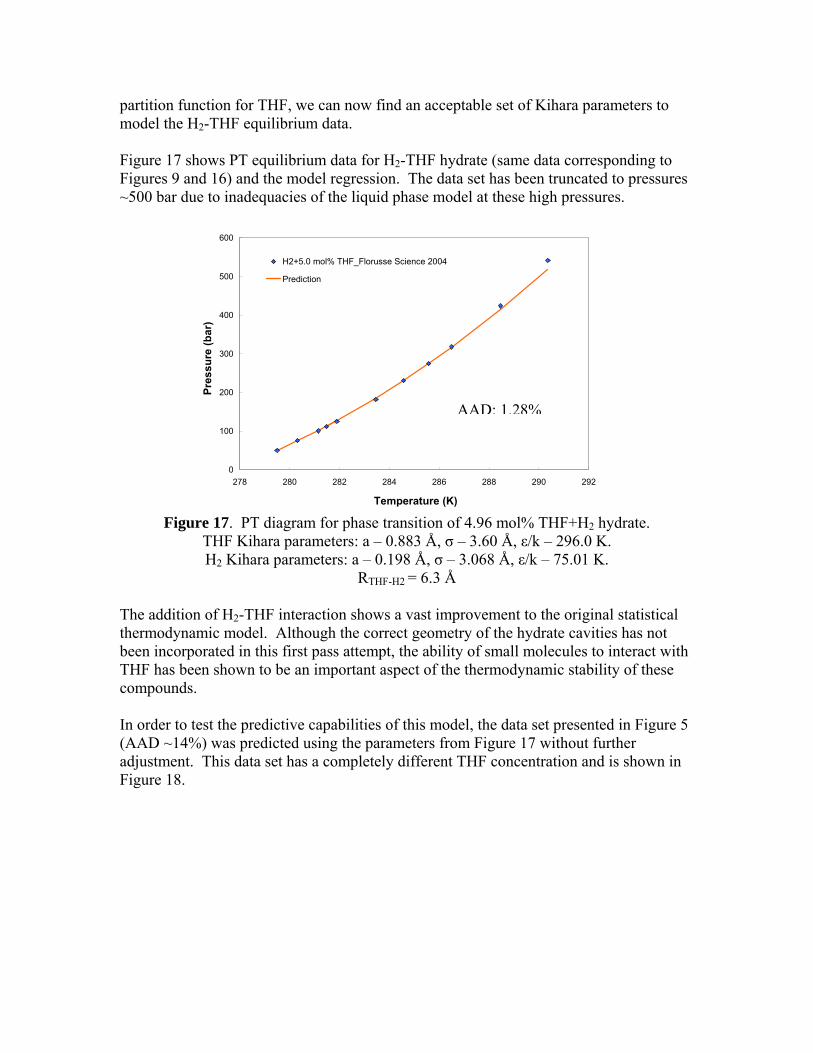
partition function for THF, we can now find an acceptable set of Kihara parameters to model the H2-THF equilibrium data. Figure 17 shows PT equilibrium data for H2-THF hydrate (same data corresponding to Figures 9 and 16) and the model regression. The data set has been truncated to pressures ~500 bar due to inadequacies of the liquid phase model at these high pressures.
0
100
200
300
400
500
600
278 280 282 284 286 288 290 292
Temperature (K)
Pres
sure
(bar
)
H2+5.0 mol% THF_Florusse Science 2004
Prediction
Figure 17. PT diagram for phase transition of 4.96 mol% THF+H2 hydrate.
THF Kihara parameters: a – 0.883 Å, σ – 3.60 Å, ε/k – 296.0 K. H2 Kihara parameters: a – 0.198 Å, σ – 3.068 Å, ε/k – 75.01 K.
RTHF-H2 = 6.3 Å
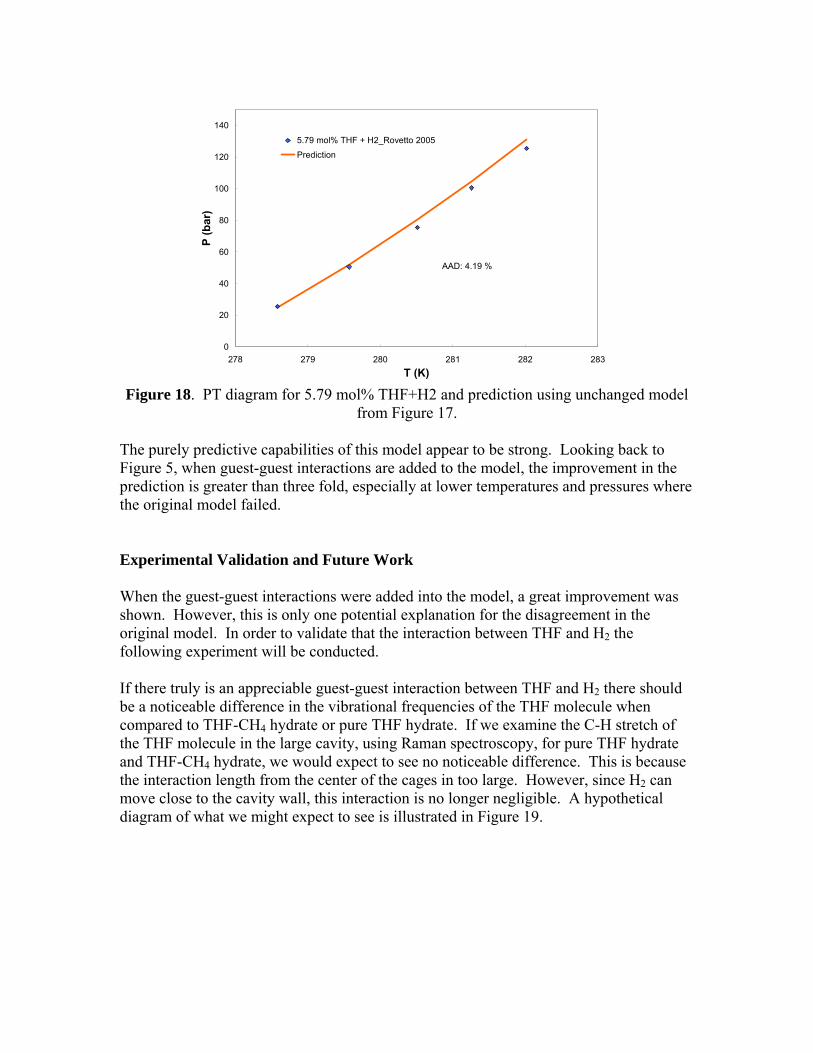
The addition of H2-THF interaction shows a vast improvement to the original statistical thermodynamic model. Although the correct geometry of the hydrate cavities has not been incorporated in this first pass attempt, the ability of small molecules to interact with THF has been shown to be an important aspect of the thermodynamic stability of these compounds. In order to test the predictive capabilities of this model, the data set presented in Figure 5 (AAD ~14%) was predicted using the parameters from Figure 17 without further adjustment. This data set has a completely different THF concentration and is shown in Figure 18.
AAD: 1.28%
0
20
40
60
80
100
120
140
278 279 280 281 282 283T (K)
P (b
ar)
5.79 mol% THF + H2_Rovetto 2005
Prediction
AAD: 4.19 %
Figure 18. PT diagram for 5.79 mol% THF+H2 and prediction using unchanged model
from Figure 17.
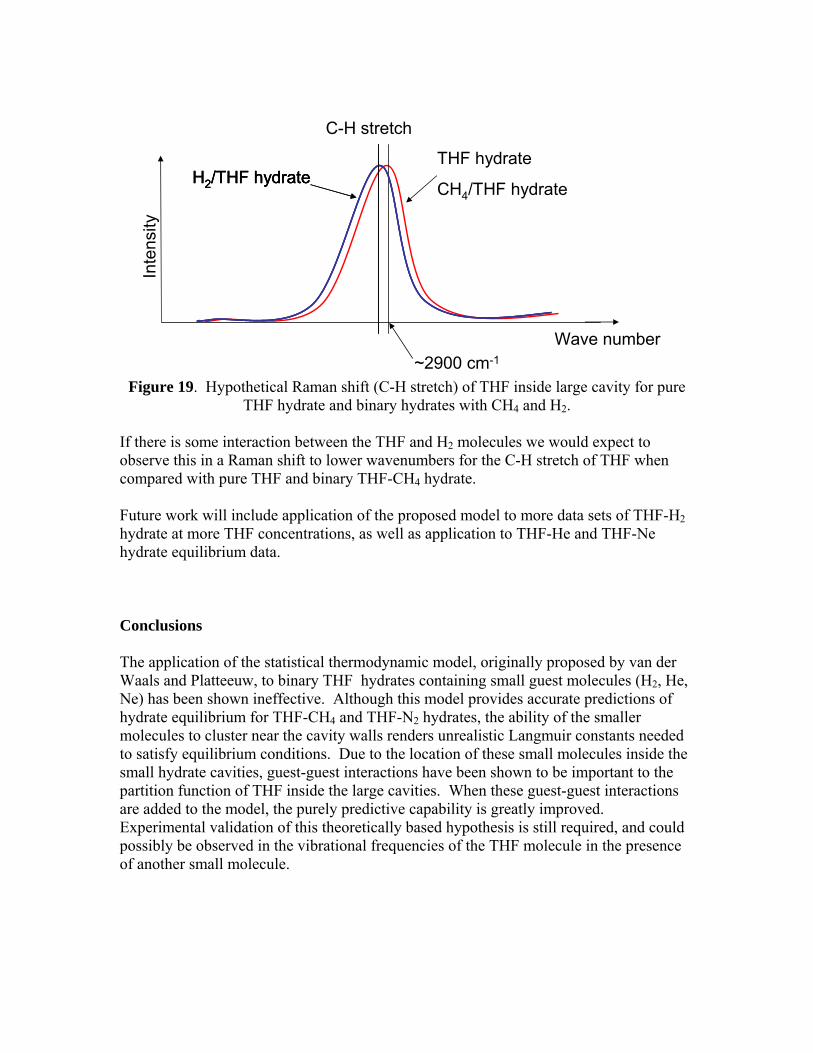
The purely predictive capabilities of this model appear to be strong. Looking back to Figure 5, when guest-guest interactions are added to the model, the improvement in the prediction is greater than three fold, especially at lower temperatures and pressures where the original model failed. Experimental Validation and Future Work When the guest-guest interactions were added into the model, a great improvement was shown. However, this is only one potential explanation for the disagreement in the original model. In order to validate that the interaction between THF and H2 the following experiment will be conducted. If there truly is an appreciable guest-guest interaction between THF and H2 there should be a noticeable difference in the vibrational frequencies of the THF molecule when compared to THF-CH4 hydrate or pure THF hydrate. If we examine the C-H stretch of the THF molecule in the large cavity, using Raman spectroscopy, for pure THF hydrate and THF-CH4 hydrate, we would expect to see no noticeable difference. This is because the interaction length from the center of the cages in too large. However, since H2 can move close to the cavity wall, this interaction is no longer negligible. A hypothetical diagram of what we might expect to see is illustrated in Figure 19.
~2900 cm-1
THF hydrate
CH4/THF hydrateH2/THF hydrateH2/THF hydrateH2/THF hydrate
Wave number
Inte
nsity
C-H stretch
Figure 19. Hypothetical Raman shift (C-H stretch) of THF inside large cavity for pure
THF hydrate and binary hydrates with CH4 and H2.
If there is some interaction between the THF and H2 molecules we would expect to observe this in a Raman shift to lower wavenumbers for the C-H stretch of THF when compared with pure THF and binary THF-CH4 hydrate. Future work will include application of the proposed model to more data sets of THF-H2 hydrate at more THF concentrations, as well as application to THF-He and THF-Ne hydrate equilibrium data. Conclusions The application of the statistical thermodynamic model, originally proposed by van der Waals and Platteeuw, to binary THF hydrates containing small guest molecules (H2, He, Ne) has been shown ineffective. Although this model provides accurate predictions of hydrate equilibrium for THF-CH4 and THF-N2 hydrates, the ability of the smaller molecules to cluster near the cavity walls renders unrealistic Langmuir constants needed to satisfy equilibrium conditions. Due to the location of these small molecules inside the small hydrate cavities, guest-guest interactions have been shown to be important to the partition function of THF inside the large cavities. When these guest-guest interactions are added to the model, the purely predictive capability is greatly improved. Experimental validation of this theoretically based hypothesis is still required, and could possibly be observed in the vibrational frequencies of the THF molecule in the presence of another small molecule.
References (1) Sloan, E. D. Clathrate Hydrates of Natural Gases; Marcel-Dekker, Inc, New
York, 1998. (2) Gudmundsson, J.; Andersson, V.; Levik, O.; Mork, M. Challenges for the
Future, Gas Hydrates 2000, NYAS 912, 403. (3) Lokshin K.A., Z. Y., He Duanwei, Mao W.L, Mao H.K., Hemley R.J.,
Lobanov M.V., Greenblatt M. Phys. Rev. Lett. 2004, 93, 125503. (4) Mao, W. L.; Mao, H. K.; Goncharov, A. F.; Struzhkin, V. V.; Guo, Q. Z.; Hu,
J. Z.; Shu, J. F.; Hemley, R. J.; Somayazulu, M.; Zhao, Y. S. Science 2002, 297, 2247.
(5) Florusse, L. J.; Peters, C. J.; Schoonman, J.; Hester, K. C.; Koh, C. A.; Dec, S. F.; Marsh, K. N.; Sloan, E. D. Science 2004, 306, 469.
(6) Carbonnel, L.; Ross, J. C. J. Solid State Chem 1973, 8, 304. (7) van der Waals, J. H.; Platteeuw, J. C. Adv. Chem. Phys., InterScience, New
York 1959, II, 1. (8) Lennard-Jones, J. E.; Devonshire, A. F. Proc. Roy Soc (London) 1937, A163,
53. (9) Kihara, T. Reviews in Modern Physics 1953, 25, 831. (10) Poling, B. E.; Prausnitz, J. M.; O'Connell, J. P. The Properties of Gases and
Liquids 5th edition; McGraw-Hill: New York, 2001.