growing up with the cmmi: it’s not (just) about the level!joejr.com/njtl.pdf · growing up with...
TRANSCRIPT
Growing Up with the CMMI: It’s Not (Just) about the Level!
October 24, 2011
CMMI® Workshops
Minneapolis, Minnesota
Joe Schofield [email protected]
Sandia National Laboratories
Sandia National Laboratories is a multi-program laboratory managed and operated by Sandia Corporation, a wholly owned subsidiary of Lockheed Martin Corporation, for the U.S. Department of Energy's National
Nuclear Security Administration under contract DE-AC04-94AL85000

Topics: • Getting Started under the SW-CMM® • The Role of SQA / PPQA • Measurements and Estimation • Tailoring • Results • Recent Activity • Language Adoption • Corporate Impacts • Steps to Minimize Intended Results • Journeys are Different Abstract: The CMMI® model is often used to express an organization's maturity or capability. The impact and benefits of the CMMI as a continuous improvement framework are often touted, though less frequently highlighted. The impact of a thirteen-year journey (it's a journey, not a destination - right?) of the SW-CMM, and more recently the CMMI-DEV at a large national laboratory is the focus of this presentation. The journey includes successes and trials, progress and delay. Nonetheless, the maturing of activities across an organization of 9,000 aren't revealed only in SCAMPISM results. Rather, process adoptions, appraisal model influences, organizational structures, measurement discussions, and policy impacts are far more reaching and far more numerous than a small sect (or should I suggest "cult") of advocates might suggest.
Abstract & Topics
If you believe that every picture tells a story, then I’ve included some of our best “pictures” to justify the journey even IF the “rating” isn’t where you’d like!
Schofield:CMMI(R) Workshops:10-2011 2
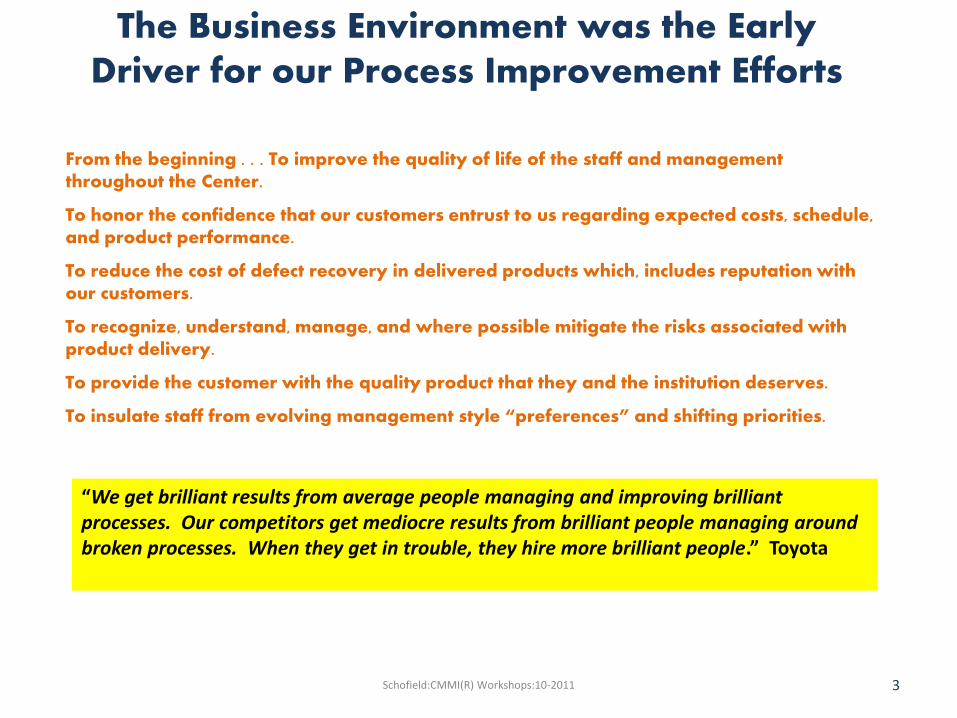
From the beginning . . . To improve the quality of life of the staff and management throughout the Center.
To honor the confidence that our customers entrust to us regarding expected costs, schedule, and product performance.
To reduce the cost of defect recovery in delivered products which, includes reputation with our customers.
To recognize, understand, manage, and where possible mitigate the risks associated with product delivery.
To provide the customer with the quality product that they and the institution deserves.
To insulate staff from evolving management style “preferences” and shifting priorities.
“We get brilliant results from average people managing and improving brilliant processes. Our competitors get mediocre results from brilliant people managing around broken processes. When they get in trouble, they hire more brilliant people.” Toyota
The Business Environment was the Early Driver for our Process Improvement Efforts
3 Schofield:CMMI(R) Workshops:10-2011
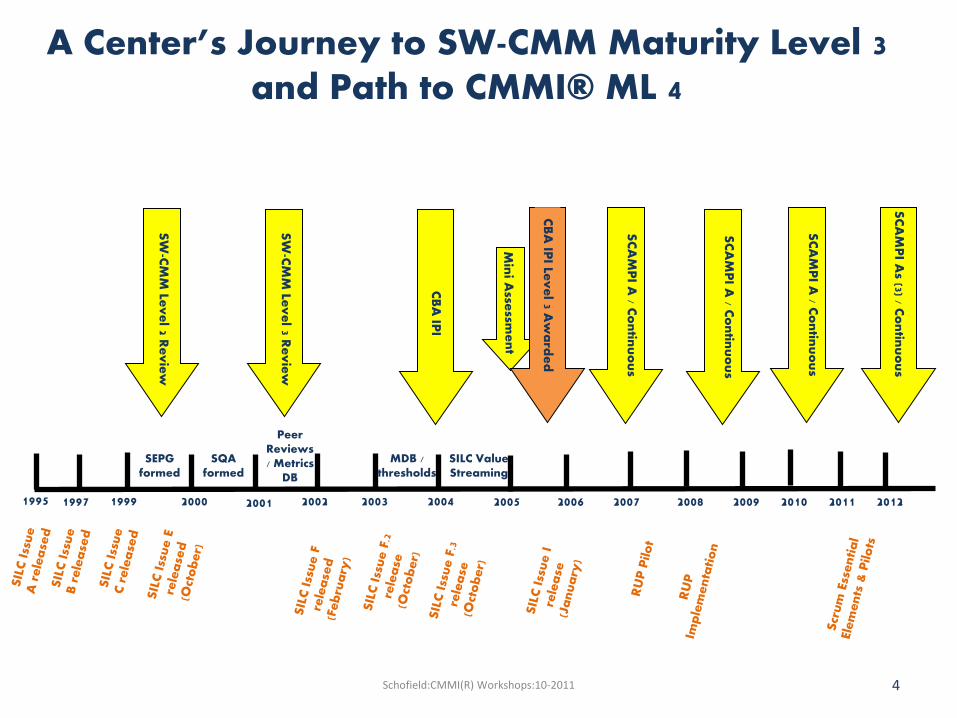
A Center’s Journey to SW-CMM Maturity Level 3 and Path to CMMI® ML 4
1995 1997 1999 2000 2001 2002 2003 2004 2005
SW
-CM
M Le
ve
l 2 Re
vie
w
CB
A IP
I
2007 2006
SC
AM
PI A
/ Co
ntin
uo
us
SEPG formed
SQA formed
Peer Reviews / Metrics
DB
MDB / thresholds
SILC Value Streaming
SW
-CM
M Le
ve
l 3 Re
vie
w
CB
A IP
I Lev
el 3 A
wa
rde
d
SC
AM
PI A
/ Co
ntin
uo
us
2008 2009
SC
AM
PI A
/ Co
ntin
uo
us
2011 2010 2012
SC
AM
PI A
s (3) / Co
ntin
uo
us
4 Schofield:CMMI(R) Workshops:10-2011
Plan Set Ops. Set Imple. Set Design Set Analysis Set
Phase 1: RM TWG
Phase 2: SM TWG
Phase 2: CM TWG
Phase 3: SQA TWG
Phase 3: PC TWG
Phase 1: PP TWG Consider:
• Design Reviews
• Quarterly Reviews
• Risks
• Tailoring
• Other TWGs
• TWG Policy
(use template)
• TWG policy checklist
• Toolkit with artifact
template(s)
• Training
• Architecture
Develop:
• Organizational Plan
(RM, SQA, CM)
• Candidate measures
• SILC (process) Updates
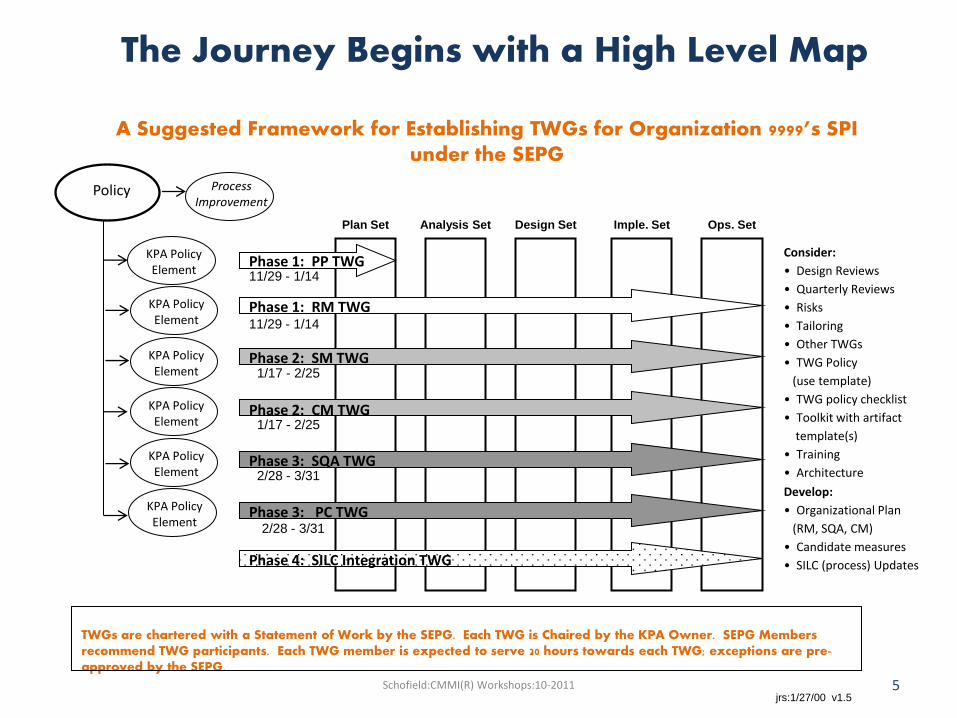
A Suggested Framework for Establishing TWGs for Organization 9999’s SPI under the SEPG
TWGs are chartered with a Statement of Work by the SEPG. Each TWG is Chaired by the KPA Owner. SEPG Members recommend TWG participants. Each TWG member is expected to serve 20 hours towards each TWG; exceptions are pre-approved by the SEPG.
Policy
KPA Policy Element
KPA Policy Element
KPA Policy Element
KPA Policy Element
KPA Policy Element
KPA Policy Element
Process Improvement
jrs:1/27/00 v1.5
Phase 4: SILC Integration TWG
11/29 - 1/14
11/29 - 1/14
1/17 - 2/25
2/28 - 3/31
1/17 - 2/25
2/28 - 3/31
The Journey Begins with a High Level Map
5 Schofield:CMMI(R) Workshops:10-2011
Plan Set Ops. Set Imple. Set Design Set Analysis Set
Consider:
• SOW
• SILC & Reviews
• Risks
• Tailoring
• Other TWGs / overlap
• Document guidance on
CMM homepage
• Architecture
Develop:
• Organizational Policy
• Organizational Process
• TWG Checklist
• Template(s)
• Candidate measures
• SILC (process) Updates
• Training needs
• Artifacts
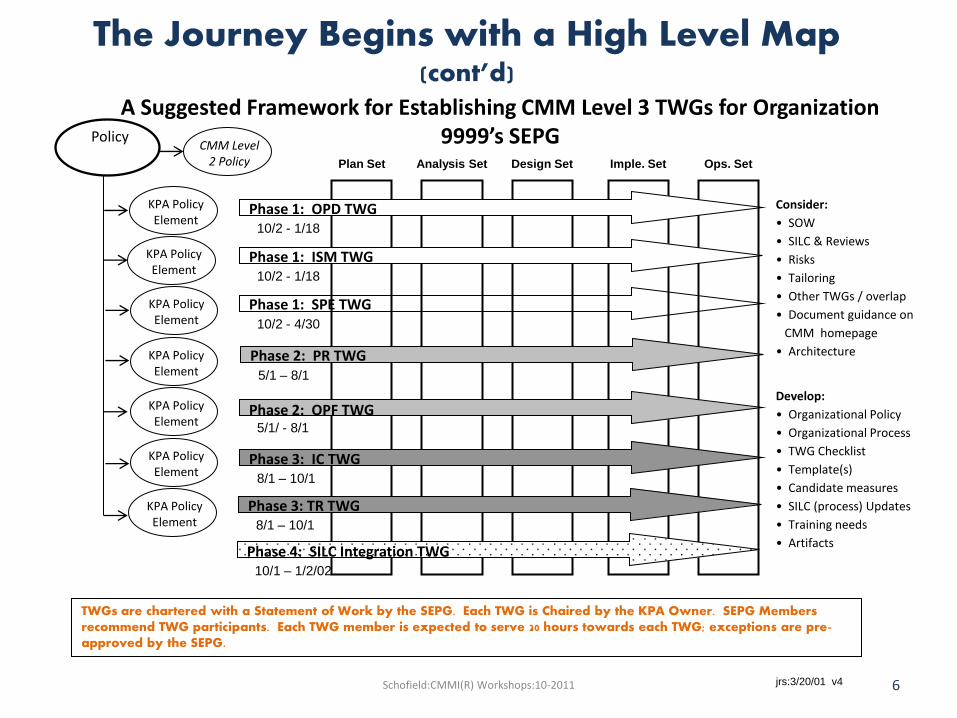
A Suggested Framework for Establishing CMM Level 3 TWGs for Organization 9999’s SEPG
TWGs are chartered with a Statement of Work by the SEPG. Each TWG is Chaired by the KPA Owner. SEPG Members recommend TWG participants. Each TWG member is expected to serve 20 hours towards each TWG; exceptions are pre-approved by the SEPG.
jrs:3/20/01 v4
Phase 1: SPE TWG 10/2 - 4/30
Phase 2: OPF TWG 5/1/ - 8/1
Phase 3: IC TWG 8/1 – 10/1
10/2 - 1/18
Phase 1: OPD TWG
CMM Level 2 Policy
Policy
KPA Policy Element
KPA Policy Element
KPA Policy Element
KPA Policy Element
KPA Policy Element
KPA Policy Element
KPA Policy Element
Phase 1: ISM TWG 10/2 - 1/18
Phase 2: PR TWG 5/1 – 8/1
Phase 3: TR TWG 8/1 – 10/1
Phase 4: SILC Integration TWG 10/1 – 1/2/02
The Journey Begins with a High Level Map (cont’d)
6 Schofield:CMMI(R) Workshops:10-2011
Portfolio Management Team
(PMT)
Process Advisory Council (PAC – formerly
PLT, SEPG)
Project / Process Mgmt. PACs
Support PACs Engineering PACs
Project Teams
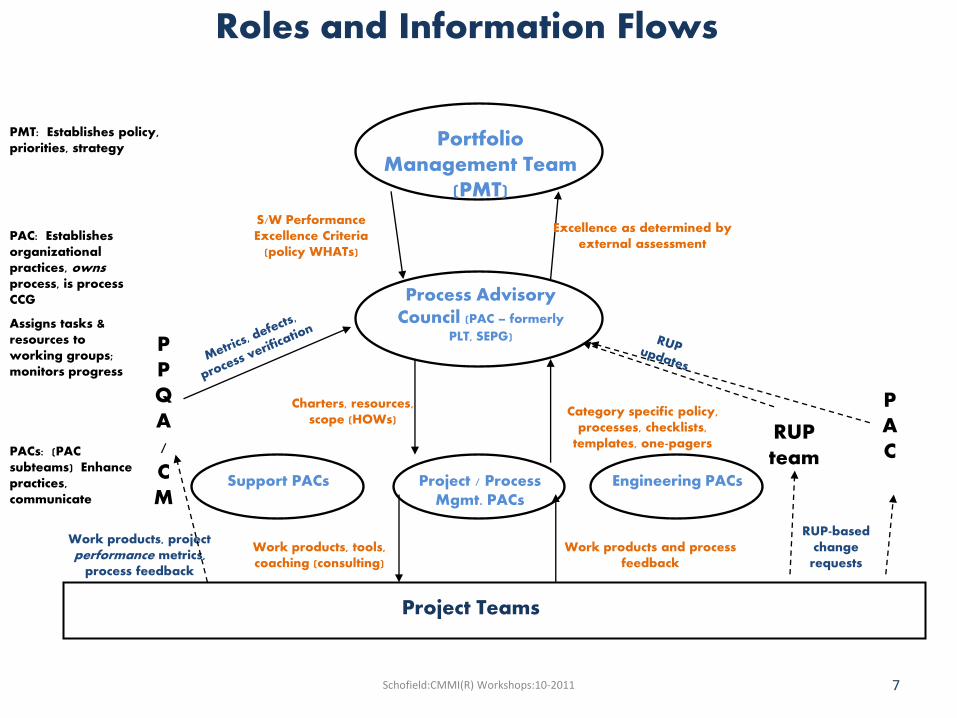
PMT: Establishes policy, priorities, strategy
PAC: Establishes organizational practices, owns process, is process CCG
Assigns tasks & resources to working groups; monitors progress
PACs: (PAC subteams) Enhance practices, communicate
PAC
Work products, project performance metrics,
process feedback
S/W Performance Excellence Criteria
(policy WHATs)
Excellence as determined by external assessment
Work products, tools, coaching (consulting)
Charters, resources, scope (HOWs)
Category specific policy, processes, checklists,
templates, one-pagers
Work products and process feedback
Roles and Information Flows
RUP-based change
requests
RUP team
PPQA / CM
Schofield:CMMI(R) Workshops:10-2011 7

A Process Representation (and Process Asset Library Entry)
8 Schofield:CMMI(R) Workshops:10-2011
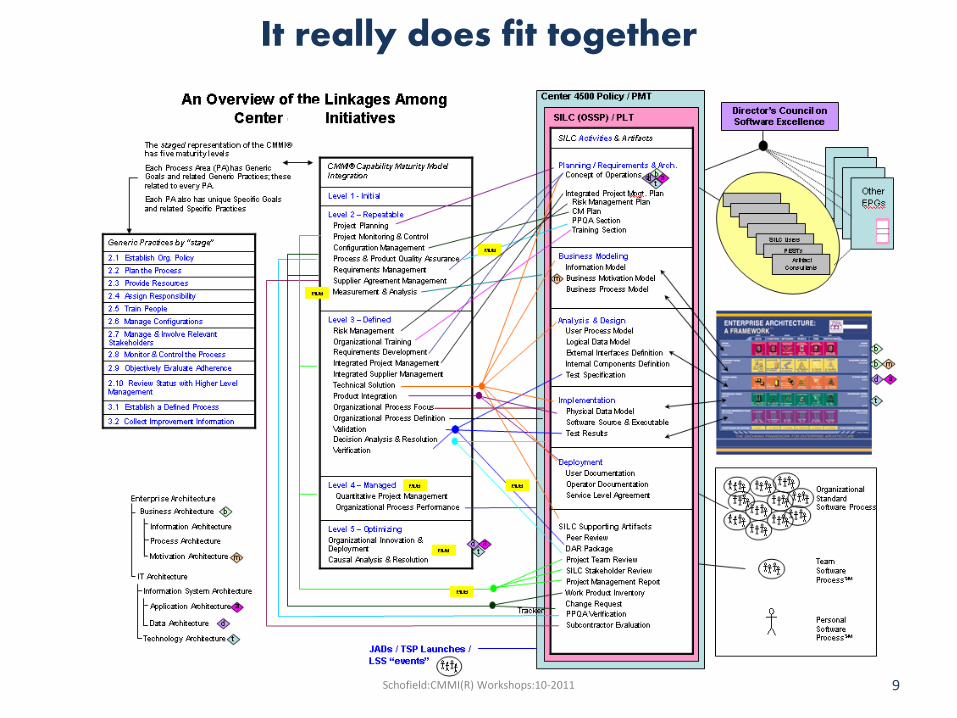
It really does fit together
9 Schofield:CMMI(R) Workshops:10-2011
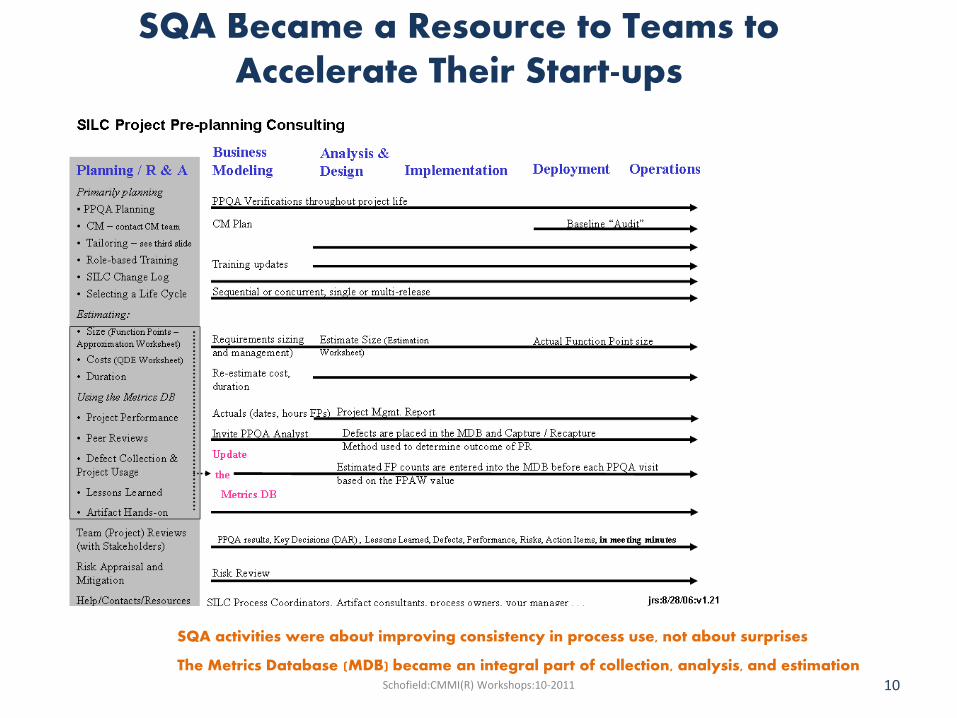
SQA Became a Resource to Teams to Accelerate Their Start-ups
SQA activities were about improving consistency in process use, not about surprises
The Metrics Database (MDB) became an integral part of collection, analysis, and estimation 10 Schofield:CMMI(R) Workshops:10-2011
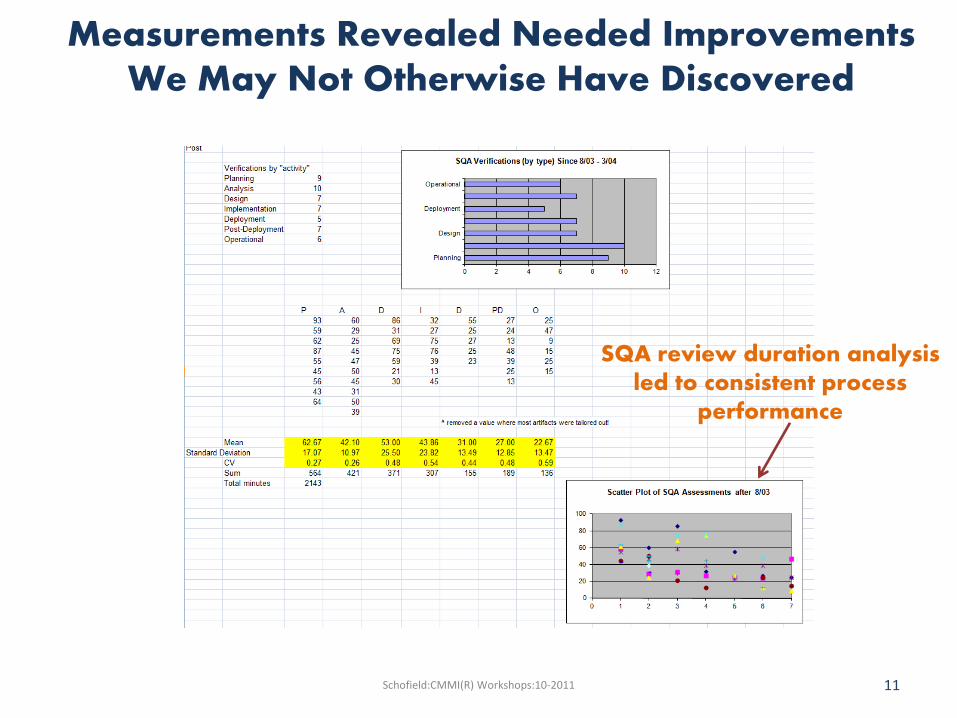
Measurements Revealed Needed Improvements We May Not Otherwise Have Discovered
Schofield:CMMI(R) Workshops:10-2011
SQA review duration analysis led to consistent process
performance
11

A Monthly Snapshot of Expected Reviews Got Leadership’s Attention
Project names “cropped” to avoid unintended
disclosure
“Links” to review evidence were helpful
for appraisals and also for management
drill down
Schofield:CMMI(R) Workshops:10-2011 12
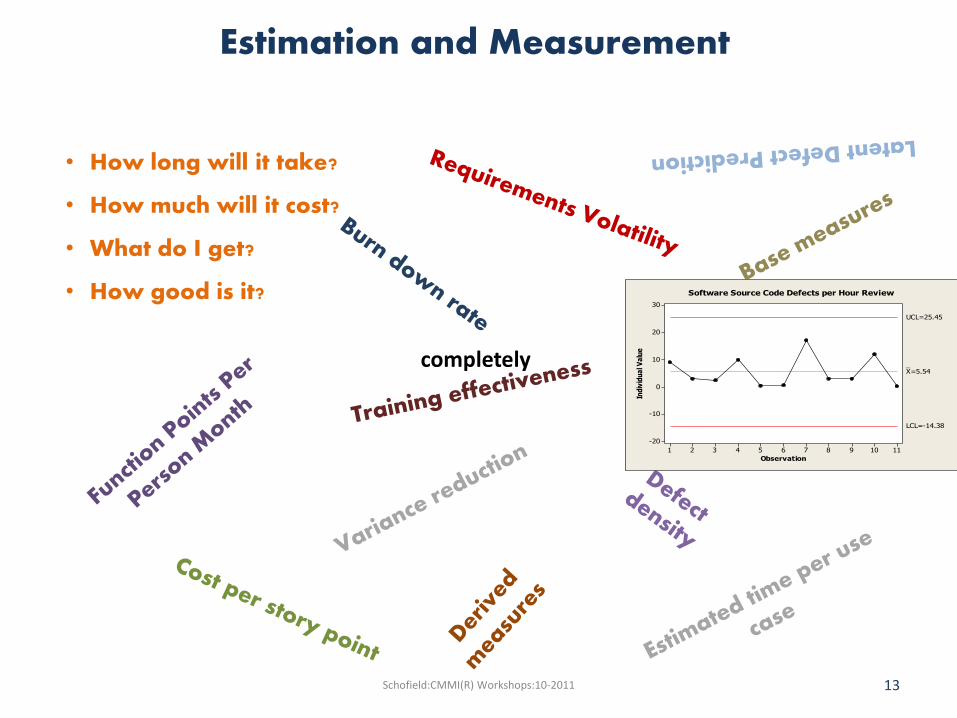
Estimation and Measurement
• How long will it take?
• How much will it cost?
• What do I get?
• How good is it?
Observation
Ind
ivid
ua
l Va
lue
1110987654321
30
20
10
0
-10
-20
_X=5.54
UCL=25.45
LCL=-14.38
Software Source Code Defects per Hour Review
Schofield:CMMI(R) Workshops:10-2011 13
completely
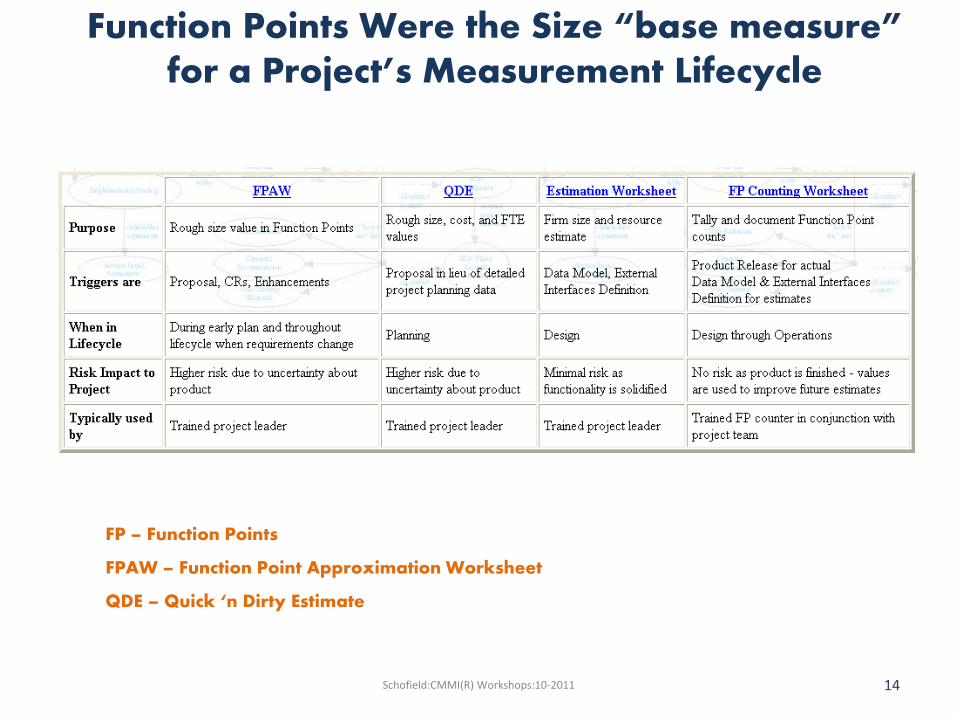
FP – Function Points
FPAW – Function Point Approximation Worksheet
QDE – Quick ‘n Dirty Estimate
Function Points Were the Size “base measure” for a Project’s Measurement Lifecycle
14 Schofield:CMMI(R) Workshops:10-2011
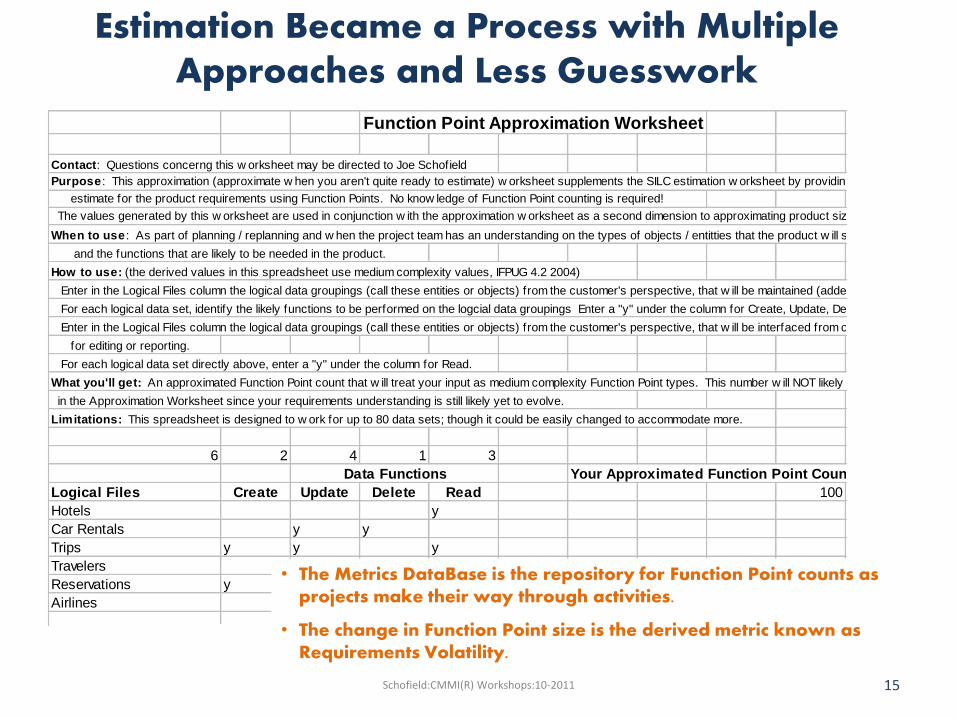
Function Point Approximation Worksheet
Contact: Questions concerng this w orksheet may be directed to Joe Schofield
Purpose : This approximation (approximate w hen you aren't quite ready to estimate) w orksheet supplements the SILC estimation w orksheet by providing a "rough" ballpark sizing
estimate for the product requirements using Function Points. No know ledge of Function Point counting is required!
The values generated by this w orksheet are used in conjunction w ith the approximation w orksheet as a second dimension to approximating product size, cost, and schedule.
When to use : As part of planning / replanning and w hen the project team has an understanding on the types of objects / entitties that the product w ill support,
and the functions that are likely to be needed in the product.
How to use: (the derived values in this spreadsheet use medium complexity values, IFPUG 4.2 2004)
Enter in the Logical Files column the logical data groupings (call these entities or objects) from the customer's perspective, that w ill be maintained (added, updated, etc.).
For each logical data set, identify the likely functions to be performed on the logcial data groupings Enter a "y" under the column for Create, Update, Delete, and Read.
Enter in the Logical Files column the logical data groupings (call these entities or objects) from the customer's perspective, that w ill be interfaced from other systems
for editing or reporting.
For each logical data set directly above, enter a "y" under the column for Read.
What you'll get: An approximated Function Point count that w ill treat your input as medium complexity Function Point types. This number w ill NOT likely match the numbers
in the Approximation Worksheet since your requirements understanding is still likely yet to evolve.
Limitations: This spreadsheet is designed to w ork for up to 80 data sets; though it could be easily changed to accommodate more.
6 2 4 1 3
Data Functions Your Approximated Function Point Count
Logical Files Create Update Delete Read 100
Hotels y
Car Rentals y y
Trips y y y
Travelers y
Reservations y y
Airlines y
• The Metrics DataBase is the repository for Function Point counts as projects make their way through activities.
• The change in Function Point size is the derived metric known as Requirements Volatility.
Estimation Became a Process with Multiple Approaches and Less Guesswork
15 Schofield:CMMI(R) Workshops:10-2011
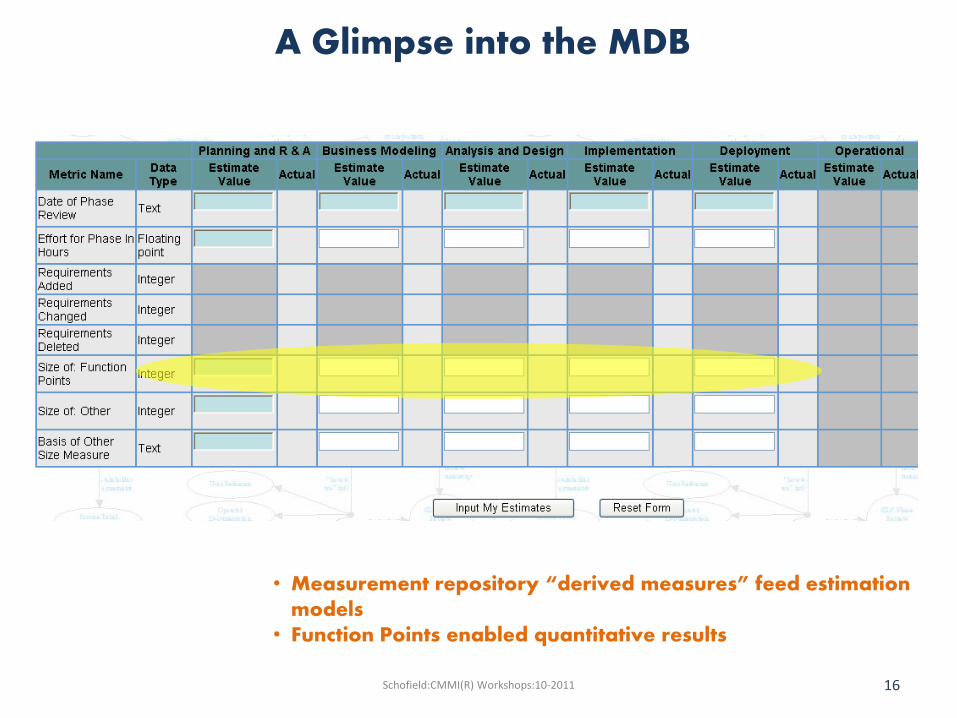
A Glimpse into the MDB
• Measurement repository “derived measures” feed estimation models
• Function Points enabled quantitative results
16 Schofield:CMMI(R) Workshops:10-2011

Estimated values are based on historic organizational performance
Quick ‘n Dirty Estimates Provided Ball Park Confidence
17 Schofield:CMMI(R) Workshops:10-2011

Project Plan Estimating WorksheetSteps: input attributes are shaded In return you receive:1person experience levels aperson experience eff iciency2person participation levels bFP contribution eff iciency Experience Factors: Expert Mature Rookie3duration in years cperson & team cost rates Technology 0.80 1.00 1.304person labor rates destimated team FPs per month Methodology 0.80 1.00 1.305SILC phase reliability variance (.4, .3, .2, .1, or 0) eestimated cycle time Application 0.80 1.00 1.306estimated size of project festimated product costs (compare to planned)7other costs (optional) goptimistic and pessimistic variance range
Experience with . . .
Resource 1Technology 1Methodology 1Application
aExperience
Eff iciency 2Participation
bFP
Contribution
Eff iciency
3Duration of
Participation
in Years
4Average
Labor Rate
cAnnual
Person Rate
cTotal
Person Cost
Person1 1.30 1.30 1.00 1.69 0.08 0.90 0.25 180,000 14,400 3,600
Person2 1.30 1.30 1.00 1.69 0.16 1.80 0.25 180,000 28,800 7,200
Person3 1.00 1.30 1.00 1.30 0.68 9.94 0.25 180,000 122,400 30,600
Person4 1.00 0.80 1.00 0.80 0.12 2.85 0.25 180,000 21,600 5,400
Person5 0.80 0.80 1.30 0.83 0.03 0.57 0.25 180,000 4,500 1,125
Person6 1.00 1.30 1.00 1.30 0.37 5.41 0.25 180,000 66,600 16,650
Totals 1.44 21.47 1,080,000 258,300 64,575
Team Avg. Monthly Eff iciency 14.96
gOptimistic Nominal gPessimistic Reliability Variances5Project Phase Reliability Variance 0.4 SILC Phase6Project Size (Estimated Function Points) 84 140 196 Plan 0.40 ILF = 28 FPs
Historic FPPPM Metric 19 19 19 Analysis 0.30 EIF = ~72 FPs
dCalculated team FPs per month (predicted) 21 21 21 Design 0.20eCycle time (months - predicted) 4 7 9 Implement. 0.10fProduct Cost (predicted) 84234 140389 196545 Operations 0.00fProduct Cost (planned) 64575 64575 645757Other Costs 0 0
Assumptions:
Optimistic column includes few er Function Points (assume over-estimated)
Pessimistic column includes more Function Points (assume under-estimated)
Historic FPPPM Metric is a historic number, it accounts for prior project experience levels, at 100% participation levels
Calculated team FPs per month is the number of FPs the team is forecasted to achieve based on team particpation and experience
Reliability Variances account for the w ider range of variation during a project at its beginning w hich narrow s tow ards its completion
Huffschmidt recommends + or - 50% at start-up. DOE "Best practices in Project Management" uses the follow ing:
Plan + / - 40%, Preliminary Design + / - 30%, Detailed Design +15 / -5% and Construction +10 / - 5%
Experience Factors: DeMarco & Lister actually found 2.5:1 ratio from top to median performers and a 10:1 ratio from top to w orst! Arbitrarily the w orksheet imposes
~ a 4:1 eff iciency ratio from best to w orst.
Participation is the percent of time spent a team member spends on this project
FP Contribution Efficiency is the number of FPs each team member is forecasted to produce during the project. It's the historic FPPPM * participation / experience eff iciency
Person Average Monthly Efficiency is the average number of FPs forecasted to be completed by each team member jrs:9510:12/20/00:v7
• Values are subject to change as the project changes!
• People resources “graded” with three experience factors
• Ranges became the norm for estimating
Measurements Were More Precise Once Specific People Resources Were Identified
18 Schofield:CMMI(R) Workshops:10-2011
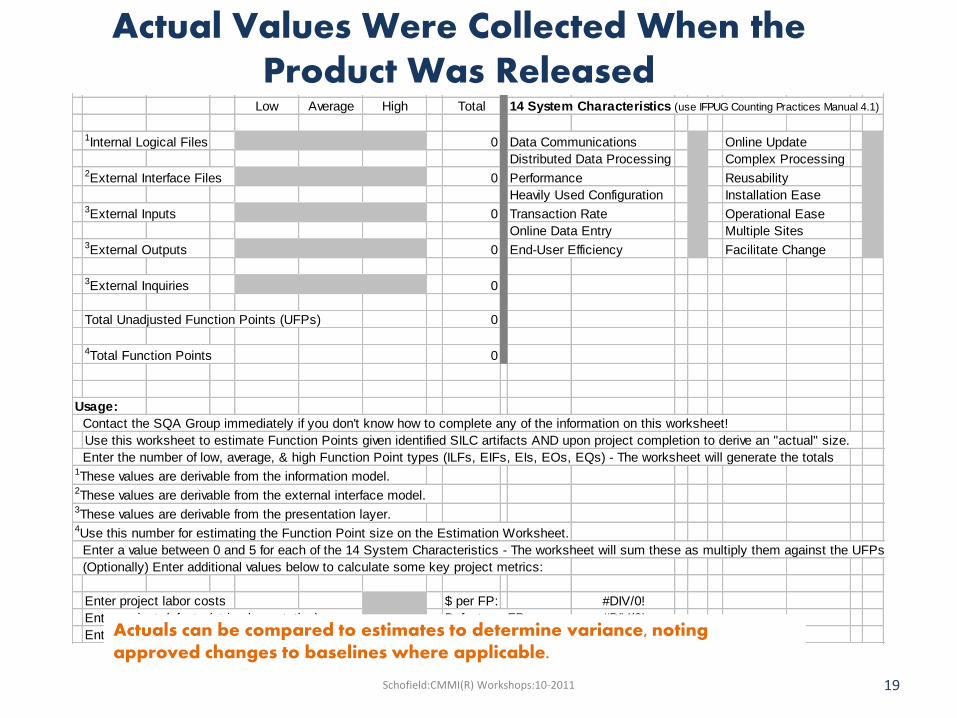
Low Average High Total 14 System Characteristics (use IFPUG Counting Practices Manual 4.1)
1Internal Logical Files 0 Data Communications Online Update
Distributed Data Processing Complex Processing2External Interface Files 0 Performance Reusability
Heavily Used Configuration Installation Ease3External Inputs 0 Transaction Rate Operational Ease
Online Data Entry Multiple Sites3External Outputs 0 End-User Efficiency Facilitate Change
3External Inquiries 0
Total Unadjusted Function Points (UFPs) 0
4Total Function Points 0
Usage:
Contact the SQA Group immediately if you don't know how to complete any of the information on this worksheet!
Use this worksheet to estimate Function Points given identified SILC artifacts AND upon project completion to derive an "actual" size.
Enter the number of low, average, & high Function Point types (ILFs, EIFs, EIs, EOs, EQs) - The worksheet will generate the totals1These values are derivable from the information model.2These values are derivable from the external interface model.3These values are derivable from the presentation layer.4Use this number for estimating the Function Point size on the Estimation Worksheet.
Enter a value between 0 and 5 for each of the 14 System Characteristics - The worksheet will sum these as multiply them against the UFPs
(Optionally) Enter additional values below to calculate some key project metrics:
Enter project labor costs $ per FP: #DIV/0!
Enter project defects (at implementation) Defect per FP: #DIV/0!
Enter project labor hours Cycle time per FP #DIV/0!Actuals can be compared to estimates to determine variance, noting approved changes to baselines where applicable.
Actual Values Were Collected When the Product Was Released
19 Schofield:CMMI(R) Workshops:10-2011
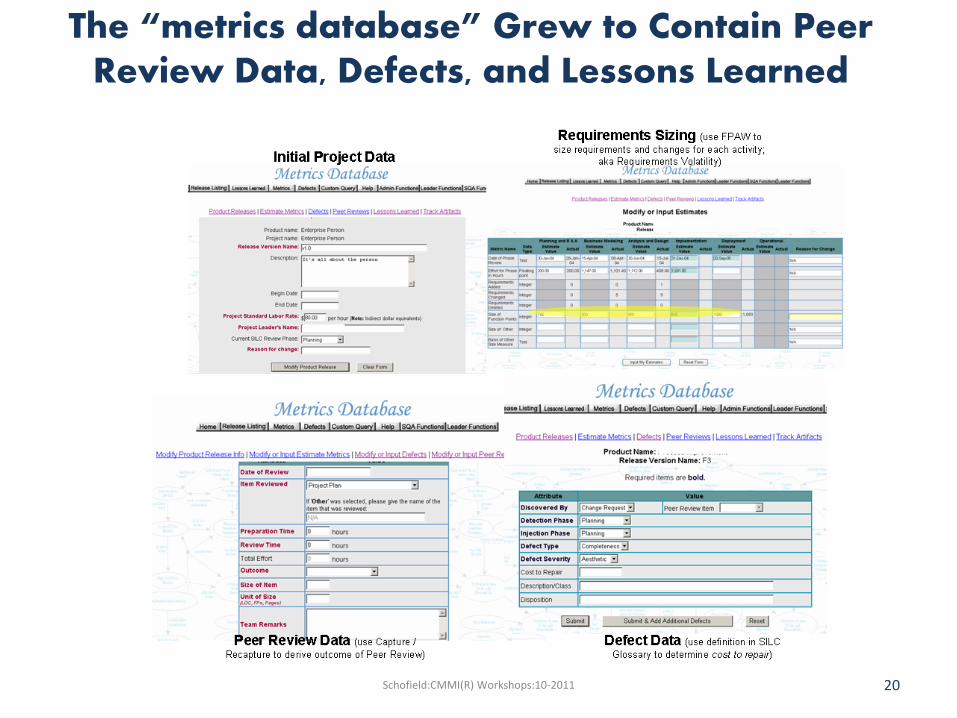
The “metrics database” Grew to Contain Peer Review Data, Defects, and Lessons Learned
20 Schofield:CMMI(R) Workshops:10-2011
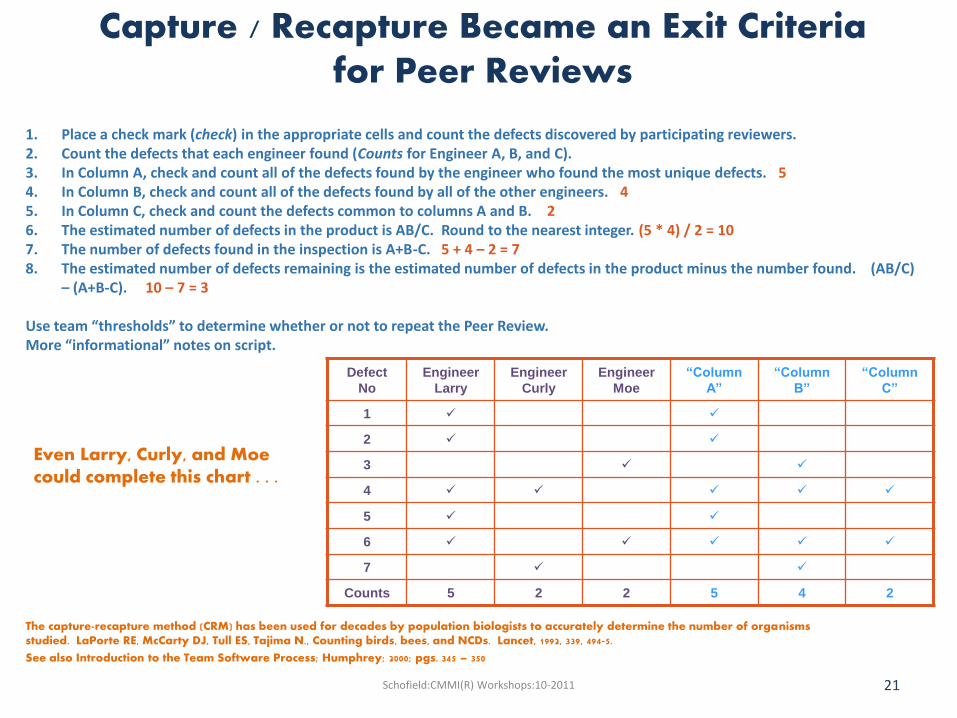
1. Place a check mark (check) in the appropriate cells and count the defects discovered by participating reviewers. 2. Count the defects that each engineer found (Counts for Engineer A, B, and C). 3. In Column A, check and count all of the defects found by the engineer who found the most unique defects. 5 4. In Column B, check and count all of the defects found by all of the other engineers. 4 5. In Column C, check and count the defects common to columns A and B. 2 6. The estimated number of defects in the product is AB/C. Round to the nearest integer. (5 * 4) / 2 = 10 7. The number of defects found in the inspection is A+B-C. 5 + 4 – 2 = 7 8. The estimated number of defects remaining is the estimated number of defects in the product minus the number found. (AB/C)
– (A+B-C). 10 – 7 = 3 Use team “thresholds” to determine whether or not to repeat the Peer Review. More “informational” notes on script.
Defect
No
Engineer
Larry
Engineer
Curly
Engineer
Moe
“Column
A”
“Column
B”
“Column
C”
1
2
3
4
5
6
7
Counts 5 2 2 5 4 2
The capture-recapture method (CRM) has been used for decades by population biologists to accurately determine the number of organisms studied. LaPorte RE, McCarty DJ, Tull ES, Tajima N., Counting birds, bees, and NCDs. Lancet, 1992, 339, 494-5.
See also Introduction to the Team Software Process; Humphrey; 2000; pgs. 345 – 350
Capture / Recapture Became an Exit Criteria for Peer Reviews
Even Larry, Curly, and Moe could complete this chart . . .
21 Schofield:CMMI(R) Workshops:10-2011

SILC I Artifact Roadmap
De
plo
ym
en
tIm
ple
me
nta
tio
nA
na
lysis
&
De
sig
n
Bu
sin
ess
Mo
de
ling
Re
qu
ire
me
nts
& A
rch
ite
ctu
reP
lan
nin
g
*IPM Plan (CM &
Risk Appendix)
Concept of
Operations
*Information
Model
Business
Process Model
Business
Motivation Model
User Process
Model
Logical Data
Model
*External
Interfaces
Document
*Internal
Components
Definition
*Test
Specification
Physical Data
Model
*Software Source
& ExecutableTest Result
User
Documentation
Operator
Documentation
Service Level
Agreement
Problem statement, scope,
resources, schedule
Change Requests
PPQA
Verifications
DAR Package
Project
Management
Report
Stakeholder
Review Result
Work Product
Inventory
Normalized
facts
Facts &
constraints Process
logic
Test criteria
Team Review
Result
Subcontractor
performancePPQA
Activities
Peer Reviews
PeCoS
data
PR
activities
All artifact
content
All artifact
content
Team
meetingsStakeholder
meetings
Team
results
Decision
criteria
Module
designs TestsLogical
tables
“use”
info
ConOps touches
every
engineering
artifact
codePhysical
tables
* denotes Peer
Reviewed Artifact
Key
Decisions
All product
content
All artifact
content
All PRed
Artifact content
Subcontractor
Evaluation
Verified
inventory
Artifact / Work Product Relationship Diagram
This diagram seemed to be displayed in most office spaces
Product (blue) and process (yellow) views are incorporated
22 Schofield:CMMI(R) Workshops:10-2011
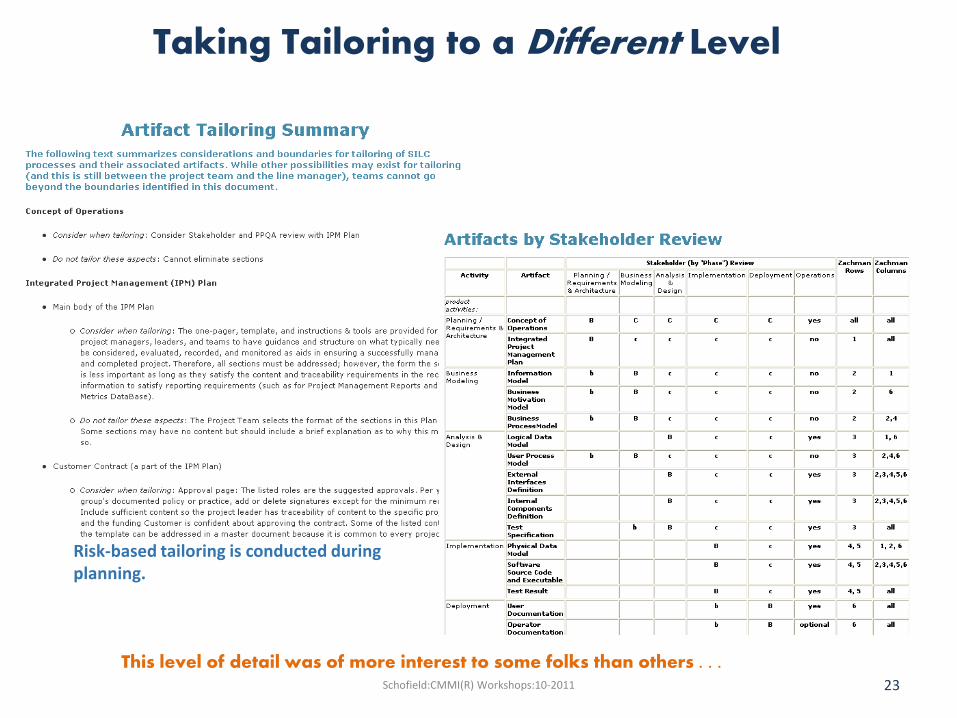
Risk-based tailoring is conducted during planning.
This level of detail was of more interest to some folks than others . . .
Taking Tailoring to a Different Level
23 Schofield:CMMI(R) Workshops:10-2011
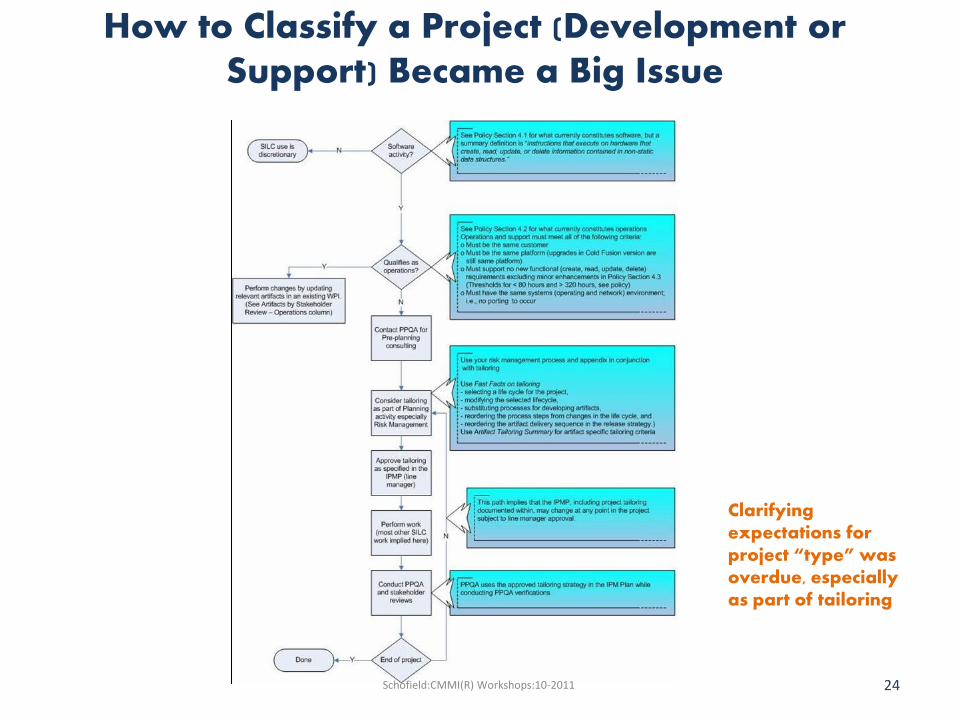
Clarifying expectations for project “type” was overdue, especially as part of tailoring
How to Classify a Project (Development or Support) Became a Big Issue
24 Schofield:CMMI(R) Workshops:10-2011

Even SCAMPI Preparations Helped Us Identify Process and Practice Gaps
An “organizational” “PIID” Schofield:CMMI(R) Workshops:10-2011 25

A project-specific “PIID”
SCAMPI Preparations cont’d
Schofield:CMMI(R) Workshops:10-2011 26

CBA IPI Results
KPA CO
1
CO
2
CO
3
AB
1
AB
2
AB
3
AB
4
AB
5
AC
1
AC
2
AC
3
AC
4
AC
5
AC
6
AC
7
AC
8
AC
9
AC
10
AC
11
AC
12
AC
13
AC
14
AC
15
ME
1
ME
2
VE
1
VE
2
VE
3
VE
4
RM S N/A N/A S S S S N/A S S S N/A N/A N/A N/A N/A N/A N/A N/A N/A N/A N/A N/A S N/A P S S N/A
SPP S S N/A S S S U N/A S S P U P S S S S S S S S P S P N/A P S S N/A
SPTO S S N/A S S S P S S S U P U P S S S S P S S N/A N/A U N/A P S U N/A
SQA S N/A N/A S S S S N/A S P P S S S S N/A N/A N/A N/A N/A N/A N/A N/A S N/A S S S N/A
SCM S N/A N/A S S S S S S S S S S S S S S U N/A N/A N/A N/A N/A P N/A S S U S
OPF S S S S S S S N/A S S S P P S S N/A N/A N/A N/A N/A N/A N/A N/A S N/A S N/A N/A N/A
OPD S N/A N/A S S N/A N/A N/A U S S S S S N/A N/A N/A N/A N/A N/A N/A N/A N/A S N/A S S S N/A
TP P N/A N/A S S S P N/A S U S P P S N/A N/A N/A N/A N/A N/A N/A N/A N/A P P P U U N/A
ISM S N/A N/A S U P N/A N/A P S S U P U U P U U P N/A N/A N/A N/A U N/A P S P N/A
SPE S N/A N/A S U S S N/A S S S S P U S S P U N/A N/A N/A N/A N/A P S P S S N/A
IC S N/A N/A S S S S S S S P P P P S N/A N/A N/A N/A N/A N/A N/A N/A U N/A S S S N/A
PR S N/A N/A S S U N/A N/A S U P N/A N/A N/A N/A N/A N/A N/A N/A N/A N/A N/A N/A P N/A S N/A N/A N/A
20
03
Ouch!
World’s most . . .
Good day; note OPF & SQA
27 Schofield:CMMI(R) Workshops:10-2011
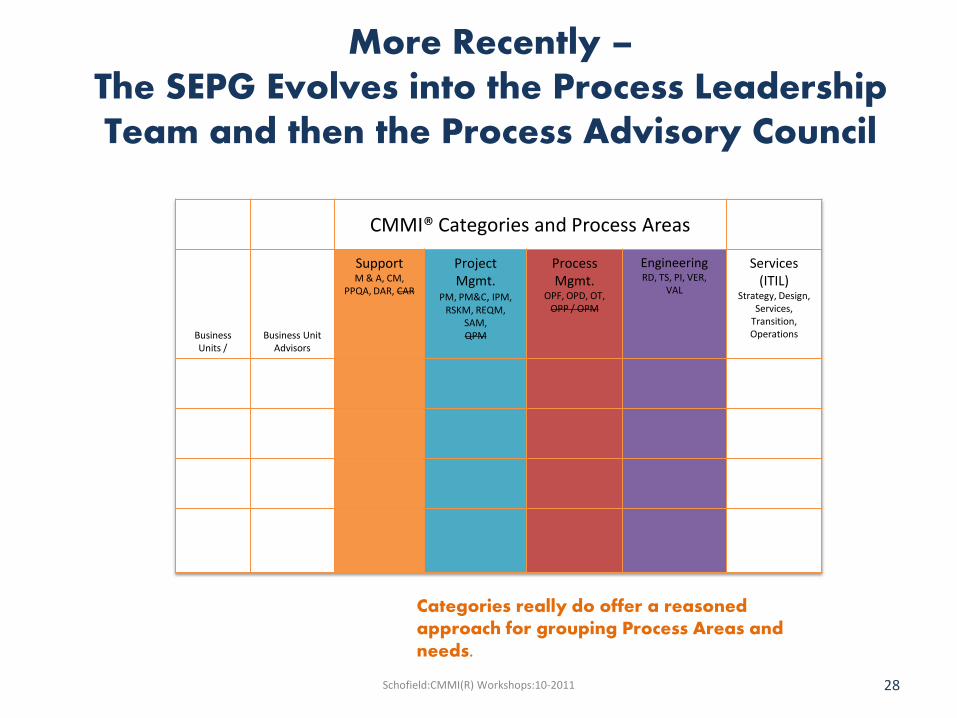
CMMI® Categories and Process Areas
Business Units /
Business Unit Advisors
Support M & A, CM,
PPQA, DAR, CAR
Project Mgmt.
PM, PM&C, IPM, RSKM, REQM,
SAM, QPM
Process Mgmt.
OPF, OPD, OT, OPP / OPM
Engineering RD, TS, PI, VER,
VAL
Services (ITIL)
Strategy, Design, Services,
Transition, Operations
More Recently – The SEPG Evolves into the Process Leadership Team and then the Process Advisory Council
Categories really do offer a reasoned approach for grouping Process Areas and needs.
Schofield:CMMI(R) Workshops:10-2011 28
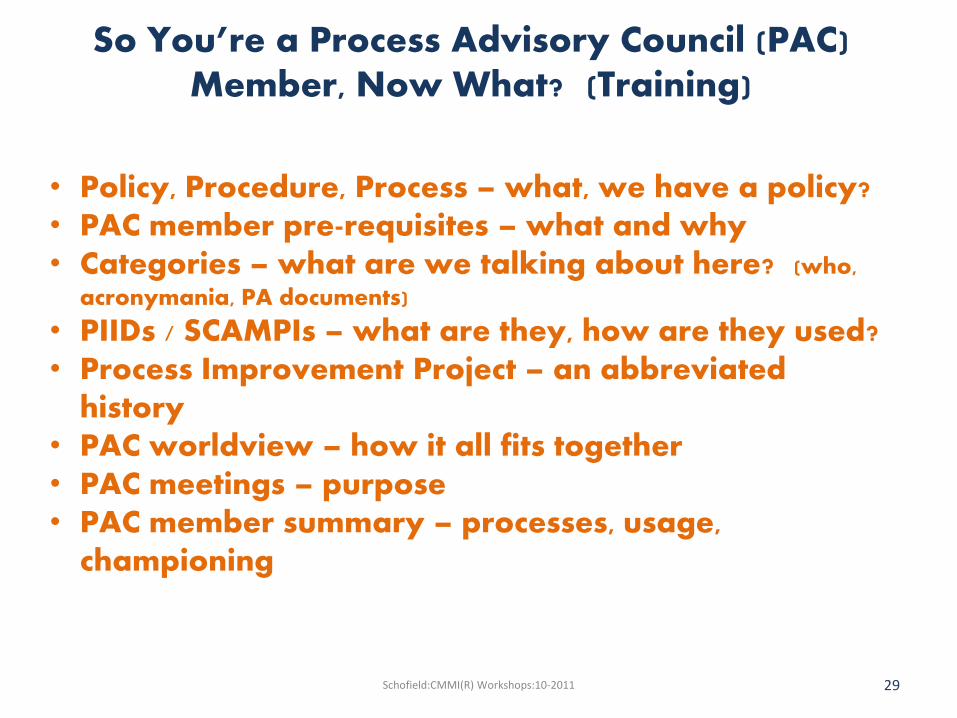
So You’re a Process Advisory Council (PAC) Member, Now What? (Training)
• Policy, Procedure, Process – what, we have a policy? • PAC member pre-requisites – what and why • Categories – what are we talking about here? (who,
acronymania, PA documents)
• PIIDs / SCAMPIs – what are they, how are they used? • Process Improvement Project – an abbreviated
history • PAC worldview – how it all fits together • PAC meetings – purpose • PAC member summary – processes, usage,
championing
29 Schofield:CMMI(R) Workshops:10-2011
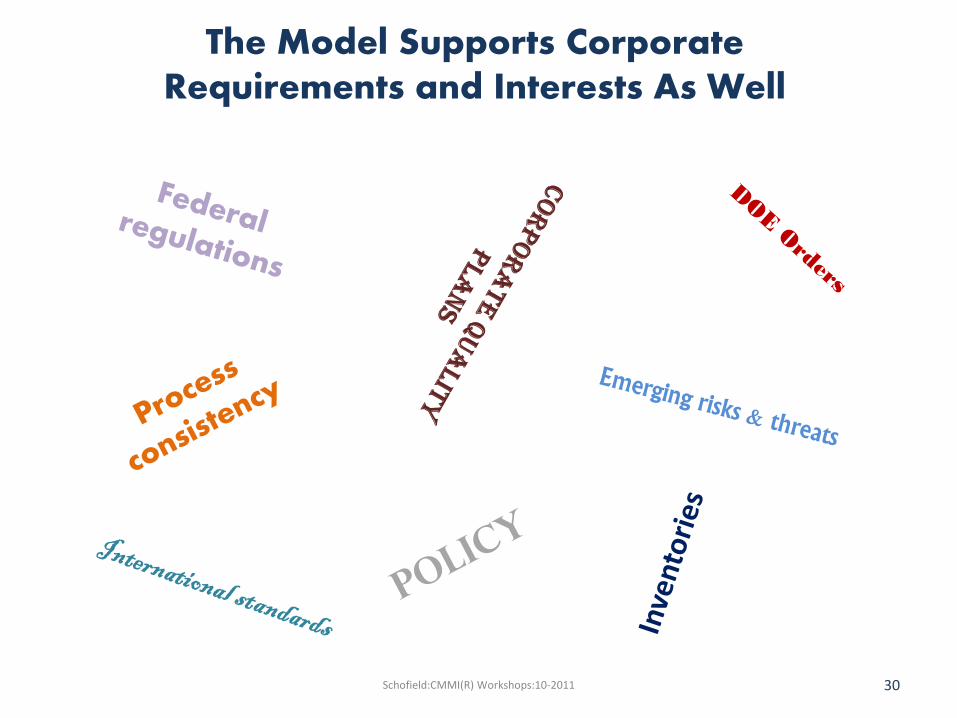
The Model Supports Corporate Requirements and Interests As Well
Schofield:CMMI(R) Workshops:10-2011 30
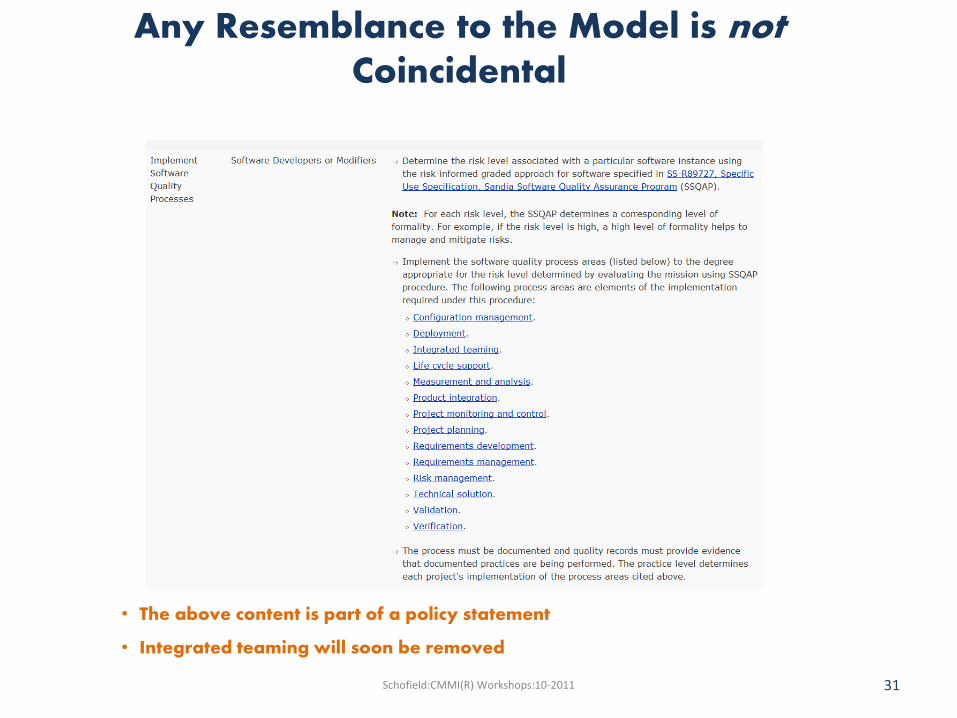
• The above content is part of a policy statement
• Integrated teaming will soon be removed
Any Resemblance to the Model is not Coincidental
Schofield:CMMI(R) Workshops:10-2011 31

Configuration Management Deployment Integrated Teaming Life Cycle Support Measurement and Analysis Product Integration Project Monitoring and Control Project Planning Requirements Development Requirements Management Risk Management Technical Solution Validation and Verification
Software Quality Global Practices CPS software quality policies, processes, and procedures (e.g., IM100.3.5) also describe six global practices that are associated with each software quality process area. Each global practice should be implemented within each process area. The descriptions provided below for the global practices and the questions in the second section of the SAI questionnaire in Appendix B are intended to provide insight for the self-assessor. Stakeholder Involvement The purpose of identifying relevant stakeholder involvement (SI) is to establish and maintain expected involvement throughout the process. Collecting Improvement Information The purpose of collecting improvement information (CI) is to improve planning and performance. This information may also point to improvements needed in the process itself. Objective Evaluations The purpose of objective evaluations (OE) is to provide credible assurance that the process is implemented as planned and follows process descriptions and procedures. Quantitative Objectives The purpose of identifying quantitative objectives (QO) is to, establish quantitative measurements that will enable stable subprocess performance. Quantitative objectives should be identified as determined by the business needs of the project or organization. Role-based Training The purpose of role-based training (TR) is to ensure that teams have the needed skills and expertise to perform. Problem Reporting and Corrective Action The purpose of problem reporting and corrective action (PR) is to ensure processes for 1) assessing process and project status, 2) escalating issues, and 3) taking and tracking needed action.
Process Areas
The CMMI® Model Provides a Taxonomy for Development Practices
Schofield:CMMI(R) Workshops:10-2011 32
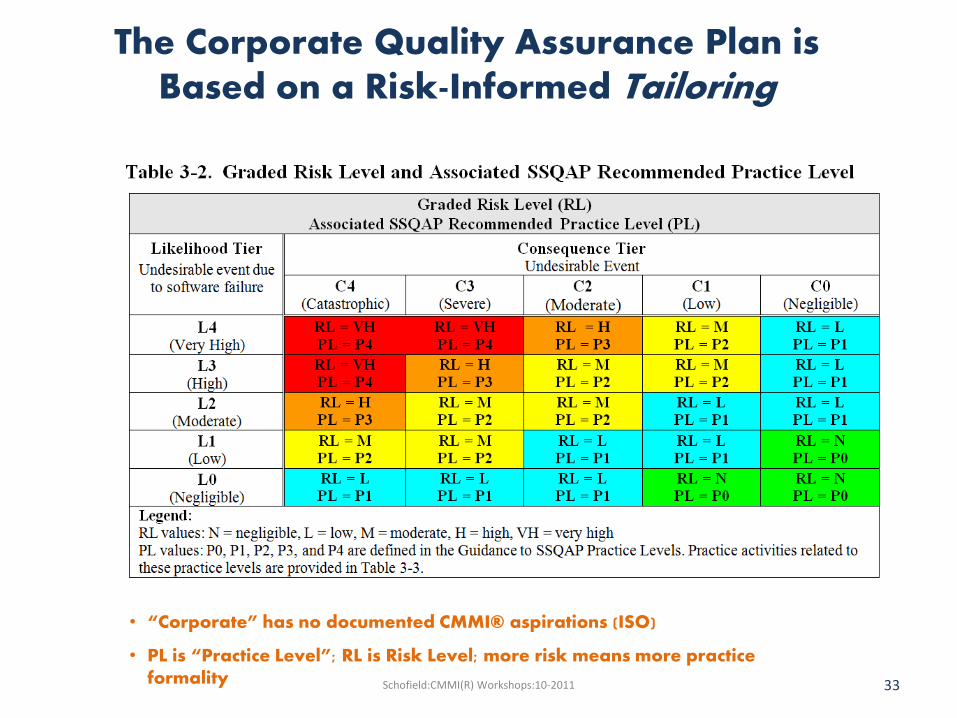
The Corporate Quality Assurance Plan is Based on a Risk-Informed Tailoring
• “Corporate” has no documented CMMI® aspirations (ISO)
• PL is “Practice Level”; RL is Risk Level; more risk means more practice formality Schofield:CMMI(R) Workshops:10-2011 33
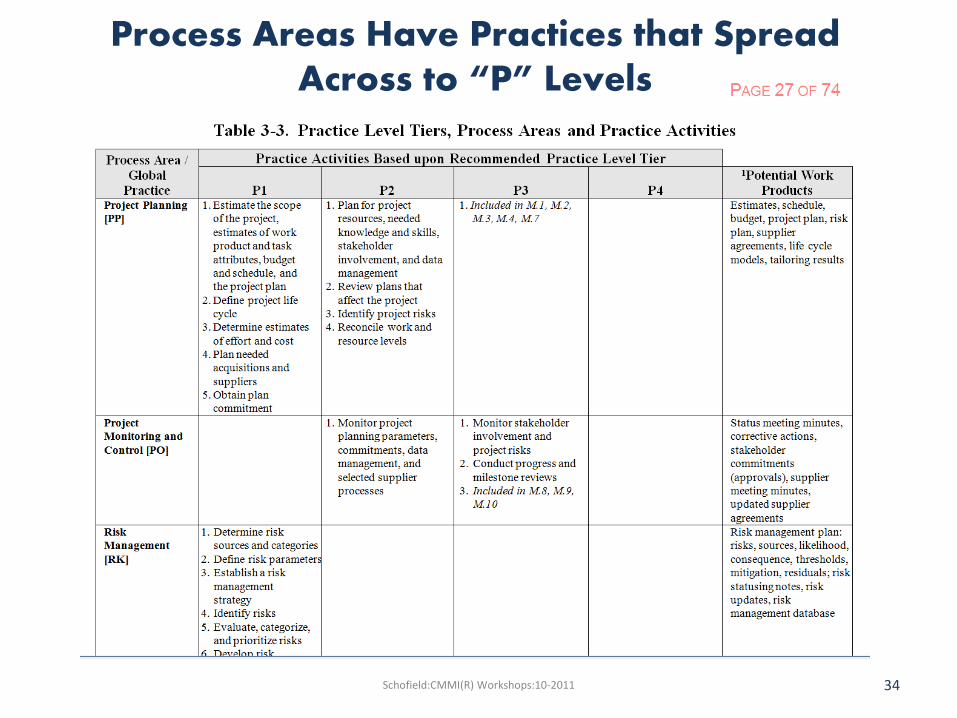
Process Areas Have Practices that Spread Across to “P” Levels
Schofield:CMMI(R) Workshops:10-2011 34
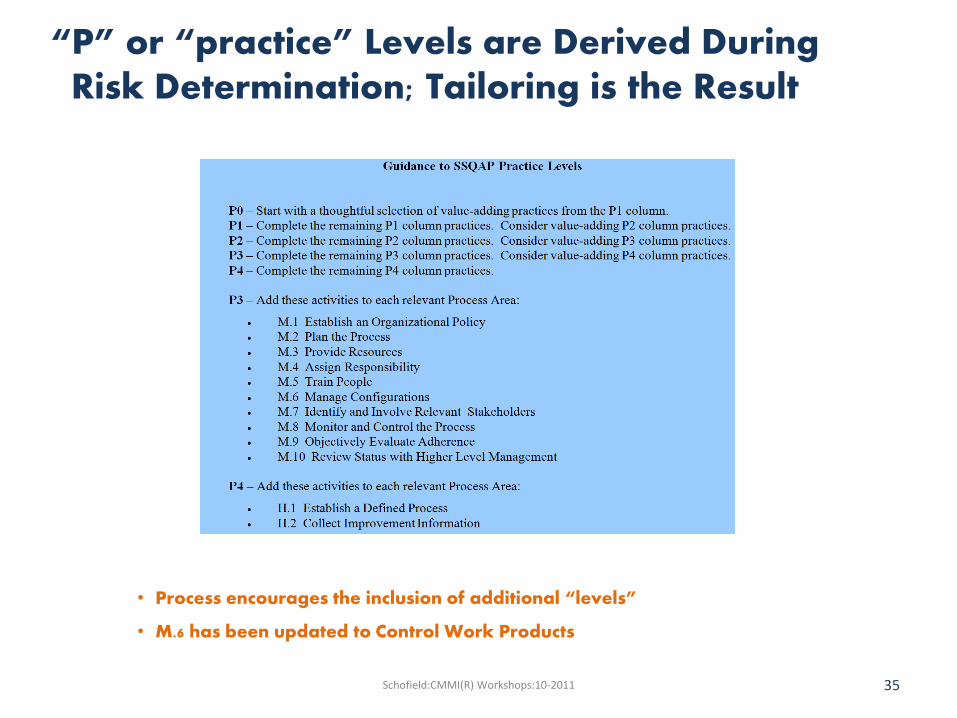
• Process encourages the inclusion of additional “levels”
• M.6 has been updated to Control Work Products
“P” or “practice” Levels are Derived During Risk Determination; Tailoring is the Result
Schofield:CMMI(R) Workshops:10-2011 35

Self-assessments Against Practices Enable Teams to “Self-check”
• “yes,” most teams think too highly of themselves
• Note cross-reference to practices in blue
• Evidence columns allow teams to understand the veracity of their practice performance, and, to prep for appraisals
Schofield:CMMI(R) Workshops:10-2011 36
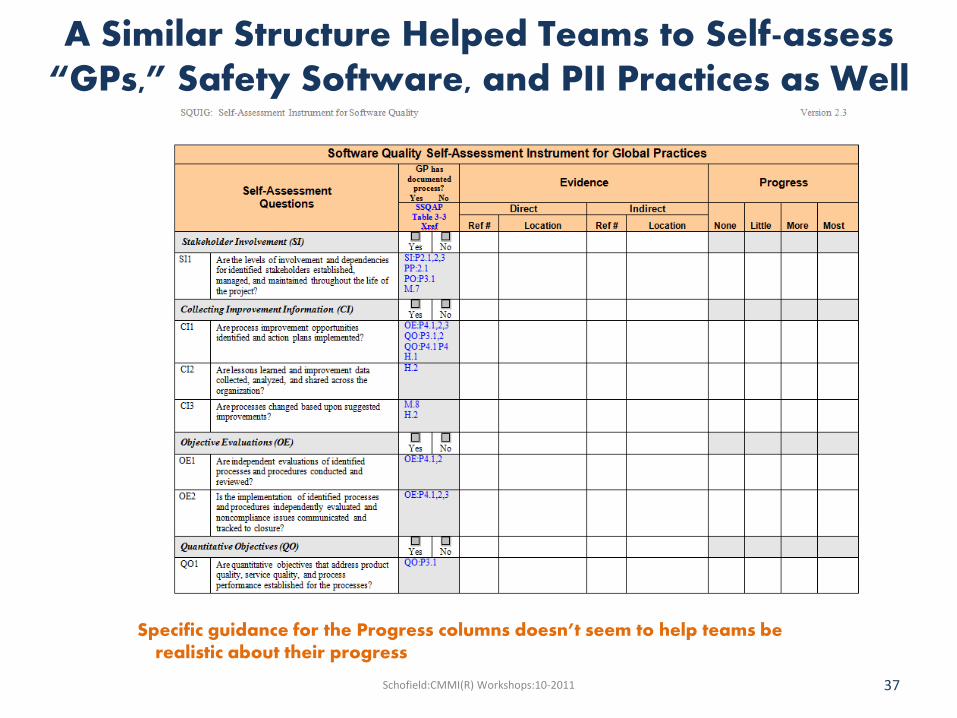
Specific guidance for the Progress columns doesn’t seem to help teams be realistic about their progress
A Similar Structure Helped Teams to Self-assess “GPs,” Safety Software, and PII Practices as Well
Schofield:CMMI(R) Workshops:10-2011 37
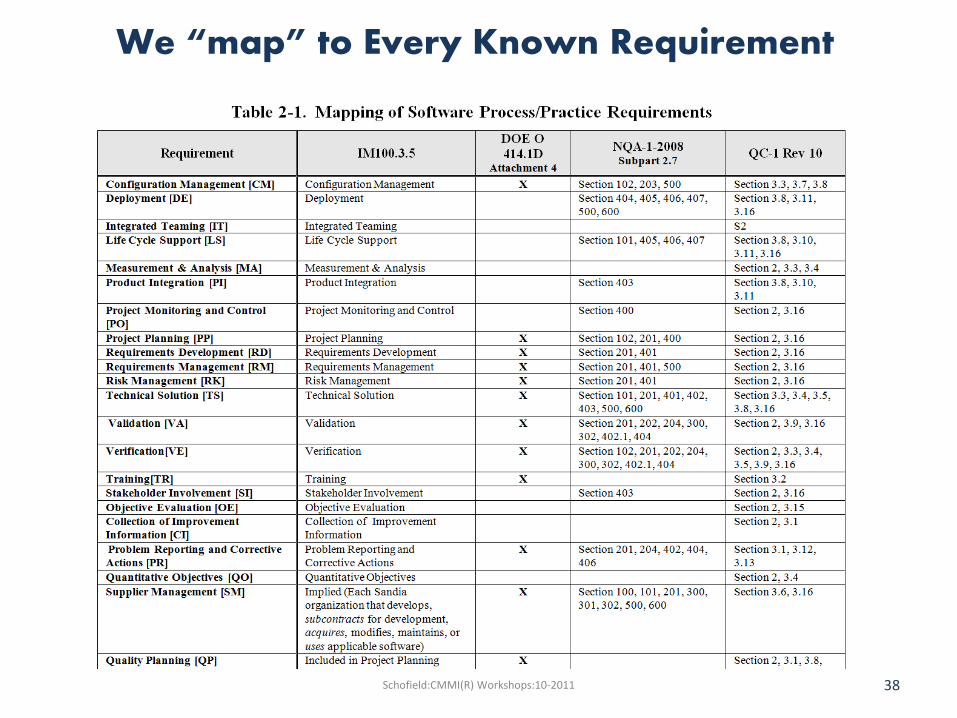
We “map” to Every Known Requirement
Schofield:CMMI(R) Workshops:10-2011 38

• Policy and governance • Sponsors and regulation interpretation • “Parent” company confidence • Transitions from Peer Reviews to VER, estimated defect prediction • Certified appraisers and instructors within the organization and the
corporation • Pilot projects are purposeful, not “as reckless” • Processes beyond the CMMI-DEV model (OCTAVE and RMM) • New Mexico SPIN • Everything’s a DAR now . . . even if not a DAR
And today . . . The Model Impacts:
Schofield:CMMI(R) Workshops:10-2011 39
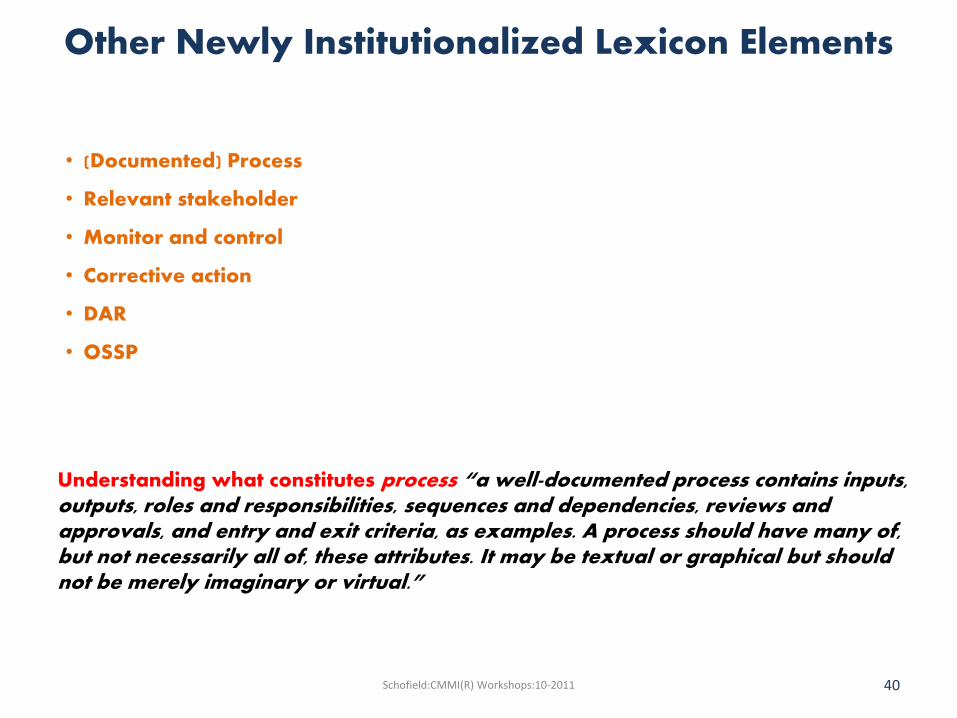
• (Documented) Process
• Relevant stakeholder
• Monitor and control
• Corrective action
• DAR
• OSSP
Other Newly Institutionalized Lexicon Elements
Understanding what constitutes process “a well-documented process contains inputs, outputs, roles and responsibilities, sequences and dependencies, reviews and approvals, and entry and exit criteria, as examples. A process should have many of, but not necessarily all of, these attributes. It may be textual or graphical but should not be merely imaginary or virtual.”
Schofield:CMMI(R) Workshops:10-2011 40
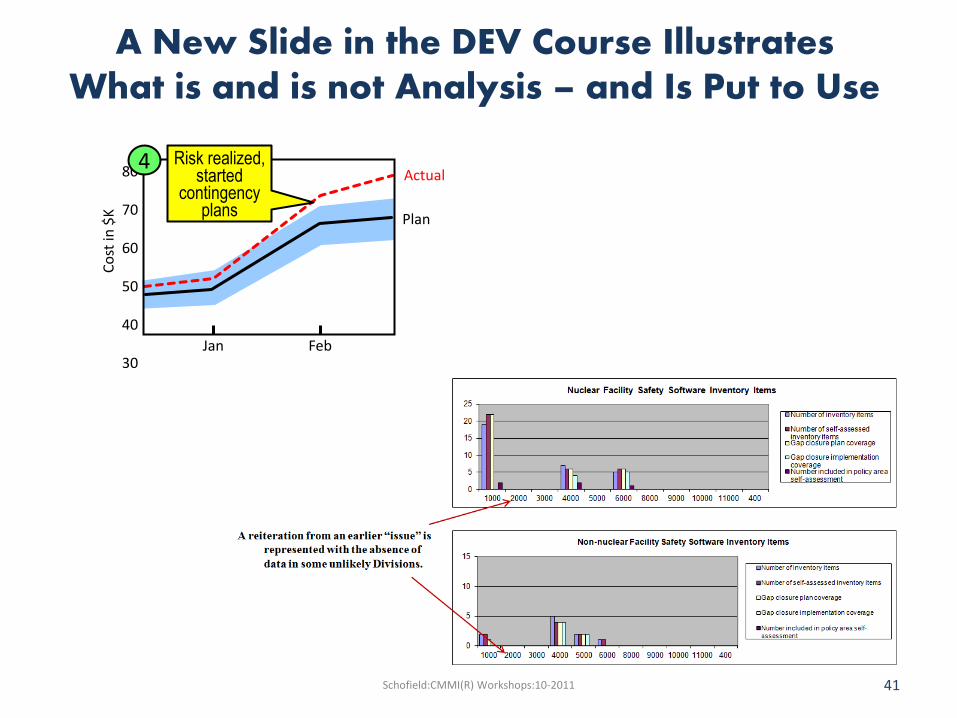
A New Slide in the DEV Course Illustrates What is and is not Analysis – and Is Put to Use
Plan
Actual
Jan Feb
Co
st in
$K
80
70
60
50
40
30
Risk realized, started
contingency plans
4
Schofield:CMMI(R) Workshops:10-2011 41
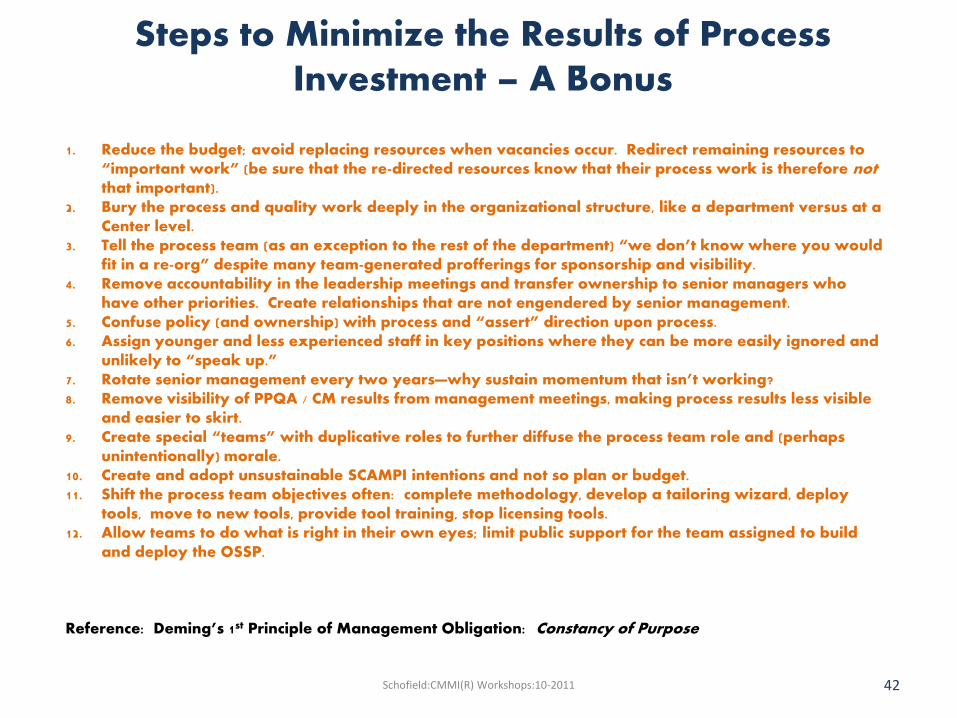
1. Reduce the budget; avoid replacing resources when vacancies occur. Redirect remaining resources to “important work” (be sure that the re-directed resources know that their process work is therefore not that important).
2. Bury the process and quality work deeply in the organizational structure, like a department versus at a Center level.
3. Tell the process team (as an exception to the rest of the department) “we don’t know where you would fit in a re-org” despite many team-generated profferings for sponsorship and visibility.
4. Remove accountability in the leadership meetings and transfer ownership to senior managers who have other priorities. Create relationships that are not engendered by senior management.
5. Confuse policy (and ownership) with process and “assert” direction upon process. 6. Assign younger and less experienced staff in key positions where they can be more easily ignored and
unlikely to “speak up.” 7. Rotate senior management every two years—why sustain momentum that isn’t working? 8. Remove visibility of PPQA / CM results from management meetings, making process results less visible
and easier to skirt. 9. Create special “teams” with duplicative roles to further diffuse the process team role and (perhaps
unintentionally) morale. 10. Create and adopt unsustainable SCAMPI intentions and not so plan or budget. 11. Shift the process team objectives often: complete methodology, develop a tailoring wizard, deploy
tools, move to new tools, provide tool training, stop licensing tools. 12. Allow teams to do what is right in their own eyes; limit public support for the team assigned to build
and deploy the OSSP. Reference: Deming’s 1st Principle of Management Obligation: Constancy of Purpose
Steps to Minimize the Results of Process Investment – A Bonus
Schofield:CMMI(R) Workshops:10-2011 42

Implications for:
Process variation
Product variation
Excess WIP
Added steps
Added materials
Added labor
Further variation
C-sat
Any parallels for software?
Process Orientation for Breakfast
43 Schofield:CMMI(R) Workshops:10-2011

The “Paths” and Journeys are not the same for all Groups
I hope you enjoyed this one! Thank you! 44 Schofield:CMMI(R) Workshops:10-2011