group risk report 2010 - arbejdernes landsbank · arbejdernes landsbank | group risk report 2010...
TRANSCRIPT

Group Risk Report 2010
A K T I E S E L S K A B E T
CVR-nr. 31 46 70 12, København
Panoptikonbygningen
Vesterbrogade 5 · 1502 København V
Telefon 38 48 48 48 · www.a l -bank.dk
CVR-nr. 31 46 70 12, Copenhagen

02
Group Risk Report for Arbejdernes Landsbank 2010
3 Overall risk management
4 Credit risk on loans to customers
5 Largest customer credit risks
7 Customer credit risks broken down by segments
10 Systems for risk reporting,
measurement and monitoring
12 Policies to hedge and reduce customer risks
13 Activities in AL Finans A/S
15 Credit risk on credit institutions
16 Write-downs and provisions
on loans and guarantees
18 Counterparty risk
19 Market risk
20 Liquidity risk
21 Interest-rate risk outside the trading portfolio
21 Shares etc. outside the trading portfolio
22 Operational risk
23 Business risk
23 Property risk
23 Consolidation
24 Capital base
25 Solvency need
26 Solvency requirements
27 Exposure categories

Arbejdernes Landsbank | Group Risk Report 2010
Overall risk management
In order to ensure that Arbejdernes Landsbank remains a strong financial unit for both the owners of the Bank and its customers, it is important that the Bank is aware of and controls various risks.
Risk management in general aims at ensuring that the Bank obtains sufficient earnings on an ongoing basis – and thus consolidation – in order to provide a strong basis for performance of its business activities.
The basis for overall risk management at Arbejdernes Landsbank is in part:
• Written instructions from the Board of Directors, including “Instructions for segregation of responsi-bilities between the Board of Directors and the Executive Management of Aktieselskabet Arbejdernes Landsbank” (Instruks for arbejdsfordelingen mellem bestyrelsen og direktionen i Aktieselskabet Arbejdernes Landsbank) with the associated “Instructions for reporting to the Board of Directors of Aktieselskabet Arbejdernes Landsbank” (Instruks for rapportering til bestyrelsen i Aktieselskabet Arbejdernes Landsbank).
• An Audit Committee established by the Board of Directors which assesses whether the company’s internal control system, and its internal audit, risk and security systems are working effectively.
• Meetings of the Executive Management, where instructions on specific corporate decisions are specified, and other risks that the Bank is affected by are assessed.
• Frequent reports on results, business areas, key figures and ratios, as well as relevant risk targets.
Management of risks directly associated with bank business is through regular follow-up by the Bank’s Credit Department of guarantees, loans and credits booked by the Bank’s branches, and carrying out risk analyses as well as developing and maintaining credit monitoring tools. Internal Risk Management and Control under the auspices of the Bank’s Treasury Division, LIFI (Liquidity and Finance Department) performs regular monitoring of the Bank’s compliance with section 152 of the Financial Business Act, which stipulates a number of requirements for the Bank’s liquidity. In addition, monitoring is to ensure compliance with instructions and guidelines covering counterparty and market risks. The Board of Directors receives monthly and quarterly reports on the extent of risks accepted for the period. Internal Risk Management and Control and the Treasury Division refer directly to the Executive Management of the Bank.
The Credit Department ensures compliance with the credit policy and coordinates branch contact as well as credit advisory services for processing individual cases.
LIFI ensures compliance with the investment strategy and coordinates branch contact and advisory services on complicated business transactions.
The Bank’s Accounting Department follows up the operating financial developments arising from business decisions.
On the basis of systematic reporting of the risks of relevant business areas, the necessary action is ensured to correct business developments as required, and to ensure that risks accepted are in accordance with resolutions adopted.
Bank funding is primarily from deposits, which remain larger than our lending. In order to satisfy
Figure 1
Organisational chartfor risk management
Credit Department
Trading/Portfolio/Mortgage-CreditBranches/Mortgage-Credit/Department
LIFI
Compliance Executive Management Executive Management Control Function- Credit risk- Market risk- Liquidity risk
Audit CommitteeBoard of Directors
Accounting Department
Internal audit
03

04
our desire for around 100 per cent excess coverage of the liquidity requirement mentioned in the Danish Financial Business Act, bank funding is supplemented by liquidity from domestic and foreign cooperation partners. To ensure adequate funding for the Bank, Arbejdernes Landsbank has in 2010 applied for and been granted a state-guarantee under “Bank Package II” for funding in addition to the equity and capital base of up to DKK 5.6 bn. or EUR 750 mill., of which approx. DKK 5 bn. is utilized.
If exposures in new areas are under consideration, the nature and scope of these are discussed at the daily meetings of the Executive Management before a recommendation is made to the Board of Directors, either to enter into specific business or to adjust previously completed instructions.
Every endeavour is made to maintain up-to-date IT systems in order to be able to support risk management and quantify the size of risks to which the Group is exposed at any time.
Assessment of the effects of the total Group risks is carried out at least once a year in connection with preparation of proposals for the Board of Directors of the Bank on annual budget and solvency need as well as stipulation of the level of adequate base capital.
Credit risk on loans to customersCredit risk is defined as the risk that a customer is unable to make payments in accordance with a loan agreement. The risk covers the entire spectrum, from a customer being unable to pay on time, to a customer ultimately being declared bankrupt. For each loan the Bank must consider a customer’s ability to meet his or her commitments. The Bank enters into loan agreements with customers for whom there is a very small probability of failure to make payments.
Credit-risk is the largest risk item in the Bank’s risk statement and amounted to 75 per cent at the end of 2010, see table 21 “Solvency requirement broken down by exposure categories”. The Bank has allocated the most funds to this item in order to meet unforeseen losses. Therefore it is appropriate to maintain the largest possible spread in the portfolio. Overall, the credit risk of the Bank has increased as a result of the current economic situation. This is recognised in the Bank’s calculated solvency need. However, the quality of the loans is still deemed to be satisfactory, due in part to the large spread within the portfolio. The following is a description of the Bank’s practice in the credit area and the composition of the portfolio.
Strategies and procedures to manage customer credit risks
The Bank provides all types of advice on loans, credits and guarantees for private customers, associations as well as small and medium-sized Danish enterprises. Today the Bank has a large private customer base and with “Vision 2012” it wants to instigate sustainable growth within both the private customer and corporate customer areas. In order to provide the best advice, it is a matter of course that the Bank has good insight into the overall financial situation of its customers. Insight into customers’ finances is also necessary to enable assessment of the risks in the individual exposure.
The Bank’s practice with regard to credit is based on a number of policies, instructions and business procedures to measure and manage credit risks. Approval by the Bank of a loan or credit is given on the basis of an assessment of the customer’s financial ability and desire to manage the repayment terms of the loan/credit. Approval of a loan is limited by authorities documented in authorisation instructions for individual employees for the respective lending areas. Authorisation to grant loans is built on a hierarchical framework so that larger exposures are always approved by the Credit Department and/or the Bank management.
The Bank has introduced objective rating codes to assess the credit quality of its portfolio of customers. The rating code is an objective credit rating code which is used as control tool in the regular monitoring of exposures. The code is used as an indication of the extent to which the Bank wishes to expand its exposures with the relevant customer. Rating codes are based on point intervals where customers are awarded points on the basis of registered customer data and behaviour. These parameters are compatible with parameters included in the credit rating categories of the Danish FSA. Rating codes are from 1-10. Rating code 1 is the best and 10 is the poorest. • Rating codes 1-4 are exposures with good credit quality.
• Rating codes 5-8 are exposures that require stricter monitoring and where customers should only be allowed to take up more loans to a very limited extent.
• Rating codes 9-10 are exposures with poor credit quality. Such customers will to some extent be written down.
Regardless of the customer’s rating code, individual credit decisions, whether they be on new loans or existing loans, are always based on the bank’s customer assessments. Accordingly, individual credit ratings will always consist of an objective and a subjective part.
Arbejdernes Landsbank | Group Risk Report 2010
The basis for the decision depends on the type of loan as well as the scope and complexity of the matter.
The risk environment
In 2010, the number of bankruptcies in Denmark continued to rise and the number of bankruptcies for the year was at a record level. In 2010, the number of compulsory sales continued to increase despite low nterest rates expected to keep down the actual number of compulsory sales. The number of compulsory sales is therefore expected to rise in 2011 on the grounds of societal developments and potential interest-rate increases. Unemployment among individual persons rose but remains low compared with previous periods of economic recession.
Unemployment is a direct threat to the ability of private borrowers to repay their loans and an indirect threat to the individual company’s ability to pay because, all else being equal, demand will drop off. In contrast, tax cuts in 2010 and historically low interest-rates are giving a large number of private customers better financial flexibility than previously.
The Bank expects the negative trend to continue to affect the credit quality of customers negatively but not with the same force experienced in 2010. It has been estimated that the total portfolio of the Bank will remain very satisfactory and with a good spread/ distribution curve in rating codes, see table 1.
Table 1Total portfolio by rating codes
Rating code
Gross loans and guarantees at the end of 2010 DKK ’000
1 652,1192 1,914,1363 2,794,2294 8,200,5535 2,636,9916 1,311,2567 706,6178 228,7549 1,022,960
10 392,091Total 19,859,706
Note: This calculation is based on the balance of the customer. The figures are excluding loans to credit institutions but including the Bank’s loans to subsidiary companies. The figures are including loans to the Private Contingency Association.
The importance of the Bank’s portfolio is mentioned in the review of the individual segments.
Largest customer credit risks
Key customer exposures of more than DKK 10 mill. amounted to 24 per cent of total customer loan exposures, measured as total loans and guarantees at the end of 2010. Break-down of exposures of more than DKK 10 mill. is shown in table 2.
Table 2Break-down of exposures of more than DKK 10 mill. by intervals of exposures
BalanceDKK ’000
Number
DKK 10-25 mill. 769,758 67DKK 25-50 mill. 734,629 25DKK 50-100 mill. 342,276 8>DKK 100 mill. 2,966,513 23Total 4,813,176 123
Note: The figures are calculated according to section 145 of the Danish Financial Business Act and include guarantees. The calculation excludes credit institutions which are included separately under “Credit risk on credit institutions”. The Private Contingency Association and loans to the Bank’s subsidiary companies are not included in the calculation. The calculation principles is changed compared with the previous year and therefore it is not possible to make a comparison with the calculation in the Risk Report for 2009.
05

06
The Bank’s policy is also to be independent of single deals. Therefore, the wish is to keep the number of exposures corresponding to 10 per cent of the Bank’s capital base or more at a low level. The Bank’s current and previous large loans were characterised by a relatively large amount of loans to credit institutions, see figure 2.
Please note that the financial ratio “Sum of large exposures”, i.e. the sum of section 145 exposures after deduction, which is higher than or equal to 10 per cent of the capital base at group level was calculated at 125 per cent of capital base at the end of 2010, including loans to credit institutions. This corresponds to a total exposure of approx. DKK 3.6 bn. According to the Bank’s policy the sum of large exposures must not exceed 125 per cent of the Bank’s capital base, excl. credit institutions.
For further information about credit institutions, see “Credit risk on credit institutions” on page 15.
Credit quality in the portfolio of exposures of more than DKK 10 mill. is relatively good. Thus 69 per cent of
large exposures broken down by the first four rating categories are assessed by the Bank to be of good credit quality. Table 3 illustrates exposures of more than DKK 10 mill., broken down by rating codes. The table shows that a small proportion of the total exposure are customers with poor credit quality (rating codes 9-10).
Table 3Customers with debit exposures of more than DKK 10 mill. broken down by rating Rating code Per cent
1 102 223 174 205 116 27 48 09 12
10 2Total 100
Development in the key financial ratio ”Sum of large exposures”
140
120
100
80
60
40
20
0
Per
cent
of c
apita
l bas
e
2005 2006 2007 2008 2009 2010
Total Other Credit institutions
Note: The figures are calculated on the basis of reported values of exposures greater than or equal to 10 per cent of the capital base. The increase in large exposures is due to new regulations on calculation of credit institutions.
Figure 2

Arbejdernes Landsbank | Group Risk Report 2010 07
Customer credit risks broken down by segments The overall credit risk is managed in accordance with policies and frameworks adopted and stipulated by the Bank’s Board of Directors and Executive Management. The Bank’s Credit Department lays down the framework for risk and collateralisation in its procedures.
Credit authorisation is delegated so that most decisions can be made by the individual branches. Large and particularly complicated credit relations are dealt with in close cooperation with the Credit Department.
Figure 3 shows the Bank’s exposure on significant customer segments, measured by balance (loans and guarantees). The Bank is characterised by holding a lower share of “Corporate customers”, a higher share of “Private customers with cooperative property” and a higher share of “Associations etc.” than comparative banks. The break-down of portfolio is largely unchanged compared with the previous year.
Private customers
The Bank has a strategy to create sustainable growth in the private customer area, see “Vision 2012”. In the customer loans area, loans to “Private customers” are the Bank’s largest business area with a share of 60 per cent, see figure 3. The portfolio of customer loans to private customers has a significant spread. This means that individual losses can be considered as insignificant, unless there is a large number of simultaneous losses, such as in the event of a serious recession in the entire economy.
Creditworthiness of individual private households is assessed on the basis of a rating code and an individual assessment of a customer’s disposable
income, total assets (including debt gearing and pension savings), consolidation ability, job situation, age etc. The assessment is based on customers’ pay slips, annual tax returns, account behaviour, budgets and knowledge about the customer as well as his or her financial situation. In view of unemployment developments, in future, the Bank will focus on e.g. private customers who despite tax cuts and low interest-rates still have problems paying off their debt, and who are not able to satisfy their repayment obligations in the event of interest-rate rises. Another aspect is customers with double rent.
Table 4Private customer portfolio by rating codes
Rating code
Gross loans and guarantees at the end of 2010 DKK ’000
1 63,8592 775,1233 1,827,7334 5,188,9775 1,923,6306 1,055,5367 405,9688 213,8169 291,375
10 203,302Total 11,949,319
Note: This calculation is based on the balance of the customer. The figures are excluding loans to credit institutions but including the Bank’s loans to subsidiary companies.
The exposure on the Bank’s private customers is further broken down by customer segments, depending on the debtor’s status on the housing market. Each of the three customer segments is managed according to separate guidelines.
Private customers with cooperative property
Private customers with freehold property
Private customers with rented property
Corporate customers
Associations, etc.
Other
Total private customers
30 %
7 %
31 %
2 %
7 %
60 %
Note: The group ”Other” includes loans to public institutions and the Bank’s staff. The principle of calculation is changed and therefore the calculation from last year is not directly comparable.
Portfolio broken down by segments and measured by balance at the end of 2010
23 %
Figure 3

08
A. Customers with freehold property
Exposures to private customers owning freehold property amount to 30 per cent of the loan portfolio measured by balance. Customers’ equity in their property has fallen as a result of falling house prices. This has reduced the Bank’s mortgage security with a resulting increase in the potential risk of losses from this segment. This is also apparent from the Bank’s property mortgaging value statement for private customers in table 8, see page 12.
The number of weakly financed or technically insolvent home owners, who cannot sustain a significant drop in income, is limited to owners who have not been on the housing market for very long in the parts of the market where prices have fallen the most and/or owners who are highly geared, possibly due to excessive consumption. There is only a relatively modest proportion of this type of customer because of the good spread in the portfolio of customers owning freehold property.
The Bank provides loans against collateral in the financed asset. In this connection, please note that generally the Bank does not get involved in speculation based on value/mortgaging of real property.
At the beginning of the year, the Bank saw an increase in the number of compulsory sales compared with the previous year. Measured on an annual basis, the number of compulsory sales has more than doubled from 33 in 2008 to 56 in 2009 and 84 in 2010 but continue to represent a very small proportion of the Bank’s total portfolio. The Bank expects the number of compulsory sales to continue to rise in 2011.
Significantly increasing unemployment for a long period and/or a long-term interest-rate increase is assessed to be the largest risk in this segment, as a large part of the customers in this segment have floating-rate loans. However, a great deal of the floating-rate loans has an interest ceiling. The significantly falling and now historically low interest-rates are expected to compensate for any income drops in this customer segment. In 2010, payment discipline for owner- occupied property customers improved compared with 2009, which to a great extent is attributable to low interest-rates and tax cuts. Accordingly, this segment did not give rise to more problems than anticipated, but the situation for this segment is expected to worsen, though not at the same level as in 2009. This should be seen in connection with an expected interest-rate rise on e.g. housing loans.
B. Customers with cooperative property
Exposures to private customers with cooperative property have increased to 23 per cent of the loan portfolio measured by balance, due to the legislative amendment in 2005 that makes it possible to take out a mortgage in cooperative property, see figure 3. However, the growth rate on the cooperative property segment levelled out in 2009, and in 2010 there was an economic downturn. Loans in the cooperative property area are expected to continue to grow, though not at the same rate as observed in 2009.
The market for cooperative housing is less transparent than that for freehold housing, and price changes in the cooperative market have been less uniform because of differing price-setting practices between individual cooperative housing associations. The drop in prices seen from 2008-2010 has lagged behind that seen for owner-occupied flats and houses. The portfolio of loans for cooperative property at Arbejdernes Landsbank is deemed to be relatively resilient and less sensitive than the freehold property segment, despite its concentration in the Greater Copenhagen region. This is because of individual assessments of the individual cooperative housing associations in the Bank’s portfolio. The disproportionate weight of loans in older housing stock further reduces risk compared with, e.g. loans for new building and freehold properties.
In order to reduce the risk on this segment, the Bank has developed special business procedures and tools to assess the financial situation of private borrowers as well as the financial situation of the underlying cooperative housing associations. The valuation is tested using comparisons with the prices of similar cooperative housing in the same area. Furthermore, valuations are compared with prices per square meter of freehold property in the same area and similarly gross/net payments are compared with comparable freehold residences. In connection with the valuation of cooperative housing, there is a requirement that both prices per square meter and gross/net payments are a minimum of 20 per cent below comparable freehold residences. The differential in price per square meter for cooperative housing and the reference prices for the freehold housing market has been reduced over the past year, but it is still less than the minimum differential of 20 per cent.
Customer repayment discipline for 2010 has marginally improved compared with 2009; the year when the Bank measured the so far poorest customer repayment discipline. In Q1 2010, this segment’s situation worsened but this development has now turned. There has been an increase in the number of cases of customer repayment problems within the

Arbejdernes Landsbank | Group Risk Report 2010
cooperative housing segment, but the absolute number is still very low. The development in repayment discipline continues to be monitored closely, but the situation for this segment is expected to weaken slightly, and interest-rate sensitivity for these customers is assessed to be an important factor.
C. Customers with rented property
Exposures to “Private customers with rented property” amount to 7 per cent of the loan portfolio measured by balance, and therefore they are relatively less significant the freehold housing and cooperative housing segments.
Clearly this segment has not experienced the same drop in wealth as the freehold property market, but neither has it benefited from the “cushion” built up over previous years through the massive increases in the value of freehold housing. Typically, loans to these segment are not as large as for the two other groups, and therefore interest-rate sensitivity is generally not as distinct. Repayment discipline clearly improved in 2010 and losses in this group remain modest. The negative societal developments, triggered especially by the rise in unemployment, were expected to affect this segment to a much higher extent than in 2010. However, uncertainty remain as to the extent to which a rise in unemployment in 2011 will affect this segment.
Corporate customers
Exposure to “corporate customers” is limited in comparison with banks of a similar size. The corporate segment amounts to 31 per cent of the total loan portfolio measured by balance. Apart from a few larger corporate exposures, the segment is characterised by a large number of small and medium-sized, primarily owner-managed, enterprises. There is also a good spread between sectors (see break-down by sector at Group level in table 13 on page 17).
Creditworthiness is assessed on the basis of a rating code and a review of an enterprise’s ability to manage its debt commitments. The basis for approval includes the revenue-generating abilities of the enterprise, its assets (equity ratio), consolidation ability, collateral, sector, and management. The basis for processing and managing commitments with corporate customers is described in the internal business procedures. Typically the assessment is based on the Bank’s philosophy financial statements, budgets, business plans and insights into the business owner’s private financial situation. The Bank’s credit policy prepares the ground for corporate exposures to also be based on entire customer relationships, including bank exposures of the owner. This is done with the wish to provide the best possible advice, but also to maintain overall
economic insight into the Bank’s exposures with customers.
Table 5Corporate customer portfolio broken down by rating codes
Rating code
Gross loans and guarantees at the end of 2010 DKK ’000
1 588,2602 1,139,0133 966,4964 3,011,5775 713,3606 255,7207 300,6498 14,9389 731,585
10 188,789Total 7,910,387
Note: This calculation is based on the balance of the customer. The figures are excluding loans to credit institutions but including the Bank’s loans on large exposures and subsidiary companies. The figures are including loans to the Private Contingency Association. The figures are including loans to Associations etc. and Other.
The Bank’s strategy is to increase lending to small and medium-sized enterprises, primarily owner-managed enterprises, cf. “Vision 2012”. The Bank’s policy is that a significant part of corporate commitments must be covered by collateral in the assets of the company, possibly supplemented with collateral from the business owner. Several years ago, the Bank decided to limit lending to enterprises which are dependent upon changes in the property market, and the Bank’s policy is not to engage in financing projects with no guarantees of the necessary operating income to service the total indebtedness. The Bank wishes only to participate in financing business which the Bank understands and is able to follow and manage in relation to advisory services, and where the risk profile is not too great. The Bank’s policy is also not to lend to fisheries and agriculture, as well as sectors/enterprises with great political dependence.
Repayment discipline in the corporate segment has not directly worsened. In 2010, the negative societal trend affected the Bank’s largest corporate customers. The greatest difficulties consist in decrease in sales and problems with quick cost adaptation. Small corporate customers remain affected by the negative societal development but are under less strain as reported at the end of 2008 and 2009.
The Bank has experienced an increase in the number of liquidations in the corporate property segment compared to 2009. The increase is still assessed to be smaller than the general developments in society, and
09

10
the segment is not assessed to be severely affected. Repayment discipline has deteriorated in this segment measured as the number of arrears, but the number of reminders has fallen. The deterioration in repayment discipline is expected to continue, but not to the same degree as in 2009. This is expected to be reflected in the number of written reminders. Continued decreasing demand is assessed to be the largest risk in this segment.
Associations etc.
As a result of its basic philosophy and historical foundation, the Bank has a certain exposure to associations, including trade unions and charitable housing companies. Therefore, the Bank has specialist experience in credit assessment of these segments.
The exposure of 7 per cent is a small but not insignificant part of the portfolio of customer loans and there is a relatively good spread. The basis for approval includes the individual association’s foundation and articles of association, its assets and collateral, as well as its operations and management.
In 2010 the Bank saw a deterioration in this segment, particularly in the segment of cooperative housing associations, in which an increasing number of associations have negative cash flow and several are insolvent. Liquidations and terminations of a number of housing associations may be the consequence of this deterioration. However, only a handful of cooperative housing associations are likely to represent potential future losses for the Bank. The Bank still assesses that there is a risk of only small losses in this segment and has increased focus on this area.
Systems for risk reporting, measurement and monitoring The basis for credit assessment is reassessed at least once a year, provided the commitment is more than a specific limit. In practice the basis is often updated more frequently, for example in connection with ongoing contact with a customer.
Every quarter, the Board of Directors reviews a report on developments in the portfolio of loans. This report describes developments from the previous quarter and the previous year, with detailed specifications of approvals, balances, overall levels of arrears, 90-day arrears, loan segments, sectors, rating codes etc.
The quality of the overall portfolio of customer risks (credit quality) is also assessed during the annual review of assets by the Credit Department, and during the subsequent presentation of the review to the Board of Directors and the Bank’s internal and external auditors.
Customers with objective evidence of impairment are selected mechanically on the basis of selected criteria, and all these customers are reviewed at least quarterly by their advisors in order to prepare action plans and to make any write-downs. The Credit Department subsequently reviews the work of the branches.
Repayment discipline is monitored continuously using lists of overdrawn accounts, which are processed by advisors every day. Arrears of more than DKK 50,000 or more than DKK 10,000 and more than 90 days in arrears are commented weekly by the branch manager and sent to the Bank’s Credit Department. Using samples and lists of accounts in arrears, the Bank’s Credit Department checks whether branches’ action plans for customers with unsatisfactory payment records are adequate.
The Credit Department carries out ongoing credit reviews, where branches undergo an extraordinary review of their credit-weak customers and a physical review of the contents of their customer files. There is a fixed rotation arrangement, so that all branches are reviewed within a period of 3-4 years.
Finally, credit monitoring is supported by ad hoc analyses on the basis of developments in the portfolio as well as fixed exercises such as quarterly contributions to solvency need and quarterly assessments of the need for individual and group write-downs.

11Arbejdernes Landsbank | Group Risk Report 2010
Developments in the Bank’s 90-day arrears
The Bank’s 90-day arrears are broken down by different sectors, but are dominated by “Property administration, estate agency, and business services”, see table 7 below. The main reason is small arrears on a few large exposures. The Bank has implemented “early warning” lists, which are to reduce the number of customers with longer periods in arrears. The Bank has an objective to reduce the level by finding lasting solutions to possible
problems, collaboratively with the customer, rather than temporary solutions. This approach is expected to ensure that the number of customers on which the Bank will lose money is reduced in the long term. The level of 90-day arrears has been significantly reduced compared to the previous year, see table 6 and 7. In addition to being a danger sign, arrears of 90 days and more also generate pressure for extra capital on the consolidated exposures.
Table 6 90 days in arrears at the end of 2009
Balance DKK ’000
Of which, written down DKK ’000
ArrearsDKK ’000
Number of customers
Sector breakdown
Public authorities 580 176 9 2Corporate
Agriculture, hunting, forestry and fisheries 1,907 0 91 2Manufacturing, extraction of raw materials, power, gas, water and heat plants 37,046 1,265 206 6Building and construction 22,512 374 608 11Retailers, restaurants and hotels 98,208 5,955 1,615 38Transport, post and telephone 4,564 67 190 7Credit and finance business as well as insurance business 4,092 2,996 112 2Property administration, estate agency and business services 69,250 1,879 8,795 15Other corporate 6,686 0 257 3
Total corporate 244,265 12,536 11,874 84Private 124,133 19,868 5,962 132Total 368,978 32,580 17,845 218
Note: The calculation was made at section-145 level before write-downs.
Table 7 90 days in arrears at the end of 2010
Balance DKK ’000
Of which, written down DKK ’000
ArrearsDKK ’000
Number of customers
Sector breakdown
Public authorities 1,702 456 169 3Corporate
Agriculture, hunting, forestry and fisheries 1,779 0 16 1Building and construction 4,352 1,827 52 3Retailers, restaurants and hotels 30,162 2,406 605 18Transport, post and telephone 3,964 0 220 2Credit and finance business as well as insurance business 58 0 58 1Property administration, estate agency and business services 43,649 47 9,972 13Other corporate 4,564 0 3 2
Total corporate 88,528 4,280 10,926 40Private 159,651 14,908 5,163 116Total 249,881 19,644 16,258 159
Note: The calculation was made at section-145 level before write-downs.

12
Policies to hedge and reduce customer risksThe policies and business procedures described are methods to check and mitigate credit risks.
As far as possible, loans to private customers are hedged using different forms of collateral. This is usually by taking a registered mortgage deed in freehold and cooperative property. Moreover cars etc. are used as collateral.
Loans to corporate customers in owner-managed companies (A/S and ApS) as a rule require full or part personal guarantees, supplemented by various forms of collateral.
Loans to associations are frequently granted in return for collateral in the form of members’ fees, or alterna-tively members accepting joint and several liability, or real collateral.
Broken down by types of collateral, properties also make up the largest part of total collateral, see table 8 below. The table shows that broken down by collateral on private and corporate, mortgaging values have dropped, see tables 8 and 9. Primarily the categories “Properties”, “Securities, bonds, cash deposits, etc.” and “Other collateral” have been reduced in terms of value. This is attributable to a general decrease in the Bank’s calculation of the value of collateral, as the value at which the collateral has been calculated in tables 8 and 9 has been calculated according to a prudence principle, see descriptions in the Bank’s procedures. This implies that some assets are calculated at a reduced value or value 0 for reasons of prudence, and therefore the real collateral value is significantly higher than calculated in tables 8 and 9.
Table 8Group mortgaging values for private customers
2010DKK ’000
2009DKK ’000
Types of collateral
Properties 6,821,941 7,103,218Securities, bonds, cash deposits etc. 206,200 298,239Cars 950,000 914,970Boats and aircraft 14,502 15,486Transfers, including life-assurance and invoice discounting 2,906 9,598Warrants and guarantees 800 2,035Chattels 927 978Other collateral 445,276 406,838
Total 8,442,552 8,751,362
Note: Collateral for AL Finans is included. The calculation is carried out on another basis than in previous Group risk reports, and therefore figures from other reports are not comparable. The break-down private/corporate is made on the basis of collateral provided.
Table 9Group mortgaging values for corporate customers
2010DKK ’000
2009DKK ’000
Types of collateral
Properties 1,259,567 1,289,493
Securities, bonds, cash deposits etc. 499,970 617,783
Cars 614,854 647,749
Boats and aircraft 1,466 1,886
Transfers, including life-assurance and invoice discounting 454,297 224,104
Warrants and guarantees 2,000 670
Chattels 9,544 14,987
Other collateral 158,023 338,873
Total 2,999,721 3,135,545
Note: Collateral for AL Finans is included. The calculation is carried out on another basis than in previous group risk reports, and therefore figures from other reports are not comparable. The break-down private/corporate is made on the basis of collateral provided.

13Arbejdernes Landsbank | Group Risk Report 2010
Development of credit portfolio tools
Tools to measure and assess the Bank’s credit risks are under constant development. In 2010, the Bank introduced automatic credit rating codes and also increased the number of rating codes from 6 to 10. As this model is automatic rather than manual, customers with danger signs are expected to be discovered earlier than before. In 2011, to a great extent, the rating model and rating codes are expected to be incorporated in the daily monitoring of operations and in control lists. In addition, criteria will also be included for objective indicators of impairment, arrears lists, credit manage-ment, credit reporting and target figures for the branches which will relate to credit risk to a higher extent than previously.
The Bank’s new corporate concept is expected to be launched, and in this connection, a standardised strength-profile template will be introduced, to ensure that the Bank is more uniform in treatment of its corporate customers. This will lower the number of incorrect registrations whilst also giving customer advisors much better possibilities to provide subjective assessments of the customer in a uniform manner, and this can be incorporated in future further development of the Bank’s rating model.
In 2010, a new depreciation/amortisation and back-testing system was developed, to ensure a valid back-test of the Bank’s group write-downs and the Bank’s rating model. The system will make it easier to identify loss-making customers earlier and thus reduce the Bank’s ultimate losses.
Activities in AL Finans A/S
The activities of the subsidiary company, AL Finans A/S, are spread over three business areas, car loans, leasing (primarily automobiles), and factoring.
AL Finans A/S has no internal rating and scoring system for assessment of credit risk, but has great experience in car loans, car leasing and factoring, and also systems for effective authorisation processes for car loans and car leasing have been developed. Generally, credit quality is expected to increase.
Quarterly manual reviews are carried out of all customers with signs of weakness, and customers are divided into manageable segments. Once a year an asset review is carried out where the credit risk is assessed for larger exposures, and provisions are made to the extent that there are objective indications of impairment. The majority of all loans have collateral in the form of the leased/secured asset, for which there are public catalogues to assess the asset value, or there are statistical records covering many years. Furthermore, for 97 per cent of the car loans portfolio an initial payment of 20 per cent or more has been made, see table 10.
Table 10 Payment percentages on car loans for AL Finans
2010 2009
DKK ’000 % DKK ’000 %
Break-down of the initial payment percentage on car loans
0-9 % 26,250 2 57,441 510-19 % 7,943 1 12,356 120-29 % 790,962 76 786,846 7430-39 % 132,980 13 127,153 1240-99 % 80,312 8 84,932 8Total 1,038,447 100 1,068,727 100

14
The risk on car loans and car leasing is mainly related to whether the value of underlying assets can be realised at the values estimated, see the high collateral coverage in tables 11 and 12. One of the material risk factors in AL Finans A/S is therefore declining realisation values on cars in particular. In 2010 prices of used cars rose considerably compared to the extraordinarily low prices in 2009, and as a result budgeted losses in connection with sales for 2010 were set too high compared with the actual realised losses. The budgeted losses on car loans for 2011 are set at par with the realised loss in 2010, as an unchanged risk of loss is expected.
There are two levels of repayment obligations in factoring. Debtor level is the first level, and if a debtor is unable to pay, then client level is the next level. In addition, claims are typically mortgaged by 80 per cent, which in normal circumstances provides good cover for repayment obligations. A growing number of
bankruptcies among customers and debtors increases the risk of loss. To hedge this, an increasing number of exposures have now been hedged with credit insurance through guarantee insurance companies. Furthermore the Bank has taken out crime insurance, which insures the entire Group against major losses due to fraud. On 30 June 2010, AL Finans took over the factoring portfolio Nordisk Factoring A/S. Measured by balances, the factoring portfolio has increased by approx. DKK 250 mill., broken down by 90 exposures. The portfolio has high hedging in terms of collateral and is assessed to have the same or better credit quality than the existing factoring portfolio in AL Finans. Another factor to take into account is that guarantees have been given by Jyske Bank (vendor) for customers showing signs of weakness.
Loans and customer spread under the respective business areas are as follows:
Table 11 Loans and distribution of collateral for the private portfolio in AL Finans
2010 2009
BalanceDKK ’000
CollateralDKK ’000
Number and customers
BalanceDKK ’000
CollateralDKK ’000
Number and customers
Business areas
Car loans (debt instruments) 157,842 119,774 1,569 178,593 166,860 1,673Car loans (purchase contracts) 654,993 589,494 6,829 622,061 559,855 6,128Leasing 2,831 2,548 23 0 0 0Total 815,666 711,816 8,421 800,654 726,715 7,801
Note: Calculated mortgaging values of deposited collateral, see procedures for AL Finans.
Table 12 Loans and distribution of collateral for the corporate portfolio in AL Finans
2010 2009
BalanceDKK ’000
CollateralDKK ’000
Number and customers
BalanceDKK ’000
CollateralDKK ’000
Number and customers
Business areas
Car loans (debt instruments) 51,026 41,615 375 94,363 72,920 467Car loans (purchase contracts) 174,585 151,935 1,236 173,709 156,338 1,337Leasing 465,371 418,834 1,066 479,990 431,991 1,310Factoring 450,117 450,117 205 231,448 216,974 142Total 1,141,099 1,062,501 2,882 979,510 878,223 3,256
Note: Calculated mortgaging values of deposited collateral, see procedures for AL Finans.

15Arbejdernes Landsbank | Group Risk Report 2010
Credit risk on credit institutions General conditions
The “Instructions on segregation of responsibilities between the Board of Directors and the Executive Management of the Aktieselskabet Arbejdernes Landsbank” contain guidelines for managing counter-party risks as well as allocation of authority that the Executive Management may expose the Bank to credit risk on credit institutions and others.
In general the Bank adopts a tight practice for authorising exposures. In day-to-day trading, financial frameworks are only established with credit institutions known to the Bank. Authorisations of frameworks for Danish credit institutions are based on the most recent financial statements as well as the Bank’s knowledge about the counterparty. Authorisations of frameworks for foreign credit institutions are based on the same principles as mentioned above for Danish credit institutions.
Binding credit commitments
Arbejdernes Landsbank bases lending on business relationships, and as a point of departure credit is only granted to credit institutions having a natural cooperation potential with Arbejdernes Landsbank within other business areas.
In addition to obtaining knowledge about conditions relating to business counterparties, prior to entering into any commitment, the Bank carries out an analysis of the most recent interim financial statements, and the credit institution is interviewed on any issues arising. This analysis work is carried out by the Credit Department.
At least once a year, the Bank follows up all exposures and conducts a quality test for all commitments, often with a follow-up meeting with the counterparty. It is also routine practice that these credit institutions visit Arbejdernes Landsbank after publication of annual reports and provide more detailed information about developments.
Follow-up work is performed at management level in Arbejdernes Landsbank, and the Bank’s Credit Department is involved in specific situations in order to complete a follow-up analysis of the previous decision base.
All those with contact to the credit institutions involved may have access to potentially marketsensitive information about the credit institution. These persons are primarily from the management group at the Bank and they are subject to more rigid internal regulations
on transactions with the relevant credit institution using personal assets.
Ordinary undisclosed financial frameworks (credit lines):
This type of commitment is granted internally by the Bank on the basis of two main criteria:
1. A size criteria – whereby a credit line for credit institutions is measured according to objective criteria pursuant to internal instructions on segregation of responsibilities (”Instruks for arbejds-fordelingen mellem bestyrelsen og direktionen i A/S Arbejdernes Landsbank”). The size of a credit line is measured as both a specific percentage of Arbejdernes Landsbank’s equity and as a percentage of the credit institution’s equity .
2. A subjective assessment, whereby reviews of financial statements, market information, cooperation experience etc. are combined into a conclusion drawn by the Bank’s management.
Grants of credit lines to credit institutions are decided collaboratively between the head of the Credit Department and the Bank’s Board of Directors and Executive Management.
Risk assessment
The risk on Danish credit institutions is assessed to be primarily on specific product outstandings (share capital and capital base). Here, the Bank’s policy is not to provide loans in the form of capital base, and there is no loan portfolio of capital base to credit institutions. On the basis of this, risk is assessed to be limited.
The Bank is exposed to a few credit institutions in other countries but the risk is assessed to be limited and capital provisions have been made which the Bank deems necessary in a worst-case scenario.

16
Write-downs and provisions on loans and guarantees The Group’s statement of defaults on payments of receivables and impairment losses on receivables is pursuant to sections 51–54 of the Executive Order on Financial Reports for Credit Institutions and Investment Companies, etc.
At the end of 2010 individual and group write-downs on loans as well as provisions on guarantees amounted to DKK 199 mill., see table 13, compared to DKK 315 mill. in 2009. The calculation in table 13 includes credit institutions. After this, accumulated write-downs and provisions amount to DKK 847 mill. at the end of 2010. Table 13 shows the breakdown of write-downs and provisions by sector. The increase in write-downs and provisions is primarily due to the negative trends in the economic cycle.
Note that the individual write-downs in 2010 are burdened by almost DKK 46 mill. for the Bank’s share of estimated losses in the Private Contingency Association (Det Private Beredskab). Despite expectations that the economic crisis will continue in 2011, the Bank expects the level of write-downs and provisions in 2011 will be at the same level as in 2010, not including the Private Contingency Association.

17Arbejdernes Landsbank | Group Risk Report 2010
Table 13 Sector breakdown of receivables from credit institutions and central banks, loans and guarantees
Exposures carried forward 2010
Exposures which have been written down/ provided
Write-down/provisions carried forward 2010
Net write-down/provisions 2010
DKK ’000 DKK ’000 DKK ’000 DKK ’000
Sector breakdown
Public authorities 94,835 25,174 4,831 4,276Corporate
Agriculture, hunting and forestry 99,001 81,826 1,229 -180Fisheries 964 0 0 0Manufacturing, extraction of raw materials, power, gas, water and heat plants 482,945 278,376 37,557 -2,290Building and construction 716,686 399,661 69,264 6,130Retailers, restaurants and hotels 1,831,216 1,279,653 110,865 -22,418Transport, post and telephone 472,859 329,513 14,412 -2,342Credit and finance business as well as insurance business 3,991,023 597,289 147,097 -48,807Property administration, estate agency and business services 2,548,119 1,316,126 63,045 -27,448Other corporate 1,444,912 500,601 99,786 -51,347
Total corporate 11,587,725 4,783,045 543,255 -148,702Private 11,234,464 6,007,767 299,031 -54,390Total 22,917,024 10,815,986 847,117 -198,816
Table 14Changes in impairment losses on receivables
Individually written down credit institution
Individually written down loans, etc.
Individually provided on guarantees
Written down loans by group
Provided on guarantees by group
DKK ’000 DKK ’000 DKK ’000 DKK ’000 DKK ’000
Impairment losses on receivables
Accumulated write-downs/provisions brought forward on loans and guarantee debtors 17,256 490,003 71,455 64,068 5,506 Write-downs/provisions for the year - 310,352 46,130 34,539 2,267 Reversal of write-downs 23 131,916 2,307 38,757 3,181 Other movements - 14,892 - 2,047 - Actual loss (written off), previously individually written down/provided - 35,214 - - - Accumulated write-downs/provisions carried forward on loans and guarantee debtors 17,233 648,117 115,278 61,897 4,592 Actual loss (written off), not previously individually written down/provided - 14,302 Recognised in claims previously written off - 10,751

18
Table 15Derivative financial instruments and spot transactions carried forward 2010
Nominal value
Net market value
Positive market value
Negative market value
DKK ’000 DKK ’000 DKK ’000 DKK ’000
Currency contracts
Spot transactions, purchase 93,969 -155 25 180
Spot transactions, sale 91,368 162 228 66
Forward transactions/futures, purchase 1,673,530 8,960 8,998 38
Forward transactions/futures, sale 538,624 -32,257 30 32,287
Options, acquired -1,303,256 21,209 21,209 0
Options, issued 1,326,012 -27,998 0 27,998
Valutaswaps 2,869,894 -62,422 16 62,438
Interest-rate contracts
Spot transactions, purchase 479,281 480 494 14
Spot transactions, sale 629,000 -451 66 517
Forward transactions/futures, purchase 222,215 2,545 3,608 1,063
Forward transactions/futures, sale 5,645,858 1,381 4,595 3,214
Options, acquired 0 0 0 0
Options, issued 0 0 0 0
Swaps 5,430,045 -171 162,709 162,880
Interest-rate swaps 2,865,702 -17,031 21,798 38,829
Share contracts
Spot transactions, purchase 1,028,768 192 377 185
Spot transactions, sale 111,234 -204 195 399
Options, required 0 0 0 0
Total 21,702,244 -105,760 224,348 330,108
The Bank does not apply netting in the statement of risks on items with counterparty risk.
Counterparty risk
Counterparty risk includes the Group’s management of risks of losses on derivative financial instruments. Risks of losses on derivative financial instruments are included in the management of credit risk in both the authorisation process and in general exposure monitoring, see the relevant sections on this matter.
The Bank’s and Group’s exposures to items with counterparty risk are identical
.
Arbejdernes Landsbank | Group Risk Report 2010
Market risk
The Arbejdernes Landsbank Group regularly accepts various forms of market risk, primarily as interest-rate risk, share-price risk or currency risk. Market risks arise partly as a result of servicing customers’ needs and partly from the Bank’s positions in financial instruments. The Bank utilises derivative financial instruments to manage and adjust market risks.
In general the Bank is prudent in the size of its exposure to market risk. The Bank puts high priority on managing business with market risk because of the increasing scope of its business in this area and the increasing complexity of a number of the products in recent years.
The current financial crisis has further underscored the need for active and tight management of this area.
Erfaringerne fra den aktuelle finansielle krise de seneste år har yderligere understreget behovet for fokus på en stram styring på området.
Market risk covers positions, the market value of which depends on developments in the general levels of a number of market variables such as interest-rates, share prices, and currency rates. Moreover, risks of a more specific nature on specific market securities are included, if these risks can be traded explicitly. The statement includes market risk on both balance-sheet items and non-balance-sheet items and calculations also include positions in the trading portfolio and business outside the trading portfolio which could have market risks.
Under normal market conditions, general market risks are determined by macroeconomics, national and international political conditions, etc., as well as actions by central banks, which are independent of type of instrument and specific counterparties in a transaction.
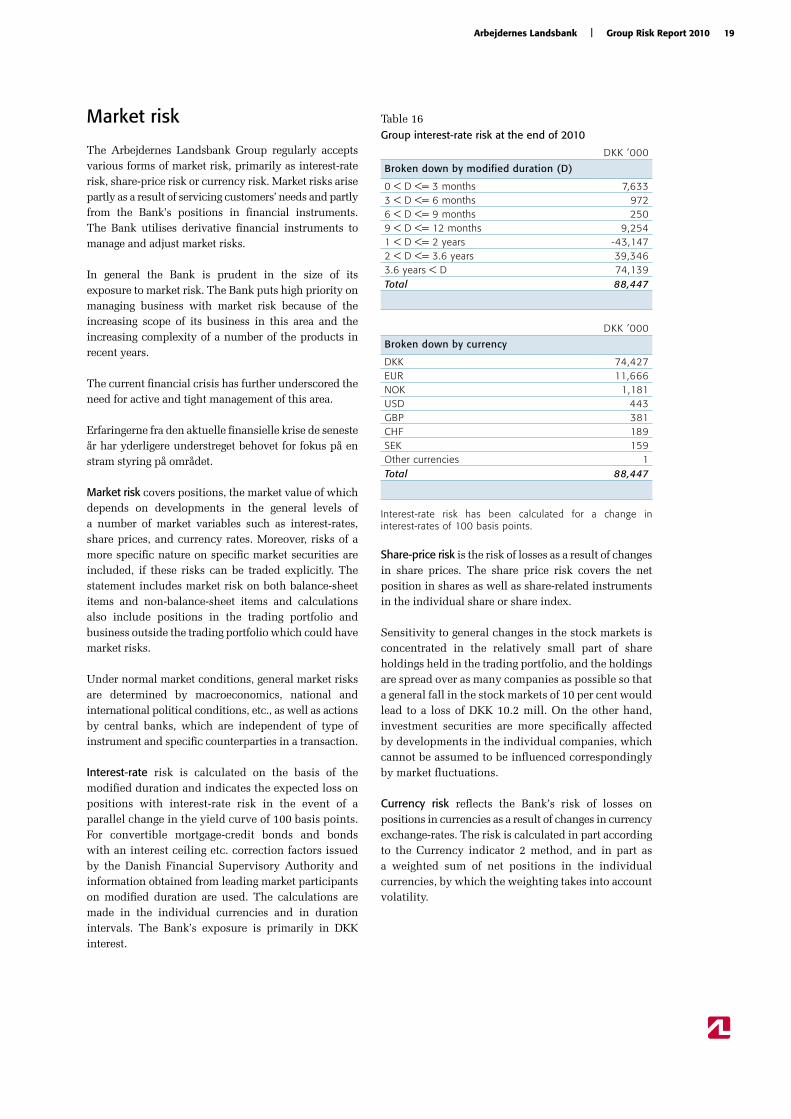
Interest-rate risk is calculated on the basis of the modified duration and indicates the expected loss on positions with interest-rate risk in the event of a parallel change in the yield curve of 100 basis points. For convertible mortgage-credit bonds and bonds with an interest ceiling etc. correction factors issued by the Danish Financial Supervisory Authority and information obtained from leading market participants on modified duration are used. The calculations are made in the individual currencies and in duration intervals. The Bank’s exposure is primarily in DKK interest.
Table 16 Group interest-rate risk at the end of 2010
DKK ’000
Broken down by modified duration (D)
0 < D <= 3 months 7,6333 < D <= 6 months 9726 < D <= 9 months 2509 < D <= 12 months 9,2541 < D <= 2 years -43,1472 < D <= 3.6 years 39,3463.6 years < D 74,139Total 88,447
DKK ’000
Broken down by currency
DKK 74,427EUR 11,666NOK 1,181USD 443GBP 381CHF 189SEK 159Other currencies 1Total 88,447
Interest-rate risk has been calculated for a change in interest-rates of 100 basis points.
Share-price risk is the risk of losses as a result of changes in share prices. The share price risk covers the net position in shares as well as share-related instruments in the individual share or share index.
Sensitivity to general changes in the stock markets is concentrated in the relatively small part of share holdings held in the trading portfolio, and the holdings are spread over as many companies as possible so that a general fall in the stock markets of 10 per cent would lead to a loss of DKK 10.2 mill. On the other hand, investment securities are more specifically affected by developments in the individual companies, which cannot be assumed to be influenced correspondingly by market fluctuations.
Currency risk reflects the Bank’s risk of losses on positions in currencies as a result of changes in currency exchange-rates. The risk is calculated in part according to the Currency indicator 2 method, and in part as a weighted sum of net positions in the individual currencies, by which the weighting takes into account volatility.
19

20
Management of market risks
The Group’s overall market risk is managed centrally by the Treasury Division.
The Bank ensures distinct segregation of responsibility in risk-taking at all levels of the Bank through setting maximum authorization frameworks for both the Executive Management and the management of the Treasury Division. On the basis of this, narrower frameworks are delegated to the individual authorising employees in the Treasury Division.
The individual risk areas are monitored continuously in relation to the frameworks set. Daily follow-up on this is via reports to the Executive Management and there are regular reports to the Board of Directors. The staff function, Internal Risk Management, monitors how much of the individual frameworks are used by the position takers and reports direct to the Executive Management.
The Bank’s market risks are a result of customer trading or arising from the Bank’s position-taking on the basis of tactical and strategic assessments of market developments, and partly from consideration of the scope of the bank’s other business, including transactions with interest-rate risk, but outside the trading portfolio.
In order to be able to deal with customers’ trading activities, the Bank has a holding of securities which cancels out the differences between the size of customer trading and standard transactions on the professional market.
The market risk linked to this is kept within well defined limits both in total and on the individual securities ID. These limits are included in the frameworks set by the Board of Directors and they are continually monitored.
Tactical, short-term investments are managed by the Bank’s trading function within relatively narrow limits which are continually monitored.
Strategic positions are decided by the Executive Management on the basis of an assessment of potential returns compared with the risk involved, and taking into account the Bank’s overall appetite for risk, other risks of the Bank, as well as ongoing maintenance of a liquidity resource in the form of liquid assets. In addition to daily calculations of the Bank’s total market risks according to standard key figures, stress tests of the holdings are also performed occasionally.
Liquidity risk
Liquidity risk is the risk of losses resulting from the Bank having to pay more for the liquidity required to cover its payment obligations and to maintain normal liquidity reserves in a situation where the Bank itself or the sector as a whole is affected by extraordinary circumstances. Liquidity risk thus reflects a mismatch in the Bank’s balance between maturity of the assets and liabilities, where the loan portfolio generally has a longer duration than deposits and other financial transactions.
Most of the Bank’s liquidity risk is in Danish kroner (DKK), while the rest of the risk is concentrated in the major currencies.
The Bank generally has a very prudent liquidity policy. The Bank has an objective to have excess liquidity of 100 per cent in relation to the 10 per cent and 15 per cent stipulated in section 152 of the Danish Financial Business Act. Liquidity resources are monitored daily and at the same time assessed in a long-term perspective in relation to business developments at the Bank and in the capital markets, as well as levels of deposits and loans. The Bank also has a policy that liquidity forecasts, which are prepared at least once a month, must demonstrate similar excess cover for at least three months ahead, and 12 months ahead there must be excess cover of at least 75 per cent.
In addition to regular calculation of the excess liquidity cover, occasional stress tests of the Bank’s liquidity in the long term are carried out in order to reveal the Bank’s sensitivity to significant changes in its ongoing terms of funding.

21Arbejdernes Landsbank | Group Risk Report 2010
Interest-rate risk outside the trading portfolioThe Bank’s interest-rate risk arises to a certain extent outside the trading portfolio in the form of fixed-interest loans or deposits for customers or variable interest loan products with built-in option elements.
The interest-rate risk outside the trading portfolio is part of the Treasury Division’s calculations of the Group’s overall interest-rate risk and it is managed within set limits.
Shares etc. outside the trading portfolioIn cooperation with other banks, Arbejdernes Landsbank has acquired holdings in a number of companies which the Bank consiers to be business strategic activities. The object of these companies is to support the banks’ business within mortgage credit, IT, money transmission services and investment associations. The holdings are not included in the trading portfolio, as participation in the companies is very important for the Bank’s goal of being able to offer customers a broad range of financial services at competitive prices.
Table 17Shares outside the trading portfolio
DKK ’000
Portfolio at carrying amount carried forward 2010 *) 765,225
Realised capital gains in 2010 98
Unrealised capital gains in 2010 5,694
*) of which, DKK 352.4 mill. amount to more than 10 per cent in the given company. This amount has been deducted in the calculation of the Group’s capital base, and 50 per cent, corresponding to DKK 176.2 mill., has been deducted from the core capital.
Holdings in companies are unlisted and are valued at fair value.
21

22
Operational risk
Table 18 Operational risk is the risk of losses because of:
Type Beskrivelse
Intern svig Losses due to acts of a type intended to defraud, misappropriate property or circumvent regulations, the law or Bank policy, and which involve at least one Bank employee.
External fraud Losses due to acts of a type intended to defraud, misappropriate property or circumvent the law, by a third party.
Employment practices and workplace safety
Losses arising from acts inconsistent with employment, health or safety legislation. Payment of claims arising from personal injury or from discrimination events.
Clients, products, and business practice
Losses arising from an unintentional or negligent failure to meet a professional obligation to specific clients, or losses arising from the nature or design of a product.
Damage to physical assets
Losses arising from loss or damage to physical assets from natural disaster or other events
Business disruption and systems failures
Losses arising from disruption of business or system failures.
Execution, delivery and process management
Losses from failed transaction processing or process management.
As a rule, operational risk can be linked to specific individual events.
The organisation
In order to assist the management at the Bank with matters relating to operational risk, work in this area is based in the following departments:
• Legal Department with regard to compliance.
• IT Department with regard to following up IT security and emergency plans for transferring operations. In this connection, note that the majority of the Bank’s IT development and operations have been outsourced to Bankernes EDB Central (BEC) and thus BEC deals with the operational risk on development and operations.
• HR Department with regard to physical security relating to personnel and buildings.
• The individual business areas with regard to their own exposures.
Tasks
All operational losses exceeding DKK 5,000 are reported and commented by the individual business areas.
Reports from the Internal Audit Department are dealt with by the Board of Directors and the Executive Management, focusing particulary on areas relevant for operational risks.
Reports from public inspection authorities are processed by the Board of Directors and Executive Management.
Reports are made to the Executive Management in the event of critical exposures from individual business areas when the management of a business area deems that reporting and follow up is necessary.
Management information is prepared in the form of descriptions of IT security, compliance and contingency plans.
On the basis of reports on current losses from business areas, the IT department calculates total operational risk once every quarter.

23Arbejdernes Landsbank | Group Risk Report 2010
Business risk
Business risk is defined as the risk of losses from changes in external conditions which influence the Bank, or incorrect assessments of the consequences of strategies adopted.
The risk becomes apparent in unexpected falls in revenues or unexpected rises in costs.
Examples of reasons are:
• Fierce price competition arising from a drop in business volume or falling revenues on the existing volume of business.
• Increasing product-development costs to match new products from competitors.
• Increasing marketing costs arising from negative press coverage.
• Incorrect estimates of revenues from new activities.
The Group continually assesses this type of risk, and always when setting the solvency need.
Property risk
Property risk is defined as the risk of losses on the portfolio of properties, arising from a general drop in property prices. Aktieselskabet Arbejdernes Landsbank has a portfolio of its own owner-occupied properties of DKK 525 mill.
The properties are primarily used for the operation of the Bank. In addition parts of individual properties are rented out as dwellings or as professional offices.
The properties are widely located throughout Denmark, although on the basis of carrying value there is an overweight in Greater Copenhagen.
The properties are measured annually at 31 December to ”revalued amount” which is the fair value on the date of valuation.
Consolidation
A/S Arbejdernes Landsbank
Consolidation includes both subsidiary companies,
• AL Finans A/S
• Handels ApS Panoptikon,
which are both 100 per cent owned by A/S Arbejdernes Landsbank. There are no differences between the consolidation bases for accounting purposes, and consolidation is in accordance with part 12 of the Danish Financial Business Act.
ALKA Forsikring A/S is an associated company and because it is an insurance company it has not been consolidated, and it has not been included in the calculation of base capital.
The activities of subsidiary companies are based on funding from the parent company.

24
Capital base
Table 19Calculation of Group base capital as at 31 December 2010
DKK ’000
Share capital 300,000Reserves 259,925Retained earnings 2,397,023
Core capital 2,956,948
Proposed dividends 24,000Intangible assets 9,291Deferred tax assets 24,833Core capital after primary deductions 2,898,824
50 % of the capital requirement in associated companies operating insurance business, cf. section 131(2), no. 2 of the Danish Financial Business Act 43,50550 % of equity investments >10% in credit and financing companies, cf. section 131(2), no. 3 of the Danish Financial Business Act 203,89850 % of the sum of equity investments >10%, cf. section 131(2), no. 3 of the Danish Financial Business Act 1,425Core capital before deductions 2,649,996
Injections of subordinated debt 328,000Revaluation reserves 161,276Base capital before deductions 3,139,272
50 % of the capital requirement in associated companies operating insurance business, cf. section 139(1), no. 1 of the Danish Financial Business Ac 43,50550 % of equity investments >10% in credit and financing companies, cf. section 139(1), no. 2 of the Danish Financial Business Act 203,89950% of the sum of equity investments >10%, cf. section 139(2), no. 3 of the Danish Financial Business Act 1,425Base capital after deductions 2,890,443
The Group’s capital composition mainly consists of core capital. After deductions, core capital represents 92 per cent of the base capital after deductions at the end of 2010.
Group deductions under ”equity investments >10 per cent in credit and financing companies” are primarily attributable to the Bank’s ownership interest in LR Realkredit A/S, which at the end of 2010 amounted to 352.4 mill. of the figure for total deduction, of which 50 per cent is deducted from core capital.
Group deductions under ”percentage of the capital requirement in associated companies operating insurance business” are attributable to the Bank’s ownership interest in ALKA Forsikring A/S, which at the end of 2010 amounted to DKK 87 mill., of which 50 per cent are deducted from core capital.
Group revaluation reserves of DKK 161.3 mill. are attributable to value increases in the Bank’s owner-occupied properties.
The Bank’s capital base of DKK 328 mill. matures as at 3 December 2018 and may be redeemed before maturity on 1 December 2015.
According to existing rules on capital adequacy, base capital can be included in full in the Group’s capital statement up to and including 2 December 2015. The percentage is then reduced by 25 per cent per annum.
25Arbejdernes Landsbank | Group Risk Report 2010
Solvency needModel
An individual solvency need for both the Group and the Bank is set by Arbejdernes Landsbank.
A model is used, where the solvency need is built on the basis of 0 per cent, after which capital is allocated for each risk area. The total capital need is obtained by adding the capital need for each risk area. Thus the model takes no account of correlations between the individual risk areas.
The model is based on own data and risk assessments as far as possible. However, the Bank’s historical database is limited, and therefore external data and methods for calculating risks are used to a large extent. In several risk areas, risk calculations have been made for own and external data/methods. The highest calculated risk is used in these cases.
Solvency need is calculated as the total capital need as a percentage of the weighted items calculated according to the provisions of the Executive Order on Capital Adequacy. Pursuant to the Executive Order on Capital Adequacy, the Bank calculates weighted items for both the Group and the Bank. The lowest calculated weighted items are used in the calculation of the solvency need.
This model was selected to ensure a high degree of prudence, clarity and transparency.
Adequate capital and solvency need
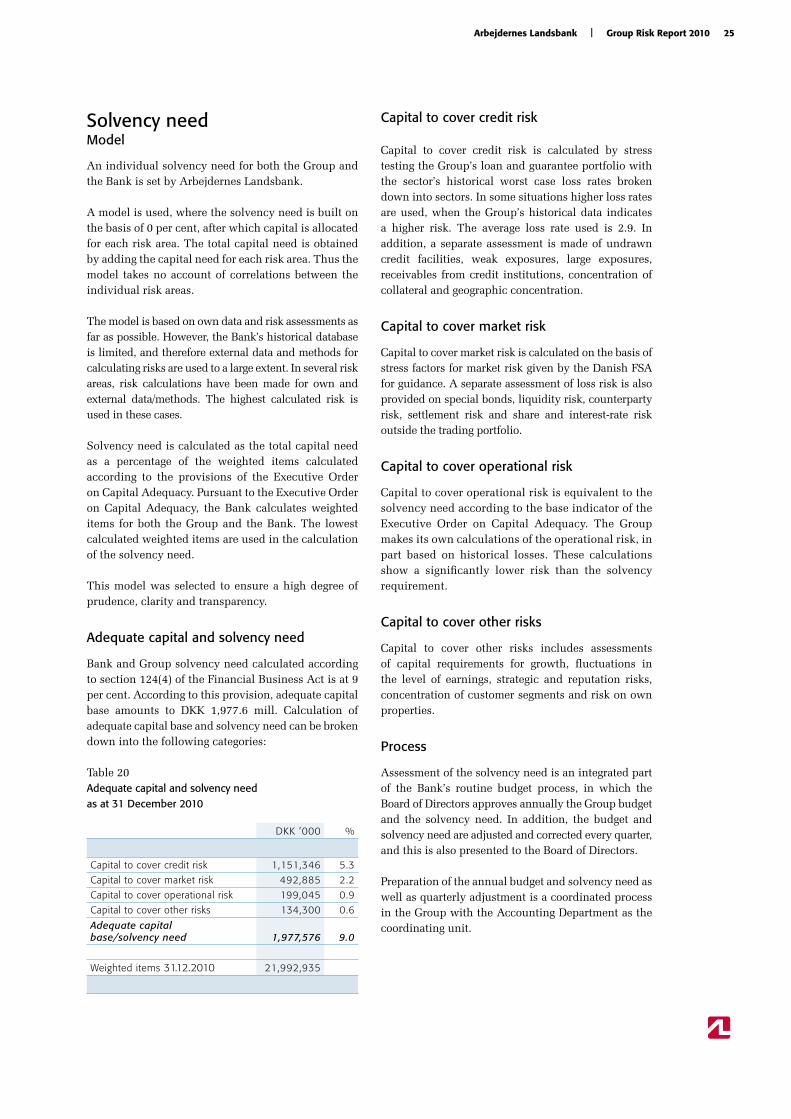
Bank and Group solvency need calculated according to section 124(4) of the Financial Business Act is at 9 per cent. According to this provision, adequate capital base amounts to DKK 1,977.6 mill. Calculation of adequate capital base and solvency need can be broken down into the following categories:
Table 20Adequate capital and solvency need as at 31 December 2010
DKK ’000 %
Capital to cover credit risk 1,151,346 5.3
Capital to cover market risk 492,885 2.2
Capital to cover operational risk 199,045 0.9
Capital to cover other risks 134,300 0.6
Adequate capital base/solvency need 1,977,576 9.0
Weighted items 31.12.2010 21,992,935
Capital to cover credit risk
Capital to cover credit risk is calculated by stress testing the Group’s loan and guarantee portfolio with the sector’s historical worst case loss rates broken down into sectors. In some situations higher loss rates are used, when the Group’s historical data indicates a higher risk. The average loss rate used is 2.9. In addition, a separate assessment is made of undrawn credit facilities, weak exposures, large exposures, receivables from credit institutions, concentration of collateral and geographic concentration.
Capital to cover market risk
Capital to cover market risk is calculated on the basis of stress factors for market risk given by the Danish FSA for guidance. A separate assessment of loss risk is also provided on special bonds, liquidity risk, counterparty risk, settlement risk and share and interest-rate risk outside the trading portfolio.
Capital to cover operational risk
Capital to cover operational risk is equivalent to the solvency need according to the base indicator of the Executive Order on Capital Adequacy. The Group makes its own calculations of the operational risk, in part based on historical losses. These calculations show a significantly lower risk than the solvency requirement.
Capital to cover other risks
Capital to cover other risks includes assessments of capital requirements for growth, fluctuations in the level of earnings, strategic and reputation risks, concentration of customer segments and risk on own properties.
Process
Assessment of the solvency need is an integrated part of the Bank’s routine budget process, in which the Board of Directors approves annually the Group budget and the solvency need. In addition, the budget and solvency need are adjusted and corrected every quarter, and this is also presented to the Board of Directors.
Preparation of the annual budget and solvency need as well as quarterly adjustment is a coordinated process in the Group with the Accounting Department as the coordinating unit.

26
Solvency requirements
The Group solvency ratio at the end of 2010 was 13.1 compared with 13.0 at the end of 2009.
The Group uses the following methods to calculate the solvency ratio:
• Standard method to calculate credit risk
• Standard method to calculate market risk
• Market value method to calculate counterparty risk
• Base indicator method to calculate operational risk
• Collateral in the form of securities in accordance with the extended method
• Collateral in the form of mortgages in real property and cash deposits with the Bank
The solvency requirement (8 per cent of the weighted items) was DKK 1,759.4 mill. at the end of 2010 compared with DKK 1,672.6 mill. at the end of the previous year.
According to legislation, as a minimum the Bank must have capital corresponding to the least of either the minimum statutory requirement of 8 per cent of risk-weighted items (solvency requirement), or the individual solvency need laid down by the Board of Directors. The Group has calculated its individual solvency need at 9 per cent, and this is therefore the basis for the requirements for the size of the Group capital.
Table 21Development and average in 2010 for items with credit risk
Solvency requirement31.12.2010
DKK ’000
Solvency requirement 31.12.2009
DKK ’000
Solvency requirement average *)2010DKK ’000
Exposure categories:
Items with credit risk etc.Exposures to credit institutions 48,364 30,179 40,643Exposures to businesses etc. 400,583 380,968 380,367Exposures to retail customers 746,558 739,894 752,986Exposures secured by mortgages in real property 54,166 63,450 58,274Exposures in arrears 14,391 34,408 34,615Exposures in other items 60,407 53,046 55,964Group write-downs -5,319 -5,566 -5,433
Total items with credit risk etc. 1,319,150 1,296,379 1,317,418Items with market risk
Debt instruments, specific risk 145,374 102,270 135,838Debt instruments, interest-rate risk 57,986 62,779 63,870Position risk for shares 13,537 12,593 12,205Position risk for collective investment schemes 6,463 7,542 7,332Currency risk 17,020 13,475 15,531Other items 860 436 610
Total items with market risk 241,240 199,094 235,387Operational risk 199,045 177,158 181,535
Total solvency requirement 1,759,435 1,672,631 1,734,340
Capital base for meeting the solvency requirement 2,890,443 2,714,460 2,741,459
*) The average is calculated on the basis of reports to the Danish FSA in the period from 31 December 2009 to 31 December 2010.

27Arbejdernes Landsbank | Group Risk Report 2010
Exposure categories
Exposure categories calculated using the standard method for credit risk pursuant to section 9 of the Executive Order on Capital Adequacy. Exposures are stated after individual write-downs and before taking account of the effects of credit reductions.
Table 22Development and average in 2010 for items with credit risk
Average2010DKK ’000
Status31.12.2010DKK ’000
Status30.09.2010DKK ’000
Status30.06.2010DKK ’000
Status31.03.2010DKK ’000
Status31.12.2009DKK ’000
Exposure categories:Exposures to central banks and central governments 585,996 105,681 63,327 595,853 1,105,631 1,059,491
Exposures to credit institutions 3,359,204 3,827,470 3,312,779 3,238,711 3,037,374 3,379,687
Exposures to businesses, etc. 6,901,182 7,251,914 6,809,471 7,318,823 6,576,825 6,548,875
Exposures to retail customers 16,080,689 16,015,476 16,649,224 16,394,106 15,822,389 15,522,248Exposures secured by mortgages in real property 1,991,849 1,842,816 1,881,713 1,911,023 2,139,567 2,184,125
Exposures in arrears 359,928 151,094 491,389 357,561 454,408 345,188
Exposures in other items 1,008,118 1,092,050 979,371 1,005,091 1,002,081 961,999Total items with credit risk etc. 30,286,966 30,286,501 30,187,274 30,821,168 30,138,275 30,001,613
Table 23Balance-sheet items *), broken down by remaining term – as at 31 December 2010
Demand
DKK ’000
0-3 monthsDKK ’000
3 months- 1 yearDKK ’000
1-5 years
DKK ’000
Over 5 yearsDKK ’000
Exposure categories:Exposures to central banks and central governments 75,791 438 1,317 27,916 67
Exposures to credit institutions 216,934 858,800 75,428 142,021 0
Exposures to businesses, etc. 1,196,251 183,789 892,915 1,326,577 650,155
Exposures to retail customers 38,467 3,211,440 1,391,558 4,211,695 2,622,505Exposures secured by mortgages in real property 59,685 69,260 252,692 682,192 753,405
Exposures in arrears 62,774 3,125 12,315 30,729 19,271
Exposures in other items 457,831 0 0 108,464 525,755Total items with credit risk etc. 2,107,733 4,326,852 2,626,225 6,529,594 4,571,158
*) Balance-sheet items are defined according to the provisions of the Executive Order on Capital Adequacy.

28
Table 24Sector breakdown of exposure category – as at 31 December 2010
Central govern-ments and central banks DKK ’000
Institutions
DKK ’000
Enterprises
DKK ’000
Retail customers
DKK ’000
Mortgages in real property
DKK ’000
Arrears or overdrafts
DKK ’000
Other items
DKK ’000
Public authorities 30,858 0 138,129 317,642 30,570 165 0Corporate
Agriculture, hunting and forestry 0 0 56,319 73,106 12,547 1,830 0
Fisheries 0 0 0 1,500 0 0 0Manufacturing, extraction of raw materials, power, gas, water and heat plants 0 0 291,556 350,790 51,183 366 0
Building and construction 0 0 271,840 388,257 66,880 7,659 0Retailers, restaurants and hotels 0 0 1,259,193 982,521 119,618 36,895 0Transport, post and telephone 0 0 233,451 178,601 20,989 3,702 0Credit and finance business as well as insurance business 74,823 3,827,470 1,983,682 29,231 11,798 307 3,222Property administration, estate agency, and business services 0 0 1,668,306 1,414,327 255,793 35,571 0
Other corporate 0 0 946,952 702,127 125,223 1,960 0Total corporate 74,823 3,827,470 6,711,299 4,120,460 664,031 88,290 3,222Private 0 0 402,486 11,577,374 1,148,215 62,639 0Other items 0 0 0 0 0 0 1,088,828Total 105,681 3,827,470 7,251,914 16,015,476 1,842,816 151,094 1,092,050
Table 25Credit-risk reduction broken down by exposure categories as at 31 December 2010
Central govern-ments and central banks DKK ’000
Institutions
DKK ’000
Enterprises
DKK ’000
Retail customers
DKK ’000
Mortgages in real property
DKK ’000
Arrears or overdrafts
DKK ’000
Other items
DKK ’000
Adjusted value of the collateral 0 585,792 270,300 151,468 181 20,140 0

A K T I E S E L S K A B E T
CVR-nr. 31 46 70 12, København
Panoptikonbygningen
Vesterbrogade 5 · 1502 København V
Telefon 38 48 48 48 · www.a l -bank.dk

Building on sound values
adva
nce.
dk