groping: geomagnetism and crowdsensing … propose geomagnetism and crowdsensing powered indoor...
TRANSCRIPT
1
GROPING: Geomagnetism andcROwdsensing Powered Indoor NaviGation
Chi Zhang, Kalyan P. Subbu, Jun Luo, and Jianxin Wu
Abstract—Although a large number of WiFi fingerprinting based indoor localization systems have been proposed, our fieldexperience with Google Maps Indoor (GMI), the only system available for public testing, shows that it is far from mature forindoor navigation. In this paper, we first report our field studies with GMI, as well as experiment results aiming to explain ourunsatisfactory GMI experience. Then motivated by the obtained insights, we propose GROPING as a self-contained indoornavigation system independent of any infrastructural support. GROPING relies on geomagnetic fingerprints that are far morestable than WiFi fingerprints, and it exploits crowdsensing to construct floor maps rather than expecting individual venues tosupply digitized maps. Based on our experiments with 20 participants in various floors of a big shopping mall, GROPING is ableto deliver a sufficient accuracy for localization and thus provides smooth navigation experience.
Index Terms—Indoor Navigation, Indoor Localization, Geomagnetism, Mobile Crowdsensing
F
1 INTRODUCTION
Successful indoor navigation requires computing locationinformation and visualizing that information on a mapin real-time. Though commercial products (e.g., [2], [3])and innumerable academic solutions (e.g., [5], [14], [37],[32]) have been developed for indoor localization, indoornavigation still appears to be a challenging issue. On onehand, wireless signal (e.g., WiFi and GSM), the mostexploited source for inferring location [37], [34], [24], [15],may not be suitable for navigation purposes. On the otherhand, presuming the availability of floor maps is commonin most existing proposals, but digitized floor maps are noteasily available due to proprietary and privacy issues.
It is well known that RF signals suffer from instabil-ity, which implies that achieving a satisfactory locationaccuracy demands heavy computations [37]. Moreover, RFsensing is notoriously energy consuming. As both factorsgo against navigation that entails a continuous and real-timelocation estimation, a fully functional navigation serviceseems to demand a lightweight localization scheme efficientin both computation and energy consumption.
The dependence of navigation on digitized maps is notas strong as we often expect. As described in [16], peoplebuild cognitive maps by subconsciously remembering land-marks and moving between them to reach their destinations.Therefore, the imperceptible signs contained in a digitizedmap may not be that relevant; a more practical solution
• Chi Zhang and Jun Luo are with the School of Computer Engineering,Nanyang Technological University (NTU), Singapore.E-mail: {czhang8, junluo}@ntu.edu.sg
• Kalyan P. Subbu is with Amrita University, India. The work was donewhen he was a post-doctoral researcher at NTU.E-mail: [email protected]
• Jianxin Wu is with the National Key Laboratory for Novel SoftwareTechnology, Nanjing University, China.E-mail: [email protected]
could be to involve human users themselves to collectivelyconstruct a map and also to provide semantic landmark in-formation. Specifically, people carrying smartphones loadedwith sensors can either volunteer or be recruited to gatherinformation from the ambient environment for both mapconstruction and landmark identification. This form of in-formation collection through human participation is indeeda type of mobile crowdsensing [12].
Localization commonly requires a fingerprint libraryagainst which certain newly sampled signal may compareand hence determine the location. However, the localizationfunction required by indoor navigation differs in two mainaspects from a pure localization scheme that pinpoints thecurrent position of a user. On one hand, it requires real-time and constant location computations. This means that itdemands very stable fingerprints, as it may not afford com-paring with a library in which a single location is associatedwith a large number of fingerprints (e.g., WiFi fingerprints[23], [15]). On the other hand, it does not require a veryhigh accuracy, as the navigation service only needs to leada user to a point within the visual range of the actualdestination. This makes it unnecessary to have a meterlevel accuracy achieved by, for example, dead reckoningsystems [19] at the cost of handling directional/drift errorsand performing calibrations/computations with multi-sensordata on resource constrained devices. Therefore, our designapplies the magnetometer and exploits geomagnetism as thelocation indicating fingerprint: it is lightweight (only a 3Dvector) and very stable, and it is completely independentof any kind of wireless infrastructure.
To better motivate our design philosophy, we first reporta study on Google Maps Indoor (GMI) [3], the only indoornavigation system available for public testing, as well ason basic properties of both WiFi and geomagnetism inlocation estimation; this study reveals issues pertaining tothe aforementioned ones. In response to these issues, we
2
propose Geomagnetism and cROwdsensing Powered IndoorNaviGation (GROPING) as a completely self-contained,lightweight, and practical prototype for indoor navigation.GROPING encapsulates three functions, namely map build-ing, localization and navigation, into one unit. It first buildsa map using user contributed sensor data and semanticlabels; it then performs localization based on the magneticfingerprints, and finally it runs a navigation service ontop of these two functions: it computes navigational routesusing the early constructed map and the real-time locationinformation. In this way, GROPING eliminates infrastruc-ture dependence: it needs neither wireless infrastructurenor digitized floor maps. Our intensive experiments withGROPING demonstrate its usability and also show thatit compares favorably with typical WiFi-based localizationsystems in supporting indoor navigation.
2 STUDIES ON GOOGLE MAPS INDOORIn spite of the huge numbers of proposals on indoorlocalization, the only system that is available for publictesting is Google Maps Indoor (GMI) [3]. Therefore, weorganize a group of 11 people to perform a detailed studyon it. Given that GMI appears to a user as a blackbox, ourstudy is separated into three parts. The first part is a fieldstudy in five big-scale shopping malls (above 10000 m2) totest the accuracy of GMI, as well as to make sure if WiFiis used by GMI (which appears to be true). The secondpart, assuming WiFi is the main source for GMI, is a labtest on the stability of WiFi fingerprints; it aims to explainthe observation that we have made in the field study. Thethird part reports an evaluation of the energy efficiency ofWiFi-based localization systems, leveraging on the energyprofiles obtained as a by-product of the earlier studies.
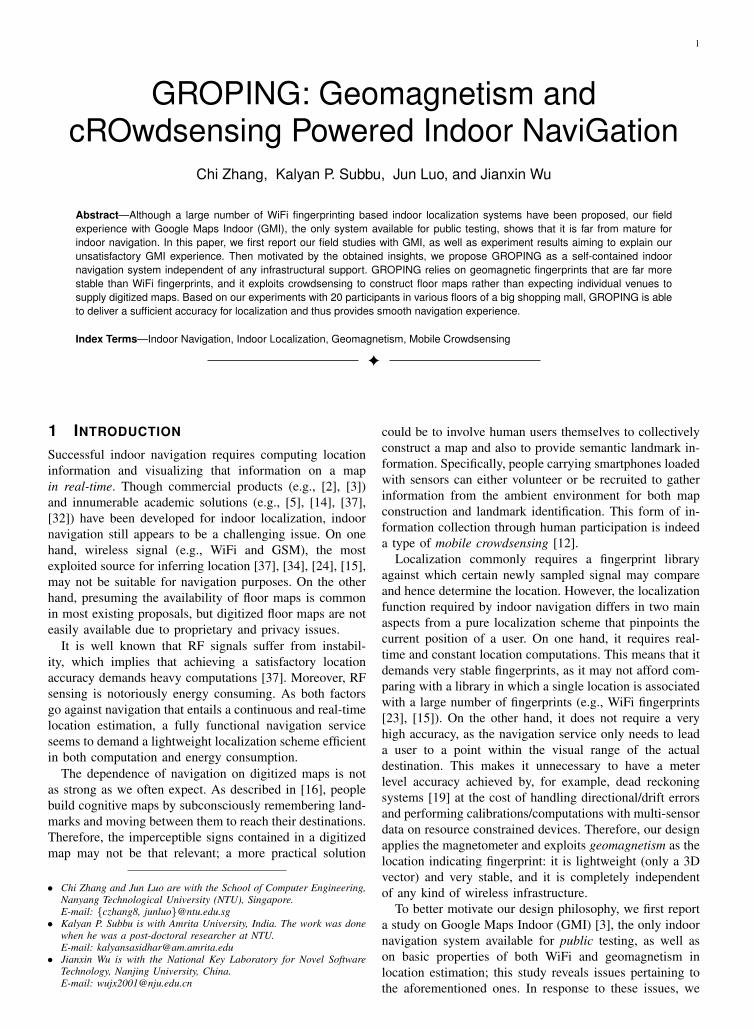
2.1 A Field Study on GMIAs GMI works only for venues that contribute floor mapsto Google, we are confined in choosing test sites (Fig. 1(a)shows two of them). In fact, only 11 shopping malls inSingapore have GMI support available. The mobile phoneswe use include Samsung Galaxy S2/S3, Sony Xperia S, andHTC One X. In this study we mainly want to answer thefollowing three questions.• Q1: What is the accuracy of GMI’s localization?• Q2: Does GMI’s navigation work well?• Q3: Does GMI heavily rely on WiFi infrastructure?
2.1.1 Location AccuracyThe team members unanimously agree that GMI usuallyproduce unsatisfactory localization accuracy. We first showa few screenshots taken on GMI in Fig. 1(b), in which bothactual locations (pinpointed by the users on-site) and thelocations indicated by GMI (the blue arrows) are shown.
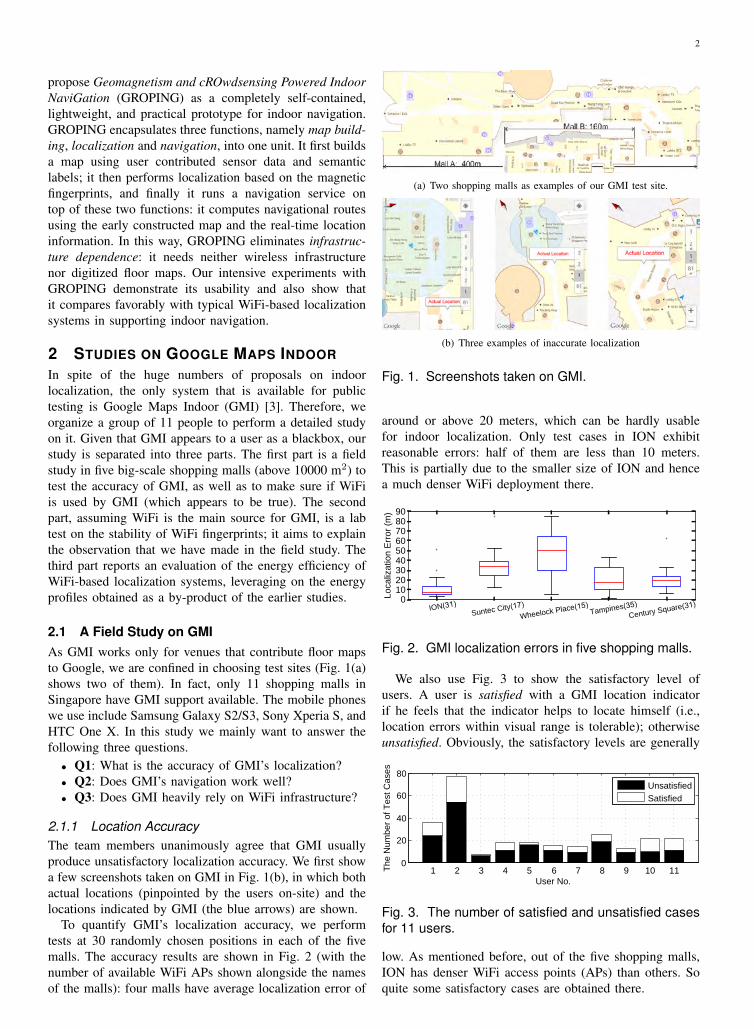
To quantify GMI’s localization accuracy, we performtests at 30 randomly chosen positions in each of the fivemalls. The accuracy results are shown in Fig. 2 (with thenumber of available WiFi APs shown alongside the namesof the malls): four malls have average localization error of
(a) Two shopping malls as examples of our GMI test site.
(b) Three examples of inaccurate localization
Fig. 1. Screenshots taken on GMI.
around or above 20 meters, which can be hardly usablefor indoor localization. Only test cases in ION exhibitreasonable errors: half of them are less than 10 meters.This is partially due to the smaller size of ION and hencea much denser WiFi deployment there.
ION(31)Suntec City(17)
Wheelock Place(15)Tampines(35)
Century Square(31)0
102030405060708090
Localiz
ation E
rror
(m)
Fig. 2. GMI localization errors in five shopping malls.
We also use Fig. 3 to show the satisfactory level ofusers. A user is satisfied with a GMI location indicatorif he feels that the indicator helps to locate himself (i.e.,location errors within visual range is tolerable); otherwiseunsatisfied. Obviously, the satisfactory levels are generally
1 2 3 4 5 6 7 8 9 10 110
20
40
60
80
User No.
The N
um
ber
of T
est C
ases
Unsatisfied
Satisfied
Fig. 3. The number of satisfied and unsatisfied casesfor 11 users.
low. As mentioned before, out of the five shopping malls,ION has denser WiFi access points (APs) than others. Soquite some satisfactory cases are obtained there.
3
2.1.2 Navigation and WiFi RelianceGMI’s navigation function does not appear to be usefuldue to the unsatisfactory location accuracy (see the abovediscussions). Note that even if the initial location is sat-isfactory, a few unsatisfactory location estimations on theway may ruin the navigation.
All our results have evidently confirmed GMI’s heavyreliance on WiFi infrastructure: when either a phone’sWiFi interface is switched off or the WiFi signals becomevery weak (in a basement level where WiFi hotspotsare not installed), the GMI’s location indicator is oftenexpelled outside of the building, suggesting that some sortof cellular-based location estimation is applied.
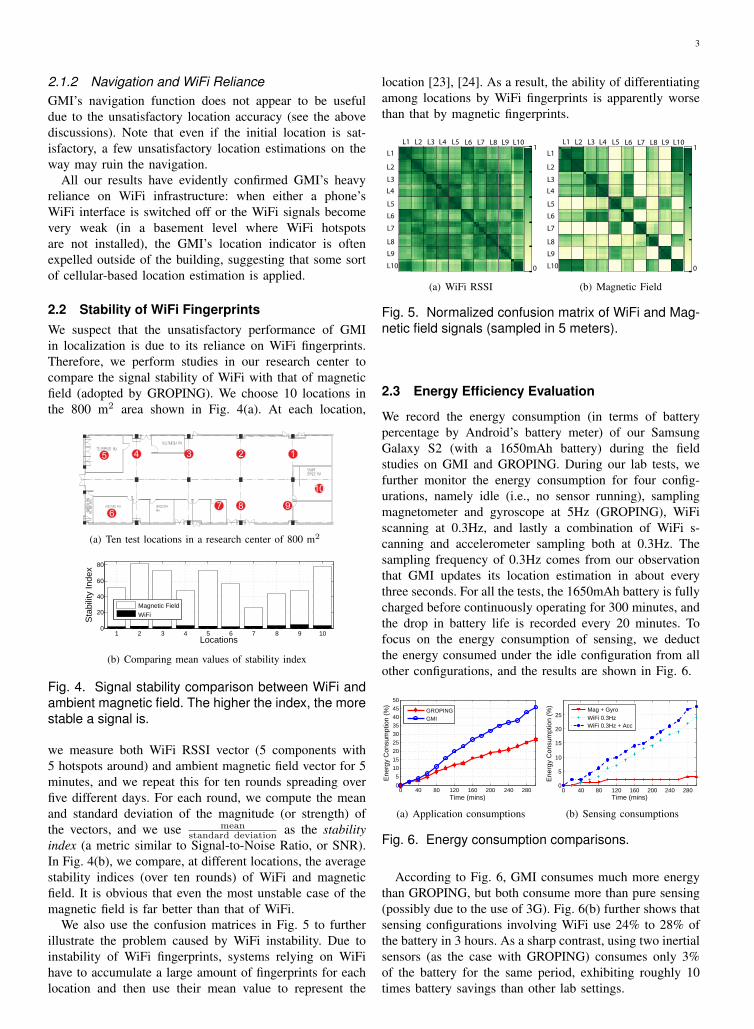
2.2 Stability of WiFi FingerprintsWe suspect that the unsatisfactory performance of GMIin localization is due to its reliance on WiFi fingerprints.Therefore, we perform studies in our research center tocompare the signal stability of WiFi with that of magneticfield (adopted by GROPING). We choose 10 locations inthe 800 m2 area shown in Fig. 4(a). At each location,
12345
67 8 9
10
(a) Ten test locations in a research center of 800 m2
1 2 3 4 5 6 7 8 9 100
20
40
60
80
Locations
Sta
bili
ty Index
Magnetic Field
WiFi
(b) Comparing mean values of stability index
Fig. 4. Signal stability comparison between WiFi andambient magnetic field. The higher the index, the morestable a signal is.
we measure both WiFi RSSI vector (5 components with5 hotspots around) and ambient magnetic field vector for 5minutes, and we repeat this for ten rounds spreading overfive different days. For each round, we compute the meanand standard deviation of the magnitude (or strength) ofthe vectors, and we use mean
standard deviation as the stabilityindex (a metric similar to Signal-to-Noise Ratio, or SNR).In Fig. 4(b), we compare, at different locations, the averagestability indices (over ten rounds) of WiFi and magneticfield. It is obvious that even the most unstable case of themagnetic field is far better than that of WiFi.
We also use the confusion matrices in Fig. 5 to furtherillustrate the problem caused by WiFi instability. Due toinstability of WiFi fingerprints, systems relying on WiFihave to accumulate a large amount of fingerprints for eachlocation and then use their mean value to represent the
location [23], [24]. As a result, the ability of differentiatingamong locations by WiFi fingerprints is apparently worsethan that by magnetic fingerprints.
1
0
L1 L2 L3 L4 L5 L6 L7 L8 L9 L10
L1
L2
L3
L4
L5
L6
L7
L8
L9
L10
(a) WiFi RSSI
1
0
L1 L2 L3 L4 L5 L6 L7 L8 L9 L10
L1
L2
L3
L4
L5
L6
L7
L8
L9
L10
(b) Magnetic Field
Fig. 5. Normalized confusion matrix of WiFi and Mag-netic field signals (sampled in 5 meters).
2.3 Energy Efficiency Evaluation
We record the energy consumption (in terms of batterypercentage by Android’s battery meter) of our SamsungGalaxy S2 (with a 1650mAh battery) during the fieldstudies on GMI and GROPING. During our lab tests, wefurther monitor the energy consumption for four config-urations, namely idle (i.e., no sensor running), samplingmagnetometer and gyroscope at 5Hz (GROPING), WiFiscanning at 0.3Hz, and lastly a combination of WiFi s-canning and accelerometer sampling both at 0.3Hz. Thesampling frequency of 0.3Hz comes from our observationthat GMI updates its location estimation in about everythree seconds. For all the tests, the 1650mAh battery is fullycharged before continuously operating for 300 minutes, andthe drop in battery life is recorded every 20 minutes. Tofocus on the energy consumption of sensing, we deductthe energy consumed under the idle configuration from allother configurations, and the results are shown in Fig. 6.
0 40 80 120 160 200 240 2800
5
10
15
20
25
30
35
40
45
50
En
erg
y C
on
su
mp
tio
n (
%)
Time (mins)
GROPING
GMI
(a) Application consumptions
0 40 80 120 160 200 240 2800
5
10
15
20
25
Time (mins)
En
erg
y C
on
su
mp
tio
n (
%)
Mag + Gyro
WiFi 0.3Hz
WiFi 0.3Hz + Acc
(b) Sensing consumptions
Fig. 6. Energy consumption comparisons.
According to Fig. 6, GMI consumes much more energythan GROPING, but both consume more than pure sensing(possibly due to the use of 3G). Fig. 6(b) further shows thatsensing configurations involving WiFi use 24% to 28% ofthe battery in 3 hours. As a sharp contrast, using two inertialsensors (as the case with GROPING) consumes only 3%of the battery for the same period, exhibiting roughly 10times battery savings than other lab settings.
4
2.4 Summary
We summarize the key insights on GMI that motivate ourdesigns of GROPING in the following:• GMI’s implementation of WiFi-based localization has
not worked accurately yet. This may attribute to theinstability of WiFi signals, sparse WiFi deployments,and insufficient fingerprints.
• GMI cannot be very helpful in indoor navigationdue to unsatisfactory location accuracy, as navigationrequires consistent location estimations.
• Localization over the whole map area is not helpfulfor navigation purpose, as errors in location estimationmay render the user location off a pathway and hencereduce the chance of successful navigation.1
• High energy consumption is another major drawbackof WiFi-based indoor localization systems, and thisissue is exacerbated under navigation due to its needfor constant location updates.
3 GROPING SYSTEM OVERVIEW
GROPING provides services that caters to users’ locationand navigation requests in various indoor facilities, and itrelies on the regular occupants of a certain indoor facilityto assist in building floor maps. Basically, the end usersinclude map explorers and strayed users. Map explorers arerecruited due to their familiarity with a particular building.They walk along various pathways and upload their trajec-tories (consisting of sensed data) to the server. Strayed usersare those who are unclear about their locations and hencerequire localization or/and navigation services. We illustratethe architecture of GROPING in Fig. 7. The system consists
Location &
Navigation
View
Map View
User In
terfa
ce
Se
rve
r C
om
po
ne
nts
Map Builder
Location
Estimator
Navigation
Manager
Dキテニゲデヴ;げゲ Shortest
path
Monte
Carlo
Localization
Magnetometer
Gyroscope
Fig. 7. GROPING system architecture.
of smartphone clients and a server. Each client provides auser interface for collecting data, as well as visualizing theconstructed map, the current (estimated) location, and thenavigation routes. The server is a cloud service; it consistsof modules that build floor maps, estimate locations, anddeliver real-time navigation. We shall briefly discuss thesecomponents in this section.
1. Google Maps (outdoor) only works for places where road systemscome across.
3.1 Map Building
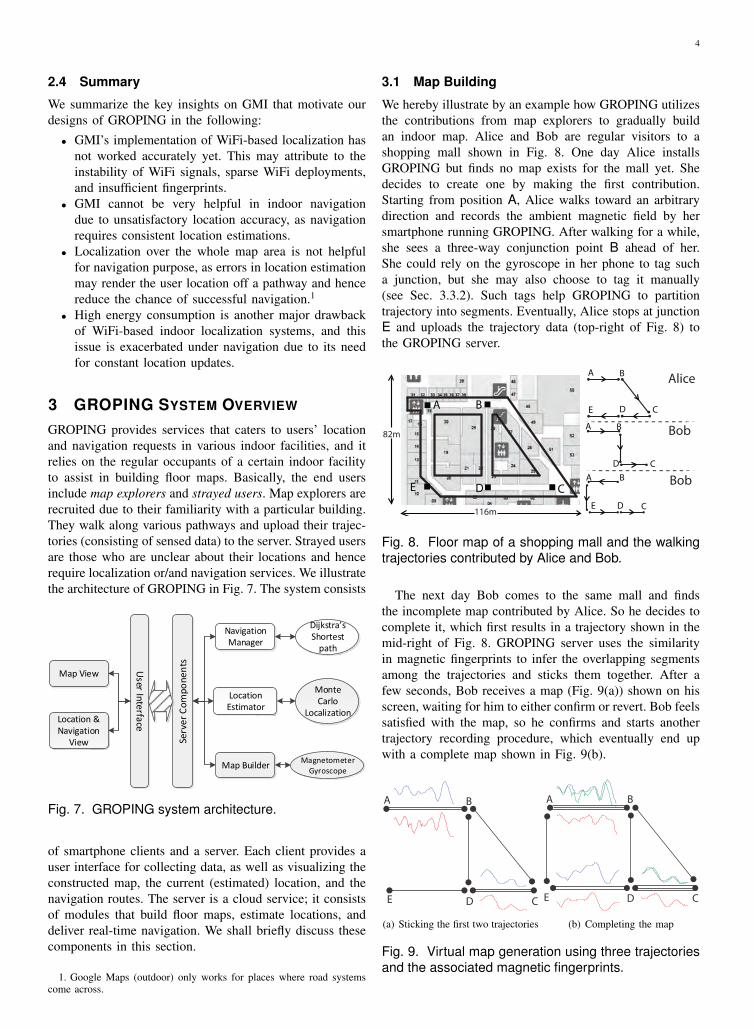
We hereby illustrate by an example how GROPING utilizesthe contributions from map explorers to gradually buildan indoor map. Alice and Bob are regular visitors to ashopping mall shown in Fig. 8. One day Alice installsGROPING but finds no map exists for the mall yet. Shedecides to create one by making the first contribution.Starting from position A, Alice walks toward an arbitrarydirection and records the ambient magnetic field by hersmartphone running GROPING. After walking for a while,she sees a three-way conjunction point B ahead of her.She could rely on the gyroscope in her phone to tag sucha junction, but she may also choose to tag it manually(see Sec. 3.3.2). Such tags help GROPING to partitiontrajectory into segments. Eventually, Alice stops at junctionE and uploads the trajectory data (top-right of Fig. 8) tothe GROPING server.
A B
CDE
A B
CDE
A B
CD
A B
CDE
82m
116m
Alice
Bob
Bob
Fig. 8. Floor map of a shopping mall and the walkingtrajectories contributed by Alice and Bob.
The next day Bob comes to the same mall and findsthe incomplete map contributed by Alice. So he decides tocomplete it, which first results in a trajectory shown in themid-right of Fig. 8. GROPING server uses the similarityin magnetic fingerprints to infer the overlapping segmentsamong the trajectories and sticks them together. After afew seconds, Bob receives a map (Fig. 9(a)) shown on hisscreen, waiting for him to either confirm or revert. Bob feelssatisfied with the map, so he confirms and starts anothertrajectory recording procedure, which eventually end upwith a complete map shown in Fig. 9(b).
A B
CDE
(a) Sticking the first two trajectories
A B
CDE
(b) Completing the map
Fig. 9. Virtual map generation using three trajectoriesand the associated magnetic fingerprints.
5
3.2 Localization and NavigationBased on the constructed map, the localization and navi-gation functions are integrated in GROPING, in the sensethat user mobility facilitates localization that in turn drivesfurther mobility (i.e., navigate a user). This is achieved by arevised Monte Carlo Localization (MCL) algorithm whosedetails are explained in Sec. 4.2. To continue our illustratingexample, let us consider a strayed user Cindy. She starts herGROPING client, chooses the already constructed map, andrequests a navigation service by either providing a semanticlabel (a shop name) or pinpointing a location on the map.Without knowing the initial location of Cindy, GROPINGrecommends a tentative route. While Cindy is walkingalong the route, her GROPING client keeps updating thesampled magnetic field information to the server. Thisallows GROPING to refine the location estimation forCindy and also updates the route accordingly, until Cindyreaches her destination.
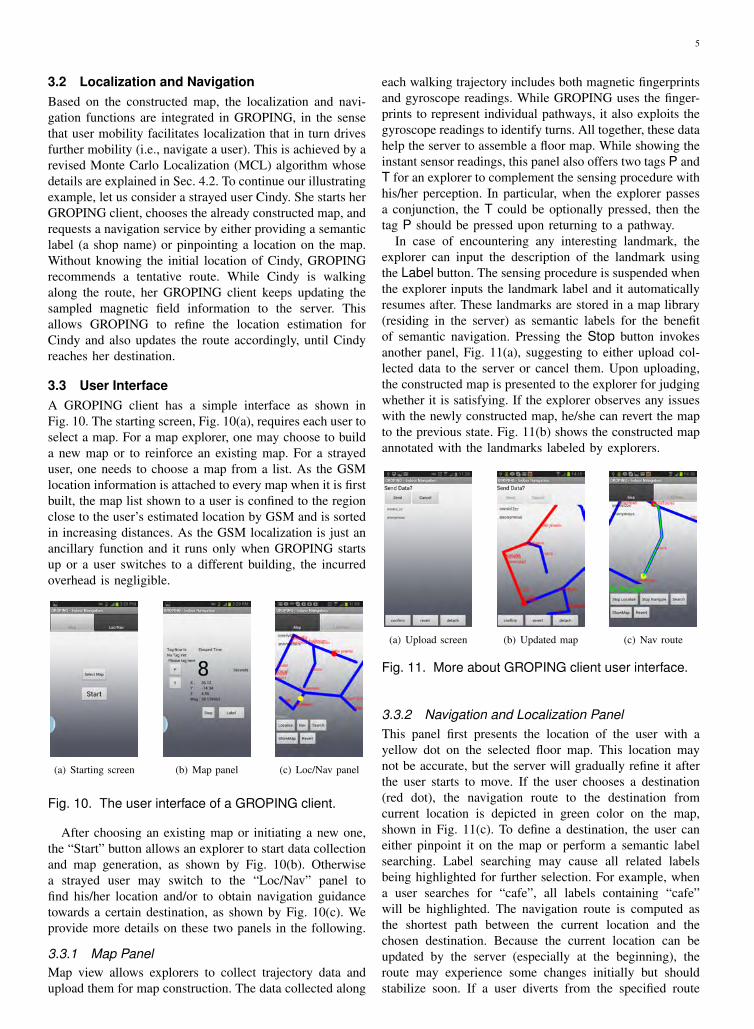
3.3 User InterfaceA GROPING client has a simple interface as shown inFig. 10. The starting screen, Fig. 10(a), requires each user toselect a map. For a map explorer, one may choose to builda new map or to reinforce an existing map. For a strayeduser, one needs to choose a map from a list. As the GSMlocation information is attached to every map when it is firstbuilt, the map list shown to a user is confined to the regionclose to the user’s estimated location by GSM and is sortedin increasing distances. As the GSM localization is just anancillary function and it runs only when GROPING startsup or a user switches to a different building, the incurredoverhead is negligible.
(a) Starting screen (b) Map panel (c) Loc/Nav panel
Fig. 10. The user interface of a GROPING client.
After choosing an existing map or initiating a new one,the “Start” button allows an explorer to start data collectionand map generation, as shown by Fig. 10(b). Otherwisea strayed user may switch to the “Loc/Nav” panel tofind his/her location and/or to obtain navigation guidancetowards a certain destination, as shown by Fig. 10(c). Weprovide more details on these two panels in the following.
3.3.1 Map PanelMap view allows explorers to collect trajectory data andupload them for map construction. The data collected along
each walking trajectory includes both magnetic fingerprintsand gyroscope readings. While GROPING uses the finger-prints to represent individual pathways, it also exploits thegyroscope readings to identify turns. All together, these datahelp the server to assemble a floor map. While showing theinstant sensor readings, this panel also offers two tags P andT for an explorer to complement the sensing procedure withhis/her perception. In particular, when the explorer passesa conjunction, the T could be optionally pressed, then thetag P should be pressed upon returning to a pathway.
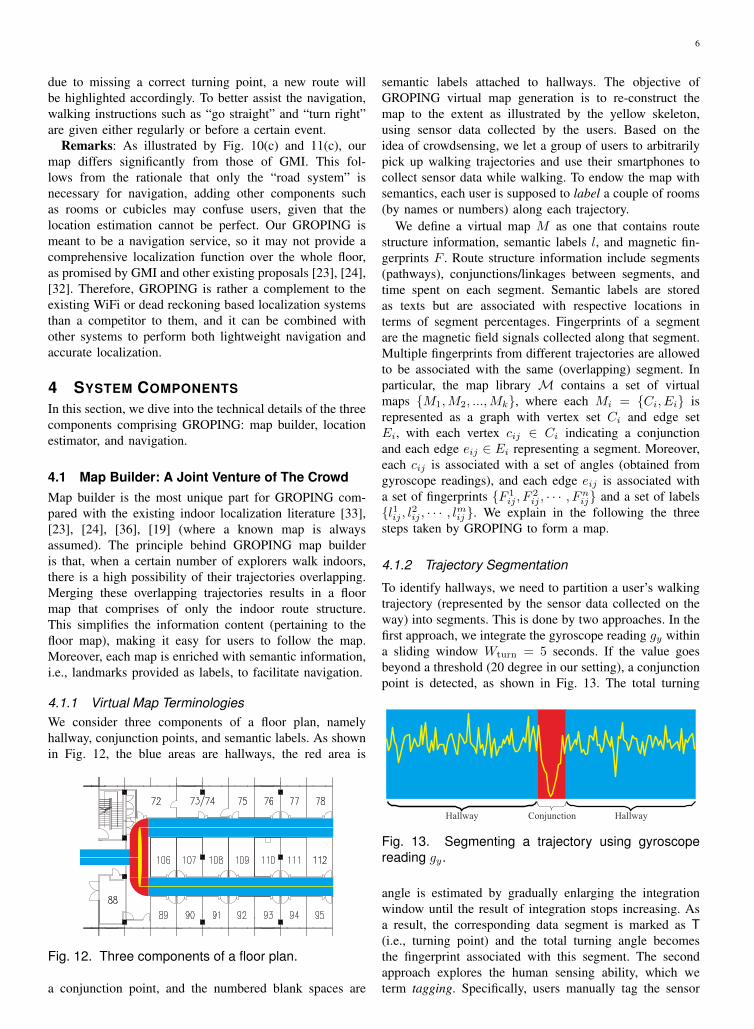
In case of encountering any interesting landmark, theexplorer can input the description of the landmark usingthe Label button. The sensing procedure is suspended whenthe explorer inputs the landmark label and it automaticallyresumes after. These landmarks are stored in a map library(residing in the server) as semantic labels for the benefitof semantic navigation. Pressing the Stop button invokesanother panel, Fig. 11(a), suggesting to either upload col-lected data to the server or cancel them. Upon uploading,the constructed map is presented to the explorer for judgingwhether it is satisfying. If the explorer observes any issueswith the newly constructed map, he/she can revert the mapto the previous state. Fig. 11(b) shows the constructed mapannotated with the landmarks labeled by explorers.
(a) Upload screen (b) Updated map (c) Nav route
Fig. 11. More about GROPING client user interface.
3.3.2 Navigation and Localization PanelThis panel first presents the location of the user with ayellow dot on the selected floor map. This location maynot be accurate, but the server will gradually refine it afterthe user starts to move. If the user chooses a destination(red dot), the navigation route to the destination fromcurrent location is depicted in green color on the map,shown in Fig. 11(c). To define a destination, the user caneither pinpoint it on the map or perform a semantic labelsearching. Label searching may cause all related labelsbeing highlighted for further selection. For example, whena user searches for “cafe”, all labels containing “cafe”will be highlighted. The navigation route is computed asthe shortest path between the current location and thechosen destination. Because the current location can beupdated by the server (especially at the beginning), theroute may experience some changes initially but shouldstabilize soon. If a user diverts from the specified route
6
due to missing a correct turning point, a new route willbe highlighted accordingly. To better assist the navigation,walking instructions such as “go straight” and “turn right”are given either regularly or before a certain event.
Remarks: As illustrated by Fig. 10(c) and 11(c), ourmap differs significantly from those of GMI. This fol-lows from the rationale that only the “road system” isnecessary for navigation, adding other components suchas rooms or cubicles may confuse users, given that thelocation estimation cannot be perfect. Our GROPING ismeant to be a navigation service, so it may not provide acomprehensive localization function over the whole floor,as promised by GMI and other existing proposals [23], [24],[32]. Therefore, GROPING is rather a complement to theexisting WiFi or dead reckoning based localization systemsthan a competitor to them, and it can be combined withother systems to perform both lightweight navigation andaccurate localization.
4 SYSTEM COMPONENTS
In this section, we dive into the technical details of the threecomponents comprising GROPING: map builder, locationestimator, and navigation.
4.1 Map Builder: A Joint Venture of The CrowdMap builder is the most unique part for GROPING com-pared with the existing indoor localization literature [33],[23], [24], [36], [19] (where a known map is alwaysassumed). The principle behind GROPING map builderis that, when a certain number of explorers walk indoors,there is a high possibility of their trajectories overlapping.Merging these overlapping trajectories results in a floormap that comprises of only the indoor route structure.This simplifies the information content (pertaining to thefloor map), making it easy for users to follow the map.Moreover, each map is enriched with semantic information,i.e., landmarks provided as labels, to facilitate navigation.
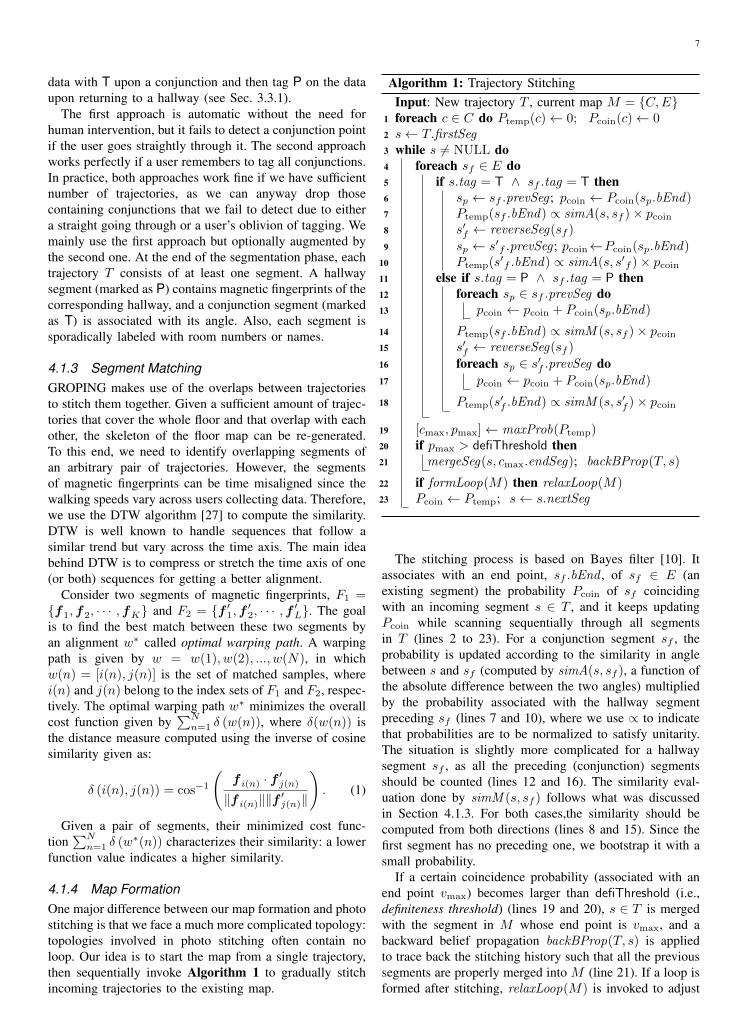
4.1.1 Virtual Map TerminologiesWe consider three components of a floor plan, namelyhallway, conjunction points, and semantic labels. As shownin Fig. 12, the blue areas are hallways, the red area is
Fig. 12. Three components of a floor plan.
a conjunction point, and the numbered blank spaces are
semantic labels attached to hallways. The objective ofGROPING virtual map generation is to re-construct themap to the extent as illustrated by the yellow skeleton,using sensor data collected by the users. Based on theidea of crowdsensing, we let a group of users to arbitrarilypick up walking trajectories and use their smartphones tocollect sensor data while walking. To endow the map withsemantics, each user is supposed to label a couple of rooms(by names or numbers) along each trajectory.
We define a virtual map M as one that contains routestructure information, semantic labels l, and magnetic fin-gerprints F . Route structure information include segments(pathways), conjunctions/linkages between segments, andtime spent on each segment. Semantic labels are storedas texts but are associated with respective locations interms of segment percentages. Fingerprints of a segmentare the magnetic field signals collected along that segment.Multiple fingerprints from different trajectories are allowedto be associated with the same (overlapping) segment. Inparticular, the map library M contains a set of virtualmaps {M1,M2, ...,Mk}, where each Mi = {Ci, Ei} isrepresented as a graph with vertex set Ci and edge setEi, with each vertex cij ∈ Ci indicating a conjunctionand each edge eij ∈ Ei representing a segment. Moreover,each cij is associated with a set of angles (obtained fromgyroscope readings), and each edge eij is associated witha set of fingerprints {F 1
ij , F2ij , · · · , Fn
ij} and a set of labels{l1ij , l2ij , · · · , lmij }. We explain in the following the threesteps taken by GROPING to form a map.
4.1.2 Trajectory Segmentation
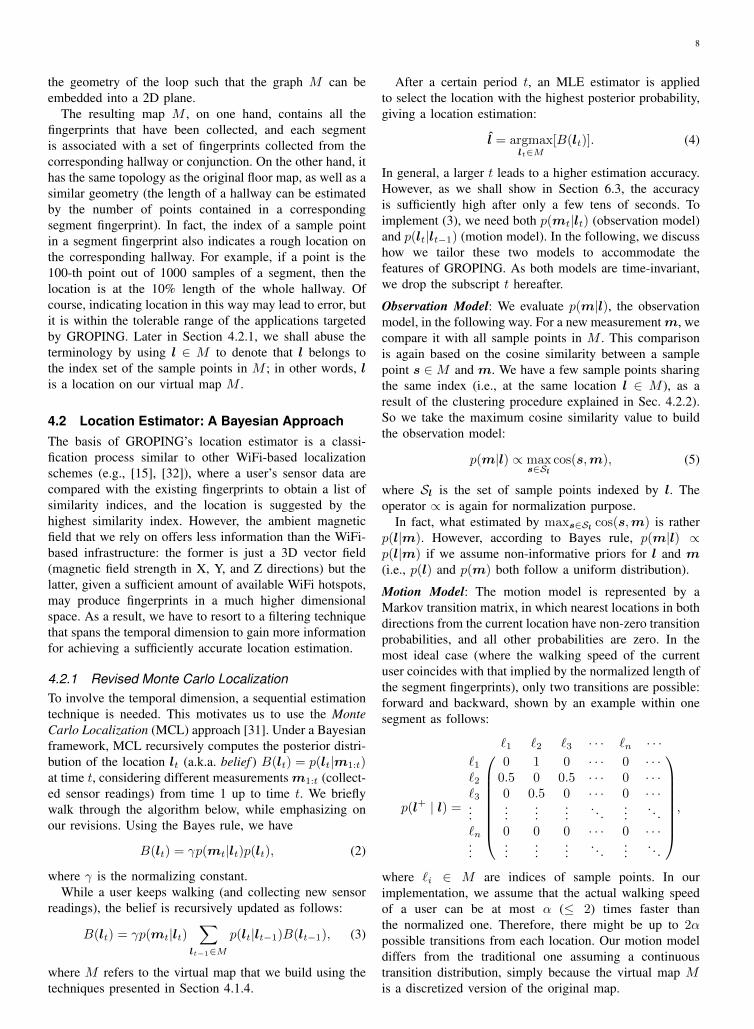
To identify hallways, we need to partition a user’s walkingtrajectory (represented by the sensor data collected on theway) into segments. This is done by two approaches. In thefirst approach, we integrate the gyroscope reading gy withina sliding window Wturn = 5 seconds. If the value goesbeyond a threshold (20 degree in our setting), a conjunctionpoint is detected, as shown in Fig. 13. The total turning
Hallway HallwayConjunction
Fig. 13. Segmenting a trajectory using gyroscopereading gy.
angle is estimated by gradually enlarging the integrationwindow until the result of integration stops increasing. Asa result, the corresponding data segment is marked as T(i.e., turning point) and the total turning angle becomesthe fingerprint associated with this segment. The secondapproach explores the human sensing ability, which weterm tagging. Specifically, users manually tag the sensor
7
data with T upon a conjunction and then tag P on the dataupon returning to a hallway (see Sec. 3.3.1).
The first approach is automatic without the need forhuman intervention, but it fails to detect a conjunction pointif the user goes straightly through it. The second approachworks perfectly if a user remembers to tag all conjunctions.In practice, both approaches work fine if we have sufficientnumber of trajectories, as we can anyway drop thosecontaining conjunctions that we fail to detect due to eithera straight going through or a user’s oblivion of tagging. Wemainly use the first approach but optionally augmented bythe second one. At the end of the segmentation phase, eachtrajectory T consists of at least one segment. A hallwaysegment (marked as P) contains magnetic fingerprints of thecorresponding hallway, and a conjunction segment (markedas T) is associated with its angle. Also, each segment issporadically labeled with room numbers or names.
4.1.3 Segment MatchingGROPING makes use of the overlaps between trajectoriesto stitch them together. Given a sufficient amount of trajec-tories that cover the whole floor and that overlap with eachother, the skeleton of the floor map can be re-generated.To this end, we need to identify overlapping segments ofan arbitrary pair of trajectories. However, the segmentsof magnetic fingerprints can be time misaligned since thewalking speeds vary across users collecting data. Therefore,we use the DTW algorithm [27] to compute the similarity.DTW is well known to handle sequences that follow asimilar trend but vary across the time axis. The main ideabehind DTW is to compress or stretch the time axis of one(or both) sequences for getting a better alignment.
Consider two segments of magnetic fingerprints, F1 ={f1,f2, · · · ,fK} and F2 = {f ′1,f
′2, · · · ,f
′L}. The goal
is to find the best match between these two segments byan alignment w∗ called optimal warping path. A warpingpath is given by w = w(1), w(2), ..., w(N), in whichw(n) = [i(n), j(n)] is the set of matched samples, wherei(n) and j(n) belong to the index sets of F1 and F2, respec-tively. The optimal warping path w∗ minimizes the overallcost function given by
∑Nn=1 δ (w(n)), where δ(w(n)) is
the distance measure computed using the inverse of cosinesimilarity given as:
δ (i(n), j(n)) = cos−1
(f i(n) · f
′j(n)
‖f i(n)‖‖f′j(n)‖
). (1)
Given a pair of segments, their minimized cost func-tion
∑Nn=1 δ (w
∗(n)) characterizes their similarity: a lowerfunction value indicates a higher similarity.
4.1.4 Map FormationOne major difference between our map formation and photostitching is that we face a much more complicated topology:topologies involved in photo stitching often contain noloop. Our idea is to start the map from a single trajectory,then sequentially invoke Algorithm 1 to gradually stitchincoming trajectories to the existing map.
Algorithm 1: Trajectory StitchingInput: New trajectory T , current map M = {C,E}
1 foreach c ∈ C do Ptemp(c)← 0; Pcoin(c)← 02 s← T.firstSeg3 while s 6= NULL do4 foreach sf ∈ E do5 if s.tag = T ∧ sf .tag = T then6 sp ← sf .prevSeg ; pcoin ← Pcoin(sp.bEnd)7 Ptemp(sf .bEnd) ∝ simA(s, sf )× pcoin8 s′f ← reverseSeg(sf )
9 sp ← s′f .prevSeg ; pcoin←Pcoin(sp.bEnd)10 Ptemp(s
′f .bEnd) ∝ simA(s, s′f )× pcoin
11 else if s.tag = P ∧ sf .tag = P then12 foreach sp ∈ sf .prevSeg do13 pcoin ← pcoin + Pcoin(sp.bEnd)
14 Ptemp(sf .bEnd) ∝ simM (s, sf )× pcoin15 s′f ← reverseSeg(sf )
16 foreach sp ∈ s′f .prevSeg do17 pcoin ← pcoin + Pcoin(sp.bEnd)
18 Ptemp(s′f .bEnd) ∝ simM (s, s′f )× pcoin
19 [cmax, pmax]← maxProb(Ptemp)20 if pmax > defiThreshold then21 mergeSeg(s, cmax.endSeg); backBProp(T, s)
22 if formLoop(M) then relaxLoop(M)23 Pcoin ← Ptemp; s← s.nextSeg
The stitching process is based on Bayes filter [10]. Itassociates with an end point, sf .bEnd , of sf ∈ E (anexisting segment) the probability Pcoin of sf coincidingwith an incoming segment s ∈ T , and it keeps updatingPcoin while scanning sequentially through all segmentsin T (lines 2 to 23). For a conjunction segment sf , theprobability is updated according to the similarity in anglebetween s and sf (computed by simA(s, sf ), a function ofthe absolute difference between the two angles) multipliedby the probability associated with the hallway segmentpreceding sf (lines 7 and 10), where we use ∝ to indicatethat probabilities are to be normalized to satisfy unitarity.The situation is slightly more complicated for a hallwaysegment sf , as all the preceding (conjunction) segmentsshould be counted (lines 12 and 16). The similarity eval-uation done by simM (s, sf ) follows what was discussedin Section 4.1.3. For both cases,the similarity should becomputed from both directions (lines 8 and 15). Since thefirst segment has no preceding one, we bootstrap it with asmall probability.
If a certain coincidence probability (associated with anend point vmax) becomes larger than defiThreshold (i.e.,definiteness threshold) (lines 19 and 20), s ∈ T is mergedwith the segment in M whose end point is vmax, and abackward belief propagation backBProp(T, s) is appliedto trace back the stitching history such that all the previoussegments are properly merged into M (line 21). If a loop isformed after stitching, relaxLoop(M) is invoked to adjust
8
the geometry of the loop such that the graph M can beembedded into a 2D plane.
The resulting map M , on one hand, contains all thefingerprints that have been collected, and each segmentis associated with a set of fingerprints collected from thecorresponding hallway or conjunction. On the other hand, ithas the same topology as the original floor map, as well as asimilar geometry (the length of a hallway can be estimatedby the number of points contained in a correspondingsegment fingerprint). In fact, the index of a sample pointin a segment fingerprint also indicates a rough location onthe corresponding hallway. For example, if a point is the100-th point out of 1000 samples of a segment, then thelocation is at the 10% length of the whole hallway. Ofcourse, indicating location in this way may lead to error, butit is within the tolerable range of the applications targetedby GROPING. Later in Section 4.2.1, we shall abuse theterminology by using l ∈ M to denote that l belongs tothe index set of the sample points in M ; in other words, lis a location on our virtual map M .
4.2 Location Estimator: A Bayesian ApproachThe basis of GROPING’s location estimator is a classi-fication process similar to other WiFi-based localizationschemes (e.g., [15], [32]), where a user’s sensor data arecompared with the existing fingerprints to obtain a list ofsimilarity indices, and the location is suggested by thehighest similarity index. However, the ambient magneticfield that we rely on offers less information than the WiFi-based infrastructure: the former is just a 3D vector field(magnetic field strength in X, Y, and Z directions) but thelatter, given a sufficient amount of available WiFi hotspots,may produce fingerprints in a much higher dimensionalspace. As a result, we have to resort to a filtering techniquethat spans the temporal dimension to gain more informationfor achieving a sufficiently accurate location estimation.
4.2.1 Revised Monte Carlo LocalizationTo involve the temporal dimension, a sequential estimationtechnique is needed. This motivates us to use the MonteCarlo Localization (MCL) approach [31]. Under a Bayesianframework, MCL recursively computes the posterior distri-bution of the location lt (a.k.a. belief ) B(lt) = p(lt|m1:t)at time t, considering different measurements m1:t (collect-ed sensor readings) from time 1 up to time t. We brieflywalk through the algorithm below, while emphasizing onour revisions. Using the Bayes rule, we have
B(lt) = γp(mt|lt)p(lt), (2)
where γ is the normalizing constant.While a user keeps walking (and collecting new sensor
readings), the belief is recursively updated as follows:
B(lt) = γp(mt|lt)∑
lt−1∈M
p(lt|lt−1)B(lt−1), (3)
where M refers to the virtual map that we build using thetechniques presented in Section 4.1.4.
After a certain period t, an MLE estimator is appliedto select the location with the highest posterior probability,giving a location estimation:
l̂ = argmaxlt∈M
[B(lt)]. (4)
In general, a larger t leads to a higher estimation accuracy.However, as we shall show in Section 6.3, the accuracyis sufficiently high after only a few tens of seconds. Toimplement (3), we need both p(mt|lt) (observation model)and p(lt|lt−1) (motion model). In the following, we discusshow we tailor these two models to accommodate thefeatures of GROPING. As both models are time-invariant,we drop the subscript t hereafter.
Observation Model: We evaluate p(m|l), the observationmodel, in the following way. For a new measurement m, wecompare it with all sample points in M . This comparisonis again based on the cosine similarity between a samplepoint s ∈M and m. We have a few sample points sharingthe same index (i.e., at the same location l ∈ M ), as aresult of the clustering procedure explained in Sec. 4.2.2).So we take the maximum cosine similarity value to buildthe observation model:
p(m|l) ∝ maxs∈Sl
cos(s,m), (5)
where Sl is the set of sample points indexed by l. Theoperator ∝ is again for normalization purpose.
In fact, what estimated by maxs∈Sl cos(s,m) is ratherp(l|m). However, according to Bayes rule, p(m|l) ∝p(l|m) if we assume non-informative priors for l and m(i.e., p(l) and p(m) both follow a uniform distribution).
Motion Model: The motion model is represented by aMarkov transition matrix, in which nearest locations in bothdirections from the current location have non-zero transitionprobabilities, and all other probabilities are zero. In themost ideal case (where the walking speed of the currentuser coincides with that implied by the normalized length ofthe segment fingerprints), only two transitions are possible:forward and backward, shown by an example within onesegment as follows:
p(l+ | l) =
`1 `2 `3 · · · `n · · ·`1 0 1 0 · · · 0 · · ·`2 0.5 0 0.5 · · · 0 · · ·`3 0 0.5 0 · · · 0 · · ·...
......
.... . .
.... . .
`n 0 0 0 · · · 0 · · ·...
......
.... . .
.... . .
,
where `i ∈ M are indices of sample points. In ourimplementation, we assume that the actual walking speedof a user can be at most α (≤ 2) times faster thanthe normalized one. Therefore, there might be up to 2αpossible transitions from each location. Our motion modeldiffers from the traditional one assuming a continuoustransition distribution, simply because the virtual map Mis a discretized version of the original map.
9
There is yet another issue that we need to handle beforeproceeding to actual localization. As incoming segmentfingerprints increase linearly with user participation, thistends to increase the complexity of location estimation,since more and more fingerprints need to be comparedagainst the newly sampled sensor data. To this end, weapply a clustering algorithm to obtain the representativesamong the fingerprints for a given segment in the following.
4.2.2 Clustering with Affinity Propagation
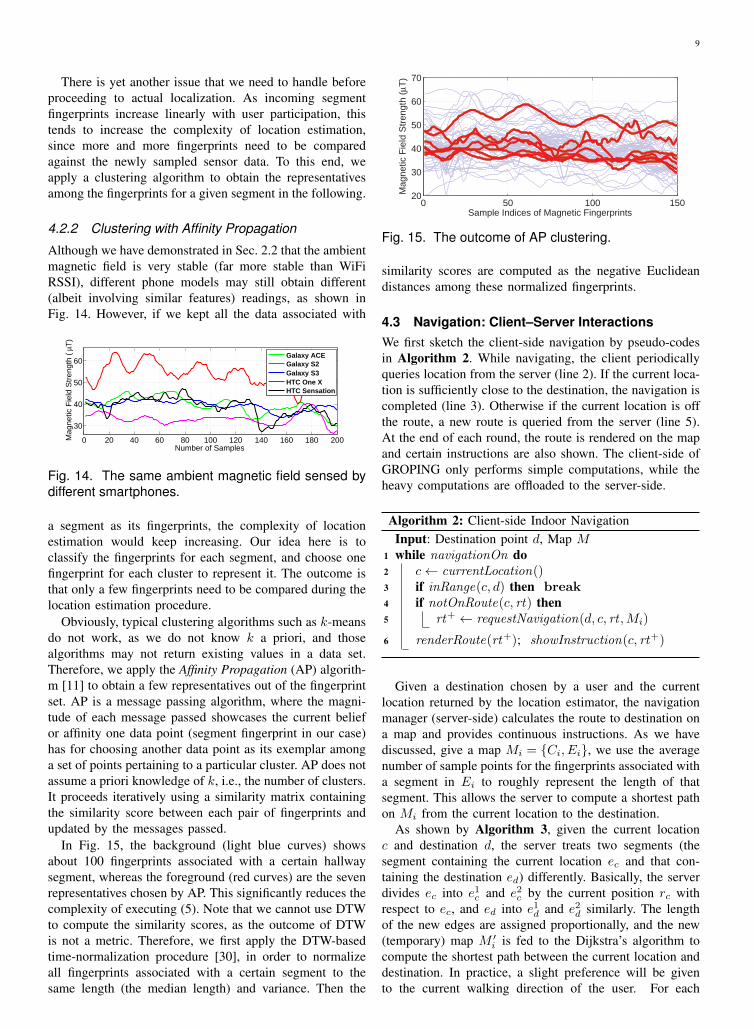
Although we have demonstrated in Sec. 2.2 that the ambientmagnetic field is very stable (far more stable than WiFiRSSI), different phone models may still obtain different(albeit involving similar features) readings, as shown inFig. 14. However, if we kept all the data associated with
0 20 40 60 80 100 120 140 160 180 200
30
40
50
60
Number of Samples
Ma
gn
etic F
ield
Str
en
gth
( µ
T)
Galaxy ACE
Galaxy S2
Galaxy S3
HTC One X
HTC Sensation
Fig. 14. The same ambient magnetic field sensed bydifferent smartphones.
a segment as its fingerprints, the complexity of locationestimation would keep increasing. Our idea here is toclassify the fingerprints for each segment, and choose onefingerprint for each cluster to represent it. The outcome isthat only a few fingerprints need to be compared during thelocation estimation procedure.
Obviously, typical clustering algorithms such as k-meansdo not work, as we do not know k a priori, and thosealgorithms may not return existing values in a data set.Therefore, we apply the Affinity Propagation (AP) algorith-m [11] to obtain a few representatives out of the fingerprintset. AP is a message passing algorithm, where the magni-tude of each message passed showcases the current beliefor affinity one data point (segment fingerprint in our case)has for choosing another data point as its exemplar amonga set of points pertaining to a particular cluster. AP does notassume a priori knowledge of k, i.e., the number of clusters.It proceeds iteratively using a similarity matrix containingthe similarity score between each pair of fingerprints andupdated by the messages passed.
In Fig. 15, the background (light blue curves) showsabout 100 fingerprints associated with a certain hallwaysegment, whereas the foreground (red curves) are the sevenrepresentatives chosen by AP. This significantly reduces thecomplexity of executing (5). Note that we cannot use DTWto compute the similarity scores, as the outcome of DTWis not a metric. Therefore, we first apply the DTW-basedtime-normalization procedure [30], in order to normalizeall fingerprints associated with a certain segment to thesame length (the median length) and variance. Then the
0 50 100 15020
30
40
50
60
70
Sample Indices of Magnetic Fingerprints
Ma
gn
etic F
ield
Str
en
gth
(µ
T)
Fig. 15. The outcome of AP clustering.
similarity scores are computed as the negative Euclideandistances among these normalized fingerprints.
4.3 Navigation: Client–Server InteractionsWe first sketch the client-side navigation by pseudo-codesin Algorithm 2. While navigating, the client periodicallyqueries location from the server (line 2). If the current loca-tion is sufficiently close to the destination, the navigation iscompleted (line 3). Otherwise if the current location is offthe route, a new route is queried from the server (line 5).At the end of each round, the route is rendered on the mapand certain instructions are also shown. The client-side ofGROPING only performs simple computations, while theheavy computations are offloaded to the server-side.
Algorithm 2: Client-side Indoor NavigationInput: Destination point d, Map M
1 while navigationOn do2 c← currentLocation()3 if inRange(c, d) then break4 if notOnRoute(c, rt) then5 rt+ ← requestNavigation(d, c, rt ,Mi)
6 renderRoute(rt+); showInstruction(c, rt+)
Given a destination chosen by a user and the currentlocation returned by the location estimator, the navigationmanager (server-side) calculates the route to destination ona map and provides continuous instructions. As we havediscussed, give a map Mi = {Ci, Ei}, we use the averagenumber of sample points for the fingerprints associated witha segment in Ei to roughly represent the length of thatsegment. This allows the server to compute a shortest pathon Mi from the current location to the destination.
As shown by Algorithm 3, given the current locationc and destination d, the server treats two segments (thesegment containing the current location ec and that con-taining the destination ed) differently. Basically, the serverdivides ec into e1c and e2c by the current position rc withrespect to ec, and ed into e1d and e2d similarly. The lengthof the new edges are assigned proportionally, and the new(temporary) map M ′i is fed to the Dijkstra’s algorithm tocompute the shortest path between the current location anddestination. In practice, a slight preference will be givento the current walking direction of the user. For each
10
Algorithm 3: Server-side Indoor Navigation
1 upon recvNavRequest(c, d, rt ,Mi)2 (ec, pc)← pointInMap(c,Mi)3 (ed, pd)← pointInMap(d,Mi)4 Mi.removeEdge({ed, ec})5 (e1c , e
2c)← ec.breakAt(pc); (e1d, e
2d)← ed.breakAt(pd)
6 Mi.addEdge({e1c , e2c , e1d, e2d})7 rt+ ← Dijkstra(pc, pd,Mi)8 if rt+ ⊆ rt then deliverToClient(NULL)9 else deliverToClient(rt+)
navigation request coming from a client, a shortest pathto destination is calculated by navigation manager usingAlgorithm 3 and is then delivered to client. Instead ofsending only one navigation request at the beginning, theclient actually generates such a request on a regular basis.However, the server does not send a new route back as longas the user’s location is still on the previously determinedroute; a route update is sent back only if the server findsout that the user is off the previously determined route.
5 SYSTEM EVALUATION DESIGN
We briefly explain how we perform user studies and per-formance evaluations on GROPING in this section, andalso discuss some issues we have encountered for the userstudies, as well as our current and future solutions.
5.1 Experiment Setting
We recruited 20 users to participate in our user study andevaluations. As our emphasis is rather on the functionalitiesof GROPING than on the usability of its interface, weonly involve participants with CS background, but theyare all first-time users of GROPING. Eight of them wereselected to play the role of map explorers due to theirfamiliarity with the test site, and the rest were strayed users.Their specific tasks include familiarizing with GROPINGinterface, collecting sensor data, labeling landmarks, andproviding feedback. While walking, a user is required tohold the phone horizontally and point it ahead.
We have evaluated GROPING by three studies mainly inone test site (a shopping mall with 3 floors). In the first one,we measure the time needed to complete a map in eachfloor. In the second one, we focus on quantitative evalu-ations on the accuracy of the localization service. Finally,we qualitatively study the navigation service, and report theuser experiences on it. We also implemented FreeLoc [35],a recently proposed WiFi-based indoor localization system,and we compare the localization accuracy of GROPINGwith both FreeLoc and GMI. Further comparisons with twocanonical proposals RADAR [5] and Horus [37] are con-ducted in the smaller test site shown in Fig. 4(a), as theseproposals entail intensive WiFi fingerprinting. Due to thepage limit, we have postponed some detailed evaluations tothe Appendix.
As user acceptance is important to a navigation system[4], we try to understand user preferences before and ex-periences after using our navigation system, by employinguser feedback. To understand user expectations, we firstconduct a questionnaire-based on-line study about the usersexperiences of getting directions inside large buildingswithout a navigation service and on what they expect from anavigation system (in which we involve extra participantsthrough Amazon Mechanical Turk (AMT) [1]). The userexperience is the outcome of the aforementioned thirdstudy: each of our 20 (local) participants delivers a feedbackon GROPING after using it.
5.2 Incentives for CrowdsensingGetting a sufficient number and diversity of participantsfor our user studies has been a challenge, because oneof the main tasks that we assign to our users is mobilecrowdsensing (for map generation) using their individualsmartphones. Crowdsensing data collection differs signifi-cantly from traditional crowdsourcing since it demands in-dividuals’ utilizing of time, energy (e.g., physical activities)and resource (e.g., smartphone usages), so the incentive to“entice” participants into providing high quality data mayneed to be very substantial. In other words, some formof remuneration is necessary to encourage active participa-tion in crowdsensing. Incentive mechanisms are often taskdependent and can range from monetary incentives (cash,lottery tickets, gift cards, etc.) to valuable services (e.g.,free WiFi access or storage spaces) [26], [22].
6 EXPERIMENT RESULTS
Beside the comparisons made in Sec. 2, we further evaluateGROPING in this section.
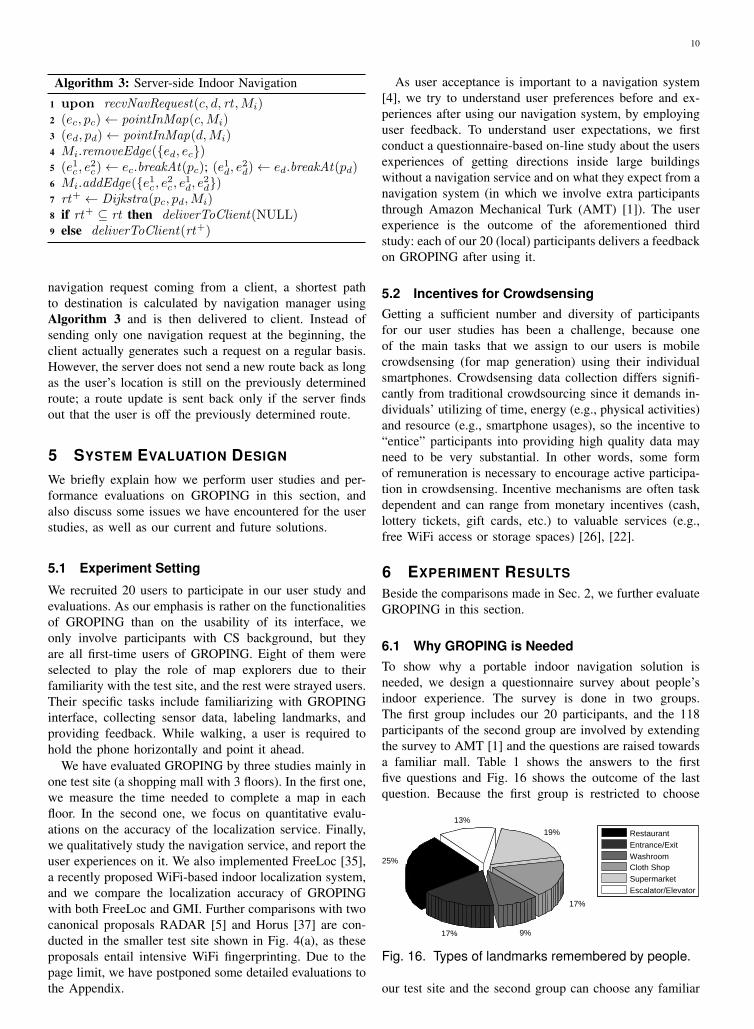
6.1 Why GROPING is NeededTo show why a portable indoor navigation solution isneeded, we design a questionnaire survey about people’sindoor experience. The survey is done in two groups.The first group includes our 20 participants, and the 118participants of the second group are involved by extendingthe survey to AMT [1] and the questions are raised towardsa familiar mall. Table 1 shows the answers to the firstfive questions and Fig. 16 shows the outcome of the lastquestion. Because the first group is restricted to choose
17%
19%
9%
13%
17%
25%
Restaurant
Entrance/Exit
Washroom
Cloth Shop
Supermarket
Escalator/Elevator
Fig. 16. Types of landmarks remembered by people.
our test site and the second group can choose any familiar
11
S/N Question Our Test Site General1 How many times have you been to the mall within last year 10.61± 8.74 18.07± 11.042 How familiar are you with the indoor space (1-10) 5.11± 2.80 7.11± 2.173 How easy it is to navigate to a particular store based on you-are-here maps (1-10) 5± 1.43 7.03± 2.214 How helpful it will be to have a smartphone-based indoor navigation system (1-4) 3.5± 0.67 2.7± 0.775 How many landmarks do you usually recall every time you enter the mall 5± 2.66 4.27± 1.55
TABLE 1User perceptions on indoor navigation solutions (average ± standard deviation).
shopping mall, participants of the second group show moreconfidence in navigating by you-are-here maps than thoseof the first group. Also, as our test site has a morecomplicated route structure (see Fig. 17), it is reasonablethat the first group expresses more eagerness to have aportable navigation system. In fact, both groups can recallon average less than five locations, so a handy navigationsystem may always help to avoid finding/checking you-are-here maps. The outcome shown in Fig. 16 has independentinterests. Although each participant only remembers aboutfive landmarks, those landmarks are well spread acrossdifferent types. In other words, by asking map explorers tosporadically label landmarks, there is a fairly good chancethat the labels would cover diverse landmarks in a mall.
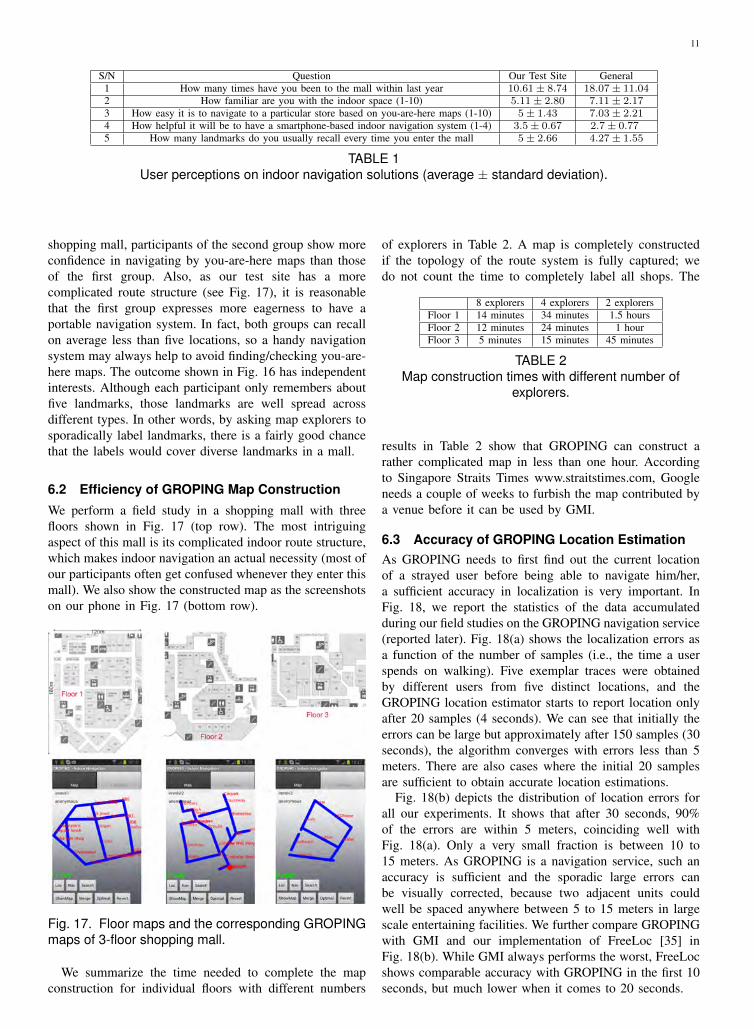
6.2 Efficiency of GROPING Map ConstructionWe perform a field study in a shopping mall with threefloors shown in Fig. 17 (top row). The most intriguingaspect of this mall is its complicated indoor route structure,which makes indoor navigation an actual necessity (most ofour participants often get confused whenever they enter thismall). We also show the constructed map as the screenshotson our phone in Fig. 17 (bottom row).
Fig. 17. Floor maps and the corresponding GROPINGmaps of 3-floor shopping mall.
We summarize the time needed to complete the mapconstruction for individual floors with different numbers
of explorers in Table 2. A map is completely constructedif the topology of the route system is fully captured; wedo not count the time to completely label all shops. The
8 explorers 4 explorers 2 explorersFloor 1 14 minutes 34 minutes 1.5 hoursFloor 2 12 minutes 24 minutes 1 hourFloor 3 5 minutes 15 minutes 45 minutes
TABLE 2Map construction times with different number of
explorers.
results in Table 2 show that GROPING can construct arather complicated map in less than one hour. Accordingto Singapore Straits Times www.straitstimes.com, Googleneeds a couple of weeks to furbish the map contributed bya venue before it can be used by GMI.
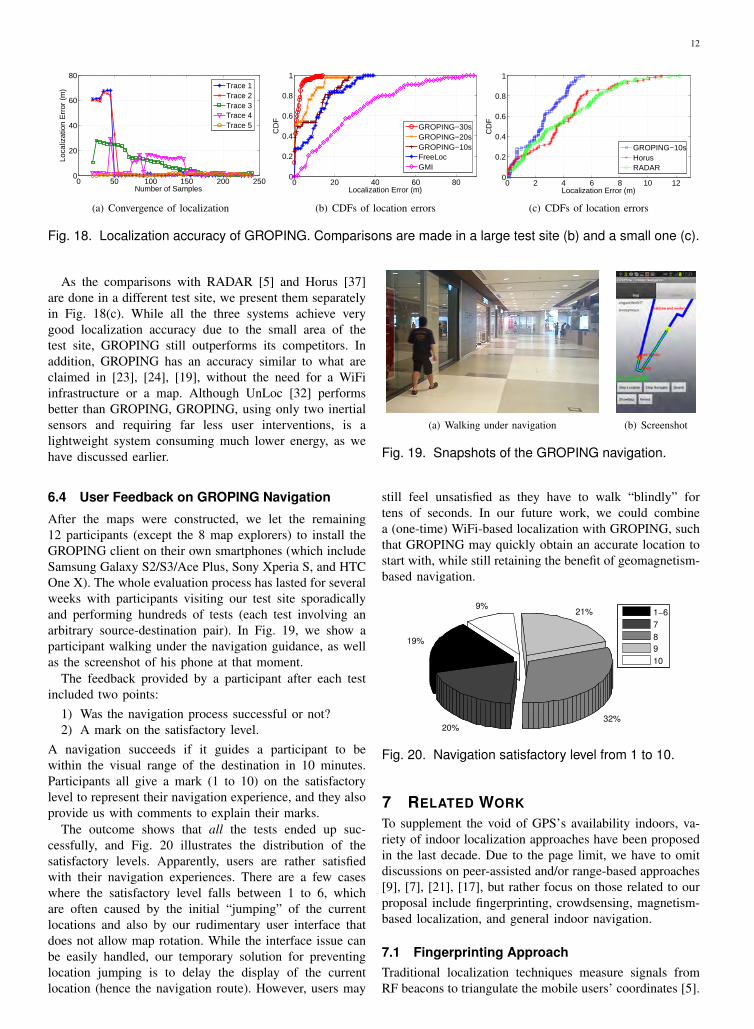
6.3 Accuracy of GROPING Location EstimationAs GROPING needs to first find out the current locationof a strayed user before being able to navigate him/her,a sufficient accuracy in localization is very important. InFig. 18, we report the statistics of the data accumulatedduring our field studies on the GROPING navigation service(reported later). Fig. 18(a) shows the localization errors asa function of the number of samples (i.e., the time a userspends on walking). Five exemplar traces were obtainedby different users from five distinct locations, and theGROPING location estimator starts to report location onlyafter 20 samples (4 seconds). We can see that initially theerrors can be large but approximately after 150 samples (30seconds), the algorithm converges with errors less than 5meters. There are also cases where the initial 20 samplesare sufficient to obtain accurate location estimations.
Fig. 18(b) depicts the distribution of location errors forall our experiments. It shows that after 30 seconds, 90%of the errors are within 5 meters, coinciding well withFig. 18(a). Only a very small fraction is between 10 to15 meters. As GROPING is a navigation service, such anaccuracy is sufficient and the sporadic large errors canbe visually corrected, because two adjacent units couldwell be spaced anywhere between 5 to 15 meters in largescale entertaining facilities. We further compare GROPINGwith GMI and our implementation of FreeLoc [35] inFig. 18(b). While GMI always performs the worst, FreeLocshows comparable accuracy with GROPING in the first 10seconds, but much lower when it comes to 20 seconds.
12
0 50 100 150 200 2500
20
40
60
80
Number of Samples
Loca
lizat
ion
Err
or (
m) Trace 1
Trace 2Trace 3Trace 4Trace 5
(a) Convergence of localization
0 20 40 60 800
0.2
0.4
0.6
0.8
1
Localization Error (m)
CD
F
GROPING−30sGROPING−20sGROPING−10sFreeLocGMI
(b) CDFs of location errors
0 2 4 6 8 10 120
0.2
0.4
0.6
0.8
1
Localization Error (m)
CD
F
Empirical CDF
GROPING−10sHorusRADAR
(c) CDFs of location errors
Fig. 18. Localization accuracy of GROPING. Comparisons are made in a large test site (b) and a small one (c).
As the comparisons with RADAR [5] and Horus [37]are done in a different test site, we present them separatelyin Fig. 18(c). While all the three systems achieve verygood localization accuracy due to the small area of thetest site, GROPING still outperforms its competitors. Inaddition, GROPING has an accuracy similar to what areclaimed in [23], [24], [19], without the need for a WiFiinfrastructure or a map. Although UnLoc [32] performsbetter than GROPING, GROPING, using only two inertialsensors and requiring far less user interventions, is alightweight system consuming much lower energy, as wehave discussed earlier.
6.4 User Feedback on GROPING Navigation
After the maps were constructed, we let the remaining12 participants (except the 8 map explorers) to install theGROPING client on their own smartphones (which includeSamsung Galaxy S2/S3/Ace Plus, Sony Xperia S, and HTCOne X). The whole evaluation process has lasted for severalweeks with participants visiting our test site sporadicallyand performing hundreds of tests (each test involving anarbitrary source-destination pair). In Fig. 19, we show aparticipant walking under the navigation guidance, as wellas the screenshot of his phone at that moment.
The feedback provided by a participant after each testincluded two points:
1) Was the navigation process successful or not?2) A mark on the satisfactory level.
A navigation succeeds if it guides a participant to bewithin the visual range of the destination in 10 minutes.Participants all give a mark (1 to 10) on the satisfactorylevel to represent their navigation experience, and they alsoprovide us with comments to explain their marks.
The outcome shows that all the tests ended up suc-cessfully, and Fig. 20 illustrates the distribution of thesatisfactory levels. Apparently, users are rather satisfiedwith their navigation experiences. There are a few caseswhere the satisfactory level falls between 1 to 6, whichare often caused by the initial “jumping” of the currentlocations and also by our rudimentary user interface thatdoes not allow map rotation. While the interface issue canbe easily handled, our temporary solution for preventinglocation jumping is to delay the display of the currentlocation (hence the navigation route). However, users may
(a) Walking under navigation (b) Screenshot
Fig. 19. Snapshots of the GROPING navigation.
still feel unsatisfied as they have to walk “blindly” fortens of seconds. In our future work, we could combinea (one-time) WiFi-based localization with GROPING, suchthat GROPING may quickly obtain an accurate location tostart with, while still retaining the benefit of geomagnetism-based navigation.
32%
21%9%
20%
19%
1−6
7
8
9
10
Fig. 20. Navigation satisfactory level from 1 to 10.
7 RELATED WORKTo supplement the void of GPS’s availability indoors, va-riety of indoor localization approaches have been proposedin the last decade. Due to the page limit, we have to omitdiscussions on peer-assisted and/or range-based approaches[9], [7], [21], [17], but rather focus on those related to ourproposal include fingerprinting, crowdsensing, magnetism-based localization, and general indoor navigation.
7.1 Fingerprinting ApproachTraditional localization techniques measure signals fromRF beacons to triangulate the mobile users’ coordinates [5].
13
These techniques are crippled by their high cost of special-ized mobile devices/infrastructures and the unstable local-ization accuracy due to construction interference. What re-places them is the fingerprinting approach, and the locationdiscriminating fingerprints can be WiFi access points (AP)Received Signal Strength (RSS) [23], [24], [35], general RFsignal [6], and light intensity [25]. These fingerprints canbe captured by sensors embedded in smartphones, whichsaves the trouble of building and carrying expensive butcumbersome devices.
7.2 Crowdsensing Fingerprints CollectionAll fingerprinting systems work in two phases: spot surveyand localization. Spot survey collects fingerprints fromknown locations, then they are used to create a fingerprintdatabase. Localization estimates user locations by compar-ing fingerprints sensed online to the database. However, thelabor-intensive spot survey and the constant maintenance ofthe database have largely hampered a wide deployment ofthese systems.
To this end, crowdsensing (a.k.a. organic fingerprint-ing) is adopted by recent proposals. Redpin [6] takes afolksonomy-like approach that allows users to identify loca-tion themselves when they are wrongly located and then tocorrectly associate fingerprints to these locations. OIL [23]applies a similar approach to Redpin, but it further handlesspatial uncertainty and labeling errors made by users.Zee [24] uses particle filter and dead reckoning to identifyuser’s walking trace and enriches the fingerprint databasewith the WiFi data collected along the trace. ARIEL [15]differentiates rooms through clustering on WiFi fingerprintscollected by randomly moving users to achieve a roomlevel localization accuracy. Unloc [32] uses distinct patternsfrom accelerometer, WiFi RSSI, and magnetic fluctuationsdetected by smartphones as organic landmarks to helplocating users. Loci [18] improves semantic location servicethrough user feedback, in which user inputs are used tocorrect place detections by the service. Walk&Sketch [38]attempts to create floor maps using high resolution camerasmounted on users’ backpacks.
7.3 Magnetism-based Indoor LocalizationIt is well known that geomagnetism can be “twisted” bybuilding structures and can hence be used to depict indoorlocations; a few proposals have exploited this property.Chung et al. [8] attach a compass to a rotating motor todevelop an indoor location system based on geomagnetism.This approach demands a huge amount of time to finger-print a single hallway, making its scalability questionable.Again based on geomagnetism, proposals in [13] and [29]apply particle and Kalman Filters, respectively, to robotnavigation. All these proposals require dedicated devices.
7.4 Indoor Navigation SystemsExisting indoor navigation systems often assume the ex-istence of certain localization support. Building upon a
positioning middleware, Schougaard et al. [28] propose ahybrid navigation system that models indoor locations inboth symbolic and geometric manners. An earlier work [20]focuses on multimedia user interface design that navigatespeople with cognitive impairments. As we discussed earlier,an integrated design involving both localization and navi-gation is necessary, exactly due to the need for real-timelocalization by an indoor navigation service.
8 CONCLUSIONS
Whereas a plethora of proposals on WiFi-based indoorlocalization systems have been proposed, we believe that anindoor navigation service may require features that are notprovided by these existing localization systems. Motivatedby the incompetent navigation service of Google MapsIndoor (GMI), we aim to eliminate the heavy reliance ona WiFi infrastructure and also on contributory floor mapscan be beneficial to indoor navigation.
To this end, we proposed GROPING, an all-in-onesystem that includes map generation, localization, andnavigation. GROPING relies on the geomagnetic field tocharacterize indoor locations. This allows GROPING toi) utilize crowdsensing for magnetic fingerprinting and forconstructing a floor map from an arbitrary set of walkingtrajectories, and ii) to perform lightweight localization andhence navigation based on magnetic fingerprints and theconstructed maps. Evaluations and user studies in a largeshopping mall with 20 participants have demonstrated thehigh usability of GROPING’s navigation service.
Whereas WiFi-based indoor localization systems showdisadvantage in energy efficiency and fingerprint stability,the higher dimensionality of WiFi fingerprints, if properlyused, may still offer better location discriminability thanmagnetic fingerprints. Therefore, we are considering thepossibility of a hybrid system combining both technologiesin our future work. Moreover, we also plan to makeGROPING more autonomous by minimizing the requireduser interventions.
REFERENCES
[1] Amazon Mechanical Turk. https://www.mturk.com/mturk/welcome.[2] Ekahau Positioning Engine. http://www.ekahau.com/.[3] Google Maps Indoor. http://maps.google.com/help/maps/
indoormaps/.[4] K. Arning, M. Ziefle, M. Li, and L. Kobbelt. Insights Into User
Experiences and Acceptance Of Mobile Indoor Navigation Devices.In Proc. of ACM MUM, pages 1–10, 2012.
[5] P. Bahl and V. N. Padmanabhan. RADAR: An In-Building RF-basedUser Location and Tracking System. In Proc. of IEEE INFOCOM,pages 775–784, 2000.
[6] P. Bolliger. Redpin - Adaptive, Zero-configuration Indoor Localiza-tion through User Collaboration. In Proc. of ACM MELT, pages55–60, 2008.
[7] K. Chintalapudi, A. Iyer, and V. Padmanabhan. Indoor LocalizationWithout the Pain. In Proc. of ACM MobiCom, pages 173–184, 2010.
[8] J. Chung, M. Donahoe, C. Schmandt, I.-J. Kim, P. Razavai, andM. Wiseman. Indoor Location Sensing using Geo-magnetism. InProc. of ACM MobiSys, pages 141–154, 2011.
[9] I. Constandache, X. Bao, M. Azizyan, and R. R. Choudhury. Didyou see Bob?: Human Localization Using Mobile Phones. In Proc.of ACM MobiCom, pages 149–160, 2010.
14
[10] A. Doucet, N. de Freitas, and N. Gordon. Sequential Monte CarloMethods in Practice. Springer, New York, 2001.
[11] B. J. Frey and D. Dueck. Clustering by Passing Messages betweenData Points. Science, 315:972–976, 2007.
[12] R. Ganti, F. Ye, and H. Lei. Mobile Crowdsensing: Current State andFuture Challenges. IEEE Communications Magazine, 49(11):32–39,2011.
[13] J. Haverinen and A. Kemppainen. Global Indoor Self-Localizationbased on the Ambient Magnetic Field. Robotics and AutonomousSystems, 57:1028–1035, 2009.
[14] J. Hightower and G. Borriello. Particle Filters for Location Esti-mation in Ubiquitous Computing: A Case Study. In Proc. of ACMUbiComp, pages 88–106, 2004.
[15] Y. Jiang, X. Pan, K. Li, Q. Lv, R. P. Dick, M. Hannigan, andL. Shang. ARIEL: Automatic Wi-Fi based Room Fingerprinting forIndoor Localization. In Proc. of ACM UbiComp, pages 441–450,2012.
[16] E. Jonsson. Inner Navigation: Why We Get Lost and How We FindOur Way. Scribner, 2002.
[17] X. L. K. Liu and X. Li. Guoguo: Enabling Fine-grained IndoorLocalization via Smartphone. In Proc. of ACM MobiSys, pages 235–248, 2013.
[18] D. H. Kim, K. Han, and D. Estrin. Employing User Feedback forSemantic Location Services. In Proc. of ACM UbiComp, pages 217–226, 2011.
[19] F. Li, C. Zhao, G. Ding, J. Gong, C. Liu, and F. Zhao. A Reliable andAaccurate Indoor Localization Method using Phone Inertial Sensors.In Proc. of ACM UbiComp, pages 421–430, 2012.
[20] A. L. Liu, H. Hile, H. Kautz, G. Borriello, P. A. Brown, M. Harniss,and K. Johnson. Indoor Wayfinding: Developing a FunctionalInterface for Individuals with Cognitive Impairments. In Proc. ofACM Assets, pages 95–102, 2006.
[21] H. Liu, Y. Gan, J. Yang, S. Sidhom, Y. Wang, Y. Chen, and F. Ye.Push the Limit of WiFi based Localization for Smartphones. In Proc.of ACM MobiCom, pages 305–316, 2012.
[22] M. Musthag, A. Raij, D. Ganesan, S. Kumar, and S. Shiffman.Exploring Micro-incentive Strategies for Participant Compensationin High-Burden Studies. In Proc. of ACM UbiComp, pages 435–444,2011.
[23] J.-g. Park, B. Charrow, D. Curtis, J. Battat, E. Minkov, J. Hicks,S. Teller, and J. Ledlie. Growing an Organic Indoor Location System.In Proc. of ACM MobiSys, pages 271–284, 2010.
[24] A. Rai, K. K. Chintalapudi, V. N. Padmanabhan, and R. Sen. Zee:Zero-effort Crowdsourcing for Indoor Localization. In Proc. of ACMMobiCom, pages 293–304, 2012.
[25] N. Ravi and L. Iftode. FiatLux: Fingerprinting Rooms using LightIntensity. In Proc. of Pervasive, 2007.
[26] S. Reddy, D. Estrin, M. Hansen, and M. Srivastava. ExaminingMicro-Payments for Participatory Sensing Data Collections. In Proc.of ACM UbiComp, pages 33–36, 2010.
[27] H. Sakoe and S. Chiba. Dynamic Programming Algorithm Optimiza-tion for Spoken Word Recognition. Acoustics, Speech and SignalProcessing, IEEE Trans. on, 26(1):43 – 49, 1978.
[28] K. R. Schougaard, K. Grnbk, and T. Scharling. Indoor PedestrianNavigation Based on Hybrid Route Planning and Location Modeling.In Proc. of Pervasive (LNCS 7319), pages 289–306. Springer, 2012.
[29] W. Storms, J. Shockley, and J. Raquet. Magnetic Field Navigationin an Indoor Environment. In Ubi Pos. Indoor Nav. and Loc. BasedService (UPINLBS), pages 1–10, 2010.
[30] R. Tanawongsuwan and A. Bobick. Gait Recognition from Time-Normalized Joint-Angle Trajectories in the Walking Plane. In Proc.of IEEE CVPR, pages 726–731, 2001.
[31] S. Thrun, D. Fox, W. Burgard, and F. Dellaert. Robust Monte CarloLocalization for Mobile Robots. Artificial Intelligence, 128:99–141,2001.
[32] H. Wang, S. Sen, A. Elgohary, M. Farid, M. Youssef, and R. R.Choudhury. No Need to War-Drive: Unsupervised Indoor Localiza-tion. In Proc. of ACM MobiSys, pages 197–210, 2012.
[33] O. Woodman and R. Harle. Pedestrian Localisation for IndoorEnvironments. In Proc. of ACM UbiComp, pages 114–123, 2008.
[34] J. Xiong and K. Jamieson. Towards Fine-Grained Radio-basedIndoor Location. In Proc. of ACM HotMobile, pages 13:1–13:6,2012.
[35] S. Yang, P. Dessai, M. Verma, and M. Gerla. FreeLoc: Calibration-Free Crowdsourced Indoor Localization. In Proc. of IEEE InfoCom,pages 2581–2589, 2013.
[36] Z. Yang, C. Wu, and Y. Liu. Locating in Fingerprint Space: WirelessIndoor Localization with Little Human Intervention. In Proc. of ACMMobiCom, pages 269–280, 2012.
[37] M. Youssef and A. Agrawala. The Horus WLAN Location Deter-mination System. In Proc. of ACM MobiSys, pages 205–218, 2005.
[38] Y. Zhang, C. Luo, and J. Liu. Walk&Sketch: Create Floor Planswith an RGB-D Camera. In Proc. of ACM UbiComp, pages 461–470, 2012.
Chi Zhang received his BS degree fromZhejiang University, China, in 2011. He iscurrently a PhD candidate at the School ofComputer Engineering, Nanyang Technolog-ical University, Singapore. His research inter-ests are indoor localization/navigation, socialnetworks, and wireless sensor networks.
Kalyan P. Subbu is currently an assis-tant professor at Amrita university, Kerala,India. He was a postdoctoral researcherat Nanyang Technological University, Singa-pore from 2012-2013. He obtained a PhDin Computer Science from the Universityof North Texas, USA. His research areasare mobile and pervasive computing, appliedmachine learning.
Jun Luo received his BS and MS degrees inElectrical Engineering from Tsinghua Univer-sity, China, and the PhD degree in Comput-er Science from EPFL (Swiss Federal Insti-tute of Technology in Lausanne), Lausanne,Switzerland. From 2006 to 2008, he hasworked as a post-doctoral research fellow inthe Department of Electrical and ComputerEngineering, University of Waterloo, Water-loo, Canada. In 2008, he joined the facul-ty of the School of Computer Engineering,
Nanyang Technological University in Singapore, where he is cur-rently an assistant professor. His research interests include wirelessnetworking, mobile and pervasive computing, applied operationsresearch, as well as network security. More information can be foundat http://www3.ntu.edu.sg/home/junluo.
Jianxin Wu received his BS and MS degreesin computer science from Nanjing University,and his PhD degree in computer sciencefrom the Georgia Institute of Technology. Heis currently a professor in the Department ofComputer Science and Technology at Nan-jing University, China, and is associated withthe National Key Laboratory for Novel Soft-ware Technology, China. He was an assistantprofessor in the Nanyang Technological Uni-versity, Singapore. His research interests are
computer vision and machine learning. He is a member of the IEEE.
15
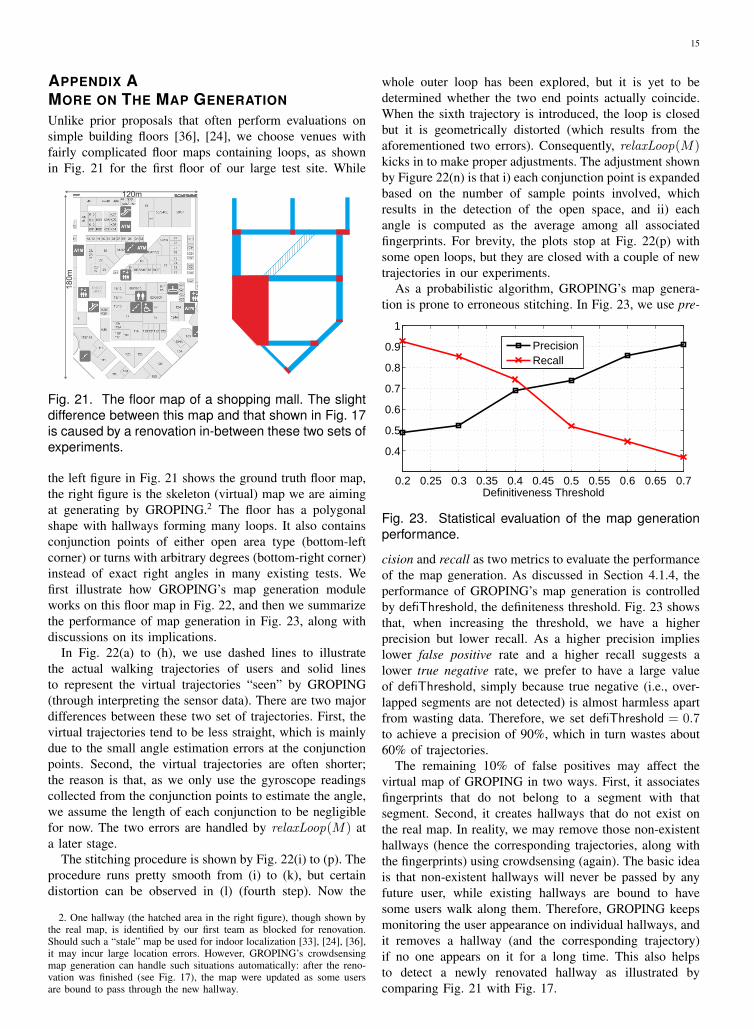
APPENDIX AMORE ON THE MAP GENERATIONUnlike prior proposals that often perform evaluations onsimple building floors [36], [24], we choose venues withfairly complicated floor maps containing loops, as shownin Fig. 21 for the first floor of our large test site. While
180m
120m
Fig. 21. The floor map of a shopping mall. The slightdifference between this map and that shown in Fig. 17is caused by a renovation in-between these two sets ofexperiments.
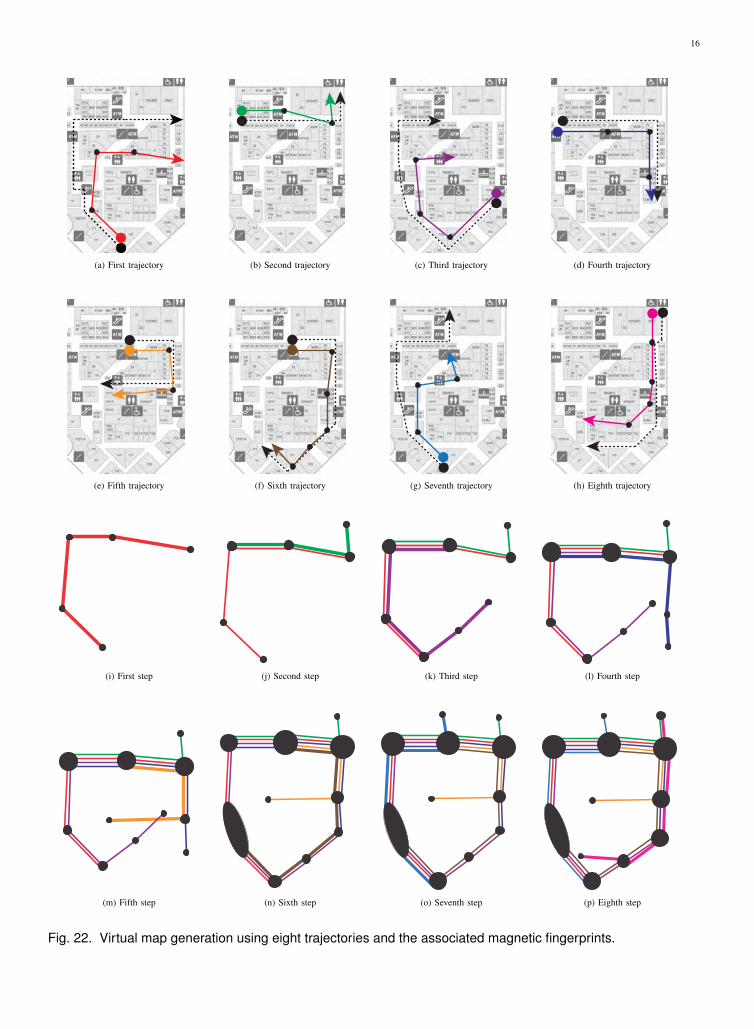
the left figure in Fig. 21 shows the ground truth floor map,the right figure is the skeleton (virtual) map we are aimingat generating by GROPING.2 The floor has a polygonalshape with hallways forming many loops. It also containsconjunction points of either open area type (bottom-leftcorner) or turns with arbitrary degrees (bottom-right corner)instead of exact right angles in many existing tests. Wefirst illustrate how GROPING’s map generation moduleworks on this floor map in Fig. 22, and then we summarizethe performance of map generation in Fig. 23, along withdiscussions on its implications.
In Fig. 22(a) to (h), we use dashed lines to illustratethe actual walking trajectories of users and solid linesto represent the virtual trajectories “seen” by GROPING(through interpreting the sensor data). There are two majordifferences between these two set of trajectories. First, thevirtual trajectories tend to be less straight, which is mainlydue to the small angle estimation errors at the conjunctionpoints. Second, the virtual trajectories are often shorter;the reason is that, as we only use the gyroscope readingscollected from the conjunction points to estimate the angle,we assume the length of each conjunction to be negligiblefor now. The two errors are handled by relaxLoop(M) ata later stage.
The stitching procedure is shown by Fig. 22(i) to (p). Theprocedure runs pretty smooth from (i) to (k), but certaindistortion can be observed in (l) (fourth step). Now the
2. One hallway (the hatched area in the right figure), though shown bythe real map, is identified by our first team as blocked for renovation.Should such a “stale” map be used for indoor localization [33], [24], [36],it may incur large location errors. However, GROPING’s crowdsensingmap generation can handle such situations automatically: after the reno-vation was finished (see Fig. 17), the map were updated as some usersare bound to pass through the new hallway.
whole outer loop has been explored, but it is yet to bedetermined whether the two end points actually coincide.When the sixth trajectory is introduced, the loop is closedbut it is geometrically distorted (which results from theaforementioned two errors). Consequently, relaxLoop(M)kicks in to make proper adjustments. The adjustment shownby Figure 22(n) is that i) each conjunction point is expandedbased on the number of sample points involved, whichresults in the detection of the open space, and ii) eachangle is computed as the average among all associatedfingerprints. For brevity, the plots stop at Fig. 22(p) withsome open loops, but they are closed with a couple of newtrajectories in our experiments.
As a probabilistic algorithm, GROPING’s map genera-tion is prone to erroneous stitching. In Fig. 23, we use pre-
0.2 0.25 0.3 0.35 0.4 0.45 0.5 0.55 0.6 0.65 0.7
0.4
0.5
0.6
0.7
0.8
0.9
1
Definitiveness Threshold
Precision
Recall
Fig. 23. Statistical evaluation of the map generationperformance.
cision and recall as two metrics to evaluate the performanceof the map generation. As discussed in Section 4.1.4, theperformance of GROPING’s map generation is controlledby defiThreshold, the definiteness threshold. Fig. 23 showsthat, when increasing the threshold, we have a higherprecision but lower recall. As a higher precision implieslower false positive rate and a higher recall suggests alower true negative rate, we prefer to have a large valueof defiThreshold, simply because true negative (i.e., over-lapped segments are not detected) is almost harmless apartfrom wasting data. Therefore, we set defiThreshold = 0.7to achieve a precision of 90%, which in turn wastes about60% of trajectories.
The remaining 10% of false positives may affect thevirtual map of GROPING in two ways. First, it associatesfingerprints that do not belong to a segment with thatsegment. Second, it creates hallways that do not exist onthe real map. In reality, we may remove those non-existenthallways (hence the corresponding trajectories, along withthe fingerprints) using crowdsensing (again). The basic ideais that non-existent hallways will never be passed by anyfuture user, while existing hallways are bound to havesome users walk along them. Therefore, GROPING keepsmonitoring the user appearance on individual hallways, andit removes a hallway (and the corresponding trajectory)if no one appears on it for a long time. This also helpsto detect a newly renovated hallway as illustrated bycomparing Fig. 21 with Fig. 17.
16
(a) First trajectory (b) Second trajectory (c) Third trajectory (d) Fourth trajectory
(e) Fifth trajectory (f) Sixth trajectory (g) Seventh trajectory (h) Eighth trajectory
(i) First step (j) Second step (k) Third step (l) Fourth step
(m) Fifth step (n) Sixth step (o) Seventh step (p) Eighth step
Fig. 22. Virtual map generation using eight trajectories and the associated magnetic fingerprints.
17
−500
50−50
0
50
−60
−40
−20
0
20
40
60
Y
X
West
South
East
North
Z
−44 −43.5 −43 −42.5 −42−4
−3.5
−3
18
18.5
19
19.5
20
Y
West
South
East
North
X
Z
−42 −41.5 −41 −40.5 −40 −4
−3.5
−3
42.5
43
43.5
44
44.5
Y
West
South
East
North
X
Z
(a) Ambient magnetic field readings. (b) Readings at location 1 (c) Readings at location 2
5151.5
52 −43
−42
−41
−40
−38
−37.8
−37.6
−37.4
−37.2
−37
Y
West
South
East
North
Z
X2 2.5 3 3.5 4 12
12.5
13
−17
−16.8
−16.6
−16.4
−16.2
−16
Y
West
South
East
NorthZ
X−18 −17.5 −17 −16.5 −16 −7
−6.5
−6
28
28.5
29
29.5
30
Y
West
South
East
North
X
Z
(d) Readings at location 3 (e) Readings at location 4 (f) Readings at location 5
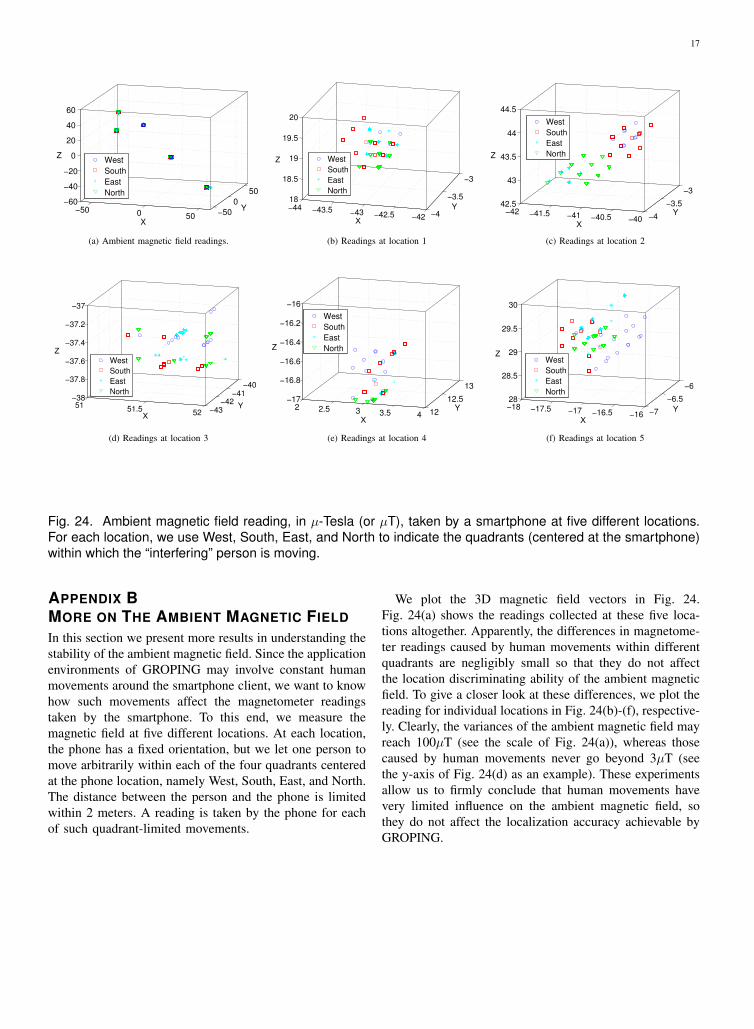
Fig. 24. Ambient magnetic field reading, in µ-Tesla (or µT), taken by a smartphone at five different locations.For each location, we use West, South, East, and North to indicate the quadrants (centered at the smartphone)within which the “interfering” person is moving.
APPENDIX BMORE ON THE AMBIENT MAGNETIC FIELD
In this section we present more results in understanding thestability of the ambient magnetic field. Since the applicationenvironments of GROPING may involve constant humanmovements around the smartphone client, we want to knowhow such movements affect the magnetometer readingstaken by the smartphone. To this end, we measure themagnetic field at five different locations. At each location,the phone has a fixed orientation, but we let one person tomove arbitrarily within each of the four quadrants centeredat the phone location, namely West, South, East, and North.The distance between the person and the phone is limitedwithin 2 meters. A reading is taken by the phone for eachof such quadrant-limited movements.
We plot the 3D magnetic field vectors in Fig. 24.Fig. 24(a) shows the readings collected at these five loca-tions altogether. Apparently, the differences in magnetome-ter readings caused by human movements within differentquadrants are negligibly small so that they do not affectthe location discriminating ability of the ambient magneticfield. To give a closer look at these differences, we plot thereading for individual locations in Fig. 24(b)-(f), respective-ly. Clearly, the variances of the ambient magnetic field mayreach 100µT (see the scale of Fig. 24(a)), whereas thosecaused by human movements never go beyond 3µT (seethe y-axis of Fig. 24(d) as an example). These experimentsallow us to firmly conclude that human movements havevery limited influence on the ambient magnetic field, sothey do not affect the localization accuracy achievable byGROPING.