grilles and diffusers engineering guidelines · engineering guidelines b grilles and diffusers...
TRANSCRIPT
B7
Redefine your comfort zone™
| ww
w.titus-hvac.com
engineering guidelines
B
GRILLES AN
D D
IFFUSERS
BASIC PRINCIPLES OF AIR DISTRIBUTION
THE GOAL OF AN AIR DIFFUSION SYSTEM: MAINTAINING COMFORTAn understanding of the principles of room air distribution helps in the selection, design, control and operation of air systems. The real evaluation of air distribution in a space, however, must answer the question: Are the occupants comfortable?
In general, a person is thermally comfortable when body heat loss equals heat production without being conscious of any changes in the body’s temperature regulating mechanisms. The human body heat loss to the environment can occur through the following:
• Radiation • Convection• Conduction • Evaporation
The comfort of an occupant is determined by both occupant variables and the conditions of the space. Occupant factors include activity level and metabolic rate (reported in Met units), as well as occupant clothing levels (reported in Clo units). The factors that influence space comfort conditions include:
• Dry bulb and radiant temperatures• Relative humidity• Air velocity
The design of the air distribution system should address the above factors so that the occupant’s heat loss is maintained at a comfortable rate.
COMFORT LIMITS SET BY ASHRAE HANDBOOK, ASHRAE STANDARD 55 AND ISO STANDARD 7730For many years, it has been shown that individual comfort is maintained through the change in seasons when the following conditions are maintained in the occupied zone of a space:
1. Air temperature maintained between 73 - 77°F2. Relative humidity maintained less than 60%3. Maximum air motion in the occupied zone (6” to 6’ vertical, within
1’ of walls): 50 fpm cooling 30 fpm heating
4. Ankle to head level, 5.4°F standing & 3.6°F seated maximum temperature gradient
Note: Comfort standards state that no minimum air movement is necessary to maintain thermal comfort, provided the temperature is acceptable. To maximize energy conservation, maintain proper temperatures at the lowest possible air speed.
The previous conditions assume occupants are sedentary or slightly active individuals and appropriately dressed. Variations in clothing can have a strong effect on desired temperature levels, often creating circumstances where a single setpoint will not satisfy all individuals in a space.
In meeting the above criteria for comfort, the temperature of the space and the relative humidity is largely controlled by the mechanical equipment including chillers or package units, air handlers, room thermostat, and
air terminal unit. The air motion in the occupied zone is a function of the discharge velocity, discharge temperature (and room load) and the pattern of the air diffusion device into the space. At today’s relatively low (< 1 cfm / sq.ft.) air delivery rates, and with properly selected diffusers, room load (and resultant Dt) is often the strongest variable in setting room air motion.
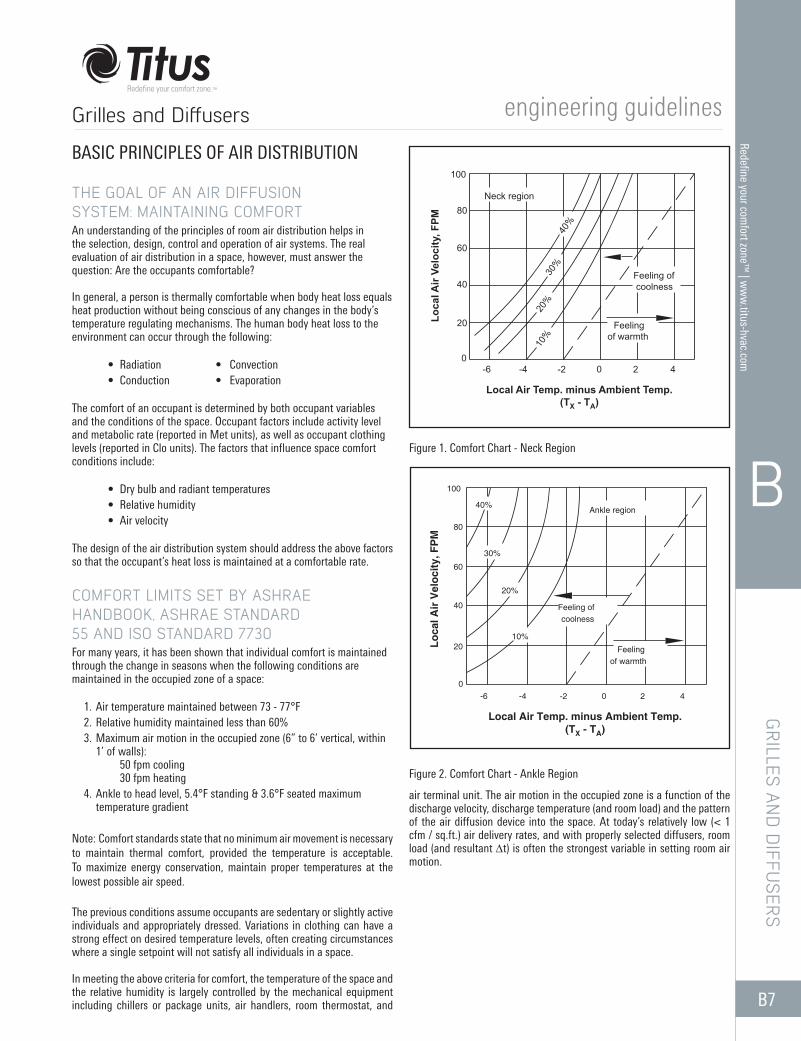
Figure 1. Comfort Chart - Neck Region
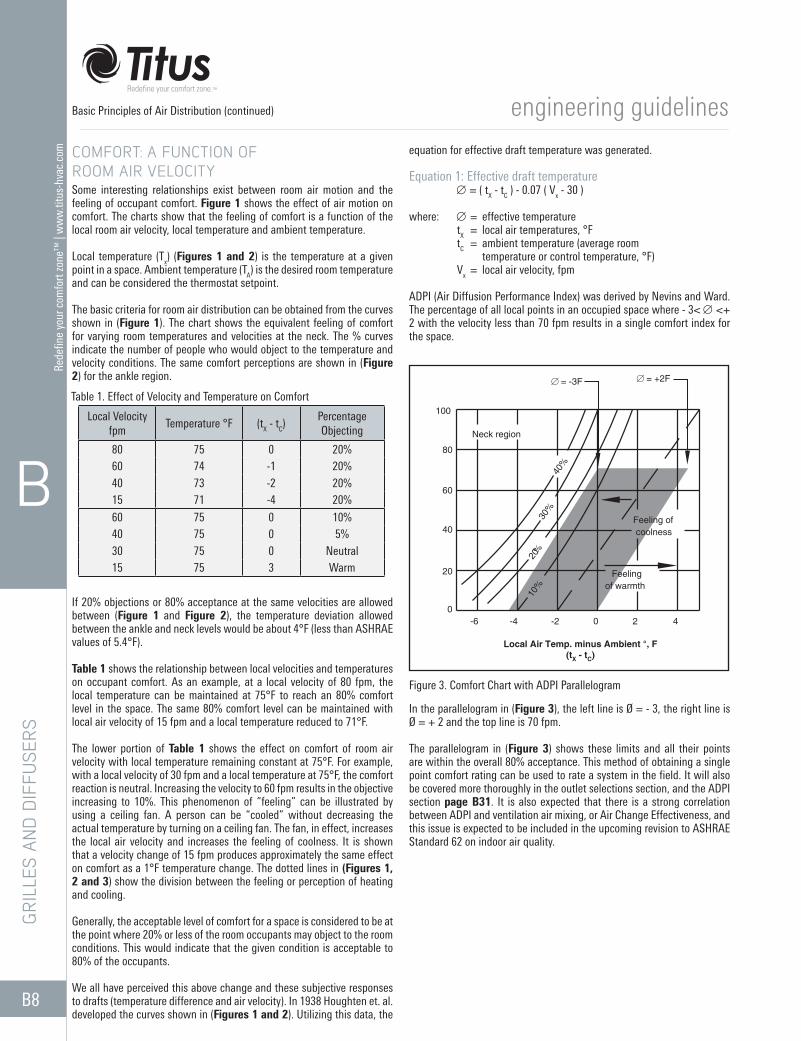
Figure 2. Comfort Chart - Ankle Region
Grilles and Diffusers
-20
-6 -4 0 2 4
Feeling ofcoolness
80
20
40
60
10%
20%
30%
100
40%
of warmthFeeling
Ankle region
Loca
l Air
Vel
ocity
, FP
M
Local Air Temp. minus Ambient Temp.(TX - TA)
10%
-2
0
-6 -4 0 2 4
40%
Neck region
20
40
60
80
30%
20%
100
of warmth
coolness
Feeling of
Feeling
Lo
cal A
ir V
elo
cit
y, F
PM
Local Air Temp. minus Ambient Temp.
(TX - TA)
B8
Rede
fine
your
com
fort
zone
™ |
ww
w.ti
tus-
hvac
.com
engineering guidelines
B
GRI
LLES
AN
D D
IFFU
SERS
COMFORT: A FUNCTION OF ROOM AIR VELOCITYSome interesting relationships exist between room air motion and the feeling of occupant comfort. Figure 1 shows the effect of air motion on comfort. The charts show that the feeling of comfort is a function of the local room air velocity, local temperature and ambient temperature.
Local temperature (Tx) (Figures 1 and 2) is the temperature at a given point in a space. Ambient temperature (TA) is the desired room temperature and can be considered the thermostat setpoint.
The basic criteria for room air distribution can be obtained from the curves shown in (Figure 1). The chart shows the equivalent feeling of comfort for varying room temperatures and velocities at the neck. The % curves indicate the number of people who would object to the temperature and velocity conditions. The same comfort perceptions are shown in (Figure 2) for the ankle region.
If 20% objections or 80% acceptance at the same velocities are allowed between (Figure 1 and Figure 2), the temperature deviation allowed between the ankle and neck levels would be about 4°F (less than ASHRAE values of 5.4°F).
Table 1 shows the relationship between local velocities and temperatures on occupant comfort. As an example, at a local velocity of 80 fpm, the local temperature can be maintained at 75°F to reach an 80% comfort level in the space. The same 80% comfort level can be maintained with local air velocity of 15 fpm and a local temperature reduced to 71°F.
The lower portion of Table 1 shows the effect on comfort of room air velocity with local temperature remaining constant at 75°F. For example, with a local velocity of 30 fpm and a local temperature at 75°F, the comfort reaction is neutral. Increasing the velocity to 60 fpm results in the objective increasing to 10%. This phenomenon of “feeling” can be illustrated by using a ceiling fan. A person can be “cooled” without decreasing the actual temperature by turning on a ceiling fan. The fan, in effect, increases the local air velocity and increases the feeling of coolness. It is shown that a velocity change of 15 fpm produces approximately the same effect on comfort as a 1°F temperature change. The dotted lines in (Figures 1, 2 and 3) show the division between the feeling or perception of heating and cooling.
Generally, the acceptable level of comfort for a space is considered to be at the point where 20% or less of the room occupants may object to the room conditions. This would indicate that the given condition is acceptable to 80% of the occupants.
We all have perceived this above change and these subjective responses to drafts (temperature difference and air velocity). In 1938 Houghten et. al. developed the curves shown in (Figures 1 and 2). Utilizing this data, the
equation for effective draft temperature was generated.
Equation 1: Effective draft temperature ∅ = ( tX - tC ) - 0.07 ( Vx - 30 )
where: ∅ = effective temperature tX = local air temperatures, °F tC = ambient temperature (average room temperature or control temperature, °F) Vx = local air velocity, fpm
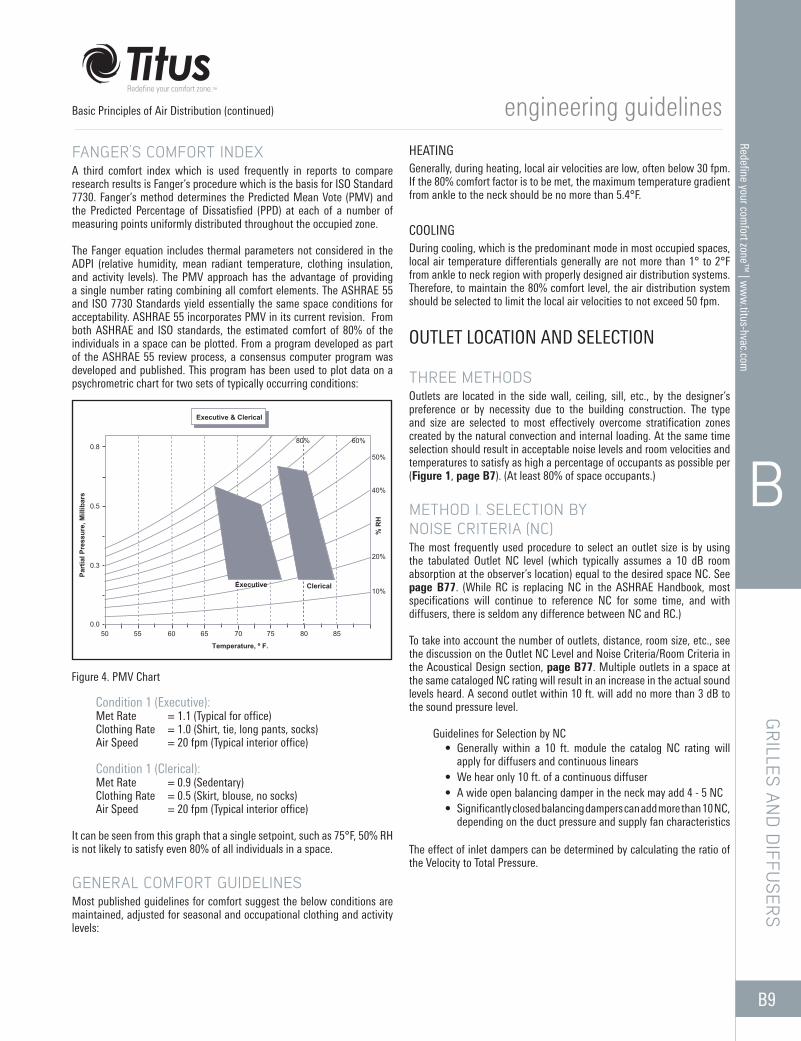
ADPI (Air Diffusion Performance Index) was derived by Nevins and Ward. The percentage of all local points in an occupied space where - 3< ∅ <+ 2 with the velocity less than 70 fpm results in a single comfort index for the space.
In the parallelogram in (Figure 3), the left line is Ø = - 3, the right line is Ø = + 2 and the top line is 70 fpm.
The parallelogram in (Figure 3) shows these limits and all their points are within the overall 80% acceptance. This method of obtaining a single point comfort rating can be used to rate a system in the field. It will also be covered more thoroughly in the outlet selections section, and the ADPI section page B31. It is also expected that there is a strong correlation between ADPI and ventilation air mixing, or Air Change Effectiveness, and this issue is expected to be included in the upcoming revision to ASHRAE Standard 62 on indoor air quality.
Figure 3. Comfort Chart with ADPI Parallelogram
Table 1. Effect of Velocity and Temperature on Comfort
Local Velocity fpm
Temperature °F (tX - tC)Percentage Objecting
80 75 0 20%60 74 -1 20%40 73 -2 20%15 71 -4 20%
60 75 0 10%40 75 0 5%30 75 0 Neutral15 75 3 Warm
Basic Principles of Air Distribution (continued)
10%
-20
-6 -4 0 2 4
40%
Neck region
20
40
60
80
30%
20%
100
of warmth
coolnessFeeling of
Feeling
∅ = -3F ∅ = +2F
Local Air Temp. minus Ambient °, F(tX - tC)
B9
Redefine your comfort zone™
| ww
w.titus-hvac.com
engineering guidelines
B
GRILLES AN
D D
IFFUSERS
FANGER’S COMFORT INDEXA third comfort index which is used frequently in reports to compare research results is Fanger’s procedure which is the basis for ISO Standard 7730. Fanger’s method determines the Predicted Mean Vote (PMV) and the Predicted Percentage of Dissatisfied (PPD) at each of a number of measuring points uniformly distributed throughout the occupied zone.
The Fanger equation includes thermal parameters not considered in the ADPI (relative humidity, mean radiant temperature, clothing insulation, and activity levels). The PMV approach has the advantage of providing a single number rating combining all comfort elements. The ASHRAE 55 and ISO 7730 Standards yield essentially the same space conditions for acceptability. ASHRAE 55 incorporates PMV in its current revision. From both ASHRAE and ISO standards, the estimated comfort of 80% of the individuals in a space can be plotted. From a program developed as part of the ASHRAE 55 review process, a consensus computer program was developed and published. This program has been used to plot data on a psychrometric chart for two sets of typically occurring conditions:
Condition 1 (Executive): Met Rate = 1.1 (Typical for office) Clothing Rate = 1.0 (Shirt, tie, long pants, socks) Air Speed = 20 fpm (Typical interior office) Condition 1 (Clerical): Met Rate = 0.9 (Sedentary) Clothing Rate = 0.5 (Skirt, blouse, no socks) Air Speed = 20 fpm (Typical interior office)
It can be seen from this graph that a single setpoint, such as 75°F, 50% RH is not likely to satisfy even 80% of all individuals in a space.
GENERAL COMFORT GUIDELINESMost published guidelines for comfort suggest the below conditions are maintained, adjusted for seasonal and occupational clothing and activity levels:
HEATINGGenerally, during heating, local air velocities are low, often below 30 fpm. If the 80% comfort factor is to be met, the maximum temperature gradient from ankle to the neck should be no more than 5.4°F.
COOLINGDuring cooling, which is the predominant mode in most occupied spaces, local air temperature differentials generally are not more than 1° to 2°F from ankle to neck region with properly designed air distribution systems. Therefore, to maintain the 80% comfort level, the air distribution system should be selected to limit the local air velocities to not exceed 50 fpm.
OUTLET LOCATION AND SELECTION
THREE METHODSOutlets are located in the side wall, ceiling, sill, etc., by the designer’s preference or by necessity due to the building construction. The type and size are selected to most effectively overcome stratification zones created by the natural convection and internal loading. At the same time selection should result in acceptable noise levels and room velocities and temperatures to satisfy as high a percentage of occupants as possible per (Figure 1, page B7). (At least 80% of space occupants.)
METHOD I. SELECTION BY NOISE CRITERIA (NC)The most frequently used procedure to select an outlet size is by using the tabulated Outlet NC level (which typically assumes a 10 dB room absorption at the observer’s location) equal to the desired space NC. See page B77. (While RC is replacing NC in the ASHRAE Handbook, most specifications will continue to reference NC for some time, and with diffusers, there is seldom any difference between NC and RC.)
To take into account the number of outlets, distance, room size, etc., see the discussion on the Outlet NC Level and Noise Criteria/Room Criteria in the Acoustical Design section, page B77. Multiple outlets in a space at the same cataloged NC rating will result in an increase in the actual sound levels heard. A second outlet within 10 ft. will add no more than 3 dB to the sound pressure level. Guidelines for Selection by NC
• Generally within a 10 ft. module the catalog NC rating will apply for diffusers and continuous linears
• We hear only 10 ft. of a continuous diffuser• A wide open balancing damper in the neck may add 4 - 5 NC• Significantly closed balancing dampers can add more than 10 NC,
depending on the duct pressure and supply fan characteristics
The effect of inlet dampers can be determined by calculating the ratio of the Velocity to Total Pressure.
Figure 4. PMV Chart
Basic Principles of Air Distribution (continued)
Executive & Clerical
500.0
0.3
0.5
0.8
55 60 65 70 75 80 85
10%
20%
40%
50%
60%80%
Temperature, º F.
Part
ial P
ress
ure,
Mill
ibar
s
% R
H
Executive Clerical
B10
Rede
fine
your
com
fort
zone
™ |
ww
w.ti
tus-
hvac
.com
engineering guidelines
B
GRI
LLES
AN
D D
IFFU
SERS
Flow restrictions increase the space sound levels. When making a selection at a given cfm and adding a damper, a device with a low total pressure will have a higher actual increase in NC as compared to a device with a higher total pressure. The sound level increases above the cataloged NC rating due to the pressure increases from dampers or other control devices, can be approximated by the use of Table 2. An inlet balancing damper can be expected to add about 3 dB when fully open, and as much as 10 dB or more if significantly closed.
METHOD II. SELECTION BY SUPPLY JETS MAPPINGThis selection procedure uses the throw values to terminal velocities of 150, 100 and 50 fpm from the performance tables. Examples of how terminal velocities are used are shown in (Figures 7 and 8, pages B13 and B14). Temperature differences at these terminal velocities are added to the map by using the following equation:
Equation 2: Temperature change of supply jet Dtx = 0.8 Dto
where: Dtx = tx - tc Dto = to - tc
tx = local air temperature, °F tc = ambient temperature (average room temperature for control temperature, °F) to = outlet air temperature, °F
Note: Temperature Differential between total air and room air for various terminal velocities. Calculated with Equation 2, with Dto = 20°F and Vo = 1000 fpm.
Selection by supply jet mapping identifies the most probable portion of the space to be uncomfortable. Portions of a space away from the supply jet will have velocities and temperatures that are nearly equal to the space ambient conditions.
Not all applications result in “overblow” in a confined space as shown in (Figure 8). In some cases the throw terminates with the airstream dropping into the occupied space. This is due to the buoyancy effect between the airstream and space air and/or external forces. Drop must then be considered as shown in (Figures 10 through 15, pages B16 - B18) for side wall outlets and Table 5, page B19 for ceiling diffusers. Many examples of jet performance mapping are shown throughout this engineering section.
MAPPING PROCEDURES1. Select type of diffuser (Reviewing the Classification of Supply
Outlets section on page B19 will help determine the best device) 2. For diffusers, check Table 5 on page B19 to determine if the air
quantity is less than the maximum3. When selecting a side wall grille, check configuration in (Figures
10 through 15), in this section for drop during cooling (use cfm and jet velocity)
4. Plot isothermal T150, T100, T50 from performance data in catalog for a selected size and cfm at the throw distances
5. If the outlet provides a horizontal pattern below the ceiling, the pattern will tend to leave the ceiling near the 100 fpm terminal velocity
6. Repeat steps 1 through 5 as necessary to meet job requirements
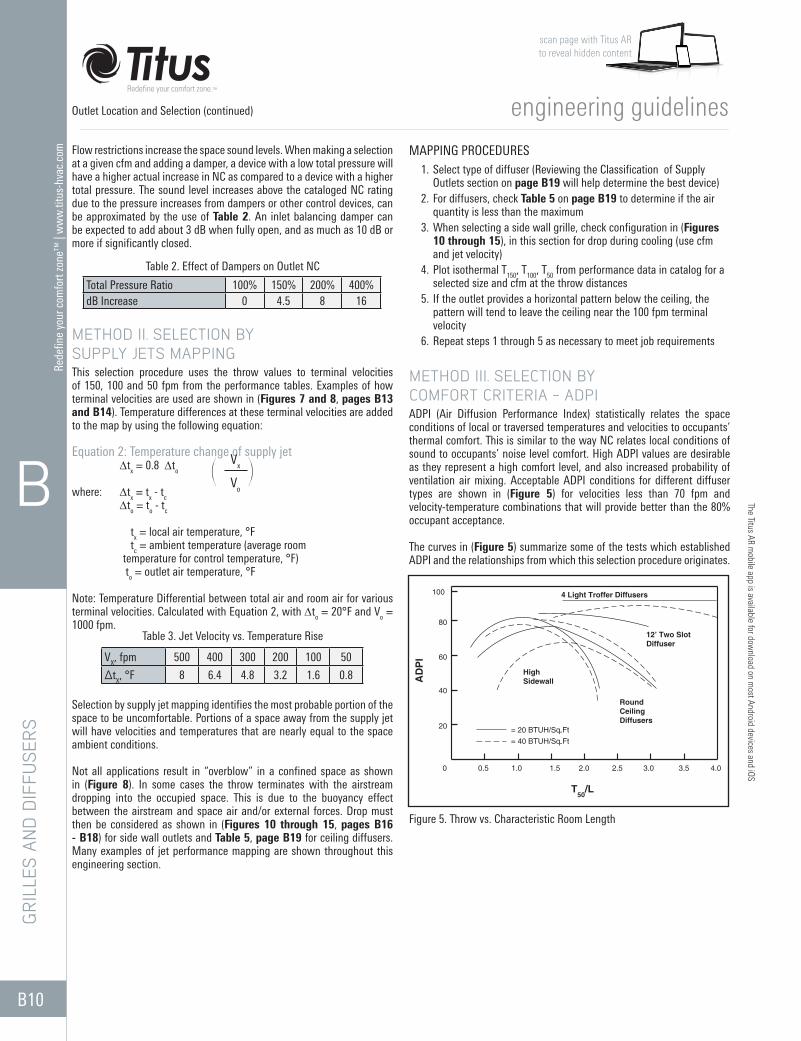
METHOD III. SELECTION BY COMFORT CRITERIA - ADPIADPI (Air Diffusion Performance Index) statistically relates the space conditions of local or traversed temperatures and velocities to occupants’ thermal comfort. This is similar to the way NC relates local conditions of sound to occupants’ noise level comfort. High ADPI values are desirable as they represent a high comfort level, and also increased probability of ventilation air mixing. Acceptable ADPI conditions for different diffuser types are shown in (Figure 5) for velocities less than 70 fpm and velocity-temperature combinations that will provide better than the 80% occupant acceptance.
The curves in (Figure 5) summarize some of the tests which established ADPI and the relationships from which this selection procedure originates.
Table 2. Effect of Dampers on Outlet NC
Total Pressure Ratio 100% 150% 200% 400%dB Increase 0 4.5 8 16
Table 3. Jet Velocity vs. Temperature Rise
VX, fpm 500 400 300 200 100 50
∆tX, °F 8 6.4 4.8 3.2 1.6 0.8
Figure 5. Throw vs. Characteristic Room Length
o
Vxp
Vo
Outlet Location and Selection (continued)
scan page with Titus AR to reveal hidden content
The Titus AR mobile app is available for dow
nload on most Android devices and iOS
0 3.0 4.0
20
40
60
80
100
T50
/L
AD
PI
4 Light Troffer Diffusers
12’ Two SlotDiffuser
RoundCeilingDiffusers
HighSidewall
= 20 BTUH/Sq.Ft.= 40 BTUH/Sq.Ft.
3.52.01.00.5 1.5 2.5
B11
Redefine your comfort zone™
| ww
w.titus-hvac.com
engineering guidelines
B
GRILLES AN
D D
IFFUSERS
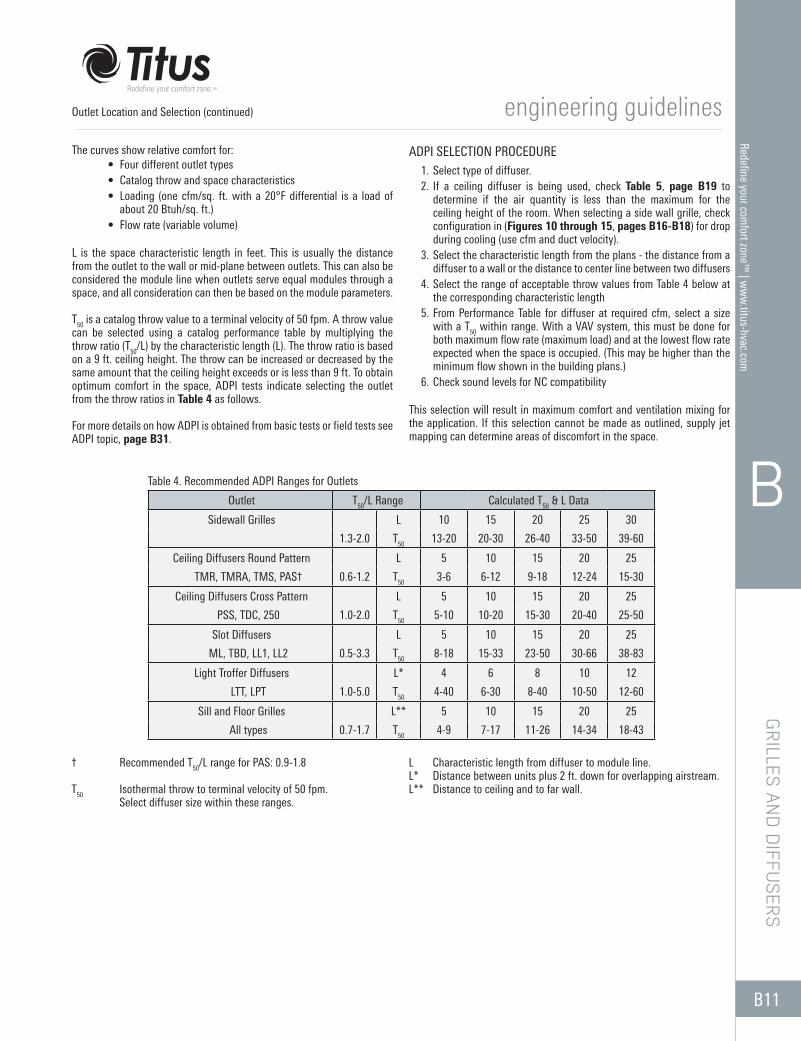
The curves show relative comfort for:• Four different outlet types• Catalog throw and space characteristics• Loading (one cfm/sq. ft. with a 20°F differential is a load of
about 20 Btuh/sq. ft.)• Flow rate (variable volume)
L is the space characteristic length in feet. This is usually the distance from the outlet to the wall or mid-plane between outlets. This can also be considered the module line when outlets serve equal modules through a space, and all consideration can then be based on the module parameters.
T50 is a catalog throw value to a terminal velocity of 50 fpm. A throw value can be selected using a catalog performance table by multiplying the throw ratio (T50/L) by the characteristic length (L). The throw ratio is based on a 9 ft. ceiling height. The throw can be increased or decreased by the same amount that the ceiling height exceeds or is less than 9 ft. To obtain optimum comfort in the space, ADPI tests indicate selecting the outlet from the throw ratios in Table 4 as follows.
For more details on how ADPI is obtained from basic tests or field tests see ADPI topic, page B31.
ADPI SELECTION PROCEDURE1. Select type of diffuser. 2. If a ceiling diffuser is being used, check Table 5, page B19 to
determine if the air quantity is less than the maximum for the ceiling height of the room. When selecting a side wall grille, check configuration in (Figures 10 through 15, pages B16-B18) for drop during cooling (use cfm and duct velocity).
3. Select the characteristic length from the plans - the distance from a diffuser to a wall or the distance to center line between two diffusers
4. Select the range of acceptable throw values from Table 4 below at the corresponding characteristic length
5. From Performance Table for diffuser at required cfm, select a size with a T50 within range. With a VAV system, this must be done for both maximum flow rate (maximum load) and at the lowest flow rate expected when the space is occupied. (This may be higher than the minimum flow shown in the building plans.)
6. Check sound levels for NC compatibility
This selection will result in maximum comfort and ventilation mixing for the application. If this selection cannot be made as outlined, supply jet mapping can determine areas of discomfort in the space.
† Recommended T50/L range for PAS: 0.9-1.8
T50 Isothermal throw to terminal velocity of 50 fpm. Select diffuser size within these ranges.
L Characteristic length from diffuser to module line.L* Distance between units plus 2 ft. down for overlapping airstream.L** Distance to ceiling and to far wall.
Table 4. Recommended ADPI Ranges for Outlets
Outlet T50/L Range Calculated T50 & L Data
Sidewall Grilles L 10 15 20 25 30
1.3-2.0 T50 13-20 20-30 26-40 33-50 39-60
Ceiling Diffusers Round Pattern L 5 10 15 20 25
TMR, TMRA, TMS, PAS† 0.6-1.2 T50 3-6 6-12 9-18 12-24 15-30
Ceiling Diffusers Cross Pattern L 5 10 15 20 25
PSS, TDC, 250 1.0-2.0 T50 5-10 10-20 15-30 20-40 25-50
Slot Diffusers L 5 10 15 20 25
ML, TBD, LL1, LL2 0.5-3.3 T50 8-18 15-33 23-50 30-66 38-83
Light Troffer Diffusers L* 4 6 8 10 12
LTT, LPT 1.0-5.0 T50 4-40 6-30 8-40 10-50 12-60
Sill and Floor Grilles L** 5 10 15 20 25
All types 0.7-1.7 T50 4-9 7-17 11-26 14-34 18-43
Outlet Location and Selection (continued)
B12
Rede
fine
your
com
fort
zone
™ |
ww
w.ti
tus-
hvac
.com
engineering guidelines
B
GRI
LLES
AN
D D
IFFU
SERS
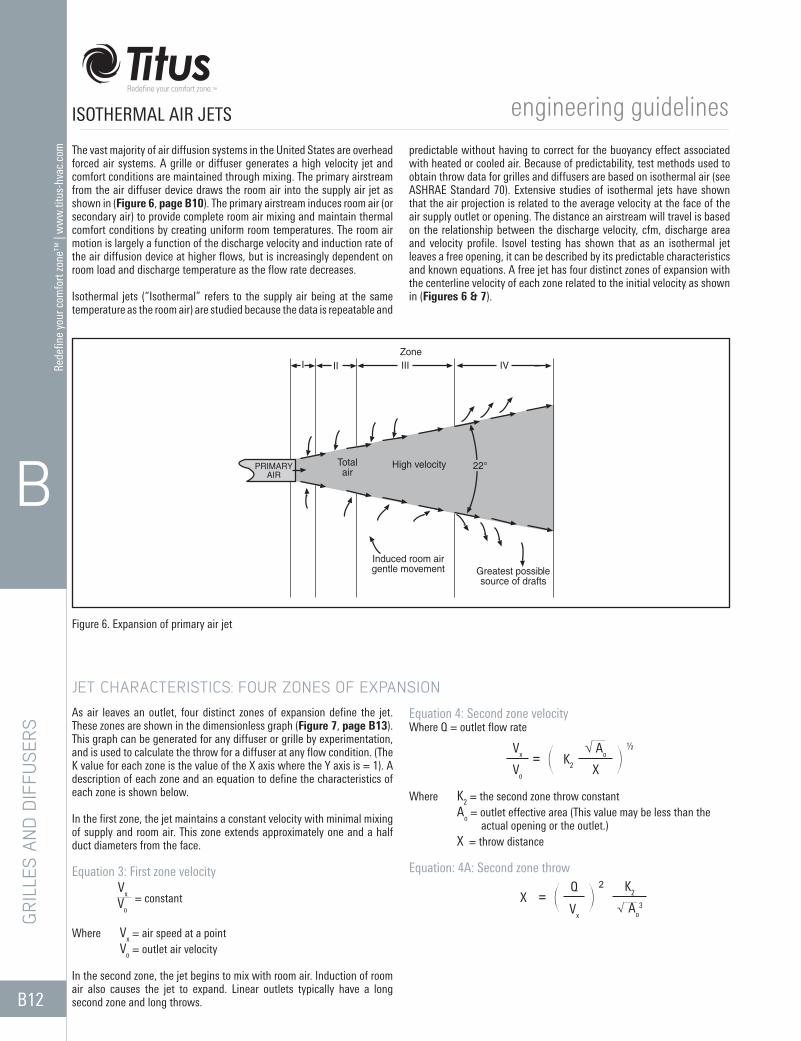
The vast majority of air diffusion systems in the United States are overhead forced air systems. A grille or diffuser generates a high velocity jet and comfort conditions are maintained through mixing. The primary airstream from the air diffuser device draws the room air into the supply air jet as shown in (Figure 6, page B10). The primary airstream induces room air (or secondary air) to provide complete room air mixing and maintain thermal comfort conditions by creating uniform room temperatures. The room air motion is largely a function of the discharge velocity and induction rate of the air diffusion device at higher flows, but is increasingly dependent on room load and discharge temperature as the flow rate decreases.
Isothermal jets (“Isothermal” refers to the supply air being at the same temperature as the room air) are studied because the data is repeatable and
predictable without having to correct for the buoyancy effect associated with heated or cooled air. Because of predictability, test methods used to obtain throw data for grilles and diffusers are based on isothermal air (see ASHRAE Standard 70). Extensive studies of isothermal jets have shown that the air projection is related to the average velocity at the face of the air supply outlet or opening. The distance an airstream will travel is based on the relationship between the discharge velocity, cfm, discharge area and velocity profile. Isovel testing has shown that as an isothermal jet leaves a free opening, it can be described by its predictable characteristics and known equations. A free jet has four distinct zones of expansion with the centerline velocity of each zone related to the initial velocity as shown in (Figures 6 & 7).
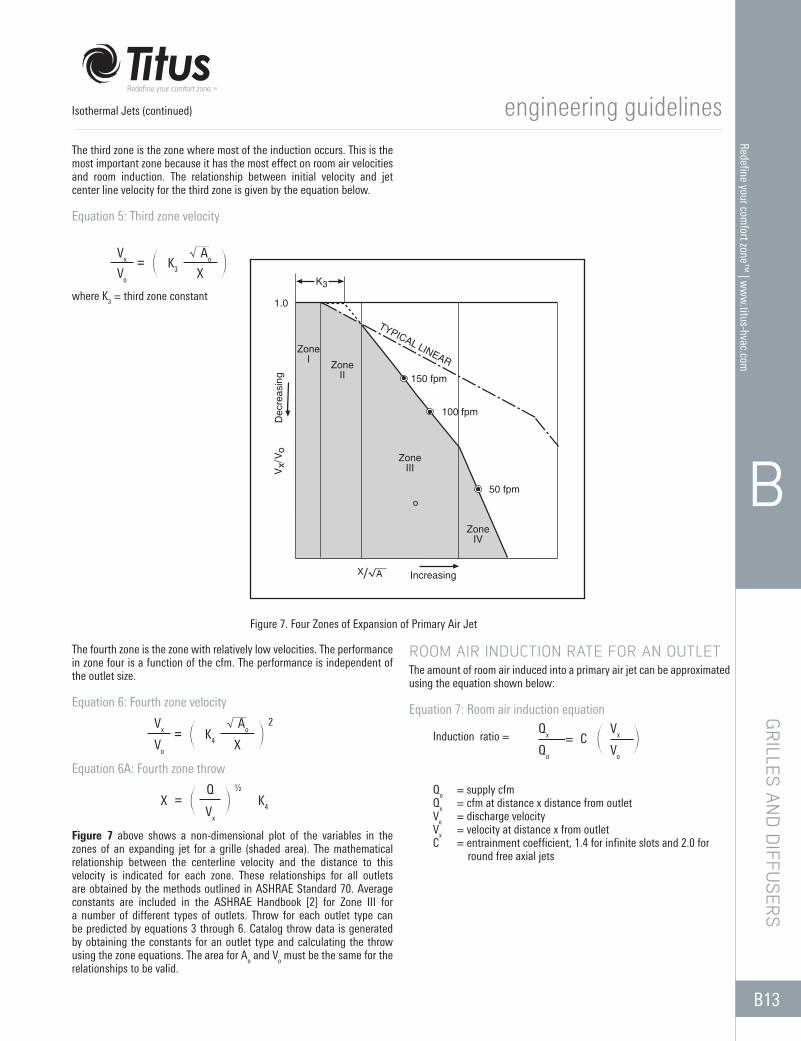
As air leaves an outlet, four distinct zones of expansion define the jet. These zones are shown in the dimensionless graph (Figure 7, page B13). This graph can be generated for any diffuser or grille by experimentation, and is used to calculate the throw for a diffuser at any flow condition. (The K value for each zone is the value of the X axis where the Y axis is = 1). A description of each zone and an equation to define the characteristics of each zone is shown below.
In the first zone, the jet maintains a constant velocity with minimal mixing of supply and room air. This zone extends approximately one and a half duct diameters from the face.
Equation 3: First zone velocity Vx
Vo
Where Vx = air speed at a point Vo = outlet air velocity In the second zone, the jet begins to mix with room air. Induction of room air also causes the jet to expand. Linear outlets typically have a long second zone and long throws.
Equation 4: Second zone velocityWhere Q = outlet flow rate
Where K2 = the second zone throw constant Ao = outlet effective area (This value may be less than the actual opening or the outlet.) X = throw distance
Equation: 4A: Second zone throw
Figure 6. Expansion of primary air jet
X = o
Qp
2 K2
Vx√ Ao
3
ISOTHERMAL AIR JETS
JET CHARACTERISTICS: FOUR ZONES OF EXPANSION
= constant
Vx = o K2
√ Aop
½
Vo X
PRIMARYAIR
Induced room airgentle movement
High velocity 22°Totalair
II IIIZone
IV
Greatest possiblesource of drafts
I
B13
Redefine your comfort zone™
| ww
w.titus-hvac.com
engineering guidelines
B
GRILLES AN
D D
IFFUSERS
The fourth zone is the zone with relatively low velocities. The performance in zone four is a function of the cfm. The performance is independent of the outlet size.
Equation 6: Fourth zone velocity
Equation 6A: Fourth zone throw
Figure 7 above shows a non-dimensional plot of the variables in the zones of an expanding jet for a grille (shaded area). The mathematical relationship between the centerline velocity and the distance to this velocity is indicated for each zone. These relationships for all outlets are obtained by the methods outlined in ASHRAE Standard 70. Average constants are included in the ASHRAE Handbook [2] for Zone III for a number of different types of outlets. Throw for each outlet type can be predicted by equations 3 through 6. Catalog throw data is generated by obtaining the constants for an outlet type and calculating the throw using the zone equations. The area for Ao and Vo must be the same for the relationships to be valid.
ROOM AIR INDUCTION RATE FOR AN OUTLETThe amount of room air induced into a primary air jet can be approximated using the equation shown below:
Equation 7: Room air induction equation
Induction ratio =
Qo = supply cfm Qx = cfm at distance x distance from outlet Vo = discharge velocity Vx = velocity at distance x from outlet C = entrainment coefficient, 1.4 for infinite slots and 2.0 for round free axial jets
Vx = o K4
√ Aop
2
Vo X
X = o
Qp
½
K4Vx
Qx = C oVx
p
Qo Vo
Isothermal Jets (continued)
Figure 7. Four Zones of Expansion of Primary Air Jet
1.0
Dec
reas
ing
ZoneI Zone
II
ZoneIII
ZoneIV
Increasing
TYPICAL LINEAR
Vx/
V o
150 fpm
100 fpm
50 fpm
K3
X/ A
o
Vx = o K3
√ Aop
Vo X
The third zone is the zone where most of the induction occurs. This is the most important zone because it has the most effect on room air velocities and room induction. The relationship between initial velocity and jet center line velocity for the third zone is given by the equation below. Equation 5: Third zone velocity
where K3 = third zone constant
B14
Rede
fine
your
com
fort
zone
™ |
ww
w.ti
tus-
hvac
.com
engineering guidelines
B
GRI
LLES
AN
D D
IFFU
SERS
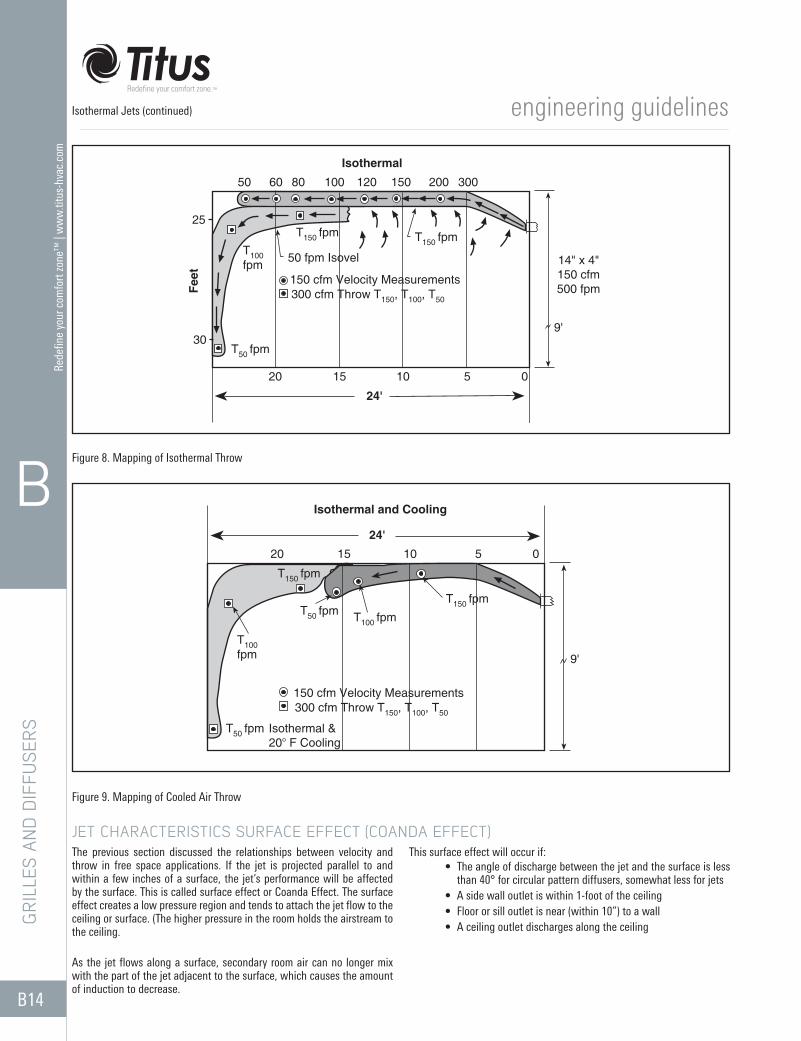
The previous section discussed the relationships between velocity and throw in free space applications. If the jet is projected parallel to and within a few inches of a surface, the jet’s performance will be affected by the surface. This is called surface effect or Coanda Effect. The surface effect creates a low pressure region and tends to attach the jet flow to the ceiling or surface. (The higher pressure in the room holds the airstream to the ceiling.
As the jet flows along a surface, secondary room air can no longer mix with the part of the jet adjacent to the surface, which causes the amount of induction to decrease.
This surface effect will occur if:• The angle of discharge between the jet and the surface is less
than 40° for circular pattern diffusers, somewhat less for jets• A side wall outlet is within 1-foot of the ceiling• Floor or sill outlet is near (within 10”) to a wall• A ceiling outlet discharges along the ceiling
Isothermal Jets (continued)
Figure 8. Mapping of Isothermal Throw
Figure 9. Mapping of Cooled Air Throw
JET CHARACTERISTICS SURFACE EFFECT (COANDA EFFECT)
Isothermal
Feet
50 60 80 100 120 150 200 300
25
30T50 fpm
20 15 10 5 0
24'
150 cfm Velocity Measurements300 cfm Throw T150, T100, T50
T100 fpm
T150 fpm T150 fpm
50 fpm Isovel 14" x 4"150 cfm500 fpm
9'
Isothermal and Cooling
20 15 10 5 0
24'
150 cfm Velocity Measurements300 cfm Throw T150, T100, T50
T100 fpm 9'
Isothermal &20° F Cooling
T50 fpm
T100 fpmT50 fpmT150 fpm
T150 fpm
B15
Redefine your comfort zone™
| ww
w.titus-hvac.com
engineering guidelines
B
GRILLES AN
D D
IFFUSERS
PROCEDURE TO OBTAIN CATALOG THROW DATATest data in (Figure 7, page B13) shows typical velocity measurements obtained during isothermal testing of a typical 12” x 6” grille with 155 cfm. At each measuring distance (x), velocities are obtained below the ceiling at 1, 2, 3 inches, etc. The highest sustained velocities (Vx) at each distance are used in (Figure 7). For a complete series of different size outlets, (Figure 7) is a dimensionless plot of Vx / Vo vs. x /√Ao.
When the curves of (Figure 7) are established for a complete series, the throw values are included in the Titus performance tables for terminal velocities of 150, 100, and 50 fpm. These catalog data can then be used to map velocities. A uniform distribution of the three catalog velocities across the ceiling are shown in (Figures 8 and 9, page B14) for 150 cfm. In general, the T50 location for a free jet with 20B DT cooling will be approximately the same distance from the outlet as the T100 isothermal jet.
Figures 8 and 9 also show that for 300 cfm, the three values overblow to the opposite wall. These values are approximately the total distance to the wall and down the wall. In both the 150 and 300 cfm conditions the 50 fpm isothermal envelope (isovel) is near the ceiling and wall. Higher velocities occur only near the wall with the 300 cfm. Velocities in the rest of the room are below 50 fpm.
Two outlets handling the same opposing airflow values would result in airflow in the space like that shown for one jet at the wall. The 150 fpm throw would exist at the same position whether heating or cooling. With overblow, as with 300 cfm, drop would not be the same as the 150 cfm. The higher airflow is also an example of “Rolling the Room,” (Figure 35, page B30).
ISOTHERMAL JET THEORY FOR ALL OUTLETSAlthough the information so far has dealt with grille or wall outlets, the same principles included in (Figure 7) apply equally well for all types of outlets: ceiling diffusers with air patterns on the ceiling, ceiling slots, and upward and downward projection of air. Slots and linear outlets usually show a large second zone characteristic, which results in longer throws as indicated by the dotted line in (Figure 7). Testing using isothermal air is repeatable. Therefore, isothermal diffuser testing has been the basis for throw determination in all standards since the original ADC Test Code 1062. These include 1062 thru 1062 R4, ISO, and the latest ASHRAE Standard 70.
In addition, Titus has used the three throw values at 150, 100 and 50 fpm as aids in applications by mapping and application of the Air Diffusion Performance Index (ADPI). All results from different diffusers and diffuser locations are shown in the section on Classification of Supply Outlets, Table 4, page B11.
NONISOTHERMAL JETSYear round applications often require heating, cooling and isothermal conditions through the same device.
Titus originally tested all outlets using the method of analysis in (Figure 7). During cooling with a 20°F differential, a modification of a similar method proposed by Koestel, taking into account the buoyancy effect, was used. As a result, Titus built an elaborate database on jet characteristics from all diffusers and grilles as shown in (Figures 10 through 15, pages B16 - B18).
The most significant results are shown in these figures with side wall grilles in many applications, locations, and blade configurations. These charts show the relationship of cfm, jet velocity, throw and drop with a 20°F differential between the supply air and the space air temperatures. Each circle on these curves represents the 50 fpm terminal velocity from the same size outlet under these configurations handling 300 cfm with a jet velocity of 600 fpm. Each intercept of cfm and velocity indicates the same grille size which can be determined from the tables in Sections K, L and M. From (Figure 10), the 50 fpm cooling throw and drop for a 300 fpm jet at 150 cfm are 12 ft. throw and 4.5 ft. drop below the ceiling. For 300 cfm and 300 fpm, the throw is 13 ft. and the drop is 6 ft. below the ceiling. The characteristics with 300 cfm in this room size in (Figures 12 and 13) are very similar during cooling and isothermal conditions. The drop during cooling with 150 cfm results in low temperatures and velocities 50 fpm and above in the middle of the room.
In (Figures 14 and 15), the throw is reduced due to the 45° spread of the jet and drop is reduced.
EXHAUST AND RETURN GRILLE PRESSUREFor all exhaust and return grilles, the “Negative Static Pressure” shown in the return performance data charts is a conservative value which can be used for design purposes. For actual pressure drop, subtract the velocity pressure from the reported pressure value.
Isothermal Jets (continued)
B16
Rede
fine
your
com
fort
zone
™ |
ww
w.ti
tus-
hvac
.com
engineering guidelines
B
GRI
LLES
AN
D D
IFFU
SERS
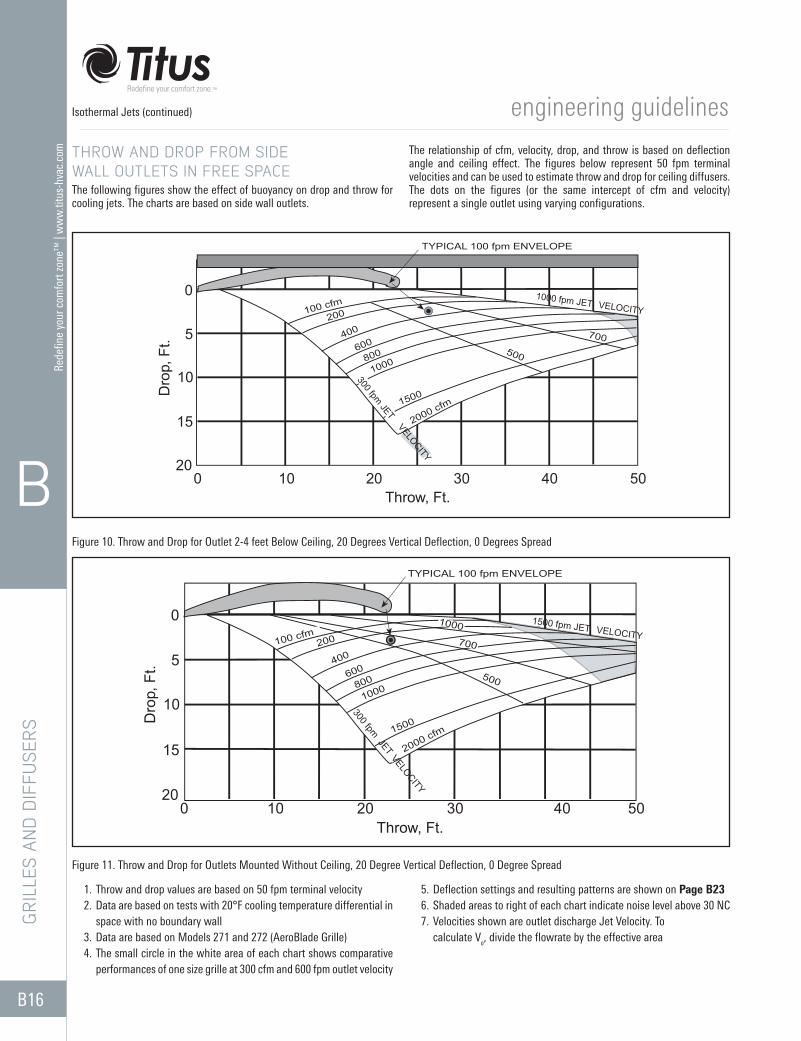
Figure 10. Throw and Drop for Outlet 2-4 feet Below Ceiling, 20 Degrees Vertical Deflection, 0 Degrees Spread
Figure 11. Throw and Drop for Outlets Mounted Without Ceiling, 20 Degree Vertical Deflection, 0 Degree Spread
THROW AND DROP FROM SIDE WALL OUTLETS IN FREE SPACEThe following figures show the effect of buoyancy on drop and throw for cooling jets. The charts are based on side wall outlets.
The relationship of cfm, velocity, drop, and throw is based on deflection angle and ceiling effect. The figures below represent 50 fpm terminal velocities and can be used to estimate throw and drop for ceiling diffusers. The dots on the figures (or the same intercept of cfm and velocity) represent a single outlet using varying configurations.
1. Throw and drop values are based on 50 fpm terminal velocity2. Data are based on tests with 20°F cooling temperature differential in
space with no boundary wall3. Data are based on Models 271 and 272 (AeroBlade Grille)4. The small circle in the white area of each chart shows comparative
performances of one size grille at 300 cfm and 600 fpm outlet velocity
5. Deflection settings and resulting patterns are shown on Page B236. Shaded areas to right of each chart indicate noise level above 30 NC7. Velocities shown are outlet discharge Jet Velocity. To
calculate Vo, divide the flowrate by the effective area
Isothermal Jets (continued)
0
5
10
15
2050403020100
Throw, Ft.
Dro
p, F
t.
100 cfm200
400
600
800
1000
1500
2000 cfm
TYPICAL 100 fpm ENVELOPE
700500
1000 fpm JET VELOCITY
300 fpm JET VELOCITY
0
5
10
15
2050403020100
Throw, Ft.
Dro
p, F
t.
100 cfm200
400
600
800
1000
1500
2000 cfm
TYPICAL 100 fpm ENVELOPE
500
1000 1500 fpm JET VELOCITY00
300 fpm JETVELOCITY
700
B17
Redefine your comfort zone™
| ww
w.titus-hvac.com
engineering guidelines
B
GRILLES AN
D D
IFFUSERS
Isothermal Jets (continued)
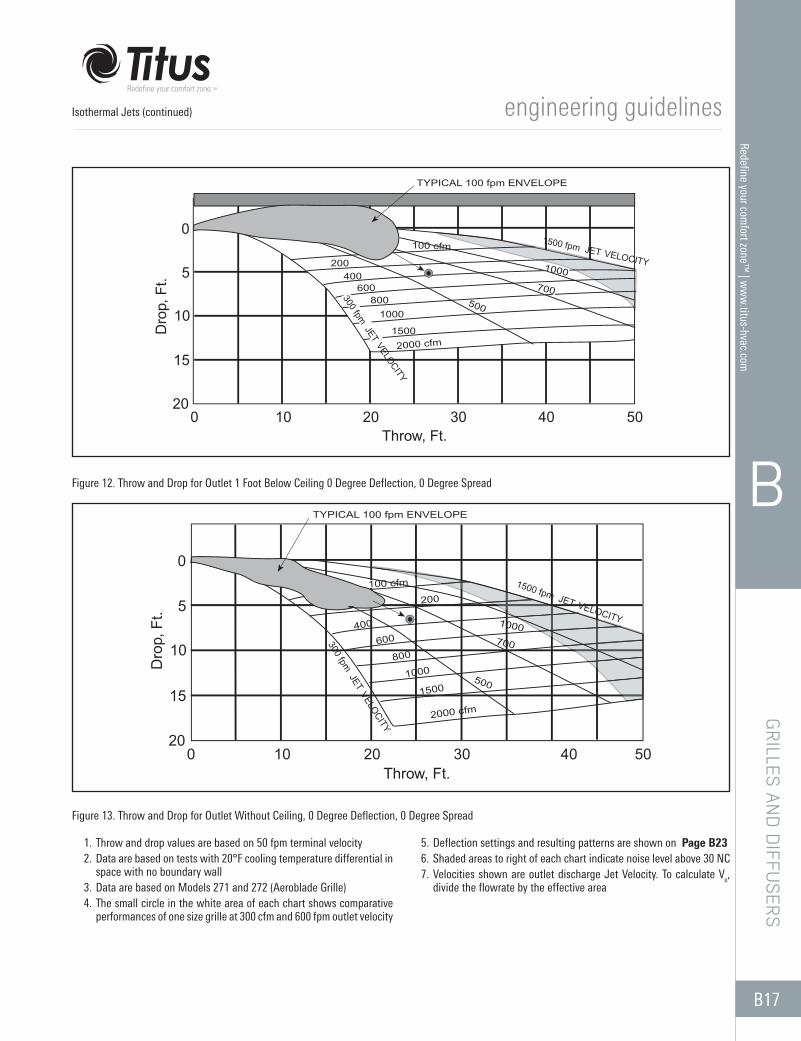
Figure 12. Throw and Drop for Outlet 1 Foot Below Ceiling 0 Degree Deflection, 0 Degree Spread
Figure 13. Throw and Drop for Outlet Without Ceiling, 0 Degree Deflection, 0 Degree Spread
1. Throw and drop values are based on 50 fpm terminal velocity2. Data are based on tests with 20°F cooling temperature differential in
space with no boundary wall3. Data are based on Models 271 and 272 (Aeroblade Grille)4. The small circle in the white area of each chart shows comparative
performances of one size grille at 300 cfm and 600 fpm outlet velocity
5. Deflection settings and resulting patterns are shown on Page B236. Shaded areas to right of each chart indicate noise level above 30 NC7. Velocities shown are outlet discharge Jet Velocity. To calculate Vo,
divide the flowrate by the effective area
0
5
10
15
2050403020100
Throw, Ft.
Dro
p, F
t.
200400
600800
15002000 cfm
TYPICAL 100 fpm ENVELOPE
5001000
100 cfm1500 fpm JET VELOCITY
300 fpm JET
VELOCITY
700
1000
0
5
10
15
2050403020100
Throw, Ft.
Dro
p, F
t.
100 cfm
200
400
600
800
1000
1500
2000 cfm
TYPICAL 100 fpm ENVELOPE
700
500
1000
300 fpm JET
VELOCITY
1500 fpm JET VELOCITY
B18
Rede
fine
your
com
fort
zone
™ |
ww
w.ti
tus-
hvac
.com
engineering guidelines
B
GRI
LLES
AN
D D
IFFU
SERS
Isothermal Jets (continued)
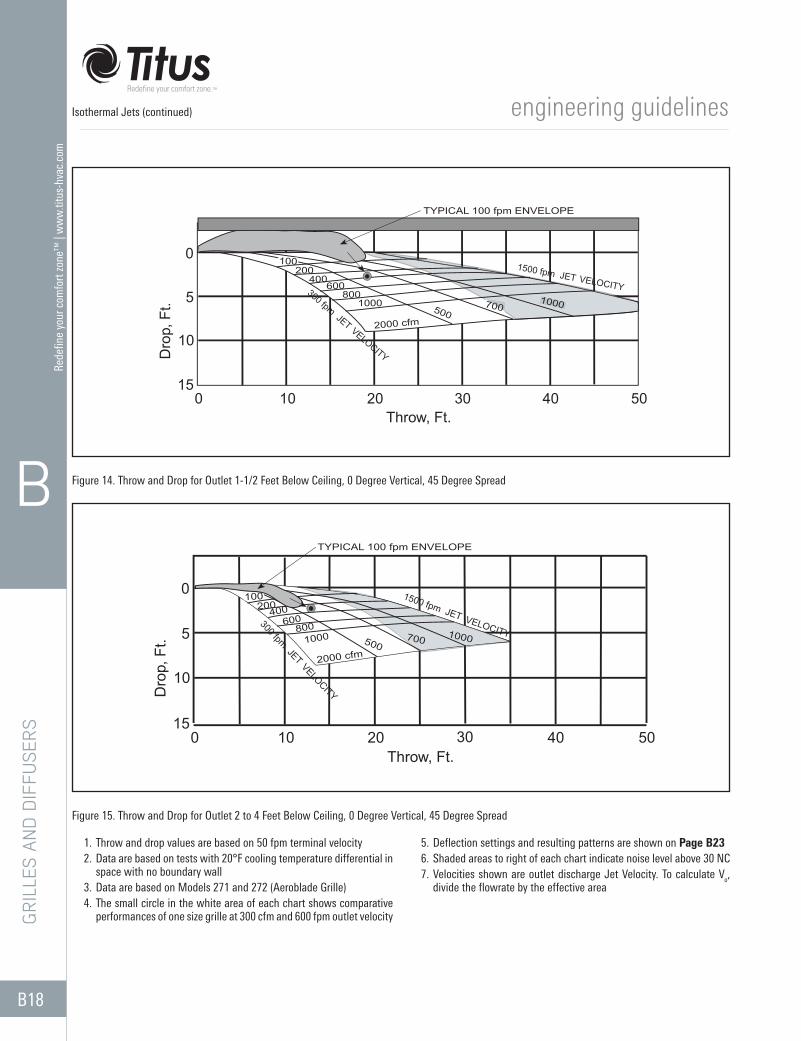
Figure 14. Throw and Drop for Outlet 1-1/2 Feet Below Ceiling, 0 Degree Vertical, 45 Degree Spread
Figure 15. Throw and Drop for Outlet 2 to 4 Feet Below Ceiling, 0 Degree Vertical, 45 Degree Spread
1. Throw and drop values are based on 50 fpm terminal velocity2. Data are based on tests with 20°F cooling temperature differential in
space with no boundary wall3. Data are based on Models 271 and 272 (Aeroblade Grille)4. The small circle in the white area of each chart shows comparative
performances of one size grille at 300 cfm and 600 fpm outlet velocity
5. Deflection settings and resulting patterns are shown on Page B236. Shaded areas to right of each chart indicate noise level above 30 NC7. Velocities shown are outlet discharge Jet Velocity. To calculate Vo,
divide the flowrate by the effective area
0
5
10
1550403020100
Throw, Ft.
Dro
p, F
t.
200400
600800
2000 cfm
TYPICAL 100 fpm ENVELOPE
5001000
100 1500 fpm JET VELOCITY300 fpm JET VELOCITY
1000700
0
5
10
15504020100
Throw, Ft.
Dro
p, F
t.
100200
400600
8001000
2000 cfm
TYPICAL 100 fpm ENVELOPE
7005001000
30
1500 fpm JET VELOCITY
300 fpm JETVELOCITY

B19
Redefine your comfort zone™
| ww
w.titus-hvac.com
engineering guidelines
B
GRILLES AN
D D
IFFUSERS
OTHER DIFFUSERS WITH COOLINGIn (Figures 10 through 15, pages B16-B18) the drop is primarily a function of the cfm. Therefore, to obtain a small drop, a small air quantity is necessary. For all outlets with horizontal airflow along the ceiling, the drop can be related to the air quantity and the ceiling height as shown in Table 5. In these cases airflow less than maximum shown results in drop above the occupied zone.
* cfm per side
SUPPLY OUTLET CLASSIFICATIONSIndependent comfort reactions have been covered and show the effect of local velocities and temperatures at a person’s neck or ankle sections. The basic jet characteristics that can be obtained by testing have been diagrammed. Many different outlets can be selected and can be placed in many locations for conditioning a space. This section covers the principle of analyzing the airflow into the space from some typical outlets during comparative heating and cooling conditions. From early air distribution tests conducted at the University of Illinois from 1950-1955 and continuing on through today, the principles of stratification, natural convection currents, stagnation layers and air motion for types of outlet locations have been studied.
From these results, some general outlet classifications appear. These classifications may be used in the first approach to outlet selection.
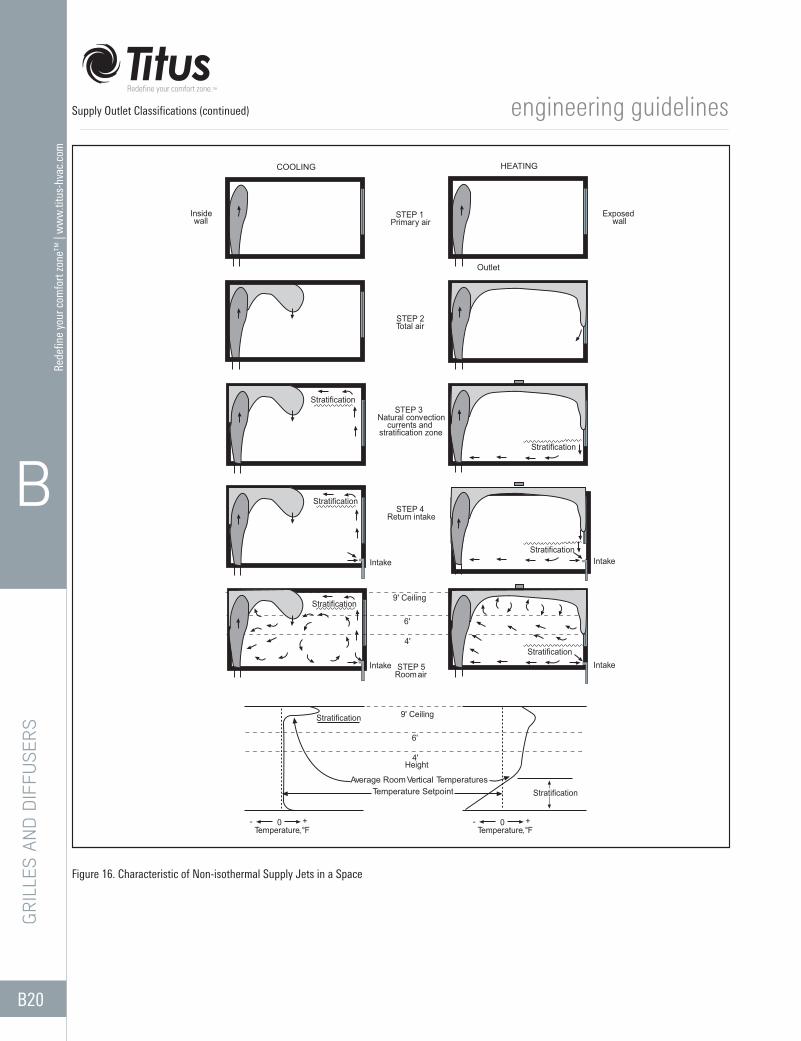
TYPICAL AIR DISTRIBUTION CHARACTERISTICSThe characteristics shown in (Figure 16, page B20), are principles obtained during heating and cooling in any type of system. The following figures will classify the outlets by location and air pattern.
The magnitude of the stratification zones and gradients is representative of each type of outlet in a specific space and can be compared directly. During cooling, the slope of the gradient curve in the stratification zone for all outlets is nearly the same due to constant loading and construction. The same characteristic is shown for heating. In general, only the size of the stratification zone is changed by the type of outlet and application.
Results from air distribution studies show that the temperature gradient and size of the stratification zone were decreased by a decreased temperature differential and an increase in airflow rate or supply velocity. These conditions tend to reduce the buoyancy effects, and also result in an increased and more uniform room air motion.
In the example shown, the heating tests were conducted with about 0°F on two exposures. The cooling tests were conducted with about 100°F on two exposures. The loading during these tests was excessive compared to the wall and window R values of today. Thus the temperature gradients, stratification zones, and temperature differentials were greater than would be expected. However, these conditions permitted the general characteristics to be observed and compared between different configurations.
FIVE STEPS TO ANALYSISThe following are very important considerations to remember when selecting outlets and applications. They are best illustrated by following the step-by-step procedure in Figure 16, page B20.
STEP 1 - PRIMARY AIRPrimary air is the starting point when laying out or investigating the space room air motion. Primary air is defined as the mixture of air supplied to the outlet and induced room air within an envelope of velocities greater than 150 fpm. The primary pattern can be completely defined by high velocity isovels taken through two perpendicular planes. These show the number and angles of the jets in the primary airstream.
Maximum velocities in the primary air can be obtained analytically as shown in (Figure 7, page B13). Data obtained isothermally (no temperature difference between the supply and room air) down to a velocity of 150 fpm apply equally well for heating and cooling for most diffusers.
STEP 2 - TOTAL AIRTotal air is defined as the mixture of primary and room air (that portion of the air in a space not included in the primary and total air envelopes) which is under the influence of the outlet conditions. Normally, the total air has a relatively high velocity but it has no sharply defined lower limit. Even though the total air follows the general pattern indicated by the primary air, its spread and travel may not be in proportion to that of the primary air. Other factors such as ceiling height, obstructions, internal and external loads, may disturb the orderly course of the airstream.
The temperature difference between the total and room air produces a buoyancy effect. This causes cool total air to drop and warm total air to rise.The most complete mixing of total and room air occurs during isothermal conditions. Consequently, the location and type of outlet reduces the buoyancy effects and increases the travel of the total air during heating when cool air is induced and mixed rapidly with primary air. This also will occur during cooling when warm air is induced and mixed with primary air.
In addition to the outlet type and location, the action due to buoyancy effects is greatly dependent on the temperature differential between the supply air and the room air.
Table 5. Maximum cfm for Diffusers Based on Drop
Outlet TypeCeiling Height, Ft.
8 9 10 12 14 16
TMRA 550 1300 2200 4000 6200 9300
TMR 270 700 1300 2100 3300 5500
TMS 1100 1500 2000
PAS 650 1000 1500
TDC250 400 650 900 1400 1600
PSS
250*
160 250 400 600 800 1000LL2*
Modulinear*
LL1 320 500 800 1200 1600 2000
Isothermal Jets (continued)
B20
Rede
fine
your
com
fort
zone
™ |
ww
w.ti
tus-
hvac
.com
engineering guidelines
B
GRI
LLES
AN
D D
IFFU
SERS
Supply Outlet Classifications (continued)
Figure 16. Characteristic of Non-isothermal Supply Jets in a Space
Exposedwall
COOLING
STEP 1Primary air
Outlet
STEP 2Total air
Insidewall
HEATING
STEP 3Natural convection
currents andstratification zone
STEP 4Return intake
IntakeIntake
6'
4'
9' Ceiling
STEP 5Room air
Stratification
Stratification
Stratification
Stratification
Stratification
Stratification
Stratification
Stratification
Intake Intake
Temperature, °F+- 0
Temperature, °F+- 0
6'
4'
9' Ceiling
Height
Temperature SetpointAverage Room Vertical Temperatures
B21
Redefine your comfort zone™
| ww
w.titus-hvac.com
engineering guidelines
B
GRILLES AN
D D
IFFUSERS
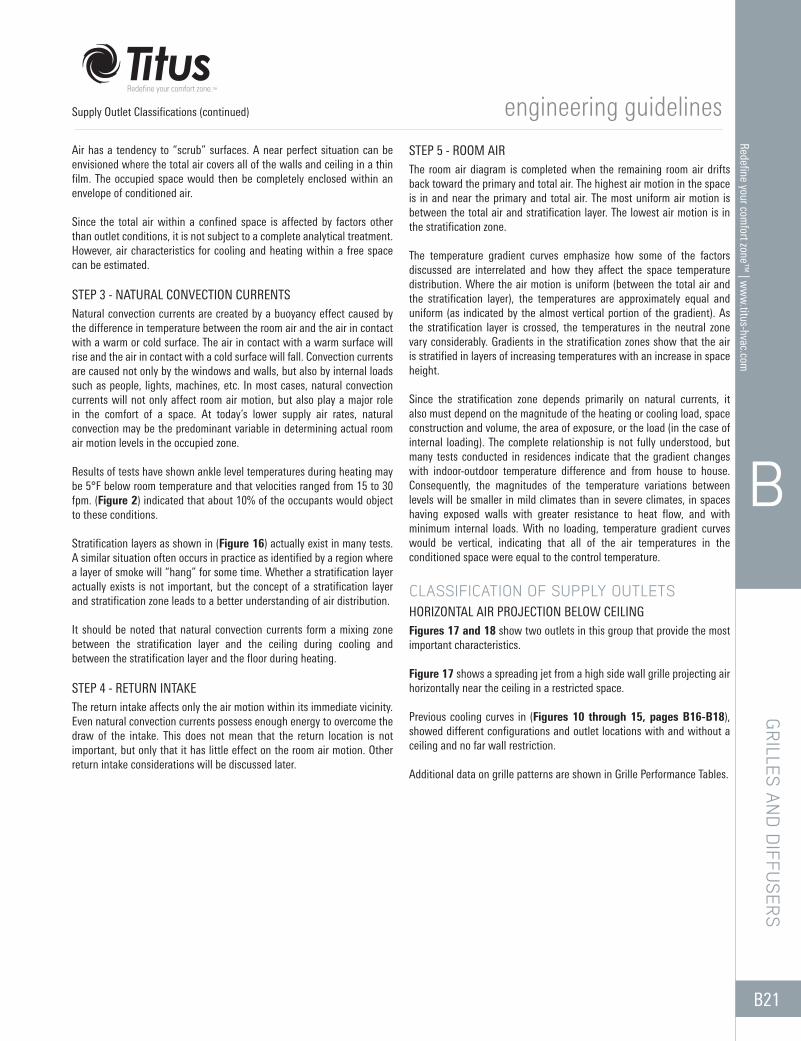
Air has a tendency to “scrub” surfaces. A near perfect situation can be envisioned where the total air covers all of the walls and ceiling in a thin film. The occupied space would then be completely enclosed within an envelope of conditioned air.
Since the total air within a confined space is affected by factors other than outlet conditions, it is not subject to a complete analytical treatment. However, air characteristics for cooling and heating within a free space can be estimated.
STEP 3 - NATURAL CONVECTION CURRENTSNatural convection currents are created by a buoyancy effect caused by the difference in temperature between the room air and the air in contact with a warm or cold surface. The air in contact with a warm surface will rise and the air in contact with a cold surface will fall. Convection currents are caused not only by the windows and walls, but also by internal loads such as people, lights, machines, etc. In most cases, natural convection currents will not only affect room air motion, but also play a major role in the comfort of a space. At today’s lower supply air rates, natural convection may be the predominant variable in determining actual room air motion levels in the occupied zone.
Results of tests have shown ankle level temperatures during heating may be 5°F below room temperature and that velocities ranged from 15 to 30 fpm. (Figure 2) indicated that about 10% of the occupants would object to these conditions.
Stratification layers as shown in (Figure 16) actually exist in many tests. A similar situation often occurs in practice as identified by a region where a layer of smoke will “hang” for some time. Whether a stratification layer actually exists is not important, but the concept of a stratification layer and stratification zone leads to a better understanding of air distribution.
It should be noted that natural convection currents form a mixing zone between the stratification layer and the ceiling during cooling and between the stratification layer and the floor during heating.
STEP 4 - RETURN INTAKEThe return intake affects only the air motion within its immediate vicinity. Even natural convection currents possess enough energy to overcome the draw of the intake. This does not mean that the return location is not important, but only that it has little effect on the room air motion. Other return intake considerations will be discussed later.
STEP 5 - ROOM AIRThe room air diagram is completed when the remaining room air drifts back toward the primary and total air. The highest air motion in the space is in and near the primary and total air. The most uniform air motion is between the total air and stratification layer. The lowest air motion is in the stratification zone.
The temperature gradient curves emphasize how some of the factors discussed are interrelated and how they affect the space temperature distribution. Where the air motion is uniform (between the total air and the stratification layer), the temperatures are approximately equal and uniform (as indicated by the almost vertical portion of the gradient). As the stratification layer is crossed, the temperatures in the neutral zone vary considerably. Gradients in the stratification zones show that the air is stratified in layers of increasing temperatures with an increase in space height.
Since the stratification zone depends primarily on natural currents, it also must depend on the magnitude of the heating or cooling load, space construction and volume, the area of exposure, or the load (in the case of internal loading). The complete relationship is not fully understood, but many tests conducted in residences indicate that the gradient changes with indoor-outdoor temperature difference and from house to house. Consequently, the magnitudes of the temperature variations between levels will be smaller in mild climates than in severe climates, in spaces having exposed walls with greater resistance to heat flow, and with minimum internal loads. With no loading, temperature gradient curves would be vertical, indicating that all of the air temperatures in the conditioned space were equal to the control temperature.
CLASSIFICATION OF SUPPLY OUTLETSHORIZONTAL AIR PROJECTION BELOW CEILINGFigures 17 and 18 show two outlets in this group that provide the most important characteristics.
Figure 17 shows a spreading jet from a high side wall grille projecting air horizontally near the ceiling in a restricted space.
Previous cooling curves in (Figures 10 through 15, pages B16-B18), showed different configurations and outlet locations with and without a ceiling and no far wall restriction.
Additional data on grille patterns are shown in Grille Performance Tables.
Supply Outlet Classifications (continued)

B22
Rede
fine
your
com
fort
zone
™ |
ww
w.ti
tus-
hvac
.com
engineering guidelines
B
GRI
LLES
AN
D D
IFFU
SERS
Figure 17. Spreading Horizontal Air Projection at the Ceiling Level
Total air will follow the wall down to floor level if its projection is sufficiently long. During heating, this will result in a smaller stratification zone and lower temperature differentials in the occupied zone. Room
air motion will not be excessive unless total air extends part way into the room at the floor. The two airstreams project into and down the exposed corners.
Figure 18. Circular Horizontal Air Projection at the Ceiling Level
Greater spread of this pattern results in more uniform space temperatures during cooling than with those obtained with the two-jet pattern shown previously.
The uniform temperatures from a circular pattern indicate that this pattern is most efficient for cooling in spaces such as open office areas. The slight overlap of the total air in the space helps generate very uniform
temperatures. The influence of the natural currents on the total air reduces horizontal and overlap projection at the window during cooling and increases overlap projection during heating.
Supply Outlet Classifications (continued)
A
A
Section A-A
Stratification
COOLING
HEATING
Section A-ATemperature, °F
+- 0
Temperature, °F+- 0
High side wallStratification Se
tpoi
ntSe
tpoi
ntPlan View
Side View
Stratification
A
A
Section A-A
COOLING
HEATING
Temperature,° F+- 0
Temperature, °F+- 0
CeilingPlan
Outlet
Stratification StratificationSetp
oint
S etp
oint
Plan View
Side View
Section A-A
B23
Redefine your comfort zone™
| ww
w.titus-hvac.com
engineering guidelines
B
GRILLES AN
D D
IFFUSERS
Supply Outlet Classifications (continued)
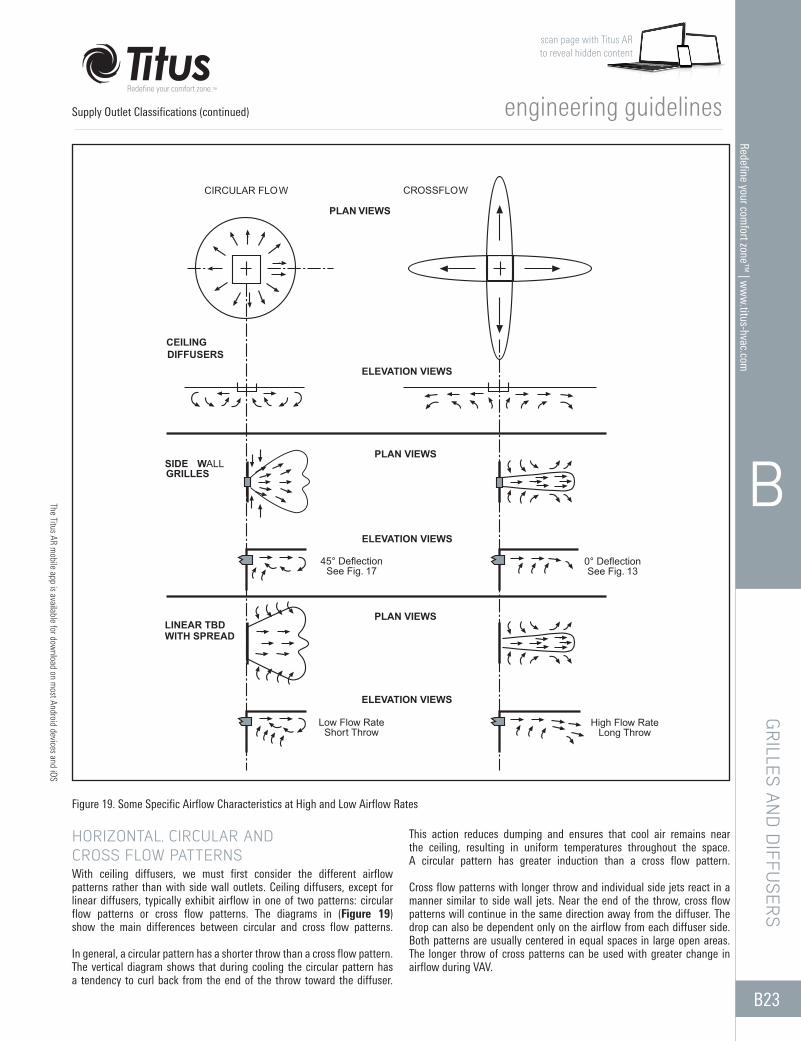
Figure 19. Some Specific Airflow Characteristics at High and Low Airflow Rates
HORIZONTAL, CIRCULAR AND CROSS FLOW PATTERNSWith ceiling diffusers, we must first consider the different airflow patterns rather than with side wall outlets. Ceiling diffusers, except for linear diffusers, typically exhibit airflow in one of two patterns: circular flow patterns or cross flow patterns. The diagrams in (Figure 19) show the main differences between circular and cross flow patterns.
In general, a circular pattern has a shorter throw than a cross flow pattern. The vertical diagram shows that during cooling the circular pattern has a tendency to curl back from the end of the throw toward the diffuser.
This action reduces dumping and ensures that cool air remains near the ceiling, resulting in uniform temperatures throughout the space. A circular pattern has greater induction than a cross flow pattern.
Cross flow patterns with longer throw and individual side jets react in a manner similar to side wall jets. Near the end of the throw, cross flow patterns will continue in the same direction away from the diffuser. The drop can also be dependent only on the airflow from each diffuser side. Both patterns are usually centered in equal spaces in large open areas. The longer throw of cross patterns can be used with greater change in airflow during VAV.
scan page with Titus AR to reveal hidden content
The Titus AR mobile app is available for dow
nload on most Android devices and iOS
CIRCULAR FLOW CROSSFLOW
PLAN VIEWS
PLAN VIEWS SIDE WALLGRILLES
45° DeflectionSee Fig. 17
0° DeflectionSee Fig. 13
PLAN VIEWS
ELEVATION VIEWS
LINEAR TBDWITH SPREAD
Low Flow RateShort Throw
High Flow RateLong Throw
CEILINGDIFFUSERS
ELEVATION VIEWS
ELEVATION VIEWS
B24
Rede
fine
your
com
fort
zone
™ |
ww
w.ti
tus-
hvac
.com
engineering guidelines
B
GRI
LLES
AN
D D
IFFU
SERS
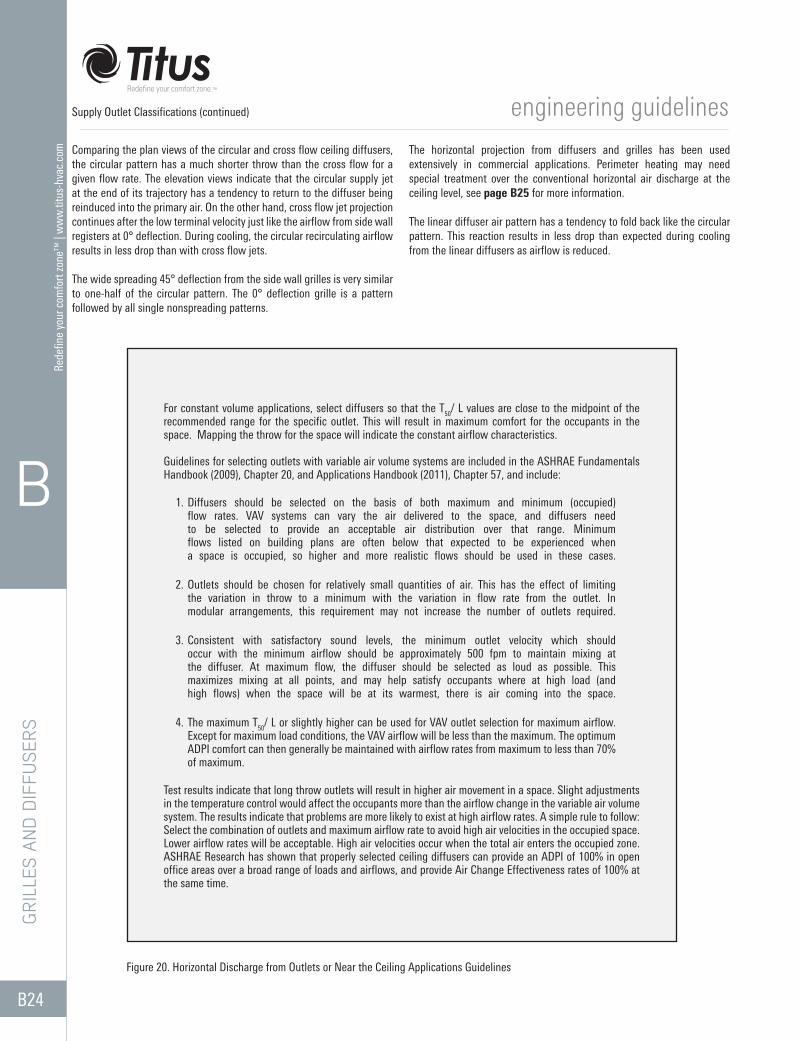
Comparing the plan views of the circular and cross flow ceiling diffusers, the circular pattern has a much shorter throw than the cross flow for a given flow rate. The elevation views indicate that the circular supply jet at the end of its trajectory has a tendency to return to the diffuser being reinduced into the primary air. On the other hand, cross flow jet projection continues after the low terminal velocity just like the airflow from side wall registers at 0° deflection. During cooling, the circular recirculating airflow results in less drop than with cross flow jets.
The wide spreading 45° deflection from the side wall grilles is very similar to one-half of the circular pattern. The 0° deflection grille is a pattern followed by all single nonspreading patterns.
The horizontal projection from diffusers and grilles has been used extensively in commercial applications. Perimeter heating may need special treatment over the conventional horizontal air discharge at the ceiling level, see page B25 for more information.
The linear diffuser air pattern has a tendency to fold back like the circular pattern. This reaction results in less drop than expected during cooling from the linear diffusers as airflow is reduced.
Figure 20. Horizontal Discharge from Outlets or Near the Ceiling Applications Guidelines
Supply Outlet Classifications (continued)
For constant volume applications, select diffusers so that the T50/ L values are close to the midpoint of the recommended range for the specific outlet. This will result in maximum comfort for the occupants in the space. Mapping the throw for the space will indicate the constant airflow characteristics.
Guidelines for selecting outlets with variable air volume systems are included in the ASHRAE Fundamentals Handbook (2009), Chapter 20, and Applications Handbook (2011), Chapter 57, and include:
1. Diffusers should be selected on the basis of both maximum and minimum (occupied) flow rates. VAV systems can vary the air delivered to the space, and diffusers need to be selected to provide an acceptable air distribution over that range. Minimum flows listed on building plans are often below that expected to be experienced when a space is occupied, so higher and more realistic flows should be used in these cases.
2. Outlets should be chosen for relatively small quantities of air. This has the effect of limiting the variation in throw to a minimum with the variation in flow rate from the outlet. In modular arrangements, this requirement may not increase the number of outlets required.
3. Consistent with satisfactory sound levels, the minimum outlet velocity which should occur with the minimum airflow should be approximately 500 fpm to maintain mixing at the diffuser. At maximum flow, the diffuser should be selected as loud as possible. This maximizes mixing at all points, and may help satisfy occupants where at high load (and high flows) when the space will be at its warmest, there is air coming into the space.
4. The maximum T50/ L or slightly higher can be used for VAV outlet selection for maximum airflow. Except for maximum load conditions, the VAV airflow will be less than the maximum. The optimum ADPI comfort can then generally be maintained with airflow rates from maximum to less than 70% of maximum.
Test results indicate that long throw outlets will result in higher air movement in a space. Slight adjustments in the temperature control would affect the occupants more than the airflow change in the variable air volume system. The results indicate that problems are more likely to exist at high airflow rates. A simple rule to follow: Select the combination of outlets and maximum airflow rate to avoid high air velocities in the occupied space. Lower airflow rates will be acceptable. High air velocities occur when the total air enters the occupied zone. ASHRAE Research has shown that properly selected ceiling diffusers can provide an ADPI of 100% in open office areas over a broad range of loads and airflows, and provide Air Change Effectiveness rates of 100% at the same time.
B25
Redefine your comfort zone™
| ww
w.titus-hvac.com
engineering guidelines
B
GRILLES AN
D D
IFFUSERS
Figure 22 indicates a laminar flow outlet. This type of an outlet is the opposite of the turbulent flow derived from a conventional mixing diffuser. Laminar flow implies lines of equal velocity moving in a single direction; in this case, a vertical direction. A laminar flow outlet must have relatively uniform velocities over the whole face of the outlet, usually at relatively low velocity. When this is accomplished, the airflow below the outlet produces uniform velocities to the outlet. Air is only induced at the ceiling level, and consequently the pattern is uniform for some distance below the ceiling with almost the same velocity. Usual concepts of throw do not apply in this case. Laminar flow does not produce the normal mixing noticed with standard diffusers. The “piston-like” delivery of primary air is usually directed over a work area, hospital operating room, parts assembly, or clean rooms. (See the TLF Critical Environment Diffusers.)
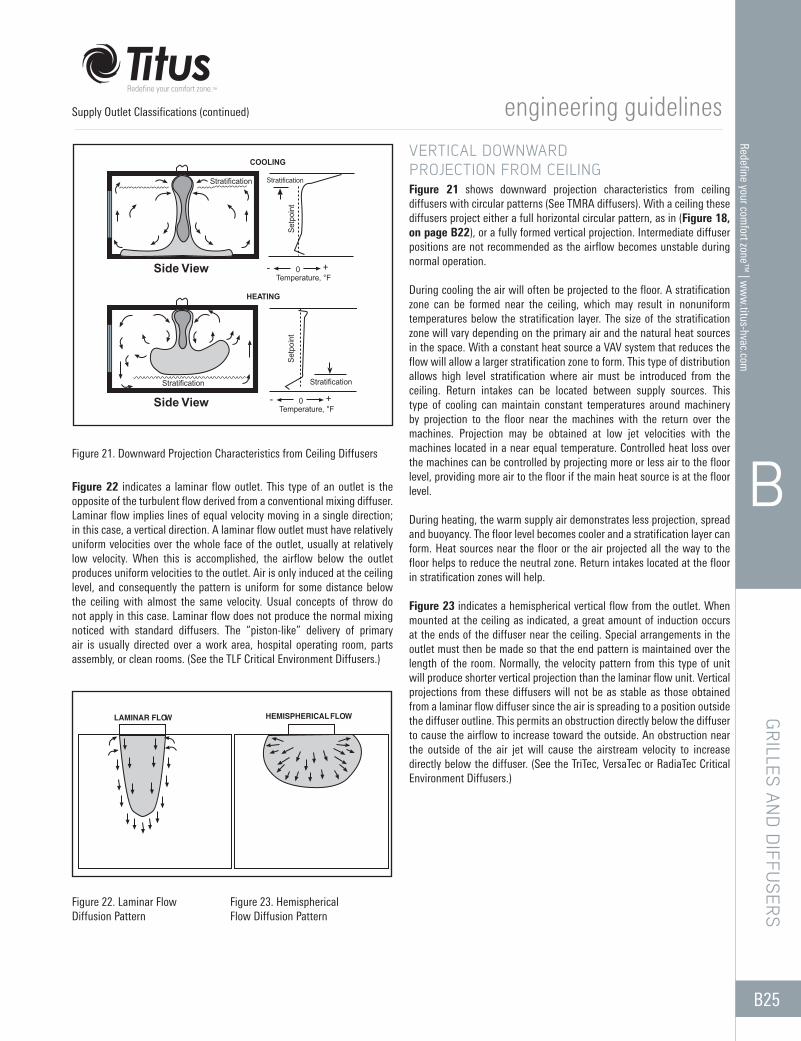
VERTICAL DOWNWARD PROJECTION FROM CEILINGFigure 21 shows downward projection characteristics from ceiling diffusers with circular patterns (See TMRA diffusers). With a ceiling these diffusers project either a full horizontal circular pattern, as in (Figure 18, on page B22), or a fully formed vertical projection. Intermediate diffuser positions are not recommended as the airflow becomes unstable during normal operation.
During cooling the air will often be projected to the floor. A stratification zone can be formed near the ceiling, which may result in nonuniform temperatures below the stratification layer. The size of the stratification zone will vary depending on the primary air and the natural heat sources in the space. With a constant heat source a VAV system that reduces the flow will allow a larger stratification zone to form. This type of distribution allows high level stratification where air must be introduced from the ceiling. Return intakes can be located between supply sources. This type of cooling can maintain constant temperatures around machinery by projection to the floor near the machines with the return over the machines. Projection may be obtained at low jet velocities with the machines located in a near equal temperature. Controlled heat loss over the machines can be controlled by projecting more or less air to the floor level, providing more air to the floor if the main heat source is at the floor level.
During heating, the warm supply air demonstrates less projection, spread and buoyancy. The floor level becomes cooler and a stratification layer can form. Heat sources near the floor or the air projected all the way to the floor helps to reduce the neutral zone. Return intakes located at the floor in stratification zones will help.
Figure 23 indicates a hemispherical vertical flow from the outlet. When mounted at the ceiling as indicated, a great amount of induction occurs at the ends of the diffuser near the ceiling. Special arrangements in the outlet must then be made so that the end pattern is maintained over the length of the room. Normally, the velocity pattern from this type of unit will produce shorter vertical projection than the laminar flow unit. Vertical projections from these diffusers will not be as stable as those obtained from a laminar flow diffuser since the air is spreading to a position outside the diffuser outline. This permits an obstruction directly below the diffuser to cause the airflow to increase toward the outside. An obstruction near the outside of the air jet will cause the airstream velocity to increase directly below the diffuser. (See the TriTec, VersaTec or RadiaTec Critical Environment Diffusers.)
Figure 21. Downward Projection Characteristics from Ceiling Diffusers
Figure 22. Laminar Flow Diffusion Pattern
Figure 23. Hemispherical Flow Diffusion Pattern
Supply Outlet Classifications (continued)
Setp
oint
COOLING
Setp
oint
HEATING
Stratification
Temperature, °F+- 0
Temperature, °F+- 0
Stratification
Stratification
Stratification
Side View
Side View
LAMINAR FLOW HEMISPHERICAL FLOW
B26
Rede
fine
your
com
fort
zone
™ |
ww
w.ti
tus-
hvac
.com
engineering guidelines
B
GRI
LLES
AN
D D
IFFU
SERS
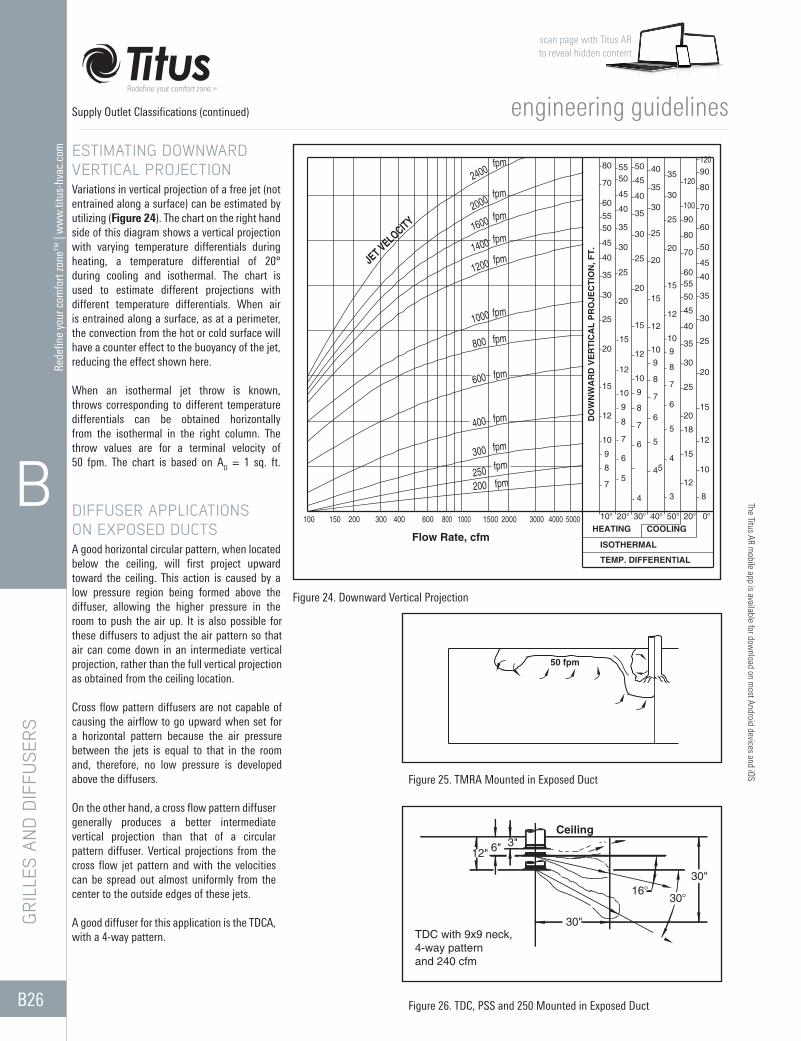
ESTIMATING DOWNWARD VERTICAL PROJECTIONVariations in vertical projection of a free jet (not entrained along a surface) can be estimated by utilizing (Figure 24). The chart on the right hand side of this diagram shows a vertical projection with varying temperature differentials during heating, a temperature differential of 20° during cooling and isothermal. The chart is used to estimate different projections with different temperature differentials. When air is entrained along a surface, as at a perimeter, the convection from the hot or cold surface will have a counter effect to the buoyancy of the jet, reducing the effect shown here.
When an isothermal jet throw is known, throws corresponding to different temperature differentials can be obtained horizontally from the isothermal in the right column. The throw values are for a terminal velocity of 50 fpm. The chart is based on AD = 1 sq. ft.
DIFFUSER APPLICATIONS ON EXPOSED DUCTSA good horizontal circular pattern, when located below the ceiling, will first project upward toward the ceiling. This action is caused by a low pressure region being formed above the diffuser, allowing the higher pressure in the room to push the air up. It is also possible for these diffusers to adjust the air pattern so that air can come down in an intermediate vertical projection, rather than the full vertical projection as obtained from the ceiling location.
Cross flow pattern diffusers are not capable of causing the airflow to go upward when set for a horizontal pattern because the air pressure between the jets is equal to that in the room and, therefore, no low pressure is developed above the diffusers.
On the other hand, a cross flow pattern diffuser generally produces a better intermediate vertical projection than that of a circular pattern diffuser. Vertical projections from the cross flow jet pattern and with the velocities can be spread out almost uniformly from the center to the outside edges of these jets.
A good diffuser for this application is the TDCA, with a 4-way pattern.
Figure 24. Downward Vertical Projection
Figure 25. TMRA Mounted in Exposed Duct
Figure 26. TDC, PSS and 250 Mounted in Exposed Duct
Supply Outlet Classifications (continued)
scan page with Titus AR to reveal hidden content
The Titus AR mobile app is available for dow
nload on most Android devices and iOS
2400
2000
1600
1400
1200
1000
800
600
400
300
250200
150100 200
Flow Rate, cfm
300 400 800600 1000
JET VELOCITY
48 5 10
0°30002000
fpm
1500 4000 5000COOLING
TEMP. DIFFERENTIAL
ISOTHERMAL
HEATING20°10°
7
30°
5
4
40° 50°
3
20°
12
8
12090
80
70
60
50
45
40
35
30
25
20
15
12
55 40
DO
WN
WA
RD
VE
RTI
CA
L P
RO
JEC
TIO
N, F
T.
25
10 9
10
9
12
6
7 6
8
9
7
8
15
20 12
1210
15
15
55
4
6
76
18
15
20
8
9
7
8
10
12109
30
25
40
35
45 30
25
2030
40
3520
25
50
45
40
355550
70
60
30
35
40
45
15
12
15
2020
5550
45
70
60
30
25
25
3530
35
100
90
80
120
80 50
fpm
fpm
fpm
fpm
fpm
fpm
fpm
fpm
fpm
fpm
fpm
50 fpm
30"
6"12"
30"
3"Ceiling
16°30°
TDC with 9x9 neck,4-way patternand 240 cfm
B27
Redefine your comfort zone™
| ww
w.titus-hvac.com
engineering guidelines
B
GRILLES AN
D D
IFFUSERS
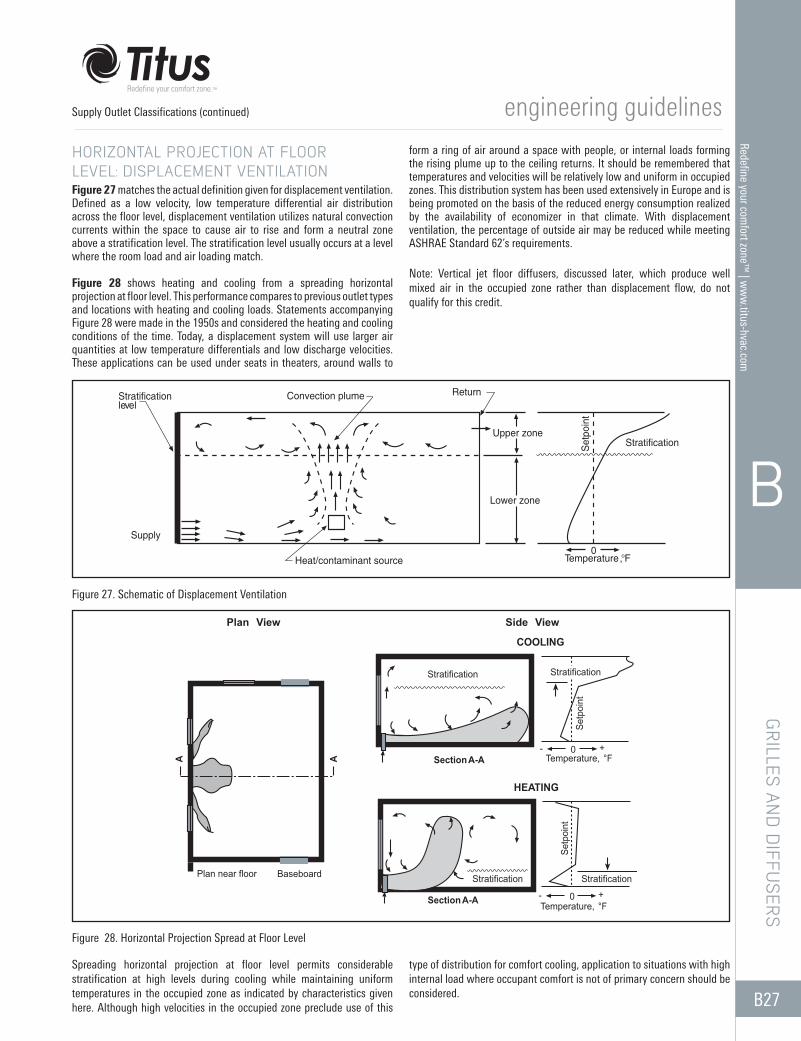
HORIZONTAL PROJECTION AT FLOOR LEVEL: DISPLACEMENT VENTILATIONFigure 27 matches the actual definition given for displacement ventilation. Defined as a low velocity, low temperature differential air distribution across the floor level, displacement ventilation utilizes natural convection currents within the space to cause air to rise and form a neutral zone above a stratification level. The stratification level usually occurs at a level where the room load and air loading match.
Figure 28 shows heating and cooling from a spreading horizontal projection at floor level. This performance compares to previous outlet types and locations with heating and cooling loads. Statements accompanying Figure 28 were made in the 1950s and considered the heating and cooling conditions of the time. Today, a displacement system will use larger air quantities at low temperature differentials and low discharge velocities. These applications can be used under seats in theaters, around walls to
form a ring of air around a space with people, or internal loads forming the rising plume up to the ceiling returns. It should be remembered that temperatures and velocities will be relatively low and uniform in occupied zones. This distribution system has been used extensively in Europe and is being promoted on the basis of the reduced energy consumption realized by the availability of economizer in that climate. With displacement ventilation, the percentage of outside air may be reduced while meeting ASHRAE Standard 62’s requirements.
Note: Vertical jet floor diffusers, discussed later, which produce well mixed air in the occupied zone rather than displacement flow, do not qualify for this credit.
Figure 28. Horizontal Projection Spread at Floor Level
Spreading horizontal projection at floor level permits considerable stratification at high levels during cooling while maintaining uniform temperatures in the occupied zone as indicated by characteristics given here. Although high velocities in the occupied zone preclude use of this
type of distribution for comfort cooling, application to situations with high internal load where occupant comfort is not of primary concern should be considered.
Figure 27. Schematic of Displacement Ventilation
Supply Outlet Classifications (continued)
Section A-A
Setp
oint
COOLING
Setp
oint
HEATING
Section A-A +- 0
Temperature, °F
Temperature, °F
+- 0
BaseboardPlan near floor
A A
StratificationStratification
StratificationStratification
Side ViewPlan View
Stratificationlevel
Upper zone
Convection plume Return
Lower zone
Heat/contaminant source Temperature, °F
StratificationSet
poin
t
Supply0
B28
Rede
fine
your
com
fort
zone
™ |
ww
w.ti
tus-
hvac
.com
engineering guidelines
B
GRI
LLES
AN
D D
IFFU
SERS
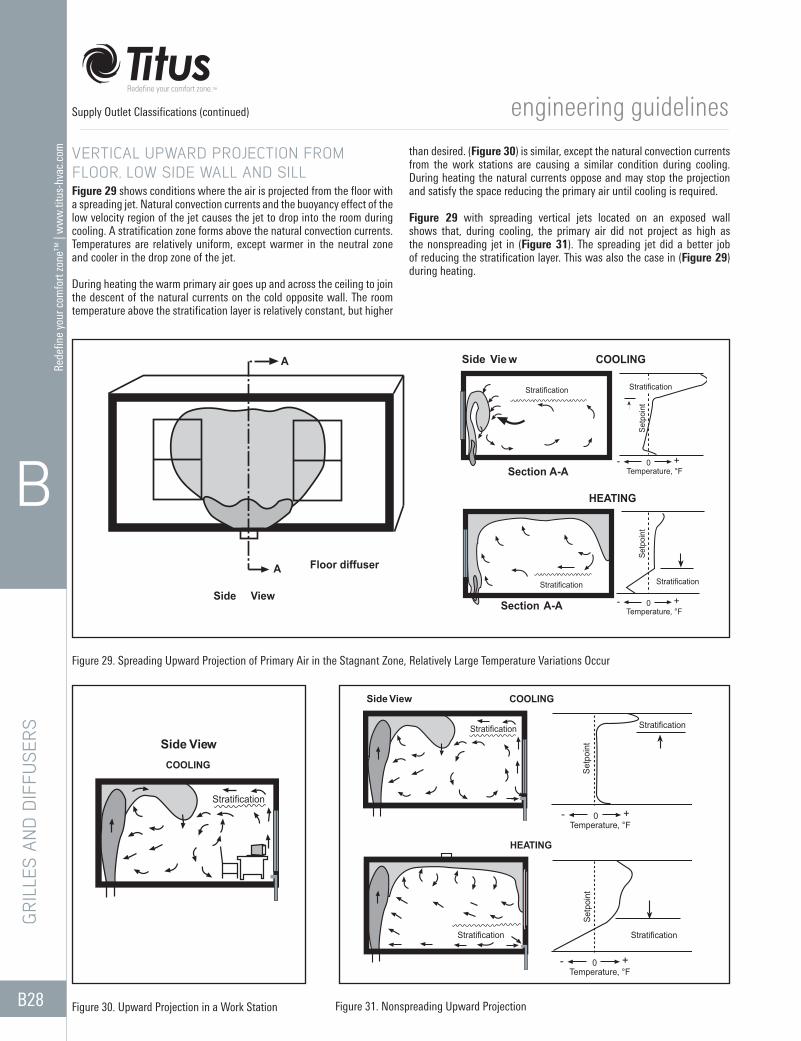
Figure 29. Spreading Upward Projection of Primary Air in the Stagnant Zone, Relatively Large Temperature Variations Occur
VERTICAL UPWARD PROJECTION FROM FLOOR, LOW SIDE WALL AND SILLFigure 29 shows conditions where the air is projected from the floor with a spreading jet. Natural convection currents and the buoyancy effect of the low velocity region of the jet causes the jet to drop into the room during cooling. A stratification zone forms above the natural convection currents. Temperatures are relatively uniform, except warmer in the neutral zone and cooler in the drop zone of the jet.
During heating the warm primary air goes up and across the ceiling to join the descent of the natural currents on the cold opposite wall. The room temperature above the stratification layer is relatively constant, but higher
than desired. (Figure 30) is similar, except the natural convection currents from the work stations are causing a similar condition during cooling. During heating the natural currents oppose and may stop the projection and satisfy the space reducing the primary air until cooling is required.
Figure 29 with spreading vertical jets located on an exposed wall shows that, during cooling, the primary air did not project as high as the nonspreading jet in (Figure 31). The spreading jet did a better job of reducing the stratification layer. This was also the case in (Figure 29) during heating.
Figure 30. Upward Projection in a Work Station Figure 31. Nonspreading Upward Projection
Supply Outlet Classifications (continued)
A
Floor diffuser
Side View
Section A-A
COOLING
Setp
oint
HEATING
Section A-A Temperature, °F+- 0
Temperature, °F+- 0
Side Vie w
Setp
oint
StratificationStratification
StratificationStratification
A
Stratification
COOLING
Side View
Temperature, °F+- 0
Stratification
Temperature, °F+- 0
Setp
oint
Setp
oint
COOLING
HEATING
Stratification
Stratification Stratification
Side View
B29
Redefine your comfort zone™
| ww
w.titus-hvac.com
engineering guidelines
B
GRILLES AN
D D
IFFUSERS
When using floor or low level air distribution at the perimeter, stratification from the floor can be controlled by correctly applying the 150 fpm isothermal throw data. Complete stratification across the room can occur as shown in (Figure 29, page B28), where the spreading jets do not project to the ceiling. The stratification can be minimized by controlling the jet velocities and jet patterns. The vertical jet should be projected upwards to a terminal velocity of over 150 fpm above the occupied zone. For example, if a vertical throw is only 6 ft. to a terminal velocity of 150 fpm, stratification will occur above that level.
The examples discussed above apply equally as well for outlets located in window sills, low side wall outlets projecting air up a wall, floor outlets near a wall or in the open, baseboard outlets, etc.
Underfloor diffuser applications are being introduced into access floor facilities. These are primarily cooling and ventilation applications, and the jets are seldom attached to a surface as shown in (Figures 29 and 30, page B26). Instead, the diffuser is designed to have rapid induction and have throws which seldom exceed 5 or 6 ft. The temperature differential is usually less than 20°F between the occupied zone and discharge used with a ceiling application. The return air temperature near the ceiling is 5°F or more, warmer than the room, and the resultant supply-exhaust Dt is again 20°F. When selected properly, floor diffusers directed upward as a free jet can result in well-mixed, uniform temperature zones from the floor to 6 ft. high, with a stratified region above.
Underfloor air distribution is being proposed as a better way to satisfy indoor air quality and comfort. Work stations and task distribution can be considered also in this category. Clean ventilation air is distributed to the occupied spaces and contaminated air can be exhausted from the stratification zone overhead. The rules for proper ventilation and air diffusion are being investigated at this time to determine optimum configurations.
ASHRAE has sponsored several tests with floor based diffusers used in this manner, and again, high levels of air distribution, comfort and Air Change Effectiveness (ACE) were observed.
Note: The observed ACE from these tests was the same as properly designed ceiling systems, near a level of 1.0, or 100% mixing.
PERIMETER APPLICATIONSIn perimeter applications, concerns focus mainly on heating. However, it is also well understood that the air conditioning system must handle both heating and cooling. The heating concern is shown dramatically as the previous diagrams of the various classifications of outlets are reviewed. The floor level and low level distribution classification diagrams show that both heating and cooling the perimeter can be handled best from these locations. Economic reasons, however, favor heating and cooling from overhead.
Each heating diagram shows low floor level temperatures with neutral zones of varying sizes from the floor up to some higher level.
Especially bad conditions are shown for overhead heating. Because this is a major concern, emphasis is placed on ceiling distribution in this section.
Several main approaches have been utilized for the ceiling heating and cooling distribution.
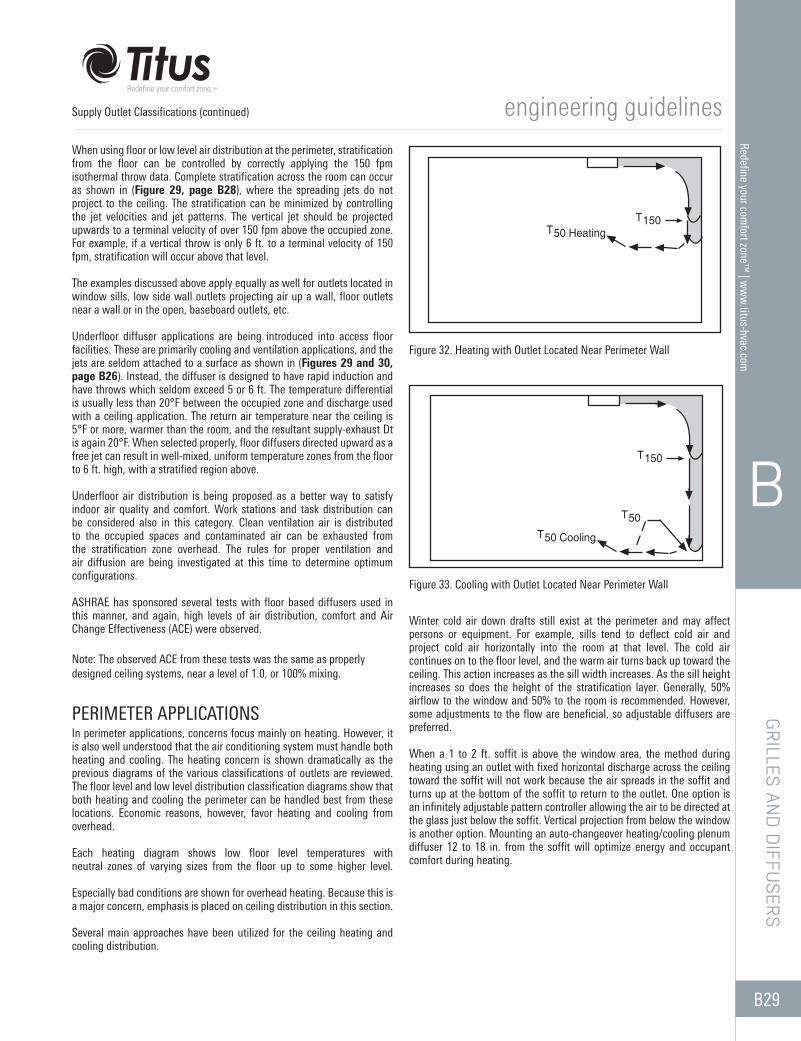
Winter cold air down drafts still exist at the perimeter and may affect persons or equipment. For example, sills tend to deflect cold air and project cold air horizontally into the room at that level. The cold air continues on to the floor level, and the warm air turns back up toward the ceiling. This action increases as the sill width increases. As the sill height increases so does the height of the stratification layer. Generally, 50% airflow to the window and 50% to the room is recommended. However, some adjustments to the flow are beneficial, so adjustable diffusers are preferred.
When a 1 to 2 ft. soffit is above the window area, the method during heating using an outlet with fixed horizontal discharge across the ceiling toward the soffit will not work because the air spreads in the soffit and turns up at the bottom of the soffit to return to the outlet. One option is an infinitely adjustable pattern controller allowing the air to be directed at the glass just below the soffit. Vertical projection from below the window is another option. Mounting an auto-changeover heating/cooling plenum diffuser 12 to 18 in. from the soffit will optimize energy and occupant comfort during heating.
Figure 32. Heating with Outlet Located Near Perimeter Wall
Figure 33. Cooling with Outlet Located Near Perimeter Wall
Supply Outlet Classifications (continued)
T50 HeatingT150
T50 Cooling
T50
T150
B30
Rede
fine
your
com
fort
zone
™ |
ww
w.ti
tus-
hvac
.com
engineering guidelines
B
GRI
LLES
AN
D D
IFFU
SERS
OUTLET LOCATED BACK FROM PERIMETER WALLIn (Figures 32 and 33, page B29), the outlet is located one to three feet back from the wall and directs a horizontal airstream directly into the wall. In this case it is designed to give isothermal throws as shown in the dark sections with T150 being several feet down from the ceiling and T50 near the floor level. The main result of this approach is to have the airstream hit the wall with enough velocity that it will spread on the wall to complete its projection.
During heating (Figure 32), the T50 may, in some cases, break away and result in the warm airstream rising away from the wall. During cooling (Figure 33) the T50 may exceed the isothermal distance. The higher terminal velocities will be spread all along the wall base. Lesser velocities in the space during cooling are an advantage of this method and the turn-up point of the air during heating will usually be at a lower point.
OUTLET VERTICAL PROJECTION AT A WINDOWOutlet vertical projection at a window is usually achieved using a linear diffuser, (Figure 34). In some cases the outlet is directed at a horizontal or angled deflection toward the wall. Long linears do not project warm air down as far as short linear sections. Double projection can then be controlled by a split pattern on a four foot unit with two feet into room and two feet to the wall. The initial projection based on isothermal T150 should be to about the four foot level. A coarse rule of thumb for the combined effect of glass induced convection currents and air projected down a glass wall is that throw is modified by approximately 1% per degree Dt; cold air T50 throw is increased, heating air T50 throw is decreased.
ROLLING A ROOMThe two previous applications emphasized some vertical projection at the perimeter wall. When “rolling the room”, air is distributed away from the exposed wall as shown in (Figure 35).
This method is only applicable for closed perimeter offices. The office walls are necessary to turn the air down to the floor and back across the floor towards the exposed wall.
The most effective air pattern is shown in the plan view where the diffuser (usually a linear) has spreading airstreams. In some cases a vertical airstream can be added to aid in overcoming the window losses such as can be obtained with the N-1-DR plenum slots diffuser, for example. The end airstream’s trajectory is best when projected just inside the opposite wall.
With the N-1-D diffuser, the two horizontal jets separate, with the two parts going toward the center of the room, and project down to the floor and return across the floor toward the outlet. The other split jets turn to and spread on the side walls with air on the walls returning to the supply outlet. A high airflow and supply outlets are necessary for this to be effective. Note in (Figure 35) that the rolling air may not return to the bottom of the window. With too low an airflow rate, or too high a Dt, the rolling air path can start rising at the center of the room. The design T50 should be nearly 1½ times the length of the room plus ceiling height.
SOME PERIMETER CONSIDERATIONSThe ASHRAE Handbook Fundamentals recommends that temperature differentials between heated primary air and room air should not exceed 15 - 20°F so buoyancy effects are minimized. This is a problem with many types of rooftop units specifically gas fired ones - and high airflows are required here to prevent stratification. The result with these systems is that heating is cycled and stratification is broken up.
Another approach is to use a split system with a minimum constant volume of air to satisfy the perimeter windows or walls. A variable volume type system with a regular diffuser handles the additional cooling. The split system results in a more satisfactory comfort level for both cooling and heating. It can be used in a closed office or open plan arrangement.
Figure 34. Vertical Projection of Heating and Cold Air at Window
Figure 35. Rolling a Room
Perimeter Applications (continued)
T150
COOLINGA
T50
150T
B HEATING
50 fpm
Side View
Plan View

B31
Redefine your comfort zone™
| ww
w.titus-hvac.com
engineering guidelines
B
GRILLES AN
D D
IFFUSERS
ADPI is a method of relating the space conditions of local traverse temperatures and velocities in the occupied zone to occupants’ thermal comfort. It is a one number comfort index for a space and relates comfort level similar to the way NC relates local conditions of sound to the occupants’ noise level comfort.
Temperatures given in (Figure 36) represent the difference between local temperature tx and control temperatures tc, Dtx = (tx - tc). Local velocities, Vx are given in fpm. Local effective draft temperatures, ∅, are then defined by:
Equation 8: Effective draft temperature
∅ = (tx - tc) - 0.07 (Vx - 30)
where: ∅ = effective temperature tx = local air temperatures, °F tc = ambient temperature (average room temperature or control temperature, °F) Vx = local air velocity, fpm
ADPI is then the percentage of traverse points satisfying an Effective Draft Temperature between -3 and +2 at a velocity less than 70 fpm.
Figure 36. Horizontal Projection Spread at Floor Level
Test conditions: room, unit, and other factors • The unit tested was a 6 x 24” louvered face ceiling diffuser,
two-way blow, handling 300 cfm with a jet velocity of 700 fpm located in the center of the room
• Temperature and velocity traverses were taken in the 4, 30, 60 and 78” levels of an 18 x 14 x 8.5-foot high test room
• The throw to a terminal velocity of 50 fpm was about 15 feet• Other conditions: control temperature of 76.2BF, supply air
temperature of 63.30BF, cooling load of 15.6 Btuh/sq. ft, t50 throw was 15 feet Dt = 13B. When ∅ is calculated at every point, 93 percent of the points meet the ADPI criteria.
AIR DIFFUSION PERFORMANCE INDEX
1.0 1.3 1.964 6656623130
1.01.1
.1
.7
36
52
25
33
31
22
.7
.1
–.2
.1
.5
.1
–.1
–.4
.1
–.2
–.1
–.1
–.4
.4
0.0
–.2
–.4
–1.8
1.0
1.3
.4
.2
–.2
1.0
.6
.6
.4
1.8
1.07355126445342
2825272025
2026262231
2225232525
2723262824
1234567
A
B
C
D
E
F
6' 6" Height
133/4'
18'
T50/L = 2 ADPI = 93
Data at6' 6" HighPoint B,6
Tx - Tcfpm
–.1 –.9 –1.5.5
1.3
1.0
25
33
21
23
.1 .9 1.631 63 5842762731
.3.6
X X X
X
X X X
0.0
.1
39
27
23
33
32
29
23
17
.4
–.1
–.2
0.0
.1
.2
–.1
–1.5
0.0
.1
–.2
–.1
–1.5
–.3
0.0
–.4
–.4
–.9
.5
8.6
.1
.1
–.7
.6
.6
.5
–.1
.8
1.4
.4907649555742
2521242436
2323182737
2225272526
3128292727
1234567
A
B
C
D
E
F
5' Height
XX
–.4 –.6 –.8 –.3
1.4
31
••
••
••
•
•
•
•
.2 1.4 .429 33
.4.8
X X X X
Ð.4
0.0
26
26
34
30
33
37
25
20
–.5
–.8
–.3
–.4
–.1
–.3
.1
–.8
–.2
–.3
.1
–.8
–.2
–.2
.1
–.9
–.1
.4
.1
.4
–.8
.1
.2
.4
–.3
.3
.4
.4303030303030
4126283645
1617181938
2521201937
1234567
A
B
C
D
E
F
2.5' Height
X
–.1 .2
2718232540
8560492736X X
.5
–.1 –.3 –.9.6
39
•
• • • •
••
.4 .9 1.925 34 4044404127
1.5.8
–.8
0
25
36
25
37
32
35
25
–.9
.9
–.7
0
.1
–.5
–.4
–.7
.1
0
–.4
–.4
–.7
–.2
–.4
–.8
–1.1
–1.1
.1
0
–.3
–.5
–.5
.4
–.3
–.5
.4
.6
.1
24546 50 565440
4149423728
2633333241
2525252525
1234567
A
B
C
D
E
F
4" Height
252525252525
X X X
X X
.4.6.6.6
25
0
•
•
A – F = Room Width Test Points1 – 7 = Room Length Test Points
Downward Moving AirUpward Moving AirHorizontal Moving Air Direction
X
•
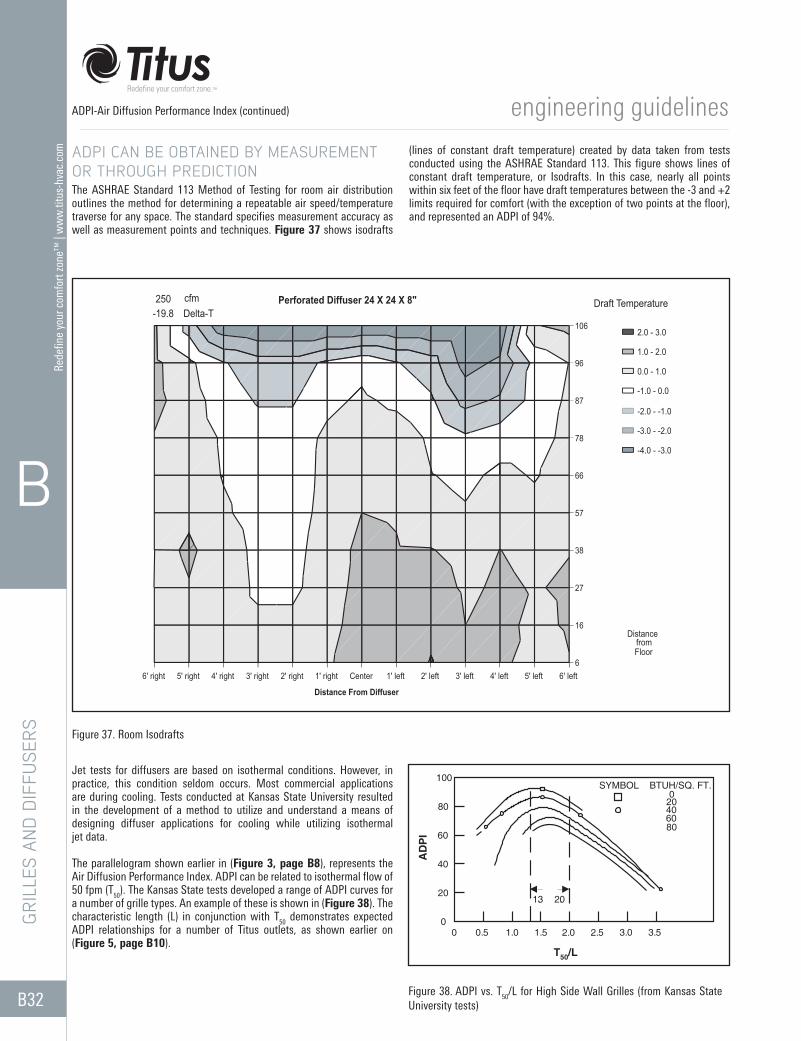
B32
Rede
fine
your
com
fort
zone
™ |
ww
w.ti
tus-
hvac
.com
engineering guidelines
B
GRI
LLES
AN
D D
IFFU
SERS
ADPI CAN BE OBTAINED BY MEASUREMENT OR THROUGH PREDICTIONThe ASHRAE Standard 113 Method of Testing for room air distribution outlines the method for determining a repeatable air speed/temperature traverse for any space. The standard specifies measurement accuracy as well as measurement points and techniques. Figure 37 shows isodrafts
(lines of constant draft temperature) created by data taken from tests conducted using the ASHRAE Standard 113. This figure shows lines of constant draft temperature, or Isodrafts. In this case, nearly all points within six feet of the floor have draft temperatures between the -3 and +2 limits required for comfort (with the exception of two points at the floor), and represented an ADPI of 94%.
Figure 37. Room Isodrafts
Jet tests for diffusers are based on isothermal conditions. However, in practice, this condition seldom occurs. Most commercial applications are during cooling. Tests conducted at Kansas State University resulted in the development of a method to utilize and understand a means of designing diffuser applications for cooling while utilizing isothermal jet data.
The parallelogram shown earlier in (Figure 3, page B8), represents the Air Diffusion Performance Index. ADPI can be related to isothermal flow of 50 fpm (T50). The Kansas State tests developed a range of ADPI curves for a number of grille types. An example of these is shown in (Figure 38). The characteristic length (L) in conjunction with T50 demonstrates expected ADPI relationships for a number of Titus outlets, as shown earlier on (Figure 5, page B10).
Figure 38. ADPI vs. T50/L for High Side Wall Grilles (from Kansas State University tests)
ADPI-Air Diffusion Performance Index (continued)
6' left5' left4' left3' left2' left1' leftCenter1' right2' right3' right4' right5' right6' right
106
96
87
78
66
57
38
27
16
6
Distance From Diffuser
Distance from Floor
Perforated Diffuser 24 X 24 X 8"
2.0 - 3.0
1.0 - 2.0
0.0 - 1.0
-1.0 - 0.0
-2.0 - -1.0
-3.0 - -2.0
-4.0 - -3.0
-19.8250 cfm
Delta-TDraft Temperature
1.0
60
00
AD
PI
20
40
0.5
80
100
1.5 2.0
1.3 2.0
2.5 3.0 3.5
SYMBOL BTUH/SQ. FT.
6080
2040
0
T50/L
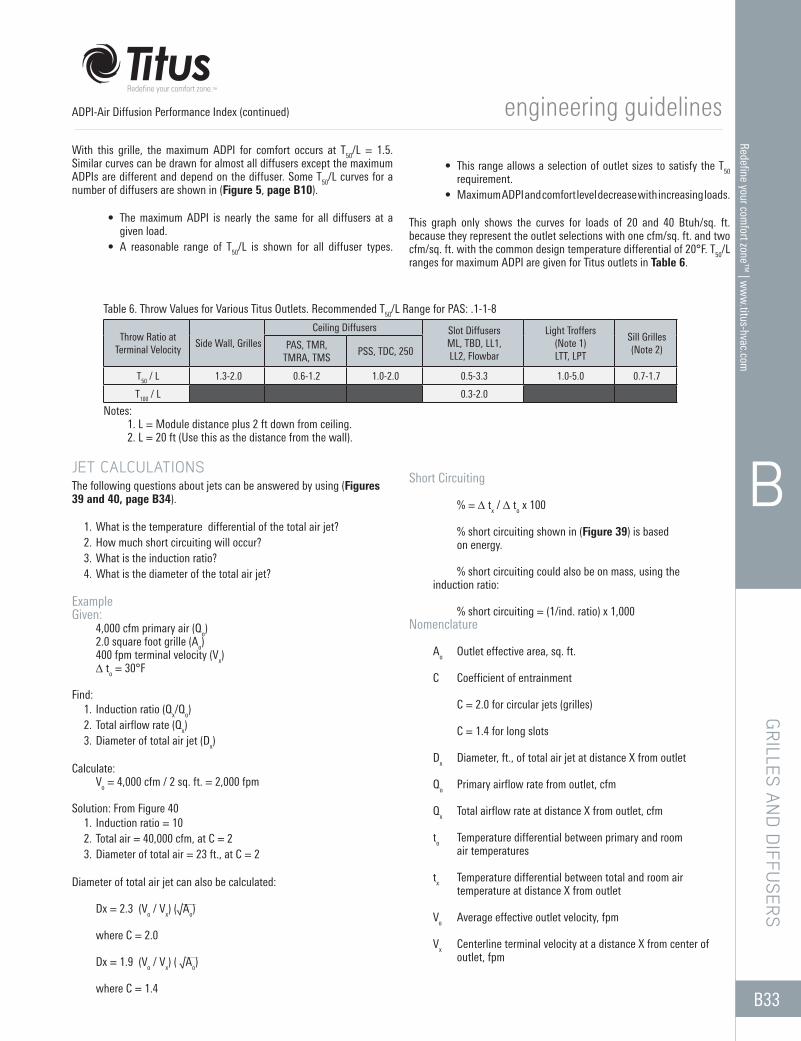
B33
Redefine your comfort zone™
| ww
w.titus-hvac.com
engineering guidelines
B
GRILLES AN
D D
IFFUSERS
With this grille, the maximum ADPI for comfort occurs at T50/L = 1.5. Similar curves can be drawn for almost all diffusers except the maximum ADPIs are different and depend on the diffuser. Some T50/L curves for a number of diffusers are shown in (Figure 5, page B10).
• The maximum ADPI is nearly the same for all diffusers at a given load.
• A reasonable range of T50/L is shown for all diffuser types.
• This range allows a selection of outlet sizes to satisfy the T50 requirement.
• Maximum ADPI and comfort level decrease with increasing loads.
This graph only shows the curves for loads of 20 and 40 Btuh/sq. ft. because they represent the outlet selections with one cfm/sq. ft. and two cfm/sq. ft. with the common design temperature differential of 20°F. T50/L ranges for maximum ADPI are given for Titus outlets in Table 6.
Table 6. Throw Values for Various Titus Outlets. Recommended T50/L Range for PAS: .1-1-8
Throw Ratio at Terminal Velocity
Side Wall, Grilles
Ceiling Diffusers Slot Diffusers ML, TBD, LL1, LL2, Flowbar
Light Troffers (Note 1)LTT, LPT
Sill Grilles(Note 2)PAS, TMR,
TMRA, TMSPSS, TDC, 250
T50 / L 1.3-2.0 0.6-1.2 1.0-2.0 0.5-3.3 1.0-5.0 0.7-1.7
T100 / L 0.3-2.0
Notes: 1. L = Module distance plus 2 ft down from ceiling. 2. L = 20 ft (Use this as the distance from the wall).
JET CALCULATIONSThe following questions about jets can be answered by using (Figures 39 and 40, page B34).
1. What is the temperature differential of the total air jet?2. How much short circuiting will occur?3. What is the induction ratio?4. What is the diameter of the total air jet?
ExampleGiven: 4,000 cfm primary air (Qo) 2.0 square foot grille (Ao) 400 fpm terminal velocity (Vx) D to = 30°F
Find: 1. Induction ratio (Qx/Qo)2. Total airflow rate (Qx)3. Diameter of total air jet (Dx)
Calculate: Vo = 4,000 cfm / 2 sq. ft. = 2,000 fpm
Solution: From Figure 401. Induction ratio = 102. Total air = 40,000 cfm, at C = 23. Diameter of total air = 23 ft., at C = 2
Diameter of total air jet can also be calculated: Dx = 2.3 (Vo / Vx) (√Ao) where C = 2.0 Dx = 1.9 (Vo / Vx) ( √Ao) where C = 1.4
Short Circuiting
% = D tx / D to x 100
% short circuiting shown in (Figure 39) is based on energy.
% short circuiting could also be on mass, using the induction ratio:
% short circuiting = (1/ind. ratio) x 1,000 Nomenclature Ao Outlet effective area, sq. ft. C Coefficient of entrainment C = 2.0 for circular jets (grilles) C = 1.4 for long slots Dx Diameter, ft., of total air jet at distance X from outlet Qo Primary airflow rate from outlet, cfm Qx Total airflow rate at distance X from outlet, cfm to Temperature differential between primary and room air temperatures tx Temperature differential between total and room air temperature at distance X from outlet Vo Average effective outlet velocity, fpm Vx Centerline terminal velocity at a distance X from center of outlet, fpm
ADPI-Air Diffusion Performance Index (continued)
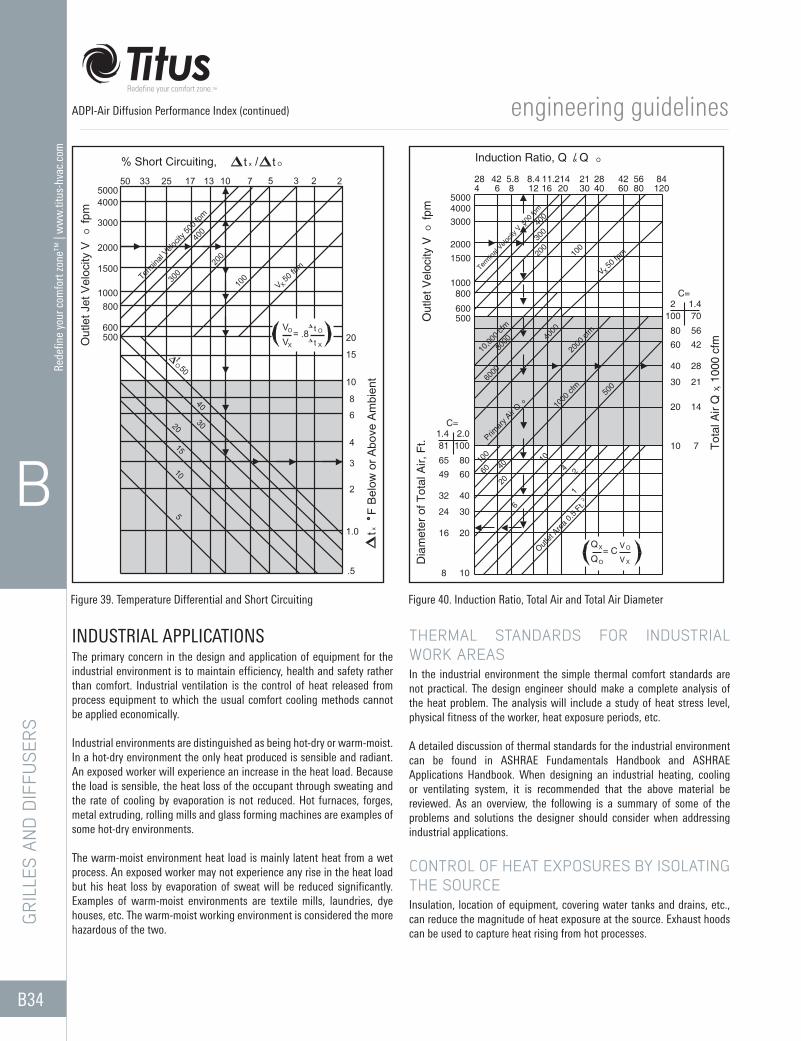
B34
Rede
fine
your
com
fort
zone
™ |
ww
w.ti
tus-
hvac
.com
engineering guidelines
B
GRI
LLES
AN
D D
IFFU
SERS
INDUSTRIAL APPLICATIONSThe primary concern in the design and application of equipment for the industrial environment is to maintain efficiency, health and safety rather than comfort. Industrial ventilation is the control of heat released from process equipment to which the usual comfort cooling methods cannot be applied economically.
Industrial environments are distinguished as being hot-dry or warm-moist. In a hot-dry environment the only heat produced is sensible and radiant. An exposed worker will experience an increase in the heat load. Because the load is sensible, the heat loss of the occupant through sweating and the rate of cooling by evaporation is not reduced. Hot furnaces, forges, metal extruding, rolling mills and glass forming machines are examples of some hot-dry environments.
The warm-moist environment heat load is mainly latent heat from a wet process. An exposed worker may not experience any rise in the heat load but his heat loss by evaporation of sweat will be reduced significantly. Examples of warm-moist environments are textile mills, laundries, dye houses, etc. The warm-moist working environment is considered the more hazardous of the two.
THERMAL STANDARDS FOR INDUSTRIAL WORK AREASIn the industrial environment the simple thermal comfort standards are not practical. The design engineer should make a complete analysis of the heat problem. The analysis will include a study of heat stress level, physical fitness of the worker, heat exposure periods, etc.
A detailed discussion of thermal standards for the industrial environment can be found in ASHRAE Fundamentals Handbook and ASHRAE Applications Handbook. When designing an industrial heating, cooling or ventilating system, it is recommended that the above material be reviewed. As an overview, the following is a summary of some of the problems and solutions the designer should consider when addressing industrial applications.
CONTROL OF HEAT EXPOSURES BY ISOLATING THE SOURCEInsulation, location of equipment, covering water tanks and drains, etc., can reduce the magnitude of heat exposure at the source. Exhaust hoods can be used to capture heat rising from hot processes.
Figure 39. Temperature Differential and Short Circuiting Figure 40. Induction Ratio, Total Air and Total Air Diameter
ADPI-Air Diffusion Performance Index (continued)
10
505
1020
30
15
40
Out
let J
et V
eloc
ity V
1500
500 600
1000 800
fpm
3000
O
2000
40005000
300Term
inal V
elocit
y 500
fpm
Ot
335040
020
0
17 13
.5
F B
elow
or A
bove
Am
bien
t
1.0 tx
2
4
3
6
8
10
V 50 f
pm
X100
X
= .8V
OVt X
Ot
7 5 3 2
15
20
2
% Short Circuiting, Oxt / t25
Induction Ratio, Q / Q
2
Outlet
Area 0
.5 Ft.
1
1000
cfm
2000
cfm
100
11.2148.45.84228
8 10
6000
Dia
met
er o
f Tot
al A
ir, F
t.
49 60
16 20
24
32 40
30
C= 1.4 81
65 80
2.0 100
206
Primar
y Air Q
406010
0
10
4
Out
let V
eloc
ity V
500 600
8001000
O
15002000
fpm
300040005000
10,00
0 cfm
8000 40
00
X
Termina
l Velo
city V
500
fpm
64 8
200
300
400
12 16 20
x
56 844221 28
Tota
l Air
Q ,
100
0 cf
m
= CQX
QO
V O
V X
2
500
10
20
30
7
14
21
X
C=
40
60 80
2100
X V 5
0 fpm
30 40 60 12080
28
42 56
1.4 70
O
o
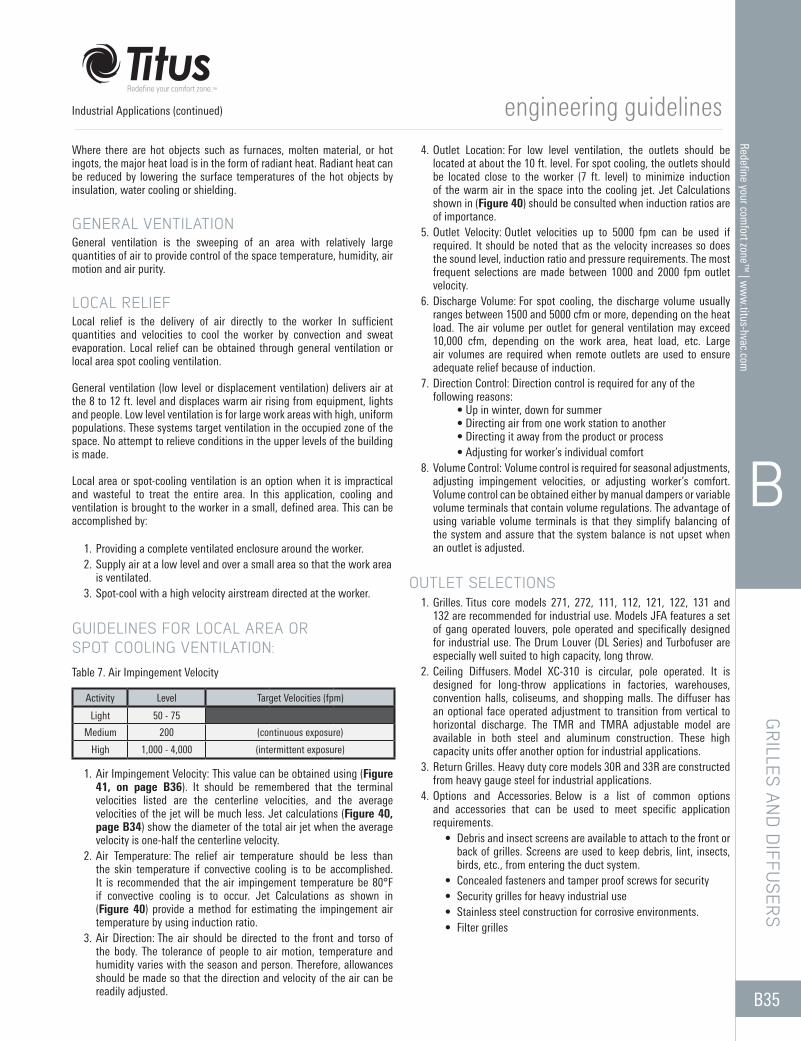
B35
Redefine your comfort zone™
| ww
w.titus-hvac.com
engineering guidelines
B
GRILLES AN
D D
IFFUSERS
Where there are hot objects such as furnaces, molten material, or hot ingots, the major heat load is in the form of radiant heat. Radiant heat can be reduced by lowering the surface temperatures of the hot objects by insulation, water cooling or shielding.
GENERAL VENTILATIONGeneral ventilation is the sweeping of an area with relatively large quantities of air to provide control of the space temperature, humidity, air motion and air purity.
LOCAL RELIEFLocal relief is the delivery of air directly to the worker In sufficient quantities and velocities to cool the worker by convection and sweat evaporation. Local relief can be obtained through general ventilation or local area spot cooling ventilation.
General ventilation (low level or displacement ventilation) delivers air at the 8 to 12 ft. level and displaces warm air rising from equipment, lights and people. Low level ventilation is for large work areas with high, uniform populations. These systems target ventilation in the occupied zone of the space. No attempt to relieve conditions in the upper levels of the building is made.
Local area or spot-cooling ventilation is an option when it is impractical and wasteful to treat the entire area. In this application, cooling and ventilation is brought to the worker in a small, defined area. This can be accomplished by:
1. Providing a complete ventilated enclosure around the worker.2. Supply air at a low level and over a small area so that the work area
is ventilated.3. Spot-cool with a high velocity airstream directed at the worker.
GUIDELINES FOR LOCAL AREA OR SPOT COOLING VENTILATION:
1. Air Impingement Velocity: This value can be obtained using (Figure 41, on page B36). It should be remembered that the terminal velocities listed are the centerline velocities, and the average velocities of the jet will be much less. Jet calculations (Figure 40, page B34) show the diameter of the total air jet when the average velocity is one-half the centerline velocity.
2. Air Temperature: The relief air temperature should be less than the skin temperature if convective cooling is to be accomplished. It is recommended that the air impingement temperature be 80°F if convective cooling is to occur. Jet Calculations as shown in (Figure 40) provide a method for estimating the impingement air temperature by using induction ratio.
3. Air Direction: The air should be directed to the front and torso of the body. The tolerance of people to air motion, temperature and humidity varies with the season and person. Therefore, allowances should be made so that the direction and velocity of the air can be readily adjusted.
4. Outlet Location: For low level ventilation, the outlets should be located at about the 10 ft. level. For spot cooling, the outlets should be located close to the worker (7 ft. level) to minimize induction of the warm air in the space into the cooling jet. Jet Calculations shown in (Figure 40) should be consulted when induction ratios are of importance.
5. Outlet Velocity: Outlet velocities up to 5000 fpm can be used if required. It should be noted that as the velocity increases so does the sound level, induction ratio and pressure requirements. The most frequent selections are made between 1000 and 2000 fpm outlet velocity.
6. Discharge Volume: For spot cooling, the discharge volume usually ranges between 1500 and 5000 cfm or more, depending on the heat load. The air volume per outlet for general ventilation may exceed 10,000 cfm, depending on the work area, heat load, etc. Large air volumes are required when remote outlets are used to ensure adequate relief because of induction.
7. Direction Control: Direction control is required for any of the following reasons: • Up in winter, down for summer • Directing air from one work station to another • Directing it away from the product or process
• Adjusting for worker’s individual comfort8. Volume Control: Volume control is required for seasonal adjustments,
adjusting impingement velocities, or adjusting worker’s comfort. Volume control can be obtained either by manual dampers or variable volume terminals that contain volume regulations. The advantage of using variable volume terminals is that they simplify balancing of the system and assure that the system balance is not upset when an outlet is adjusted.
OUTLET SELECTIONS1. Grilles. Titus core models 271, 272, 111, 112, 121, 122, 131 and
132 are recommended for industrial use. Models JFA features a set of gang operated louvers, pole operated and specifically designed for industrial use. The Drum Louver (DL Series) and Turbofuser are especially well suited to high capacity, long throw.
2. Ceiling Diffusers. Model XC-310 is circular, pole operated. It is designed for long-throw applications in factories, warehouses, convention halls, coliseums, and shopping malls. The diffuser has an optional face operated adjustment to transition from vertical to horizontal discharge. The TMR and TMRA adjustable model are available in both steel and aluminum construction. These high capacity units offer another option for industrial applications.
3. Return Grilles. Heavy duty core models 30R and 33R are constructed from heavy gauge steel for industrial applications.
4. Options and Accessories. Below is a list of common options and accessories that can be used to meet specific application requirements.
• Debris and insect screens are available to attach to the front or back of grilles. Screens are used to keep debris, lint, insects, birds, etc., from entering the duct system.
• Concealed fasteners and tamper proof screws for security• Security grilles for heavy industrial use• Stainless steel construction for corrosive environments.• Filter grilles
Table 7. Air Impingement Velocity
Activity Level Target Velocities (fpm)
Light 50 - 75
Medium 200 (continuous exposure)
High 1,000 - 4,000 (intermittent exposure)
Industrial Applications (continued)
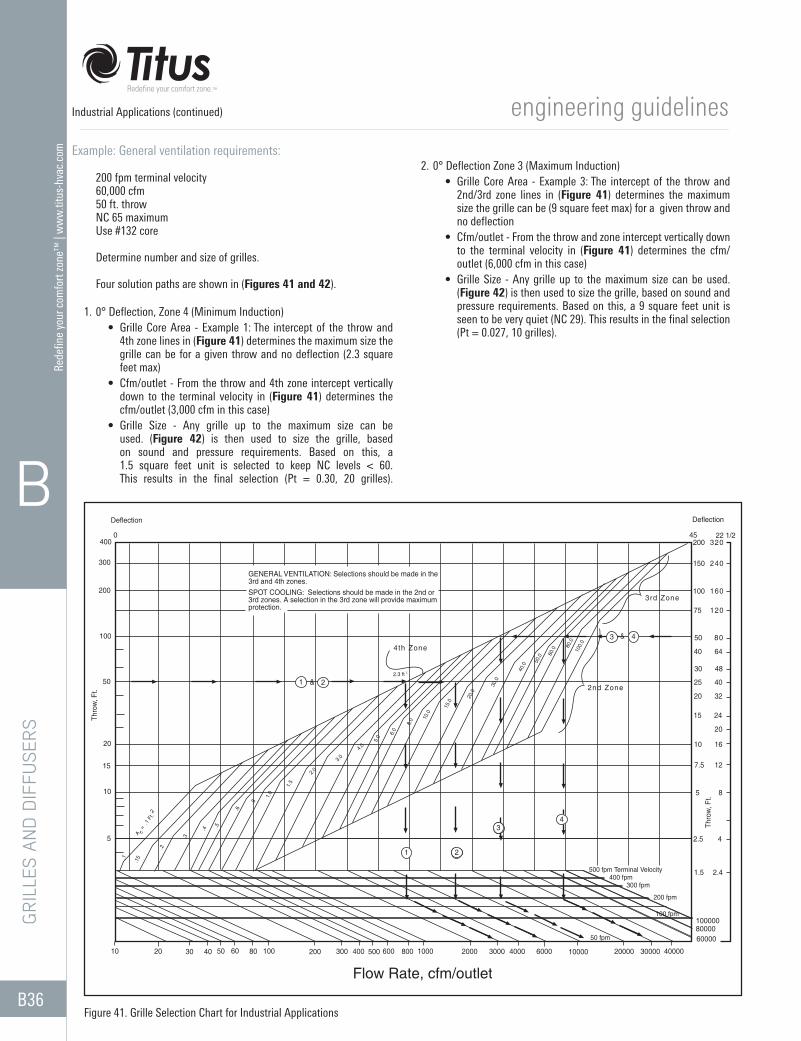
B36
Rede
fine
your
com
fort
zone
™ |
ww
w.ti
tus-
hvac
.com
engineering guidelines
B
GRI
LLES
AN
D D
IFFU
SERS
Example: General ventilation requirements: 200 fpm terminal velocity 60,000 cfm 50 ft. throw NC 65 maximum Use #132 core Determine number and size of grilles.
Four solution paths are shown in (Figures 41 and 42).
1. 0° Deflection, Zone 4 (Minimum Induction)• Grille Core Area - Example 1: The intercept of the throw and
4th zone lines in (Figure 41) determines the maximum size the grille can be for a given throw and no deflection (2.3 square feet max)
• Cfm/outlet - From the throw and 4th zone intercept vertically down to the terminal velocity in (Figure 41) determines the cfm/outlet (3,000 cfm in this case)
• Grille Size - Any grille up to the maximum size can be used. (Figure 42) is then used to size the grille, based on sound and pressure requirements. Based on this, a 1.5 square feet unit is selected to keep NC levels < 60. This results in the final selection (Pt = 0.30, 20 grilles).
2. 0° Deflection Zone 3 (Maximum Induction)• Grille Core Area - Example 3: The intercept of the throw and
2nd/3rd zone lines in (Figure 41) determines the maximum size the grille can be (9 square feet max) for a given throw and no deflection
• Cfm/outlet - From the throw and zone intercept vertically down to the terminal velocity in (Figure 41) determines the cfm/outlet (6,000 cfm in this case)
• Grille Size - Any grille up to the maximum size can be used. (Figure 42) is then used to size the grille, based on sound and pressure requirements. Based on this, a 9 square feet unit is seen to be very quiet (NC 29). This results in the final selection (Pt = 0.027, 10 grilles).
Figure 41. Grille Selection Chart for Industrial Applications
Industrial Applications (continued)
300
400
200
100
50
20
10 8020 10030 20040 30050 60 400 500 800 1000 2000 3000 4000
0
6000 10000 20000 30000 40000
6000080000100000
15
10
5
2.41.5500 fpm Terminal Velocity400 fpm
300 fpm
200 fpm
42.5
85
127.5
1610
20
2415
3220
4025
4830
6440
8050
12075
160100
240150
320200
Deflection
45 22 1/2
Deflection
Thro
w, F
t.
2.0
3.04.0
1.0
5.0 6.
0
8.0 10
.0
15.0
20.0
30.0
40.0
50.0
80.0
100.
0
60.0
.8
.6
.5.4
.3
.2
.15.1
1.5
Thro
w, F
t.
600
50 fpm
1 2
34
1 2&
3 4&
3rd Zone
2nd Zone
GENERAL VENTILATION: Selections should be made in the3rd and 4th zones.SPOT COOLING: Selections should be made in the 2nd or3rd zones. A selection in the 3rd zone will provide maximumprotection.
Flow Rate, cfm/outlet
A =
.1 F
t.
c
2
2.3 ft 2
4 th Zone
100 fpm
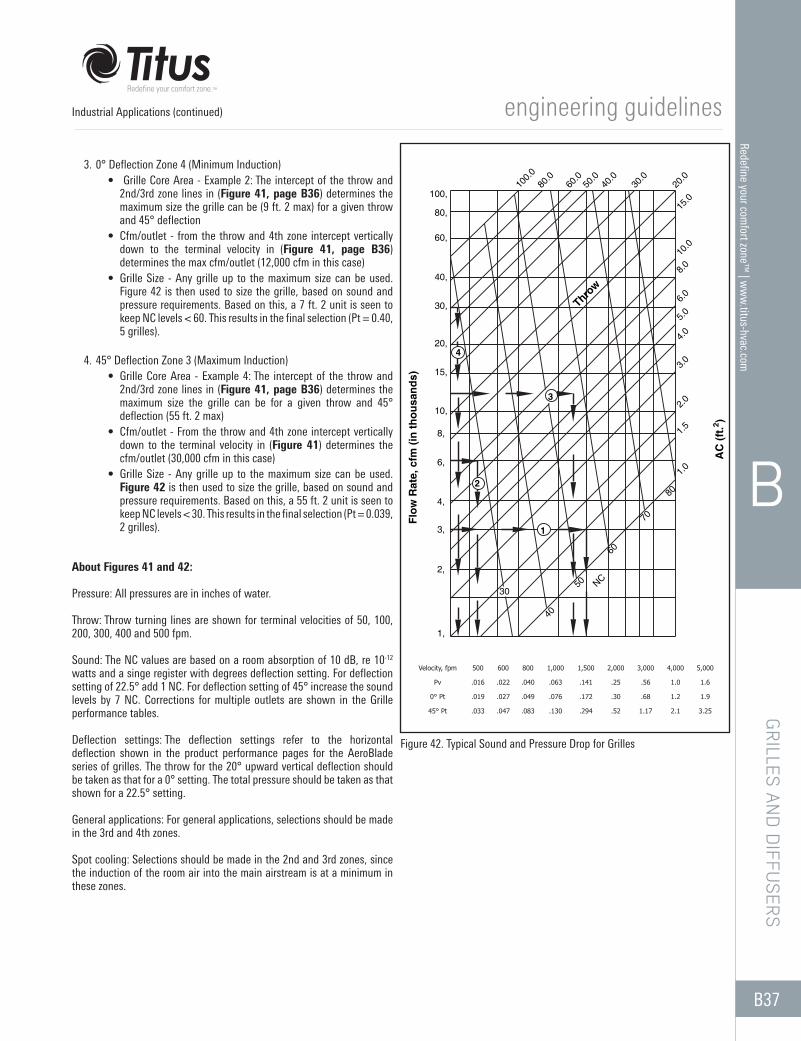
B37
Redefine your comfort zone™
| ww
w.titus-hvac.com
engineering guidelines
B
GRILLES AN
D D
IFFUSERS
3. 0° Deflection Zone 4 (Minimum Induction)• Grille Core Area - Example 2: The intercept of the throw and
2nd/3rd zone lines in (Figure 41, page B36) determines the maximum size the grille can be (9 ft. 2 max) for a given throw and 45° deflection
• Cfm/outlet - from the throw and 4th zone intercept vertically down to the terminal velocity in (Figure 41, page B36) determines the max cfm/outlet (12,000 cfm in this case)
• Grille Size - Any grille up to the maximum size can be used. Figure 42 is then used to size the grille, based on sound and pressure requirements. Based on this, a 7 ft. 2 unit is seen to keep NC levels < 60. This results in the final selection (Pt = 0.40, 5 grilles).
4. 45° Deflection Zone 3 (Maximum Induction)• Grille Core Area - Example 4: The intercept of the throw and
2nd/3rd zone lines in (Figure 41, page B36) determines the maximum size the grille can be for a given throw and 45° deflection (55 ft. 2 max)
• Cfm/outlet - From the throw and 4th zone intercept vertically down to the terminal velocity in (Figure 41) determines the cfm/outlet (30,000 cfm in this case)
• Grille Size - Any grille up to the maximum size can be used. Figure 42 is then used to size the grille, based on sound and pressure requirements. Based on this, a 55 ft. 2 unit is seen to keep NC levels < 30. This results in the final selection (Pt = 0.039, 2 grilles).
Figure 42. Typical Sound and Pressure Drop for Grilles
Industrial Applications (continued)
About Figures 41 and 42:
Pressure: All pressures are in inches of water.
Throw: Throw turning lines are shown for terminal velocities of 50, 100, 200, 300, 400 and 500 fpm.
Sound: The NC values are based on a room absorption of 10 dB, re 10-12 watts and a singe register with degrees deflection setting. For deflection setting of 22.5° add 1 NC. For deflection setting of 45° increase the sound levels by 7 NC. Corrections for multiple outlets are shown in the Grille performance tables.
Deflection settings: The deflection settings refer to the horizontal deflection shown in the product performance pages for the AeroBlade series of grilles. The throw for the 20° upward vertical deflection should be taken as that for a 0° setting. The total pressure should be taken as that shown for a 22.5° setting.
General applications: For general applications, selections should be made in the 3rd and 4th zones.
Spot cooling: Selections should be made in the 2nd and 3rd zones, since the induction of the room air into the main airstream is at a minimum in these zones.
1,
2,
30
40
NC50
Flow
Rat
e, c
fm (i
n th
ousa
nds)
3,
4,
6,
2
8,
10,
15,
20,4
30,
40,
60,
100,
80,
6.0Throw
1
60
70
3
1.5
80
1.0
3.0
AC
(ft.2 )
2.0
4.0
5.0
60.0
100.0
80.0
40.0
50.0
30.0
8.010
.0
15.0
20.0
Velocity, fpm 500 600 800 1,000 1,500 2,000 3,000 4,000 5,000
Pv .016 .022 .040 .063 .141 .25 .56 1.0 1.6
0° Pt .019 .027 .049 .076 .172 .30 .68 1.2 1.9
45° Pt .033 .047 .083 .130 .294 .52 1.17 2.1 3.25
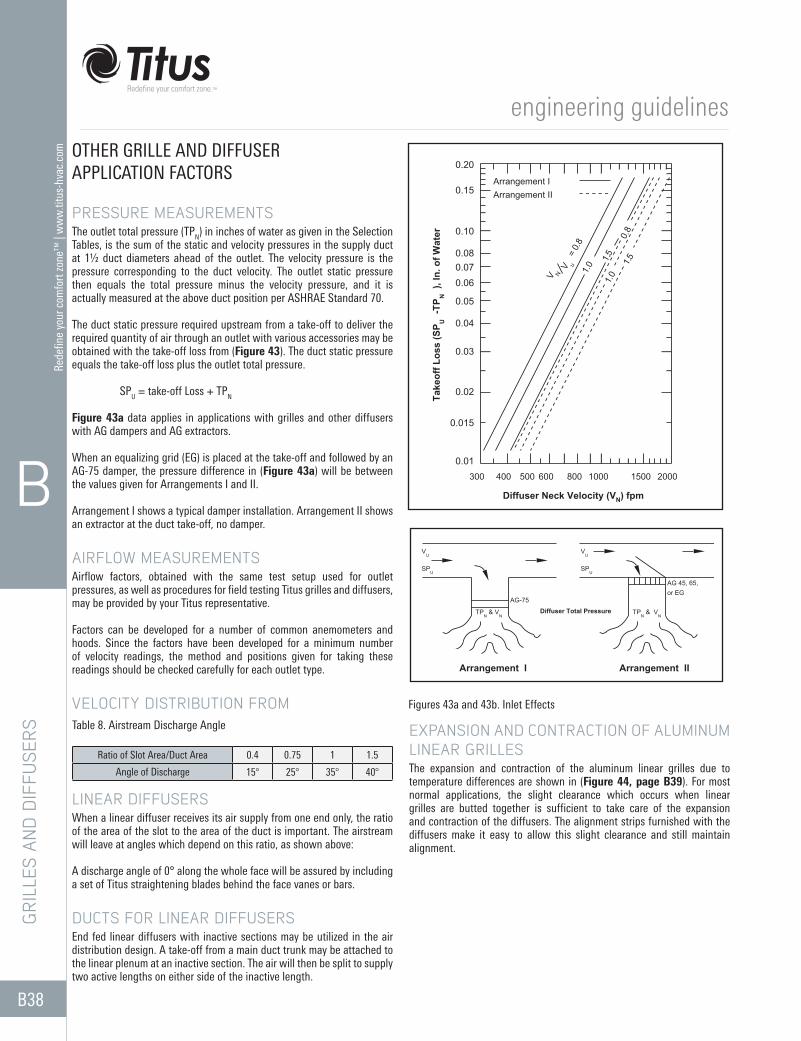
B38
Rede
fine
your
com
fort
zone
™ |
ww
w.ti
tus-
hvac
.com
engineering guidelines
B
GRI
LLES
AN
D D
IFFU
SERS
OTHER GRILLE AND DIFFUSER APPLICATION FACTORS
PRESSURE MEASUREMENTSThe outlet total pressure (TPN) in inches of water as given in the Selection Tables, is the sum of the static and velocity pressures in the supply duct at 1½ duct diameters ahead of the outlet. The velocity pressure is the pressure corresponding to the duct velocity. The outlet static pressure then equals the total pressure minus the velocity pressure, and it is actually measured at the above duct position per ASHRAE Standard 70.
The duct static pressure required upstream from a take-off to deliver the required quantity of air through an outlet with various accessories may be obtained with the take-off loss from (Figure 43). The duct static pressure equals the take-off loss plus the outlet total pressure.
SPU = take-off Loss + TPN
Figure 43a data applies in applications with grilles and other diffusers with AG dampers and AG extractors.
When an equalizing grid (EG) is placed at the take-off and followed by an AG-75 damper, the pressure difference in (Figure 43a) will be between the values given for Arrangements I and II.
Arrangement I shows a typical damper installation. Arrangement II shows an extractor at the duct take-off, no damper.
AIRFLOW MEASUREMENTSAirflow factors, obtained with the same test setup used for outlet pressures, as well as procedures for field testing Titus grilles and diffusers, may be provided by your Titus representative.
Factors can be developed for a number of common anemometers and hoods. Since the factors have been developed for a minimum number of velocity readings, the method and positions given for taking these readings should be checked carefully for each outlet type.
VELOCITY DISTRIBUTION FROM
LINEAR DIFFUSERSWhen a linear diffuser receives its air supply from one end only, the ratio of the area of the slot to the area of the duct is important. The airstream will leave at angles which depend on this ratio, as shown above:
A discharge angle of 0° along the whole face will be assured by including a set of Titus straightening blades behind the face vanes or bars.
DUCTS FOR LINEAR DIFFUSERSEnd fed linear diffusers with inactive sections may be utilized in the air distribution design. A take-off from a main duct trunk may be attached to the linear plenum at an inactive section. The air will then be split to supply two active lengths on either side of the inactive length.
EXPANSION AND CONTRACTION OF ALUMINUM LINEAR GRILLESThe expansion and contraction of the aluminum linear grilles due to temperature differences are shown in (Figure 44, page B39). For most normal applications, the slight clearance which occurs when linear grilles are butted together is sufficient to take care of the expansion and contraction of the diffusers. The alignment strips furnished with the diffusers make it easy to allow this slight clearance and still maintain alignment.
Figures 43a and 43b. Inlet Effects
Table 8. Airstream Discharge Angle
Ratio of Slot Area/Duct Area 0.4 0.75 1 1.5
Angle of Discharge 15B 25B 35B 40B
V N
600
Diffuser Total Pressure
Arrangement I
Arrangement II
Ta
ke
off
Lo
ss
(S
PU
-TP
N
), I
n.
of
Wa
ter
SPU
TPN & V
N
AG-75
Arrangment I
500400300
VU
SPU
VU
1.5
1.5
= 0
.81.
0
AG 45, 65,
or EG
TPN & V
N
Arrangment II
1.0
V u
1500800 1000 2000
0.8
Diffuser Neck Velocity (VN) fpm
0.20
0.15
0.10
0.08
0.07
0.06
0.05
0.04
0.03
0.02
0.015
0.01
V N
600
Diffuser Total Pressure
Arrangement I Arrangement II
Take
off L
oss
(SP U
-TP
N )
, In.
of W
ater
SPU
TPN & V
N
AG-75
Arrangement I
500400300
VU
SPU
VU
1.5 1.5
= 0.
81.
0AG 45, 65,or EG
TPN & V
N
Arrangement II
1.0
V u
1500800 1000 2000
0.8
Diffuser Neck Velocity (VN) fpm
0.20
0.15
0.10
0.080.070.06
0.05
0.04
0.03
0.02
0.015
0.01
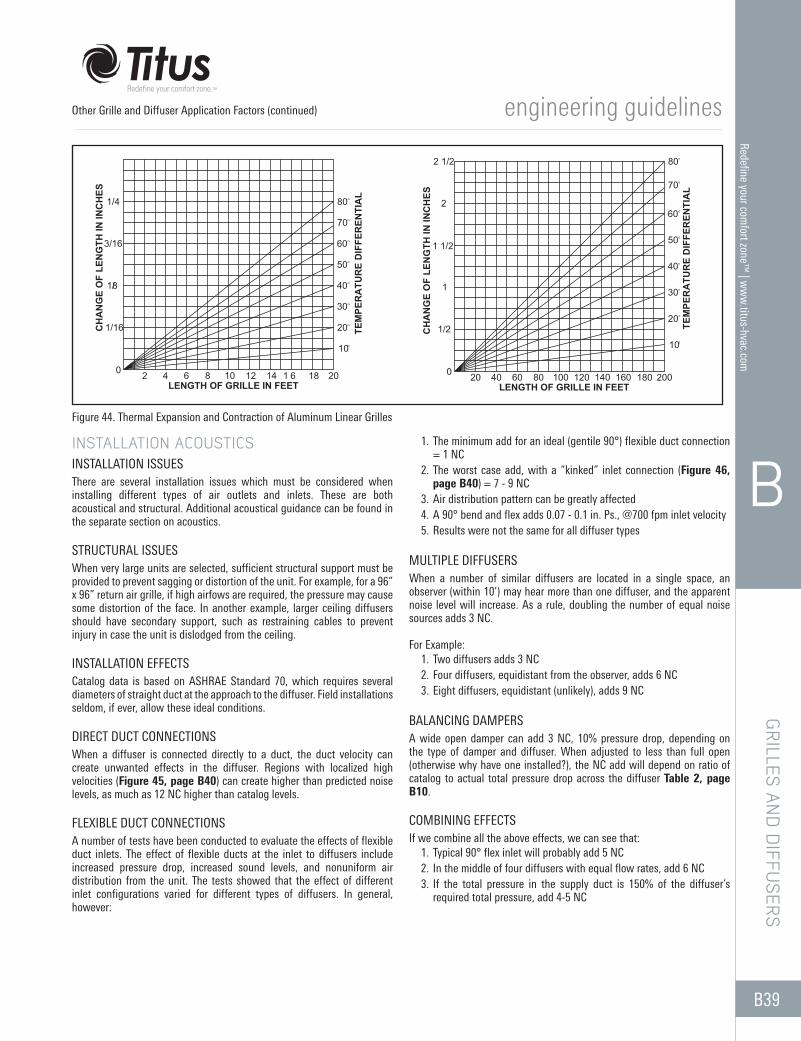
B39
Redefine your comfort zone™
| ww
w.titus-hvac.com
engineering guidelines
B
GRILLES AN
D D
IFFUSERS
INSTALLATION ACOUSTICSINSTALLATION ISSUESThere are several installation issues which must be considered when installing different types of air outlets and inlets. These are both acoustical and structural. Additional acoustical guidance can be found in the separate section on acoustics.
STRUCTURAL ISSUESWhen very large units are selected, sufficient structural support must be provided to prevent sagging or distortion of the unit. For example, for a 96” x 96” return air grille, if high airfows are required, the pressure may cause some distortion of the face. In another example, larger ceiling diffusers should have secondary support, such as restraining cables to prevent injury in case the unit is dislodged from the ceiling.
INSTALLATION EFFECTSCatalog data is based on ASHRAE Standard 70, which requires several diameters of straight duct at the approach to the diffuser. Field installations seldom, if ever, allow these ideal conditions.
DIRECT DUCT CONNECTIONSWhen a diffuser is connected directly to a duct, the duct velocity can create unwanted effects in the diffuser. Regions with localized high velocities (Figure 45, page B40) can create higher than predicted noise levels, as much as 12 NC higher than catalog levels.
FLEXIBLE DUCT CONNECTIONSA number of tests have been conducted to evaluate the effects of flexible duct inlets. The effect of flexible ducts at the inlet to diffusers include increased pressure drop, increased sound levels, and nonuniform air distribution from the unit. The tests showed that the effect of different inlet configurations varied for different types of diffusers. In general, however:
1. The minimum add for an ideal (gentile 90°) flexible duct connection = 1 NC
2. The worst case add, with a “kinked” inlet connection (Figure 46, page B40) = 7 - 9 NC
3. Air distribution pattern can be greatly affected4. A 90° bend and flex adds 0.07 - 0.1 in. Ps., @700 fpm inlet velocity5. Results were not the same for all diffuser types
MULTIPLE DIFFUSERSWhen a number of similar diffusers are located in a single space, an observer (within 10’) may hear more than one diffuser, and the apparent noise level will increase. As a rule, doubling the number of equal noise sources adds 3 NC.
For Example:1. Two diffusers adds 3 NC2. Four diffusers, equidistant from the observer, adds 6 NC3. Eight diffusers, equidistant (unlikely), adds 9 NC
BALANCING DAMPERSA wide open damper can add 3 NC, 10% pressure drop, depending on the type of damper and diffuser. When adjusted to less than full open (otherwise why have one installed?), the NC add will depend on ratio of catalog to actual total pressure drop across the diffuser Table 2, page B10.
COMBINING EFFECTSIf we combine all the above effects, we can see that:
1. Typical 90° flex inlet will probably add 5 NC2. In the middle of four diffusers with equal flow rates, add 6 NC3. If the total pressure in the supply duct is 150% of the diffuser’s
required total pressure, add 4-5 NC
Figure 44. Thermal Expansion and Contraction of Aluminum Linear Grilles
Other Grille and Diffuser Application Factors (continued)
1/16
LENGTH OF GRILLE IN FEET
042 6 1 68 10 1412
10
18 20
CH
AN
GE
OF
LE
NG
TH
IN
IN
CH
ES
1/8
1/4
3/16
80
70
60
50
40
30
20 TE
MP
ER
AT
UR
E D
IFF
ER
EN
TIA
L
CH
AN
GE
OF
LE
NG
TH
IN
IN
CH
ES
200
1/2
2 1/2
2
1
1 1/2
30
120LENGTH OF GRILLE IN FEET
100806040
20
10
200180160140
70
80
60
50
40
TE
MP
ER
AT
UR
E D
IFF
ER
EN
TIA
L
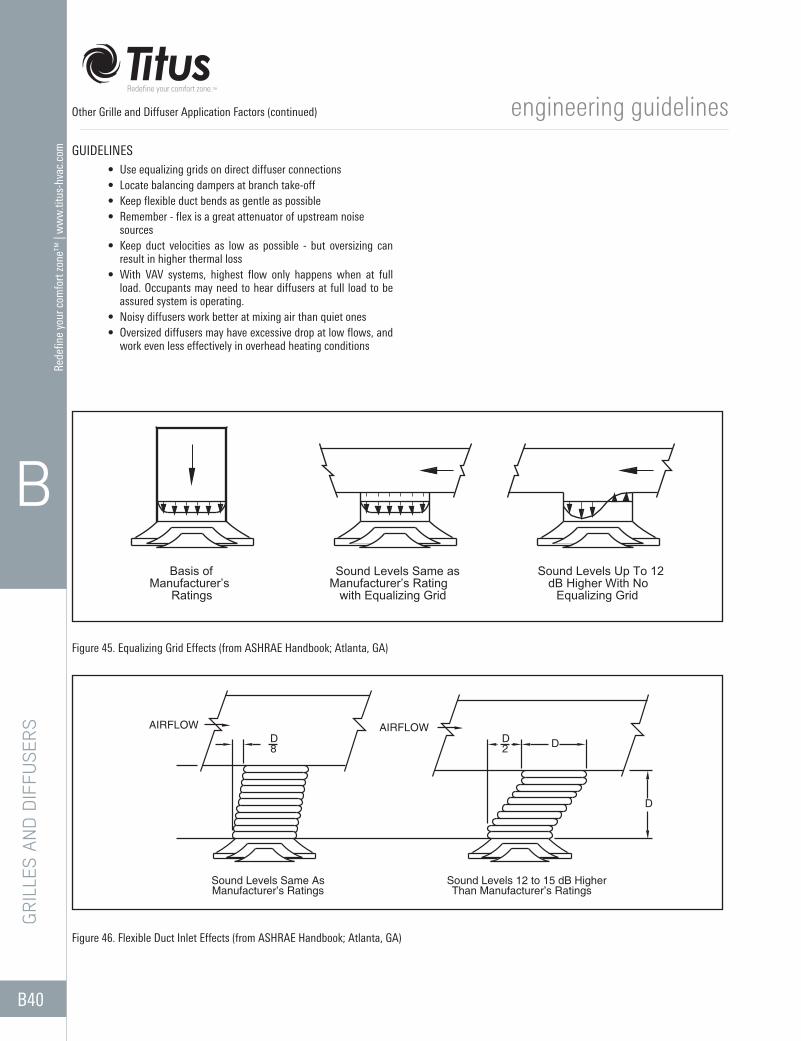
B40
Rede
fine
your
com
fort
zone
™ |
ww
w.ti
tus-
hvac
.com
engineering guidelines
B
GRI
LLES
AN
D D
IFFU
SERS
GUIDELINES• Use equalizing grids on direct diffuser connections• Locate balancing dampers at branch take-off• Keep flexible duct bends as gentle as possible• Remember - flex is a great attenuator of upstream noise
sources• Keep duct velocities as low as possible - but oversizing can
result in higher thermal loss• With VAV systems, highest flow only happens when at full
load. Occupants may need to hear diffusers at full load to be assured system is operating.
• Noisy diffusers work better at mixing air than quiet ones• Oversized diffusers may have excessive drop at low flows, and
work even less effectively in overhead heating conditions
Figure 45. Equalizing Grid Effects (from ASHRAE Handbook; Atlanta, GA)
Figure 46. Flexible Duct Inlet Effects (from ASHRAE Handbook; Atlanta, GA)
Other Grille and Diffuser Application Factors (continued)
with Equalizing Grid
Sound Levels Same asManufacturer’s RatingManufacturer’s
Ratings
Basis of Sound Levels Up To 12dB Higher With No
Equalizing Grid
AIRFLOW
Manufacturer’s RatingsSound Levels Same As
8
AIRFLOWD D
Sound Levels 12 to 15 dB HigherThan Manufacturer’s Ratings
2
D
D