grid4eu winner of the isgan award of excellence 2015 · grid4eu – winner of the isgan award of...
TRANSCRIPT

GRID4EU – Winner of the ISGAN
Award of Excellence 2015
Topic: Integration of Renewable Energy
Rémy GARAUDE VERDIER, ERDF
Lars JENDERNALIK, Westnetz GmbH
Daniele STEIN, ENEL SpA
Thomas DRIZARD, ERDF
Global agenda
GRID4EU brief presentation
Zoom on the 6 Demos
General Work Package activities
Dissemination activities
To stay connected to GRID4EU
2 www.grid4eu.eu
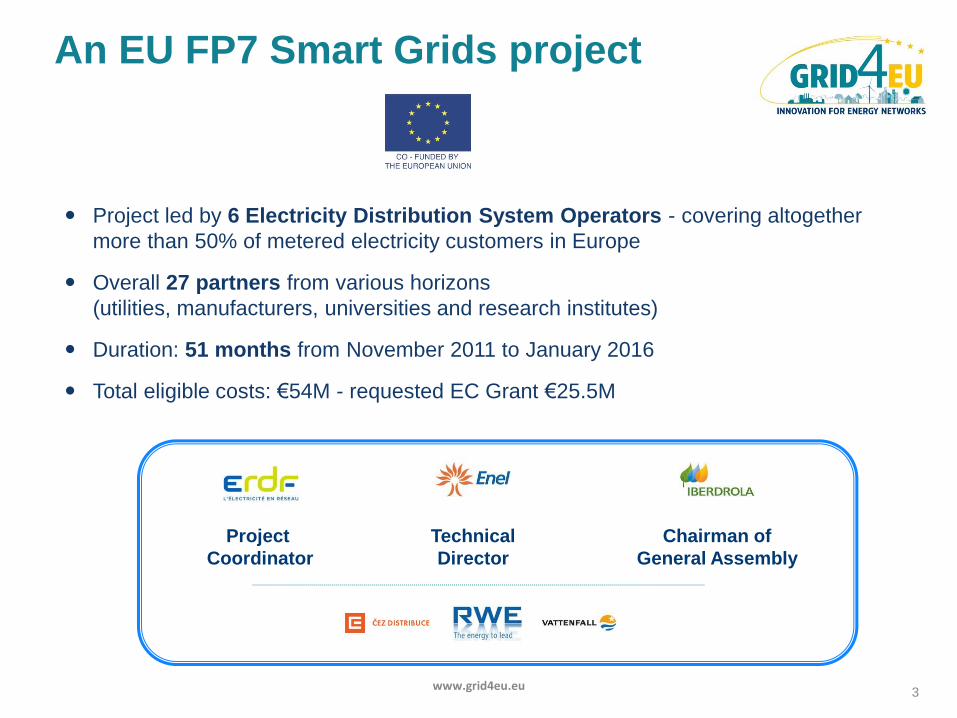
An EU FP7 Smart Grids project
Project led by 6 Electricity Distribution System Operators - covering altogether
more than 50% of metered electricity customers in Europe
Overall 27 partners from various horizons
(utilities, manufacturers, universities and research institutes)
Duration: 51 months from November 2011 to January 2016
Total eligible costs: €54M - requested EC Grant €25.5M
3
Project
Coordinator
Chairman of
General Assembly
Technical
Director
www.grid4eu.eu
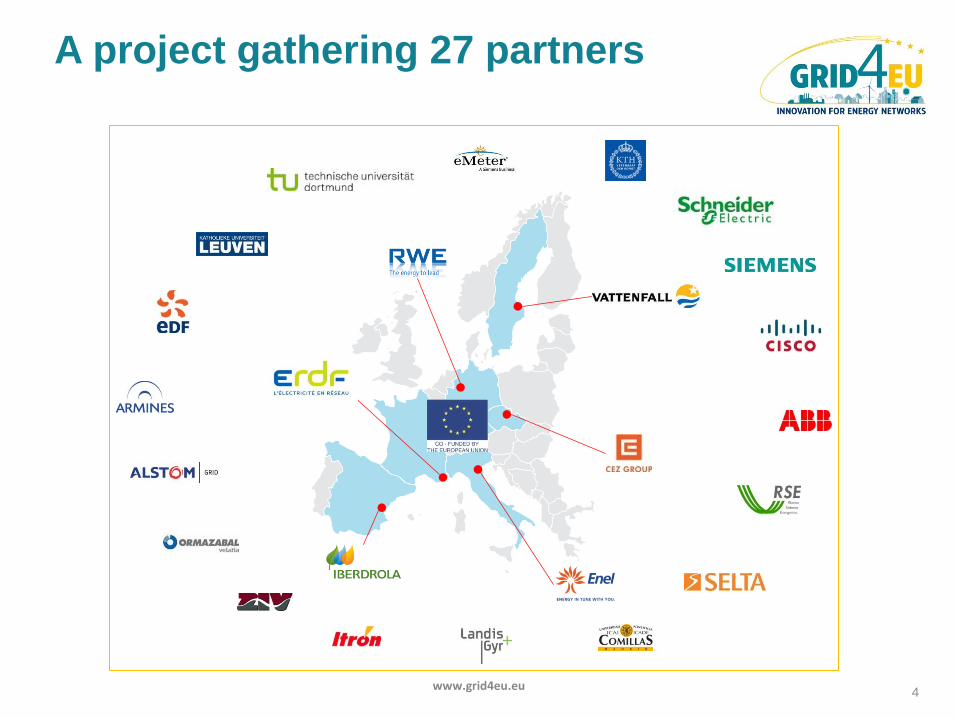
A project gathering 27 partners
4 www.grid4eu.eu
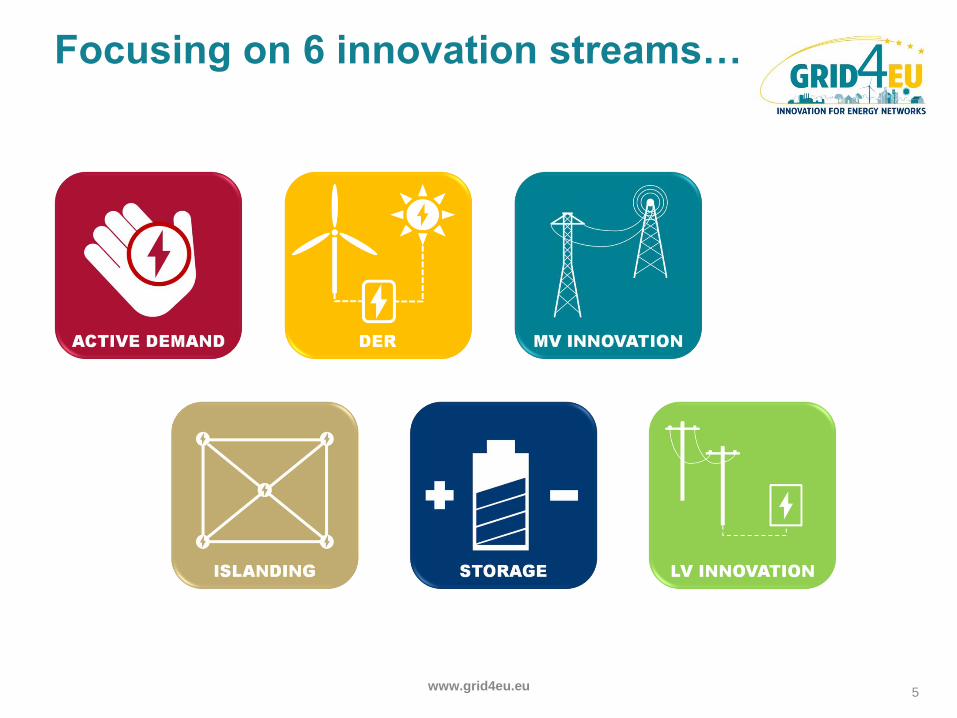
Focusing on 6 innovation streams…
5 www.grid4eu.eu

…tested by 6 Demonstrators with
different boundary conditions…
6
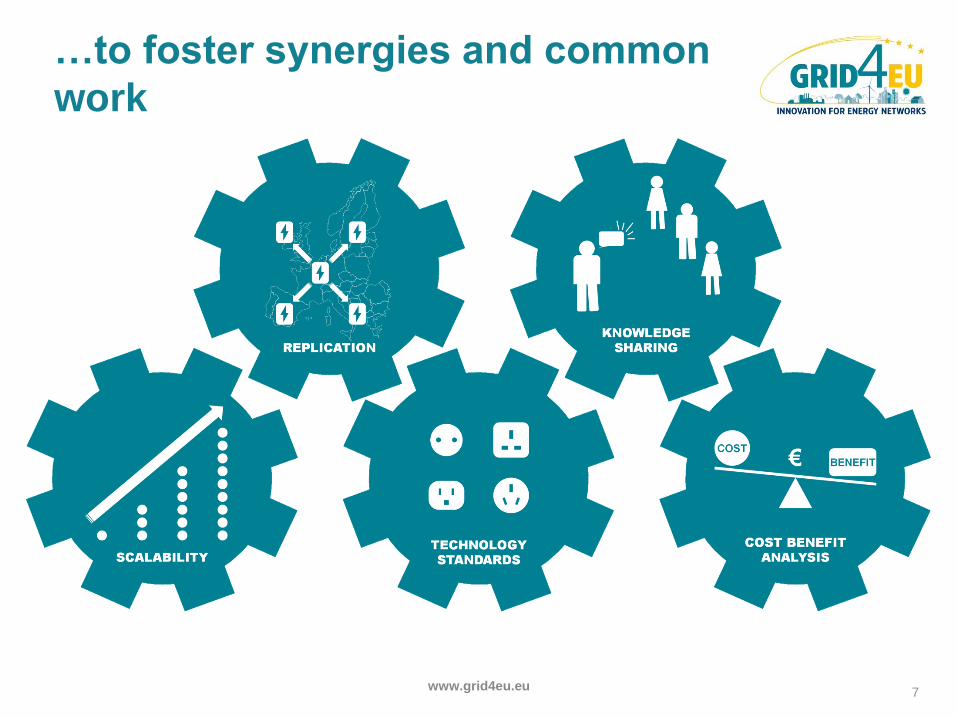
…to foster synergies and common
work
7 www.grid4eu.eu
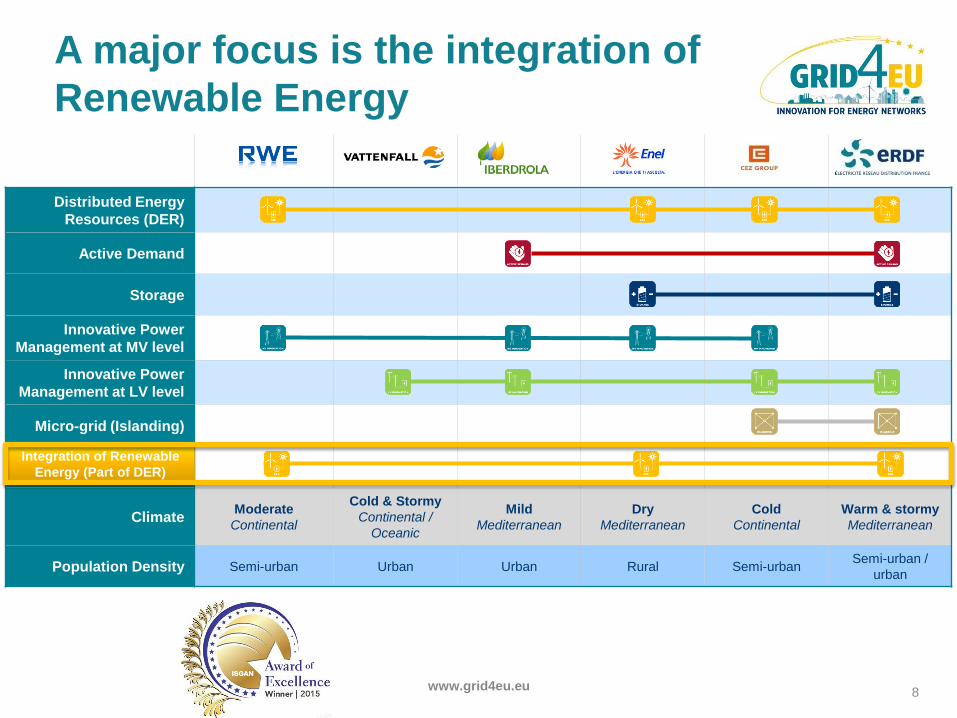
A major focus is the integration of
Renewable Energy
8
Distributed Energy
Resources (DER)
Active Demand
Storage
Innovative Power
Management at MV level
Innovative Power
Management at LV level
Micro-grid (Islanding)
Climate Moderate
Continental
Cold & Stormy
Continental /
Oceanic
Mild
Mediterranean
Dry
Mediterranean
Cold
Continental
Warm & stormy
Mediterranean
Population Density Semi-urban Urban Urban Rural Semi-urban Semi-urban /
urban
www.grid4eu.eu
Integration of Renewable
Energy (Part of DER)
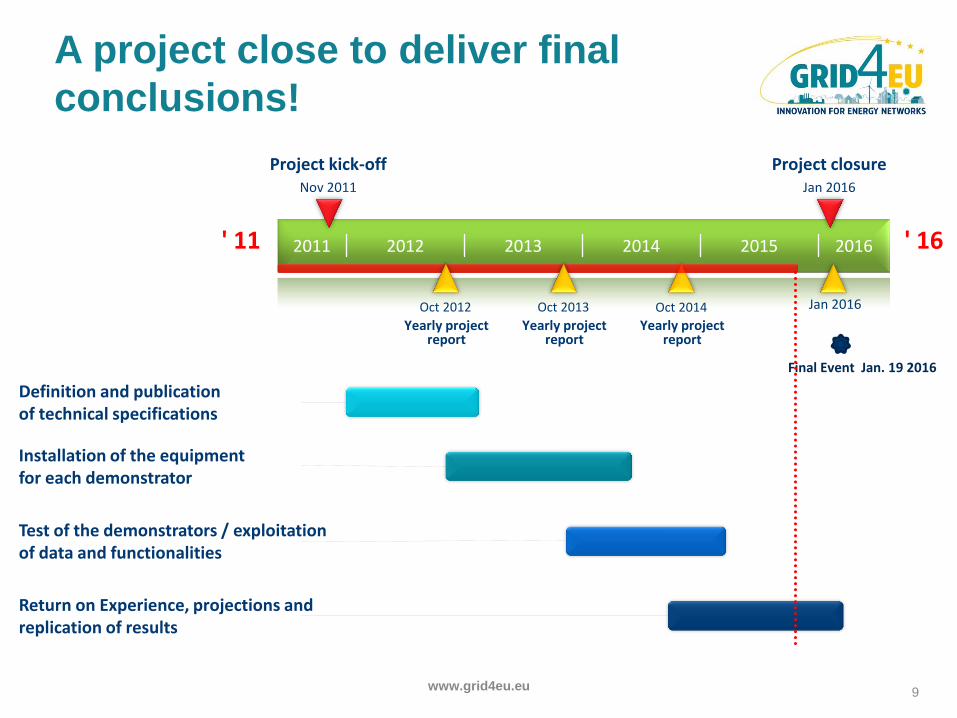
A project close to deliver final
conclusions!
' 11 2011 2012 2013 2014 2015 ' 16
Project closure
Final Event Jan. 19 2016
Yearly project report
Yearly project report
Yearly project report
Project kick-off
Definition and publication of technical specifications
Return on Experience, projections and replication of results
Test of the demonstrators / exploitation of data and functionalities
Installation of the equipment for each demonstrator
Jan 2016 Nov 2011
Oct 2014 Oct 2013 Oct 2012
2016
9
Jan 2016
www.grid4eu.eu

GRID4EU German Demo
Integrating Renewable Energy using an
autonomous Medium Voltage control system
Lars JENDERNALIK, Westnetz GmbH (email address: [email protected])
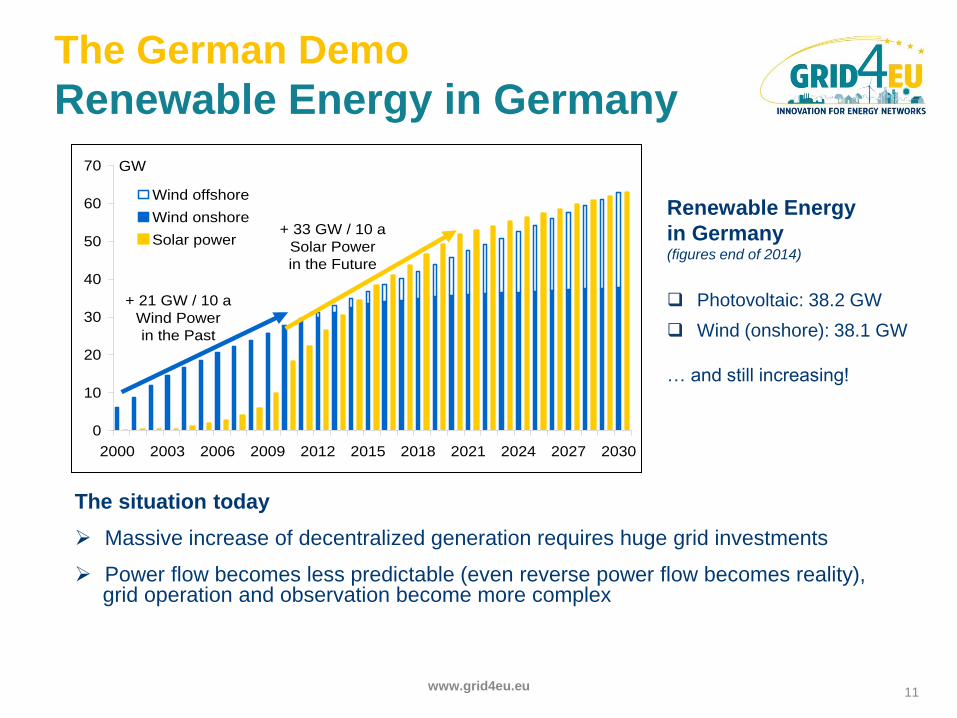
The German Demo
Renewable Energy in Germany
11 www.grid4eu.eu
Renewable Energy
in Germany (figures end of 2014)
Photovoltaic: 38.2 GW
Wind (onshore): 38.1 GW
… and still increasing!
0
10
20
30
40
50
60
70
2000 2003 2006 2009 2012 2015 2018 2021 2024 2027 2030
Wind offshore
Wind onshore
Solar power
GW
+ 21 GW / 10 a
Wind Power
in the Past
+ 33 GW / 10 a
Solar Power
in the Future
The situation today
Massive increase of decentralized generation requires huge grid investments
Power flow becomes less predictable (even reverse power flow becomes reality), grid operation and observation become more complex
The German Demo
Overview
12 www.grid4eu.eu
Objectives
Integration of an increasing number of decentralized energy resources (windmills,
solar panels…) in the medium and low voltage networks
Avoiding „classical“ network expansion measures
Achieving higher reliability, shorter recovery times after grid failures
Increasing the surveillance and remote-control level in MV networks to achieve
better overload and failure management
Loss reduction due to optimized switching situation for each scenario
Basic idea
Extension of the automation level of MV networks based on an autonomously
acting multi module system as an industrial solution for network operation
Partners
The German Demo
Boundary conditions
13 www.grid4eu.eu
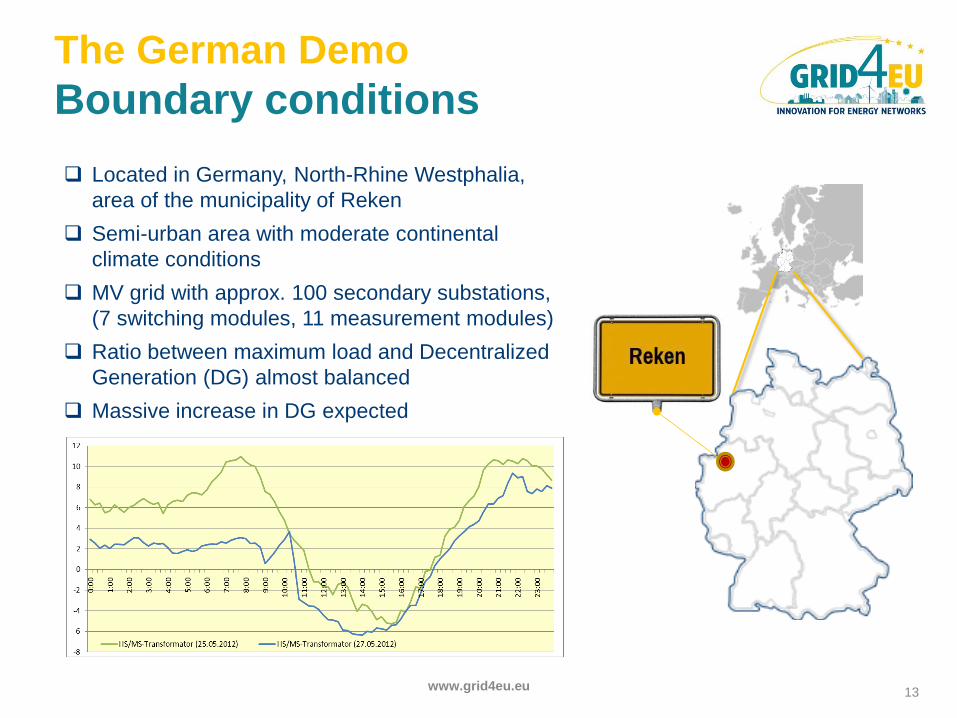
Located in Germany, North-Rhine Westphalia,
area of the municipality of Reken
Semi-urban area with moderate continental
climate conditions
MV grid with approx. 100 secondary substations,
(7 switching modules, 11 measurement modules)
Ratio between maximum load and Decentralized
Generation (DG) almost balanced
Massive increase in DG expected
The German Demo Principle concept
14 www.grid4eu.eu
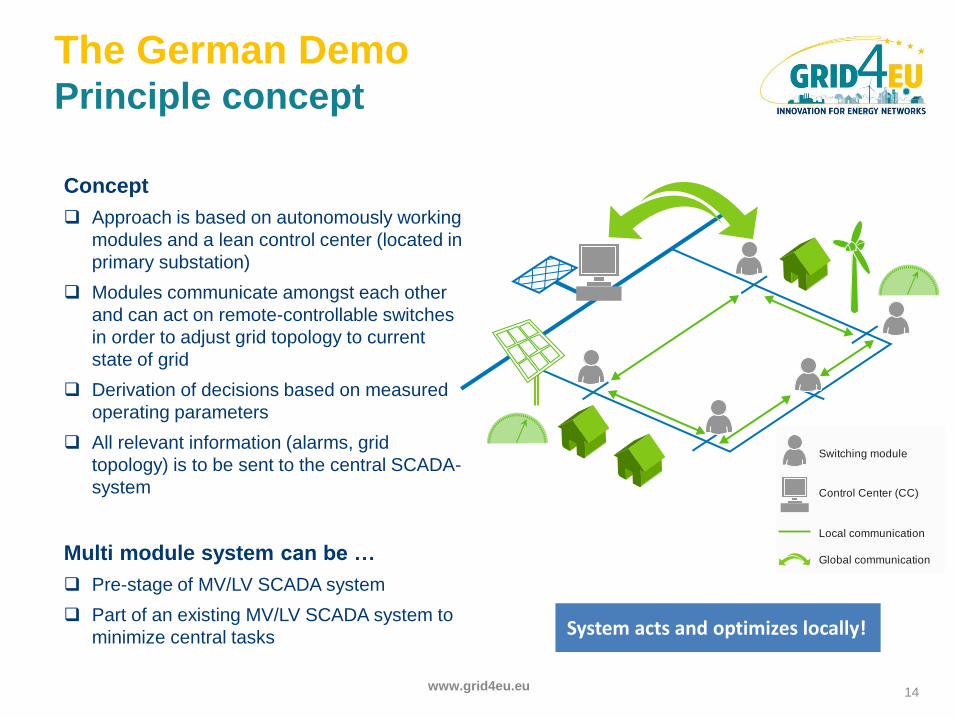
System acts and optimizes locally!
Switching module
Control Center (CC)
Local communication
Global communication
Concept
Approach is based on autonomously working
modules and a lean control center (located in
primary substation)
Modules communicate amongst each other
and can act on remote-controllable switches
in order to adjust grid topology to current
state of grid
Derivation of decisions based on measured
operating parameters
All relevant information (alarms, grid
topology) is to be sent to the central SCADA-
system
Multi module system can be …
Pre-stage of MV/LV SCADA system
Part of an existing MV/LV SCADA system to
minimize central tasks
The German Demo Hardware implementation in Reken
15 www.grid4eu.eu
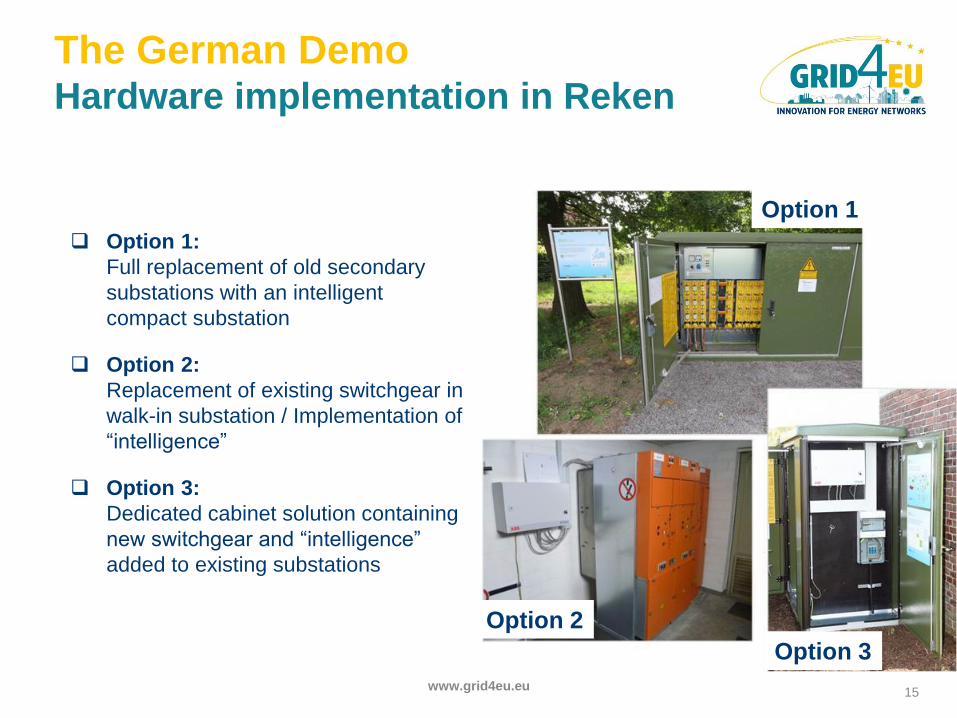
Option 1:
Full replacement of old secondary
substations with an intelligent
compact substation
Option 2:
Replacement of existing switchgear in
walk-in substation / Implementation of
“intelligence”
Option 3:
Dedicated cabinet solution containing
new switchgear and “intelligence”
added to existing substations
Option 1
Option 2
Option 3
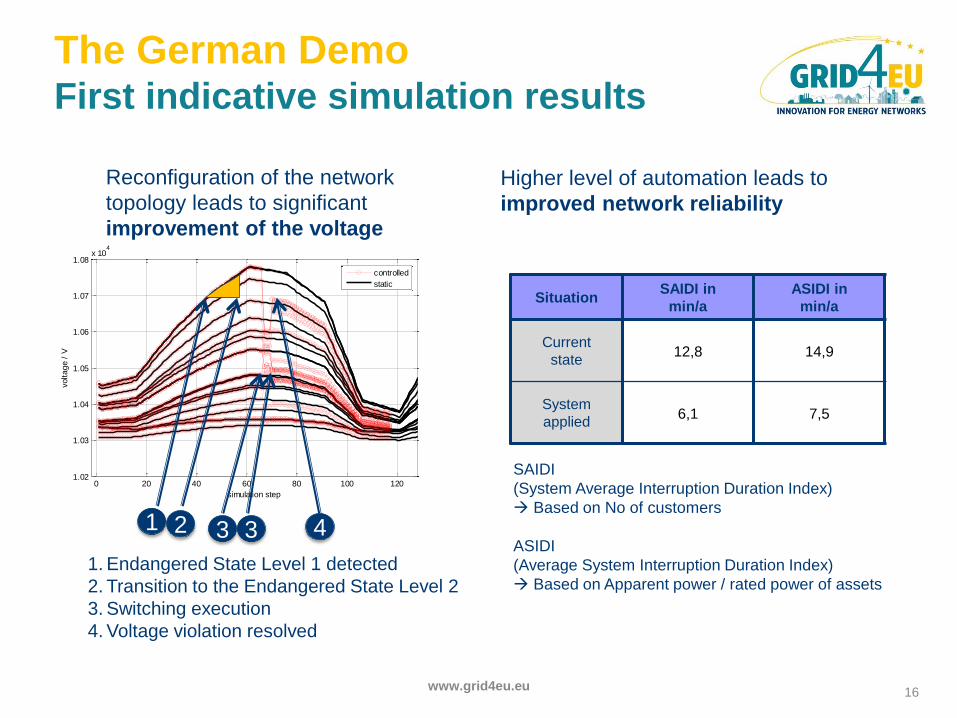
The German Demo First indicative simulation results
16 www.grid4eu.eu
Situation SAIDI in
min/a
ASIDI in
min/a
Current
state 12,8 14,9
System
applied 6,1 7,5
Reconfiguration of the network
topology leads to significant
improvement of the voltage
0 20 40 60 80 100 1201.02
1.03
1.04
1.05
1.06
1.07
1.08x 10
4
simulation step
volt
ag
e /
V
controlled
static
1. Endangered State Level 1 detected
2. Transition to the Endangered State Level 2
3. Switching execution
4. Voltage violation resolved
1 2 3 3 4
Higher level of automation leads to
improved network reliability
SAIDI
(System Average Interruption Duration Index)
Based on No of customers
ASIDI
(Average System Interruption Duration Index)
Based on Apparent power / rated power of assets
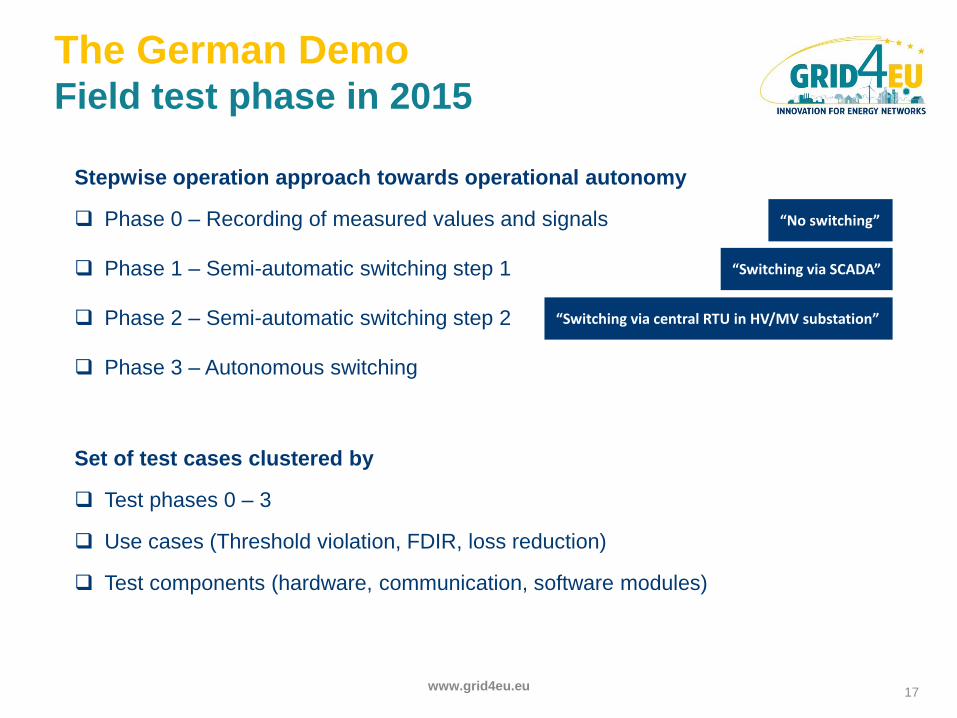
The German Demo Field test phase in 2015
17 www.grid4eu.eu
Stepwise operation approach towards operational autonomy
Phase 0 – Recording of measured values and signals
Phase 1 – Semi-automatic switching step 1
Phase 2 – Semi-automatic switching step 2
Phase 3 – Autonomous switching
Set of test cases clustered by
Test phases 0 – 3
Use cases (Threshold violation, FDIR, loss reduction)
Test components (hardware, communication, software modules)
“No switching”
“Switching via SCADA”
“Switching via central RTU in HV/MV substation”
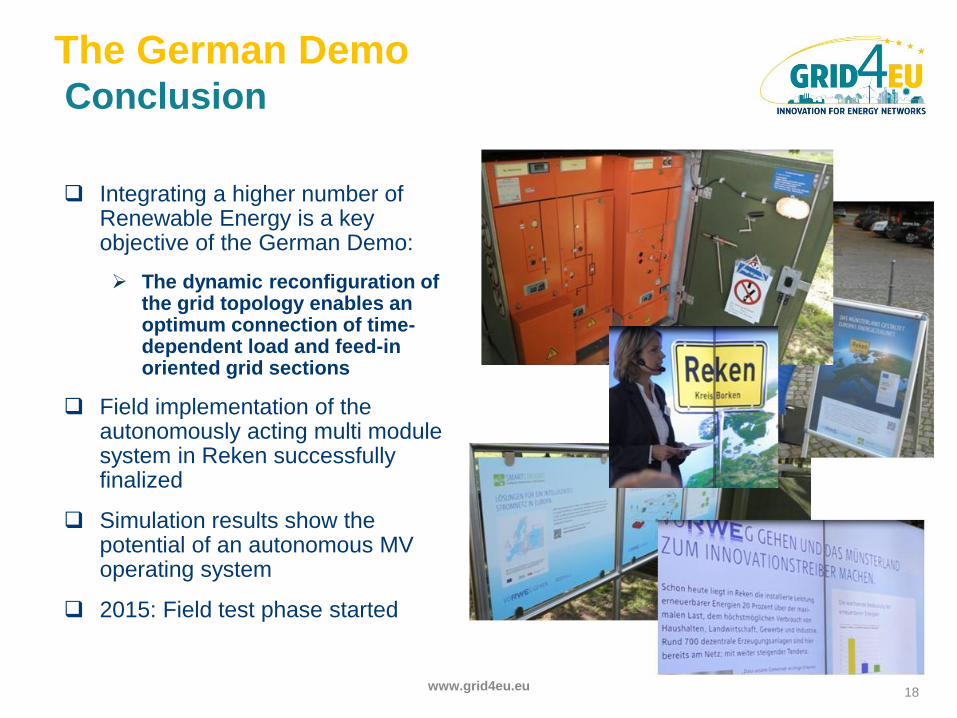
The German Demo Conclusion
18 www.grid4eu.eu
Integrating a higher number of Renewable Energy is a key objective of the German Demo:
The dynamic reconfiguration of the grid topology enables an optimum connection of time-dependent load and feed-in oriented grid sections
Field implementation of the autonomously acting multi module system in Reken successfully finalized
Simulation results show the potential of an autonomous MV operating system
2015: Field test phase started
GRID4EU Italian Demo
Integrating Renewable Energy using an advanced control
system communicating with the renewable generators,
HV/MV & MV/LV substations and storage facility
Daniele STEIN, ENEL SpA (email address: [email protected])
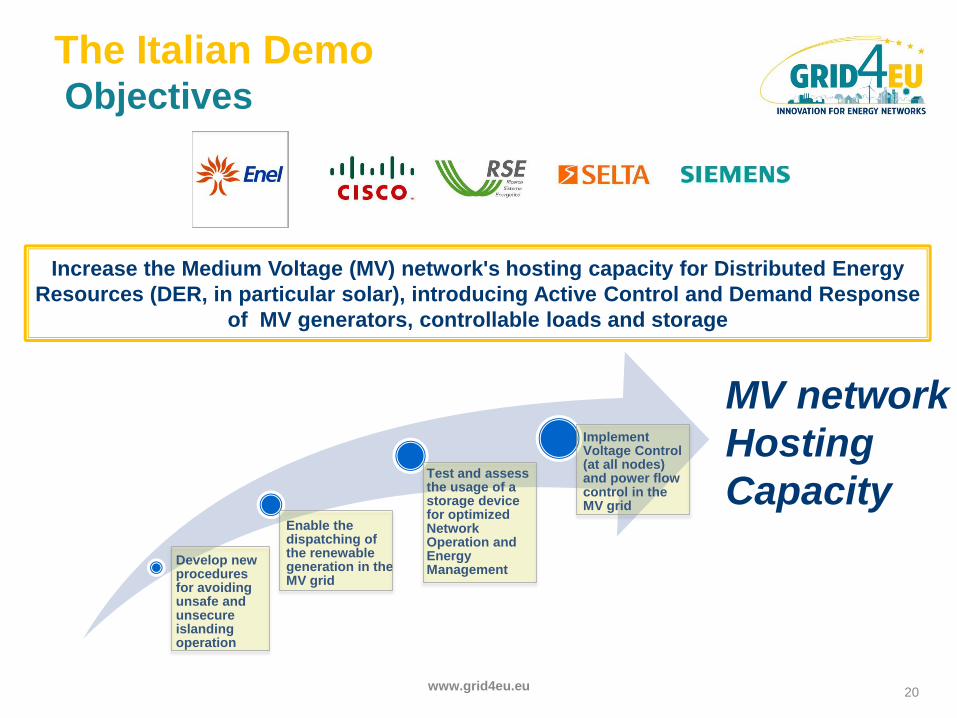
The Italian Demo Objectives
20 www.grid4eu.eu
Increase the Medium Voltage (MV) network's hosting capacity for Distributed Energy
Resources (DER, in particular solar), introducing Active Control and Demand Response
of MV generators, controllable loads and storage
Develop new procedures for avoiding unsafe and unsecure islanding operation
Enable the dispatching of the renewable generation in the MV grid
Test and assess the usage of a storage device for optimized Network Operation and Energy Management
Implement Voltage Control (at all nodes) and power flow control in the MV grid
MV network
Hosting
Capacity
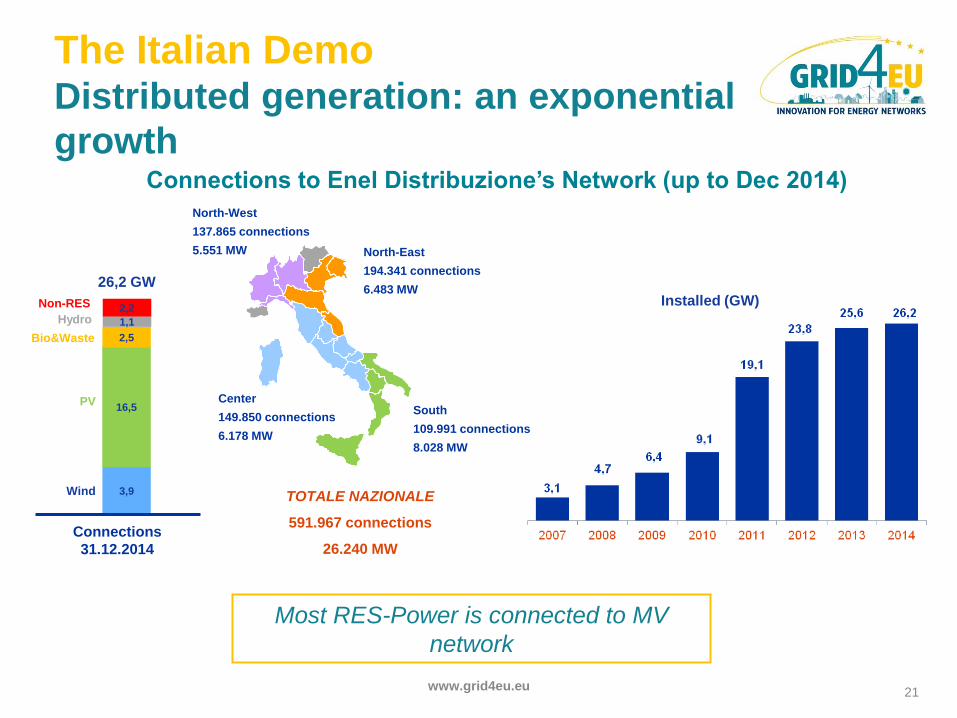
The Italian Demo Distributed generation: an exponential
growth
21
Bio&Waste
PV
Wind
Connections
31.12.2014
3,9
16,5
2,5
North-East
194.341 connections
6.483 MW
South
109.991 connections
8.028 MW
Center
149.850 connections
6.178 MW
North-West
137.865 connections
5.551 MW
TOTALE NAZIONALE
591.967 connections
26.240 MW
1,1 Hydro 2,2 Non-RES
26,2 GW
Installed (GW)
Most RES-Power is connected to MV
network
Connections to Enel Distribuzione’s Network (up to Dec 2014)
www.grid4eu.eu
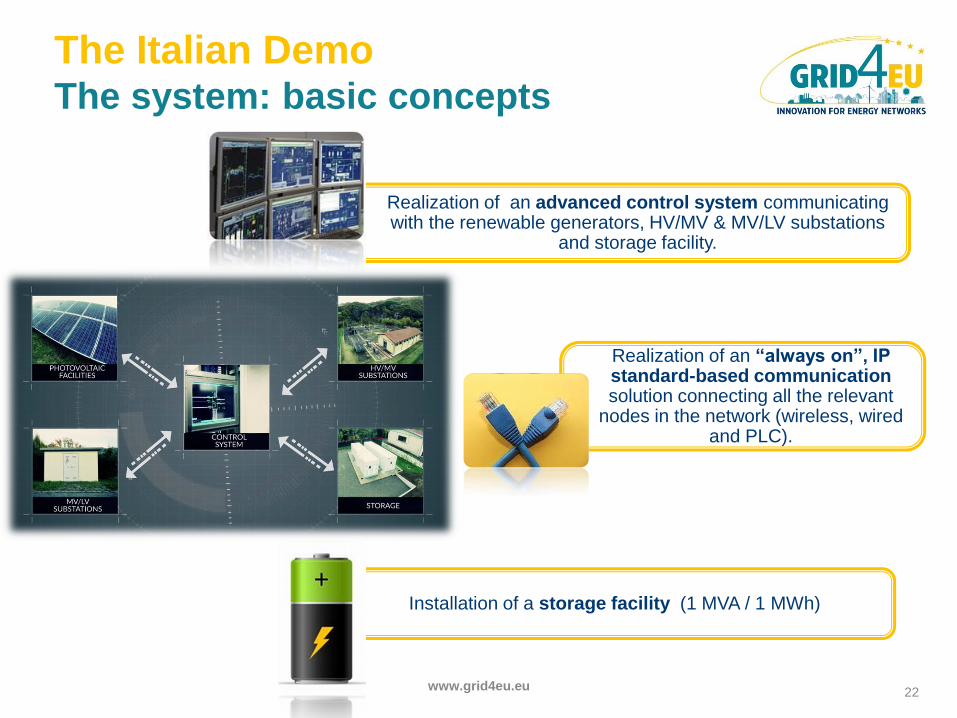
The Italian Demo The system: basic concepts
22
Realization of an “always on”, IP standard-based communication solution connecting all the relevant
nodes in the network (wireless, wired and PLC).
Realization of an advanced control system communicating with the renewable generators, HV/MV & MV/LV substations
and storage facility.
Installation of a storage facility (1 MVA / 1 MWh)
www.grid4eu.eu
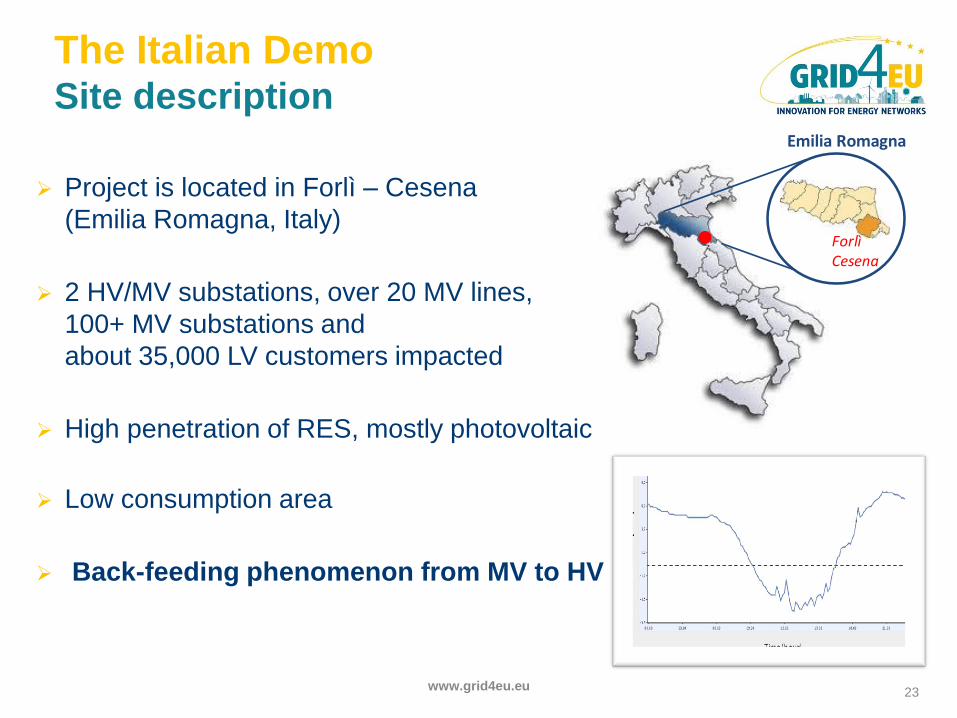
The Italian Demo Site description
23 www.grid4eu.eu
Project is located in Forlì – Cesena
(Emilia Romagna, Italy)
2 HV/MV substations, over 20 MV lines,
100+ MV substations and
about 35,000 LV customers impacted
High penetration of RES, mostly photovoltaic
Low consumption area
Back-feeding phenomenon from MV to HV
Forlì Cesena
Emilia Romagna
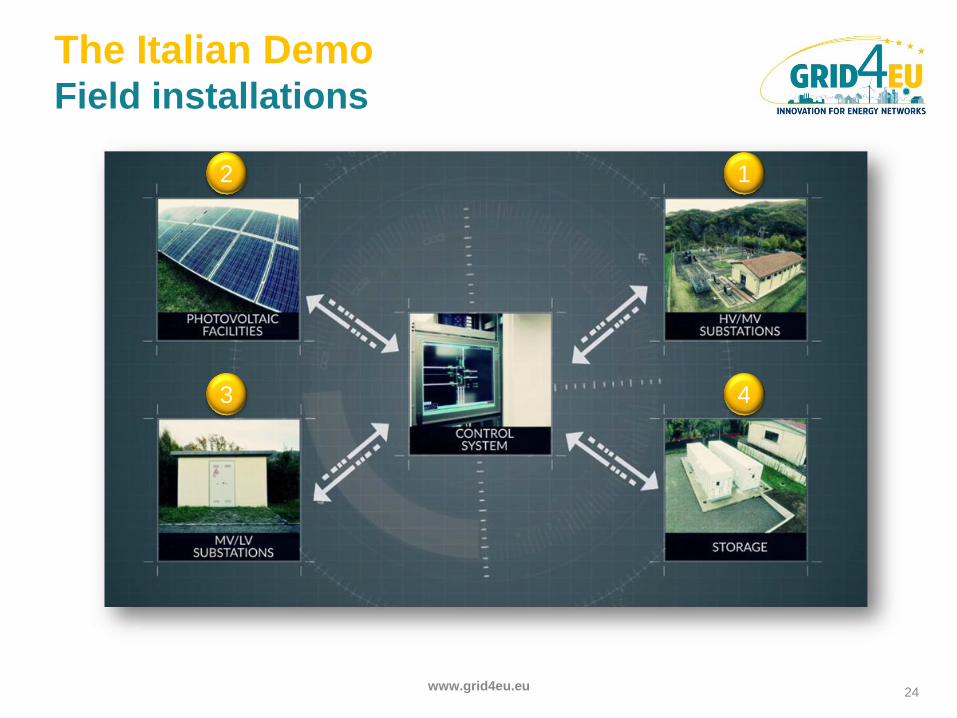
The Italian Demo Field installations
1 2
3 4
24 www.grid4eu.eu
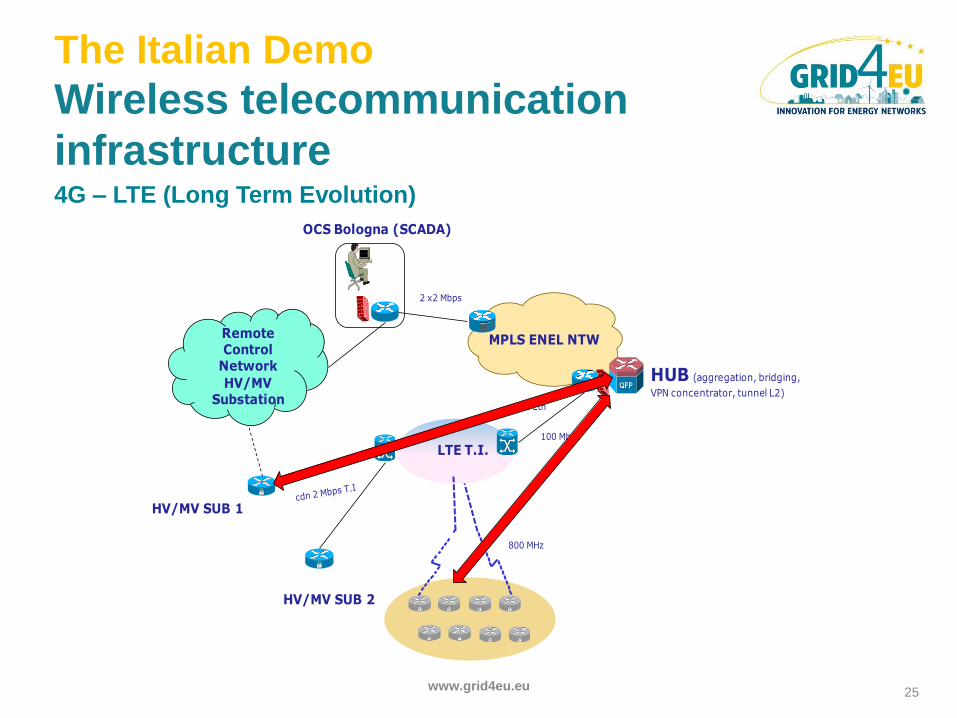
The Italian Demo
Wireless telecommunication
infrastructure 4G – LTE (Long Term Evolution)
MPLS ENEL NTW
100 Mbps
LTE T.I.
HV/MV SUB 2
HUB (aggregation, bridging,
VPN concentrator, tunnel L2)
HV/MV SUB 1
Gb Eth
109 SS+5 DGs
OCS Bologna (SCADA)
2 x2 Mbps
800 MHz
Remote Control
Network
HV/MV Substation
Latency and Bandwidth test
25 www.grid4eu.eu

The Italian Demo
Voltage control (1/2)
MV MV
G
RGDM
G
HV/MV Substation
MV bus-bar
voltage set points
calculated every
15 minutes.
The Network
Calculation
System
calculates the
reactive power
set points for
the generators
Centralised control of
generators, performed
at HV/MV substation
level
Field
measurements
acquisition
REGULATION INTERFACE
MV network
REGULATION INTERFACE
RGDM
RTU
ITP
NCAS
26 www.grid4eu.eu
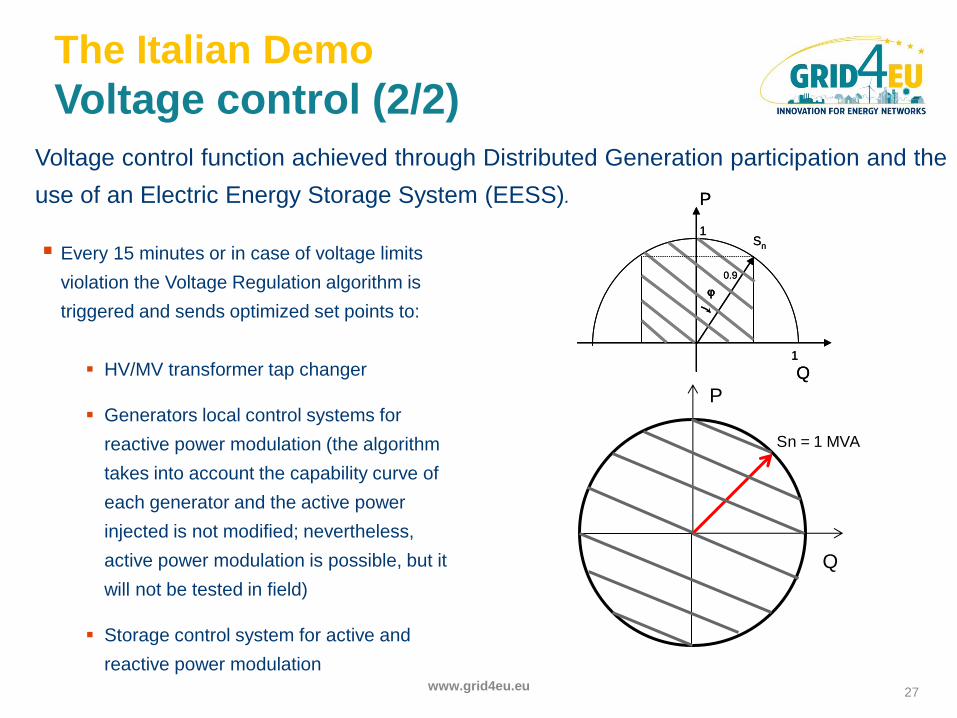
The Italian Demo
Voltage control (2/2)
Every 15 minutes or in case of voltage limits
violation the Voltage Regulation algorithm is
triggered and sends optimized set points to:
HV/MV transformer tap changer
Generators local control systems for
reactive power modulation (the algorithm
takes into account the capability curve of
each generator and the active power
injected is not modified; nevertheless,
active power modulation is possible, but it
will not be tested in field)
Storage control system for active and
reactive power modulation
Voltage control function achieved through Distributed Generation participation and the
use of an Electric Energy Storage System (EESS).
Q
P
1Sn
1
0.9
Q
P
1Sn
1
0.9
P
Q
Sn = 1 MVA
27 www.grid4eu.eu
The Italian Demo
Lessons learnt so far According to the first project results the most beneficial resource -for voltage
regulation and for increasing the Hosting Capacity- is the On Load Tap
Changer of the HV/MV transformer;
Also the use of reactive modulation from generators can be an effective
resource, but –in some cases – it may lead to losses increase;
The Electric Energy Storage System (EESS) is able to contribute effectively to
the voltage regulation; it can help HV-MV power flow control too (according to
EESS capacity);
For the usage of the EESS, the optimization horizon can cover from minutes to
several days (key is the reliability of forecast), with a reasonable computation
time;
The Smart Grids systems rely very much on telecommunication systems,
therefore it is important and necessary to foster “convergence” between
electric distribution and communication infrastructures.
28
www.grid4eu.eu
GRID4EU French Demo
Integrating Renewable Energy using residential, industrial
and grid flexibilities (including storage)
Thomas DRIZARD, ERDF (email address: [email protected])
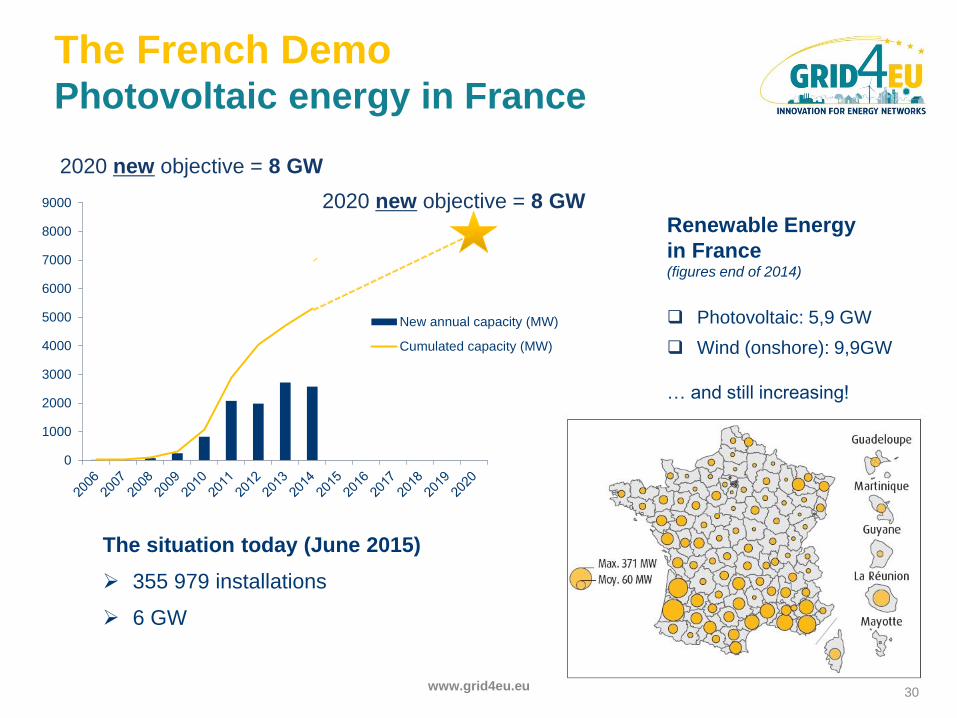
The French Demo Photovoltaic energy in France
Renewable Energy
in France (figures end of 2014)
Photovoltaic: 5,9 GW
Wind (onshore): 9,9GW
… and still increasing!
The situation today (June 2015)
355 979 installations
6 GW
0
1000
2000
3000
4000
5000
6000
7000
8000
9000
New annual capacity (MW)
Cumulated capacity (MW)
2020 new objective = 8 GW
2020 new objective = 8 GW
30 www.grid4eu.eu
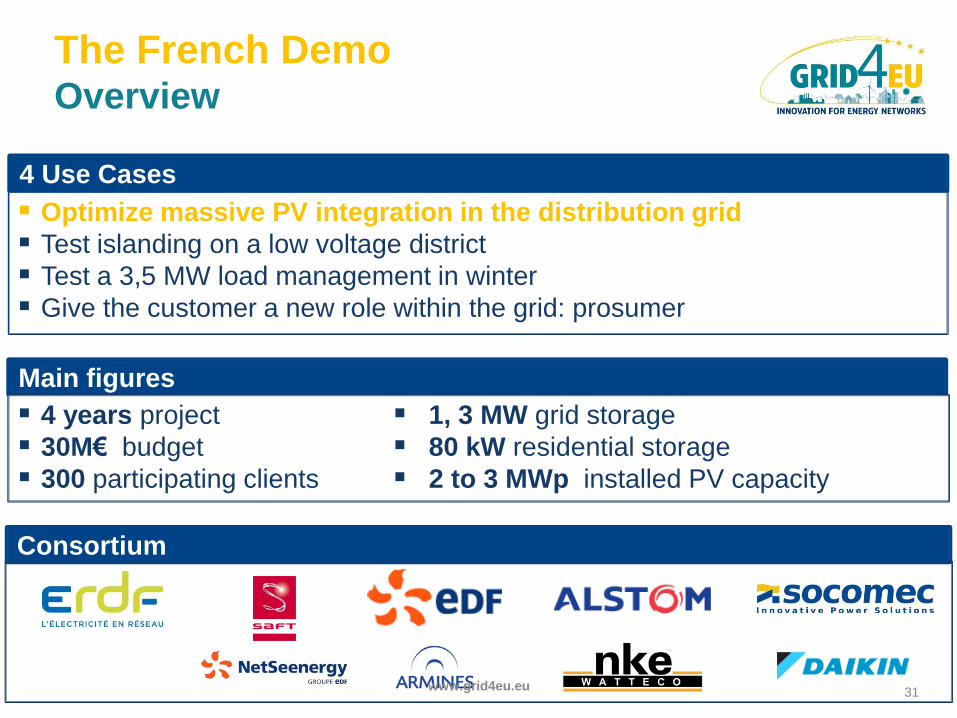
The French Demo Overview
4 Use Cases
Optimize massive PV integration in the distribution grid
Test islanding on a low voltage district
Test a 3,5 MW load management in winter
Give the customer a new role within the grid: prosumer
Main figures
4 years project
30M€ budget
300 participating clients
Consortium
fg
1, 3 MW grid storage
80 kW residential storage
2 to 3 MWp installed PV capacity
31 www.grid4eu.eu
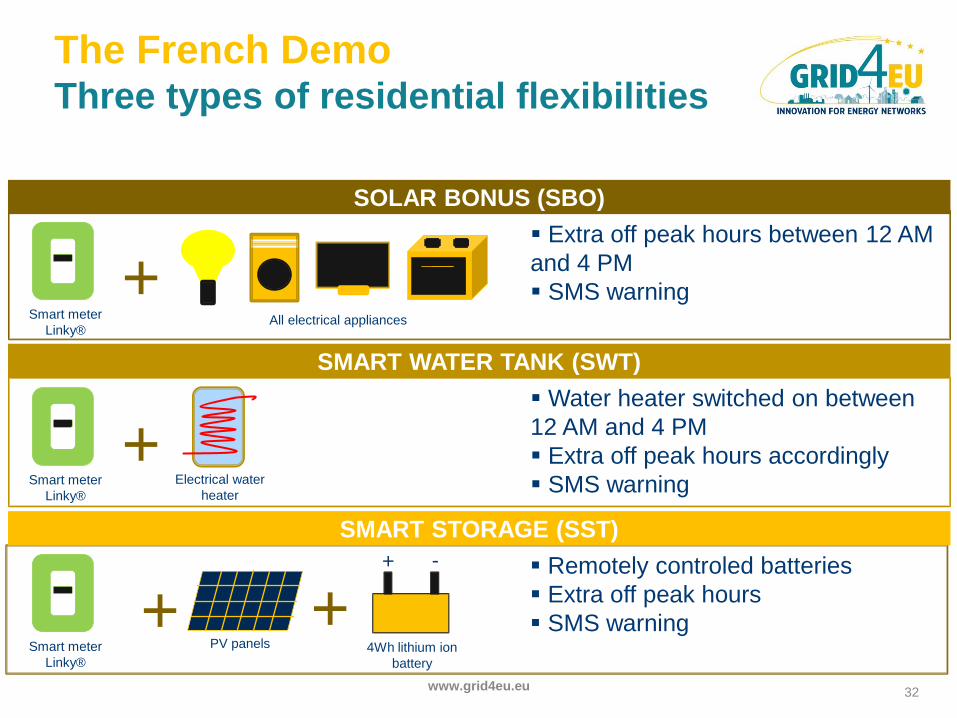
The French Demo Three types of residential flexibilities
+ + Remotely controled batteries
Extra off peak hours
SMS warning
SMART STORAGE (SST)
+ Extra off peak hours between 12 AM
and 4 PM
SMS warning
SOLAR BONUS (SBO)
+
SMART WATER TANK (SWT)
Water heater switched on between
12 AM and 4 PM
Extra off peak hours accordingly
SMS warning
Smart meter
Linky® All electrical appliances
PV panels
+ -
4Wh lithium ion
battery
Smart meter
Linky®
Smart meter
Linky®
Electrical water
heater
32 www.grid4eu.eu
The French Demo 2015 results: solar bonus
0
200
400
600
800
1000
1200
0:0
0
0:5
0
1:4
0
2:3
0
3:2
0
4:1
0
5:0
0
5:5
0
6:4
0
7:3
0
8:2
0
9:1
0
10
:00
10
:50
11
:40
12
:30
13
:20
14
:10
15
:00
15
:50
16
:40
17
:30
18
:20
19
:10
20
:00
20
:50
21
:40
22
:30
23
:20
Wat
t
Jours de sollicitation Jours sans sollicitation hors dimanches et jours fériés
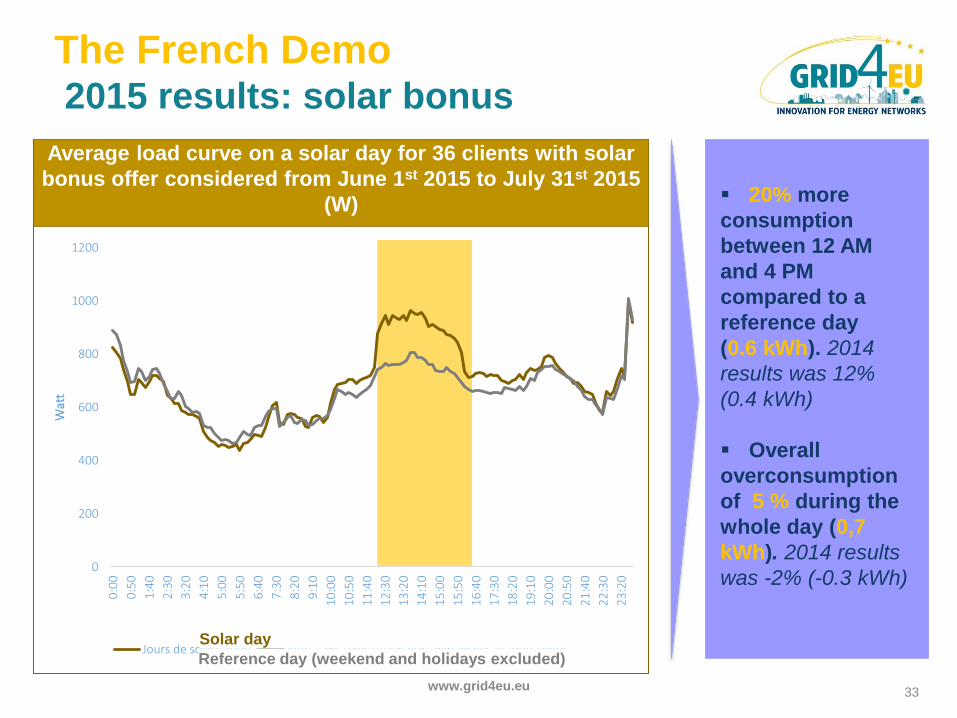
Average load curve on a solar day for 36 clients with solar
bonus offer considered from June 1st 2015 to July 31st 2015
(W)
20% more
consumption
between 12 AM
and 4 PM
compared to a
reference day
(0.6 kWh). 2014
results was 12%
(0.4 kWh)
Overall
overconsumption
of 5 % during the
whole day (0,7
kWh). 2014 results
was -2% (-0.3 kWh)
Solar day
Reference day (weekend and holidays excluded)
33 www.grid4eu.eu

The French Demo 2015 results: smart water tank
0
500
1000
1500
2000
2500
0:0
0
0:5
0
1:4
0
2:3
0
3:2
0
4:1
0
5:0
0
5:5
0
6:4
0
7:3
0
8:2
0
9:1
0
10
:00
10
:50
11
:40
12
:30
13
:20
14
:10
15
:00
15
:50
16
:40
17
:30
18
:20
19
:10
20
:00
20
:50
21
:40
22
:30
23
:20
Watt
Jours de sollicitation : 19, 20 et 24/06 ; 01, 24, 25 et 31/07
Jours sans sollicitation hors dimanches et jours fériés
Average load curve on a solar day for 18 clients with smart
water tank (cascade version) considered from June 1st 2015
to July 31st 2015 (W) Smart water tank
is switched on in
“cascade”: at 12:00,
13:00, 14:00 and
15:00 for 1 to 4 hours
Overconsumption
of 56% compared to a
reference day
(2,4 kWh). 2014 result
was 57% (2,4 kWh)
Overall
overconsumption of
7 % (1,7 kWh). 2014
result was 5% (1,3
kWh)
Solar bonus is also
present
Solar day (19,20,24/06 and 1,24,25,31/07/2015
Reference day (weekend and holidays excluded)
34 www.grid4eu.eu
The French Demo Solar OLTC transformer
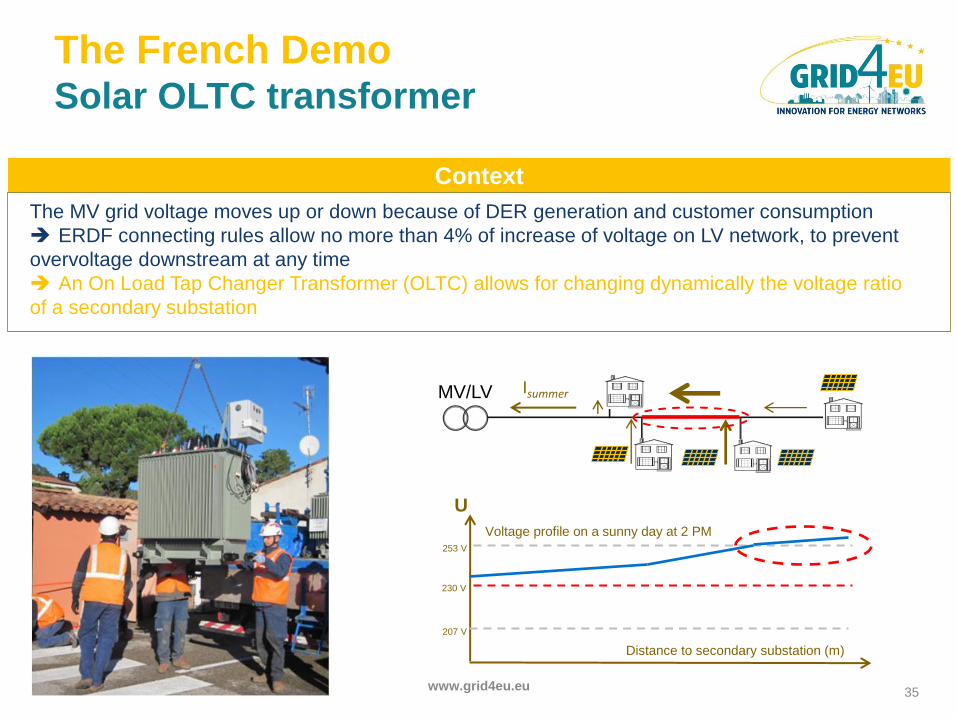
U
230 V
253 V
207 V
Voltage profile on a sunny day at 2 PM
Distance to secondary substation (m)
Isummer MV/LV
The MV grid voltage moves up or down because of DER generation and customer consumption
ERDF connecting rules allow no more than 4% of increase of voltage on LV network, to prevent
overvoltage downstream at any time
An On Load Tap Changer Transformer (OLTC) allows for changing dynamically the voltage ratio
of a secondary substation
Context
35 www.grid4eu.eu
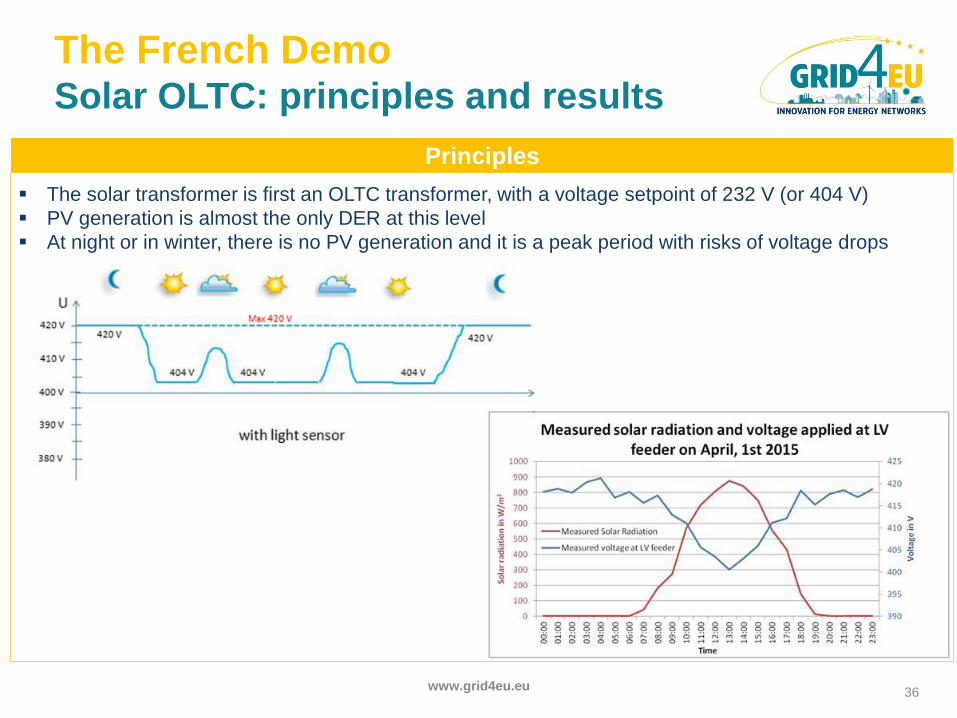
The French Demo Solar OLTC: principles and results
The solar transformer is first an OLTC transformer, with a voltage setpoint of 232 V (or 404 V)
PV generation is almost the only DER at this level
At night or in winter, there is no PV generation and it is a peak period with risks of voltage drops
Principles
36 www.grid4eu.eu
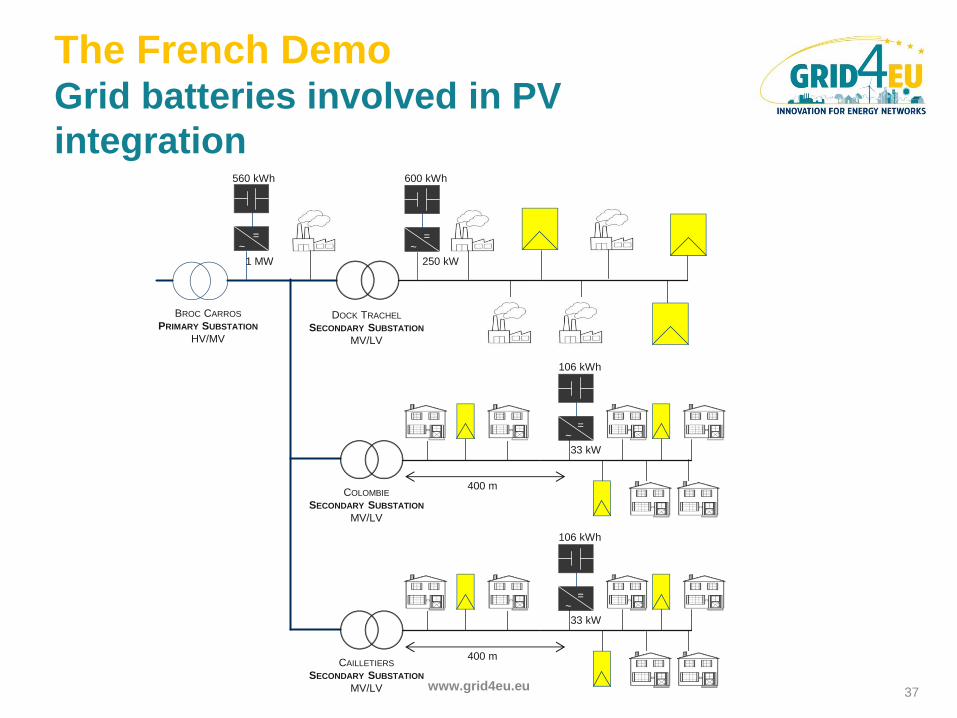
The French Demo Grid batteries involved in PV
integration
=
BROC CARROS
PRIMARY SUBSTATION
HV/MV
~
DOCK TRACHEL
SECONDARY SUBSTATION
MV/LV
= ~
= ~
400 m COLOMBIE
SECONDARY SUBSTATION
MV/LV
560 kWh 600 kWh
106 kWh
1 MW 250 kW
33 kW
= ~
400 m CAILLETIERS
SECONDARY SUBSTATION
MV/LV
106 kWh
33 kW
37 www.grid4eu.eu
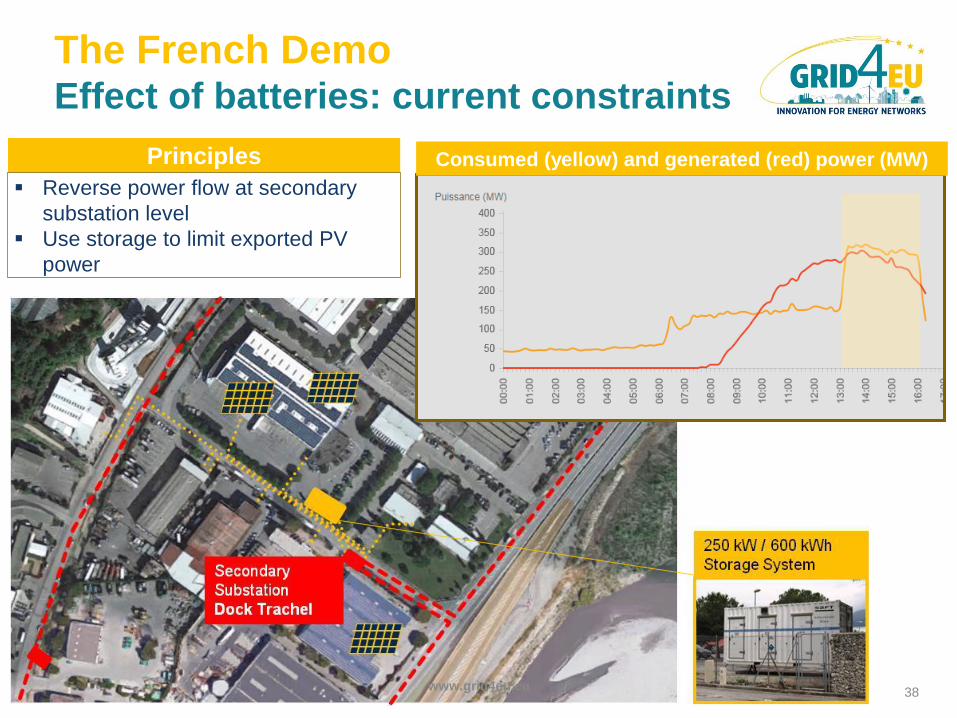
The French Demo Effect of batteries: current constraints
Principles
Reverse power flow at secondary
substation level
Use storage to limit exported PV
power
Consumed (yellow) and generated (red) power (MW)
38 www.grid4eu.eu
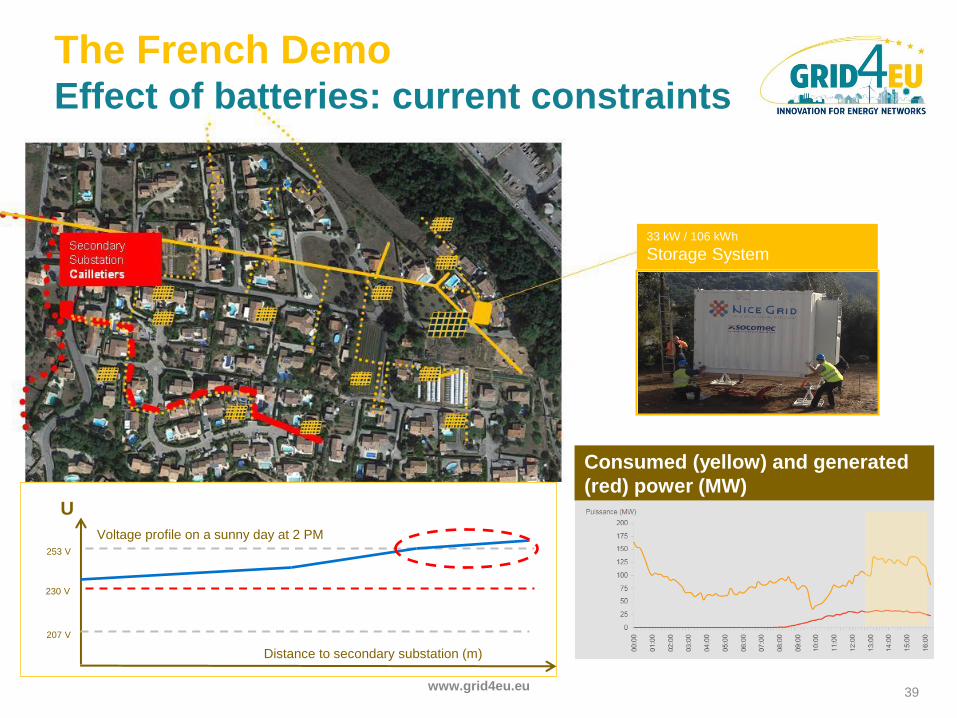
The French Demo Effect of batteries: current constraints
33 kW / 106 kWh
Storage System
Consumed (yellow) and generated
(red) power (MW) U
230 V
253 V
207 V
Voltage profile on a sunny day at 2 PM
Distance to secondary substation (m)
39 www.grid4eu.eu
The French Demo Conclusions and perspectives
Residential clients results are preliminary, and have to be consolidated at the
end of summer
Evolved smart water tank will allow for limiting the peak and extending the
charging duration
Smart transformer is a « plug and play » solution and works dynamically
Grid storage is responsive and efficient, but acts on the three phases with the
same manner, whereas LV grid are desquilibrated
Real time storage management to be implemented by 2016 (light sensor)
Secondary substation able to perform islanding for a few hours: successful
tests in december
40 www.grid4eu.eu
Overall perspectives
To ease the replication of promising approaches developed and tested
in Demos, GRID4EU put the emphasis on transversal activities
In particular, concerning Replication and Scaling-up:
– Accounting for more than 50% of the European metered Energy, GRID4EU
relies on a consistent playground for scaling-up and replication
– The Scalability and Replicabilty Analysis performed within the project already
started benchmarking quantitative technical outcomes and is currently
carrying a wider quantitative analysis including social and regulatory aspects
Final results will be presented in the final deliverables and during the
GRID4EU final event on January 19th, 2016 in Paris
41 www.grid4eu.eu
Thank you for your attention!
Visit our website: www.grid4eu.eu
Have a look on GRID4EU videos: https://www.youtube.com/channel/UCkC
fcwCz4Nze5j6idG-5aWg/videos
All public deliverables are available on
the GRID4EU Website:
http://www.grid4eu.eu/project-
demonstrators/deliverables.aspx
For more information: [email protected]
42 www.grid4eu.eu