grid-connected solar pv project - fiji islands, final project report
TRANSCRIPT

GRID-CONNECTED SOLAR PV PROJECT - FIJI ISLANDS
FINAL PROJECT REPORT
Prepared for the Australian Greenhouse Office (AGO), Canberra, Australia
by the Energy Unit of the South Pacific Applied Geoscience Commission (SOPAC), Suva, Fiji

TABLE OF CONTENTS
Page
1. INTRODUCTION ........................................................................................................................3
2. PROJECT OBJECTIVES..........................................................................................................3
BACKGROUND AND PROJECT DESCRIPTION.................................................................3
4. IMPLEMENTATION .................................................................................................................4
5. RESULTS....................................................................................................................................... 4
3.
6. OBSERVATIONS.......................................................................................................................... 6
7. CONCLUSIONS.......................................................................................................................IO
8. RECOMMENDATIONS............................................................................................................... 10
Annex 1: Fiji Electricity Authority - 10KVA Grid Connect Solar Power System - Installation and Commissioning Report
Annex 2: The FEA Monitoring/Maintenance Checklist
This report has been prepared by the Regional Energy Program based at SOPAC. It provides an overview of the project activities. Both BP Solar and FEA have provided inputs into the preparation of this report and have endorsed its contents. SOPAC took the initiative to start preparing this final report in late 1998 in the absence of BP Solar and FEA fully meeting their final reporting commitments.
2
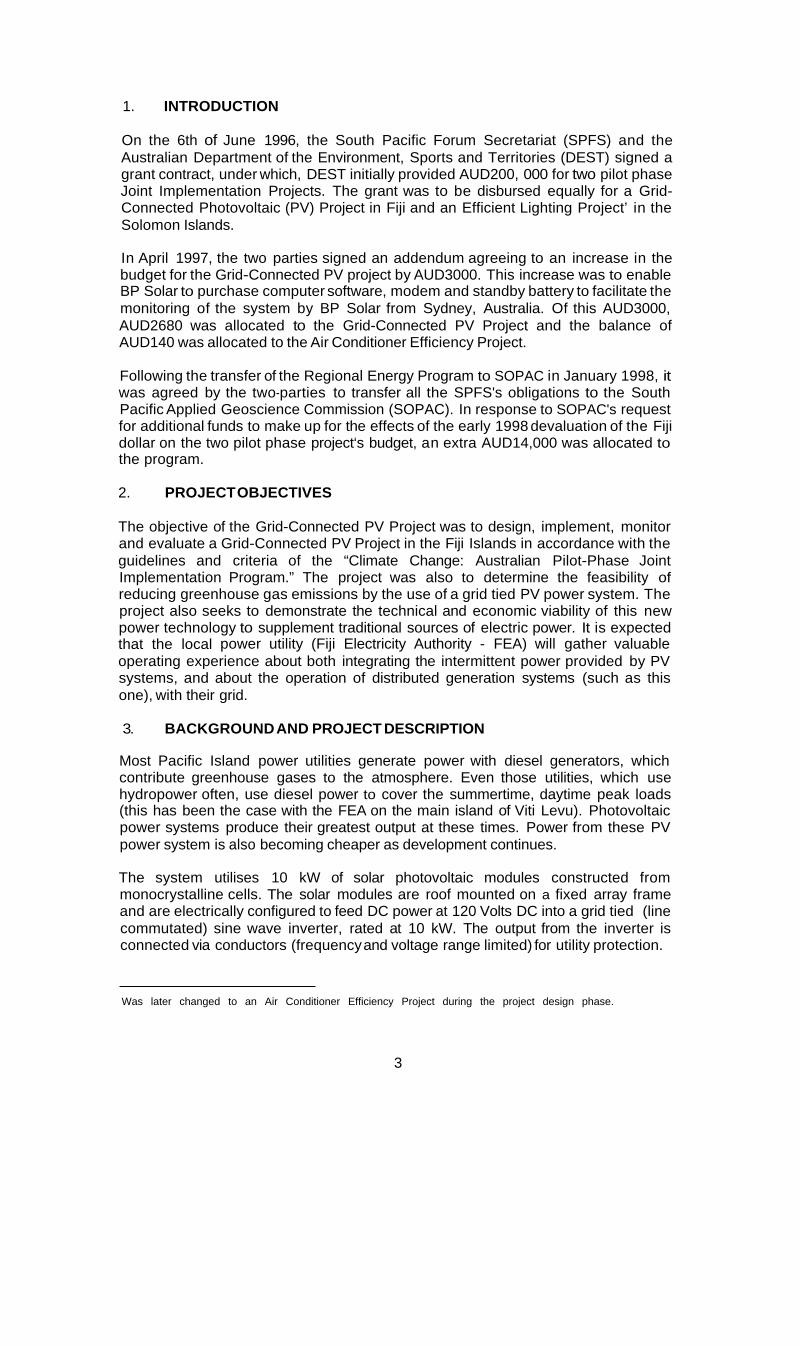
1. INTRODUCTION
On the 6th of June 1996, the South Pacific Forum Secretariat (SPFS) and the Australian Department of the Environment, Sports and Territories (DEST) signed a grant contract, under which, DEST initially provided AUD200, 000 for two pilot phase Joint Implementation Projects. The grant was to be disbursed equally for a Grid- Connected Photovoltaic (PV) Project in Fiji and an Efficient Lighting Project’ in the Solomon Islands.
In April 1997, the two parties signed an addendum agreeing to an increase in the budget for the Grid-Connected PV project by AUD3000. This increase was to enable BP Solar to purchase computer software, modem and standby battery to facilitate the monitoring of the system by BP Solar from Sydney, Australia. Of this AUD3000, AUD2680 was allocated to the Grid-Connected PV Project and the balance of AUD140 was allocated to the Air Conditioner Efficiency Project.
Following the transfer of the Regional Energy Program to SOPAC in January 1998, it was agreed by the two-parties to transfer all the SPFS's obligations to the South Pacific Applied Geoscience Commission (SOPAC). In response to SOPAC's request for additional funds to make up for the effects of the early 1998 devaluation of the Fiji dollar on the two pilot phase project‘s budget, an extra AUD14,000 was allocated to the program.
2. PROJECT OBJECTIVES
The objective of the Grid-Connected PV Project was to design, implement, monitor and evaluate a Grid-Connected PV Project in the Fiji Islands in accordance with the guidelines and criteria of the “Climate Change: Australian Pilot-Phase Joint Implementation Program.” The project was also to determine the feasibility of reducing greenhouse gas emissions by the use of a grid tied PV power system. The project also seeks to demonstrate the technical and economic viability of this new power technology to supplement traditional sources of electric power. It is expected that the local power utility (Fiji Electricity Authority - FEA) will gather valuable operating experience about both integrating the intermittent power provided by PV systems, and about the operation of distributed generation systems (such as this one), with their grid.
3. BACKGROUND AND PROJECT DESCRIPTION
Most Pacific Island power utilities generate power with diesel generators, which contribute greenhouse gases to the atmosphere. Even those utilities, which use hydropower often, use diesel power to cover the summertime, daytime peak loads (this has been the case with the FEA on the main island of Viti Levu). Photovoltaic power systems produce their greatest output at these times. Power from these PV power system is also becoming cheaper as development continues.
The system utilises 10 kW of solar photovoltaic modules constructed from monocrystalline cells. The solar modules are roof mounted on a fixed array frame and are electrically configured to feed DC power at 120 Volts DC into a grid tied (line commutated) sine wave inverter, rated at 10 kW. The output from the inverter is connected via conductors (frequency and voltage range limited) for utility protection.
Was later changed to an Air Conditioner Efficiency Project during the project design phase.
3

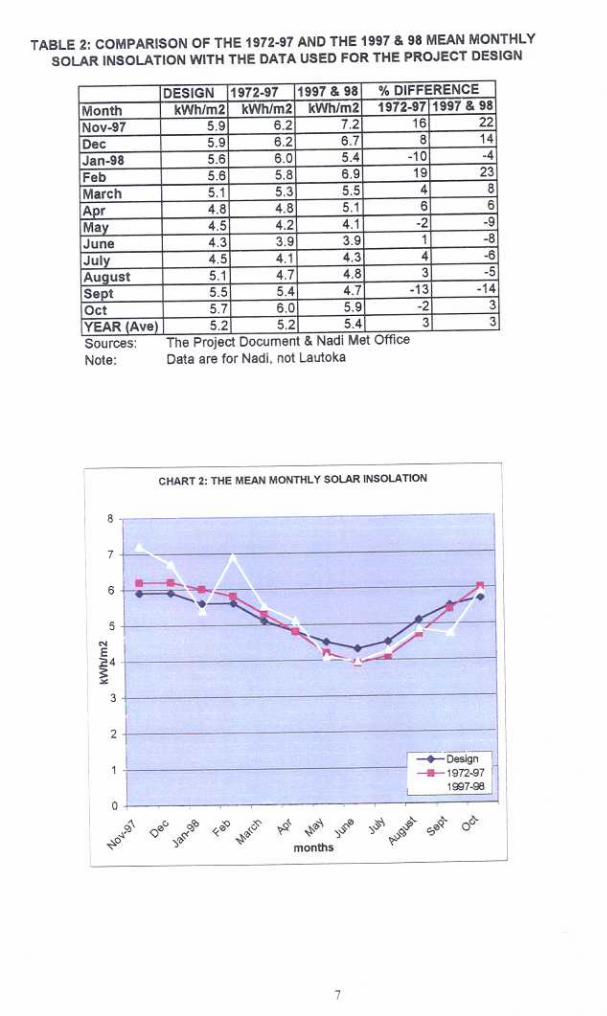
The design of the project was based on the climatic conditions around the project site in the last years. Table 2 shows the mean monthly solar insolation used in the project design. The anticipated weight of CO2 to be mitigated by this project was based on a conversion factor of .75kg per kWh of diesel-generated power. Every kWh produced by the solar array was therefore assumed to have displaced a similar kWh of diesel-generated power and thus the fuel used to produce that kWh.
The FEA Navutu depot at Lautoka was chosen as the project host. This was based mainly on the availability of FEA technical staff to maintain and monitor the project, the availability of a large roof area to hold the solar panels and the easy integration of the DC power into the FEA grid system.
4. IMPLEMENTATION
FEA technicians under the supervisionof a BP Solar engineer carried out installation of the project. On the completion of the installation and the commissioning of the project, BP Solar ran a one-day training workshop with the technical staff of FEA. The Forum Secretariat Energy Division participated in this workshop. The workshop covered a brief description of how the system works, trouble shooting, maintenance and a demonstration of how to download data from the system via the modem. The demonstration was not successful and unfortunately the BP Solar engineer had to leave Fiji without successfully completing this vital component of the project installation and commissioning.
A copy of the installation and the commissioning report is attached as Annex 1.
5. RESULTS
The monitoring of the project was carried out by FEA and commenced following the commissioning, from November 1997. The monitoring has continued up to end of October 1998, which was the period agreed to under the project's MOU. Additionally, BP Solar was also to monitor the performance of the system via the installed modem. FEA monitored the system and has report on its performance on a weekly basis during this period. Annex 2 provides a sample of the form used by FEA for monitoring the system. Besides collecting the readings on the system and checking on its physical condition, FEA also collected climatic data from both Nadi and
Lautoka. This climatic data has been used as a basis to compare the actual outputs from the project with its designed output.
In the preparation of this report, BP Solar has only provided 3 months of data from the monitoring it has carried out via the installed modem. This has been due to an extended period where problems with the modem have prevented downloading of the data remotely and as a consequence records lost. It is understood that the modem has been reprogrammed and properly installed and it has started functioning in February 1999 and records are now being logged.
Climatic Conditions
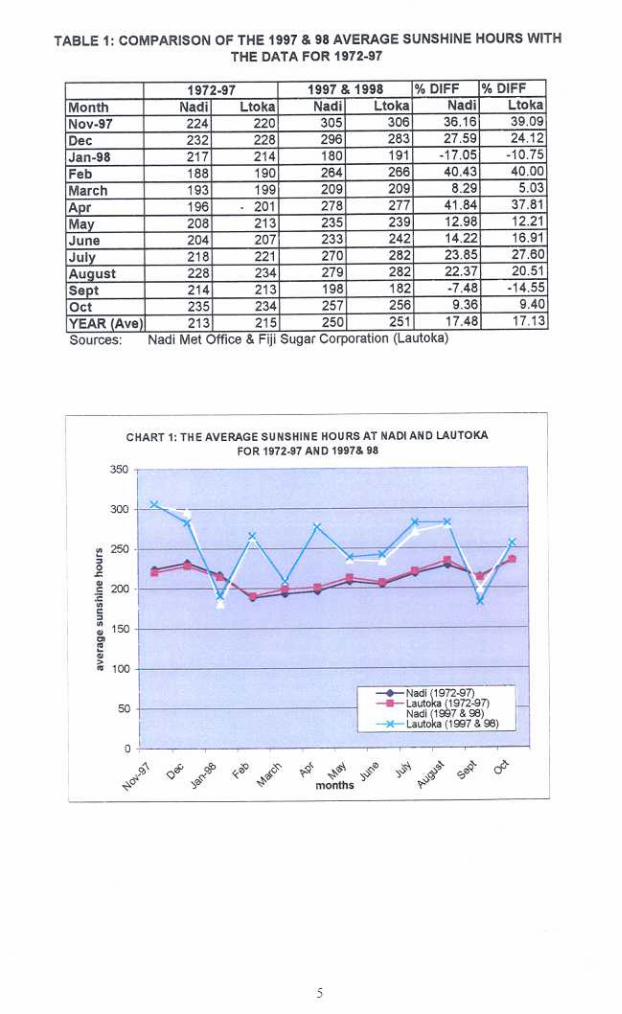
Table 1 and Chart 1 show that on average there were more sunshine hours during the project's monitoring period as compared to the average monthly sunshine hours for 1972-97 used in the design to predict the expected output. It was only in the months of January and September 1998 that the average sunshine hours were lower than the average recorded for 1972-97
4

The data collected on solar insolation, though based on data for Nadi, showed that the actual accumulated solar insolation recorded during the monitoring period was, in total, slightly more favourable than the data, which was used as the basis for the project design. On the twelve months of monitoring, the monitored solar insolation was less than the design data in six of the months. This was most notable in the months of May to September. Table 2 and Chart 2 show the solar insolation condition under which the project has been operating as compared to the basis for the project design.
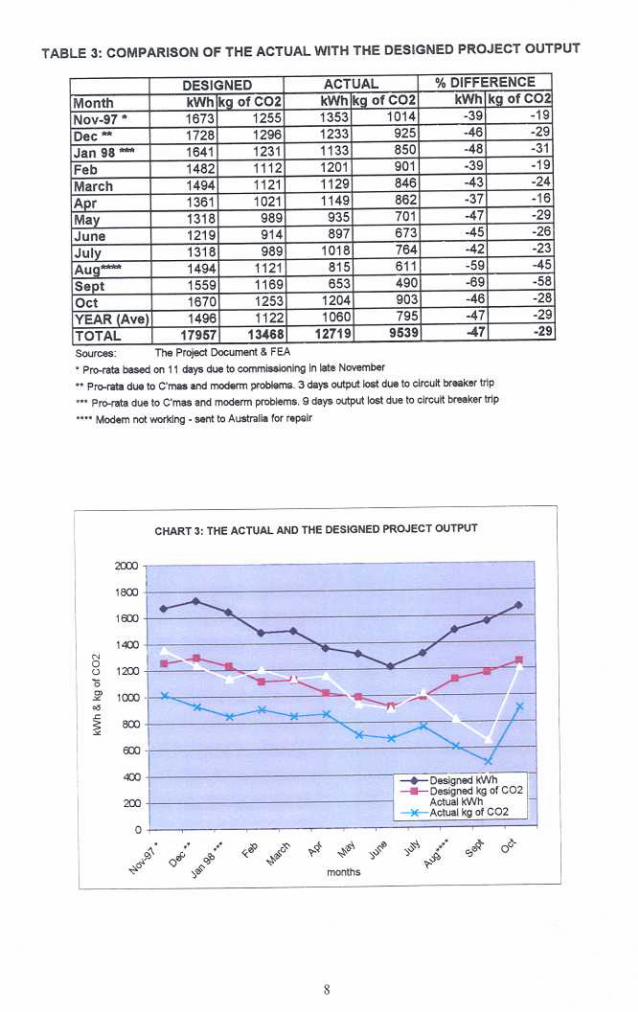
While the climatic conditions for the project have been more favourable than the conditions upon which the project design was based, the project output in terms of the kWh produced and therefore the kg of CO2 mitigated, has been below the expectations from the project. Table 3 and Chart 3 show that the output from the project has been less than its designed output during all the months of monitoring.
Based on the climatic data collected and the monitoring reports from FEA, there are strong reasons to believe that the under-performance of this project is due to technical issues which could have been resolved had the project been designed and managed diffrently. The unavailability of a complete set of data monitored remotely by BP Solar has not enabled a full diagnosis of the project. In the first instance this data could have been productively used to verify the data collected by FEA. The technical and managerial issues that surrounded the performance of this project are discussed under Observations in Section 6.
Based on a project cost of AUD102860 and 9539 kg of CO mitigated during the monitoring period, the cost per kg of CO mitigated is AUD10.78. It is likely that this cost could be significantly seduced with a much larger project.
6. OBSERVATIONS
While the project has performed below its designed level of output, it is also obvious that this failure is largely administrative in nature. This has been brought about by the manner in which the project has been designed and implemented. The following are identified as some of the major areas that should have been addressed in the design and implementation of the project:
The need for the project to have originated from its recipients
While it is appreciated that this only a pilot demonstration project, that in itself should not weaken the critical need that the recipients of the project should clearly identify that this project is a reflection of one of their priority needs and thus their commitment to the project.
In this project, it is obvious that it was not a reflection of some priority strategies for FEA. The project was successful in getting FEA to agree to it and therefore their endorsement of the project's MOU but on FEA's side it appeared not to be a high priority project for them.
Nadi is more than 5 km from the project site and is not considered significant, as the weather patterns in each location are typically similar. This is the actual amount paid to BP Solar. It does not include SOPAC's project management and coordination costs.
6

The need for the project to actually demonstrate that it would be of significant direct benefit to its recipients and thus the sustainability of the project
The recipient of the project was FEA and the potential benefit from this project (10 kW) was insignificant as compared to the scale of the power generation at the project site. At the project site, it would not make any difference to FEA whether the project worked or not. The lack of commitment by FEA to the monitoring, maintenance and the reporting on this project was therefore a direct reflection of how significant the project has been to its operations. This can be compared to an arrangement where the project is located at a site where the project's power output would constitute the major power supply to a community. Such an arrangement would have kept FEA strongly committed to the project since power has to be supplied to the community and secondly, the community would strongly participate if there were certain roles for them to play.
The need for the equipment to be supplied on an open competitive tender based on a emission reduction project at the actual project site
The supply of equipment to this project was done on an open, competitive tender basis, however, it was not based on the exact project site. An early determination of the exact project site would have provided some useful guiding information as to who would the consultant be working with, the major pre-occupation at the project site and the magnitude of the project as compared with that at the host site. These should have provided bidders with some ideas as to the risks they will be facing and therefore adjust their costing accordingly. The problems with the modem existed for an extended period of time, yet, it was noted that a technician from BP Solar was not sent to the project site to quickly sort out the problems. This is partly due to the absence of a budget line that would allow for trouble shooting and meeting such monitoring costs from this project budget line.
No arrangement to enforce product warranties
The project cost (more than 90%) was mostly in the supply of hardware. Any hardware-based project should have taken all necessary steps to ensure that the supplier is bound by the technical specifications of its products, at least during the monitoring period. This was absent from the implementation of this project.
Relate the supplier's contract to the project output
This project was to determine the feasibility of reducing greenhouse gas emissions by the use of grid tied PV power systems. It was to prove that a piece of technology could produce a designed output under certain climatic conditions. Since the onus is on the technology to provide the designed output, the financial renumeration of the supplier (who in this project was also the installer) should have been tied to the performance of his installed products.
9

7. CONCLUSIONS
This project has demonstrated that power from a renewable energy source such as solar can be fed into a power system that produces power from conventional means such as diesel generators and hydropower. With the appropriate project size and site, the affected recipient community and the host organization (the power utility) could better appreciate the impacts of this type of project.
PV grid connected projects are technically capable of reducing fossil fuels that are used for power generation and therefore it could be used as a tool for mitigating climate change. The cost per kg of CO2 mitigated may appear to be high, but for a larger scale project which is supplied and installed on an open and cost competitive basis based on the actual project site and which contract renumeration is tied to the project output costs could be significantly reduced.
8. RECOMMENDATIONS
Based on the experience with this project, the following recommendations are made:
(i) that FEA and BP Solar continue to monitor the project for a further 12 months to allow a comparison of the FEA and the BP Solar data and to properly assess the technical performance of the equipment supplied. BP Solar has verbally indicated its interest and is prepared to continue with the monitoring of the project;
that future projects of this nature be based on open competitive bids where the exact project site is known and that renumeration be based on project system against design output; and
that future projects of this nature be managed and monitored by people (or their representatives) whom the project would be of significant benefit to.
(ii)
(iii)
10

Annex 1
FIJI ELECTRICITY AUTHORITY
10kVA GRID CONNECTSOLAR POWER SYSTEM
INSTALLATION AND COMMISSIONING REPORT
Introduction
The objective of the project is to design, implement, monitor and evaluate a grid connected photovoltaic project in the Fiji Islands in accordance with the guidelines and criteria of the “Climate Change: Australian Pilot-Phase Joint Implementation Program”.
The project will also determine the feasibility of reducing greenhouse gas emissions by the use of grid connected photovoltaic (PV) power systems, whilst at the same time demonstrating the technical and economic viability of this new power technology to supplement traditional sources of electric power.
(Memorandum of Understanding - Pilot-Phase Joint Implementation Projects in the Pacific Islands South Pacific Forum Secretariat - 13th March 1997)
The FEA 10kVA grid connect solar power system is designed to provide a maximum of 10kVA of 240V, 50Hz electricity into the local electricity grid. Under normal operating conditions the system is fully automatic and requires minimal operator input.
Installation
Installation of the 10kVA system was carried out by BP Solar Australia electrician Peter Bradfield and a number of FEA employees. The installation of the system commenced Monday 20th October and was completed on Friday 24th October.
The installation was carried out in three stages. The three stages and the approximate installation time are detailed below:
. Installation of the roof mounted unistrut frame (2.0 day),
. Installation and electrical connection of the solar laminates (2.5 day),
. Installation of the solar array dc isolation panel, interconnection protection panel and inverter (0.5 day).
Four of the unistrut sections had been damaged during transport to Fiji and the unistrut frame layout was modified slightly to cater for this. BP Solar Australia will review the method of packing used for the unistrut sections to alleviate this problem in the future.
During installation one solar laminate was damaged and was replaced with one of the spares. Given the number of solar laminates installed and their fragile nature (without an aluminium frame), damaging only one laminate clearly demonstrates the ability of the installation team.
Project drawings have been up dated to detail the “as built“ system. The updated drawings are included in the appendix of this report.
11

Commissioning
Commissioning of the system was carried out by BP Solar Australia engineer Stuart Morrall on Thursday 20th November. Assistance in the commissioning was provided by FEA staff.
Training for Forum Secretariat and FEA staff was carried out on Friday 21st November.
Commissioning of the system was carried out in four stages:
l Inspection of the system to ensure correct installation, . Completion of minor electrical connections, namely solar array connections in the
inverter and connectionofthe reference cell, l Testing and commissioning of the system as per the commissioning procedure, . Testing of the remote data acquisition capability.
Electrical Connections
The circuit breaker isolating the inverter from the grid had been installed in the interconnection protection panel and incorrectly wired. This circuit breaker should have been installed on the main switchboard to allow complete isolation from the grid was available.
The connection to the grid is made via this circuit breaker and a separate isolation switch on the switchboard. Complete isolation from the grid is achieved by operating the isolation switch on the switchboard.
FEA staff rewired t he incorrectly wired circuit breaker and were instructed that the isolation switch on the switch board was to be used to isolate the system from the grid when necessary.
The reference cell was initially connected to the incorrect analogue terminals. This can be seen on the retrieved data as incorrect “array kWh". The reference cell was connected to the correct terminals late Friday 21st November.
Commissioning and Testing
The system was tested for operation during simulated failure of the grid by isolating itself from the grid and then reconnecting and sychronising when the grid was re- energised.
The operation of the inverter with the FEA back up generator was tested. The grid supply to the main switchboard was removed and replaced with the back up generator. The system operated correctly by disconnecting itself from the switchboard when the mains was removed and then reconnecting and synchronising to the generator after it had been running for at least 1 minute.
The inverter was seen to operate correctly at all times.
12
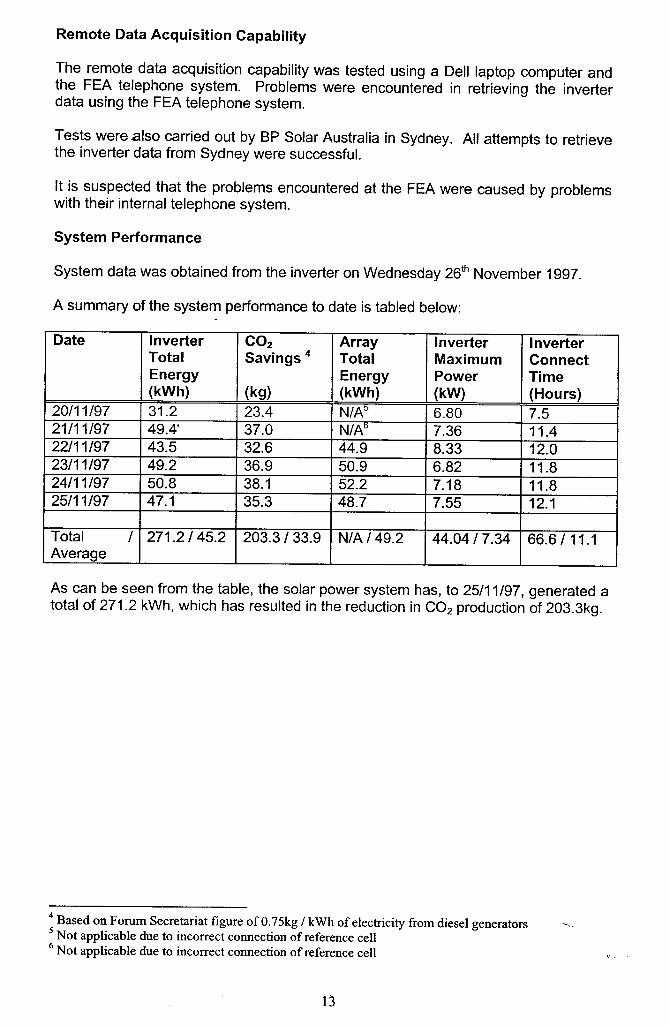
Remote Data Acquisition Capability
The remote data acquisition capability was tested using a Dell laptop computer andthe FEA telephone system. Problems were encountered in retrieving the inverterdata using the FEA telephone system.
Tests were also carried out by BP Solar Australia in Sydney. All attempts to retrievethe inverter data from Sydney were successful.
It is suspected that the problems encountered at the FEA were caused by problemswith their internal telephone system.
System Performance
System data was obtained from the inverter on Wednesday 26th November 1997.
A summary of the system performance to date is tabled below:
Date Inverter CO2 Array Inverter InverterTotal Savings 4 Total Maximum Connect
Energy Energy Power Time(kWh) (kg) (kWh) (kW) (Hours)
20/11/97 31.2 23.4 N/A" 6.80 7.521/11/97 49.4' 37.0 N/Au 7.36 11.422/11/97 43.5 32.6 44.9 8.33 12.023/11/97 49.2 36.9 50.9 6.82 11.824/11/97 50.8 38.1 52.2 7.18 11.825/11/97 47.1 35.3 48.7 7.55 12.1
Total 1 271.2/45.2 203.3/33.9 N/A 1 49.2 44.04/7.34 66.6/11.1
Average
As can be seen from the table, the solar power system has, to 25/11/97, generated atotal of 271.2 kWh, which has resulted in the reduction in CO2 production of 203.3kg.
4 Based on Forum Secretariat figure of O. 75kg / kWh of electricity from diesel generators 5 Not applicable due to incorrect connection of reference cell
6 Not applicable due to incorrect connection of reference cell '.'
13
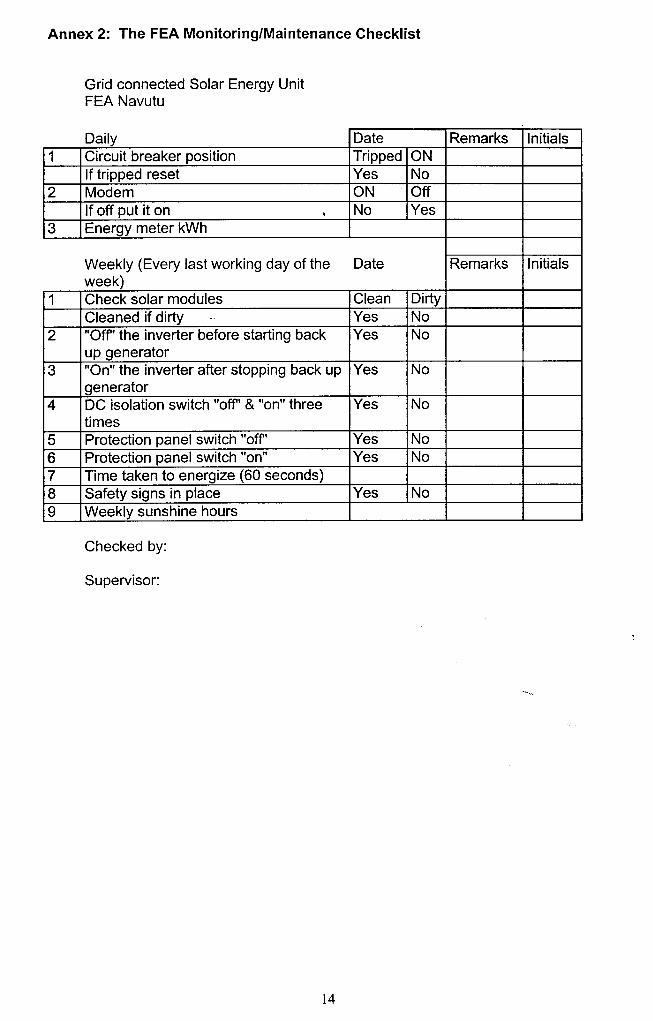
Annex 2: The FEA Monitoring/Maintenance Checklist
Grid connected Solar Energy UnitFEA Navutu
Daily Date Remarks Initials1 Circuit breaker position Tripped ON
If tripped reset Yes No2 Modem ON Off
If off put it on .No Yes3 Energy meter kWh
Weekly (Every last working day of the Date Remarks Initials
week)1 Check solar modules Clean Dirty
Cleaned if dirty -Yes No2 "Off' the inverter before starting back Yes No
up generator3 "On" the inverter after stopping back up Yes No
generator4 DC isolation switch "off' & "on" three Yes No
times5 Protection panel switch "off' Yes No6 Protection panel switch "on" Yes No7 Time taken to energize (60 seconds)8 Safety signs in place Yes No9 Weekly sunshine hours
Checked by:
Supervisor:
,
14