greif 2016 investor day
TRANSCRIPT

Greif 2016 Investor Day
June 24, 2016

Page 2
SAFETY BRIEFING
You are here
Exit
Exit
Page 3
FORWARD-LOOKING STATEMENTS
• All presentations contain certain forward-looking information within the meaning of the Private Securities Litigation
Reform Act of 1995. The words “may,” “will,” “expect,” “intend,” “estimate,” “anticipate,” “aspiration,” “objective,”
“project,” “believe,” “continue,” “on track” or “target” or the negative thereof and similar expressions, among others,
identify forward-looking statements. All forward looking statements are based on information currently available to
management. Such forward-looking statements are subject to certain risks and uncertainties that could cause
events and the Company’s actual results to differ materially from those expressed or implied. Please see the
disclosure regarding forward-looking statements immediately preceding Part I of the Company’s Annual Report on
the most recently filed Form 10-K. The company assumes no obligation to update any forward-looking statements.
REGULATION G
• These presentations may include certain non-GAAP financial measures like EBITDA and other measures that
exclude special items such as restructuring and other unusual charges and gains that are volatile from period to
period. Management of the company uses the non-GAAP measures to evaluate ongoing operations and believes
that these non-GAAP measures are useful to enable investors to perform meaningful comparisons of current and
historical performance of the company. All non-GAAP data in the presentation are indicated by footnotes. Tables
showing the reconciliation between GAAP and non-GAAP measures are available at the end of this presentation
and on the Greif website at www.greif.com.
SAFE HARBOR

Page 4
SUMMARY LEVEL AGENDA
Topic Presenter
Greif overview and strategy Pete Watson, President and CEO
Paper Packaging & Services Tim Bergwall, Division President, PPS and Soterra
Flexible Products & Services Hari Kumar, Division President, FPS
Question / Answer session #1
Rigid Industrial Packaging & Services –
Europe, Middle East and Africa
Michael Cronin, Group President, RIPS EMEA and APAC
Rigid Industrial Packaging & Services –
Asia Pacific
Chester Tsai, Division President, RIPS APAC
Rigid Industrial Packaging & Services –
Americas
Ole Rosgaard, Division President, RIPS Americas
Financial Review Larry Hilsheimer, Executive Vice President and CFO
Question / Answer session #2
Closing comments Pete Watson, President and CEO

Greif overview and
strategy
Pete Watson
President and Chief Executive Officer

Page 6
WELCOME AND THANK YOU FOR JOINING TODAY
OBJECTIVES FOR INVESTOR DAY:
Introduce Greif’s leadership team to you
Provide an update on the Transformation process and confirm our 2017
commitments
Address the questions and feedback you have about the state of our
business
1
2
3

Page 7
GREIF’S INVESTMENT THESIS
Best customer
service
company in
industrial
packaging
Mitigate risk
through a
diverse, global
portfolio
Comprehensive
packaging
provider, with
leverage to the
industrial
economy
Reliable
earnings and
cash flow
generation
Share price
growth and
substantial and
secure dividend
yield1
1According to Goldman Sachs, Greif’s dividend yield places it in the 96th percentile of companies ranked by dividend yield in the S&P 500 (data as of March 31, 2016)
Undergoing Transformation to regain market credibility and improve operations

Page 8
A GLOBAL LEADER IN INDUSTRIAL PACKAGING
Rigid Industrial
Packaging &
Services
2015 Revenue:
$2,586M
Paper Packaging
& Services
2015 Revenue:
$676M
Flexible Products
& Services
2015 Revenue:
$323M
Land
Management
2015 Revenue:
$32M
Founded in 1877 - Diversified Business with a Global Platform

Page 9
GREIF’S PATH TO TRANSFORMATION
• Embarked on
Transformation
process
• Completed
portfolio review
• Held Greif’s first
Investor Day
• Published 2017
Transformation
commitments
New direction:
• New leadership
• Customer service
excellence
• Execution discipline
2015 2016 2017
($M)RUN RATE
COMMITMENTS
Net Sales $3,500
Gross Profit $720 - $730
SG&A $345 - $355
Operating Profit
Before Special
Items1
$365 - $385
Free Cash Flow2 $205 - $225
1Operating Profit Before Special Items (OPBSI). Special items include restructuring charges, acquisition-related costs, timberland gains, non-cash asset impairment charges and gain or loss on disposal of properties, plants, equipment and businesses, net.2Free cash flow is defined as net cash provided by operating activities less cash paid for capital expenditures.
2017 Transformation OPBSI Commitment is intact and updated only for F/X change

Page 10
GREIF’S VISION AND STRATEGIC PRIORITIES
VISION:
In Industrial Packaging, be the best
performing customer service
company in the world
Three strategic priorities:
Building teams aligned to value
delivery
Customer service excellence
Achieving transformational
performance
1
2
3
Highly
engaged and
productive
employees…
Provide a
differentiated
experience…
That drives
loyalty, growth
and
profitability
Engaged
Teams
Delighted
Customers
Profitable
Growth
Our vision is founded in the service-profit chain

Page 11
0% 5% 10% 15% 20% 25%
Customer ratings
Productivity
Profitability
Gallup survey findings: Higher
engagement leads to better
performance1
1Gallup’s 2015 State of the American Manager report. The chart highlights the differences between businesses with top and bottom quartile engagement scores.
PRIORITY ONE: ENGAGED TEAMS
• New leadership team
• Colleague engagement
• Culture of accountability with incentives
aligned to value creation
Engaged
Teams
Delighted
Customers
Profitable
Growth
Our vision is founded in the service-profit chain

Page 12
0 25 50 75 100
RIPS
FPS
PPS
Q1 2015 Q2 2016
PRIORITY TWO: CUSTOMER SERVICE EXCELLENCE
Greif Customer Satisfaction Index (CSI)
PassivesDetractors Promoters
12 36 522016
Greif Global Net Promoter Score (NPS)
1Putting the Service Profit Chain to Work, Harvard Business Review, July – August 2008
• Performance metrics
o Customer Satisfaction Index
o Net Promoter Score
• Studies indicate direct correlation to an
increase in customer loyalty to profitable
growth1
Our vision is founded in the service-profit chain
Engaged
Teams
Delighted
Customers
Profitable
Growth

Page 13
PRIORITY THREE: TRANSFORMING PERFORMANCE
• Optimize and strengthen the portfolio
• Expanding margins through fundamental operating improvements
• Fiscal discipline
Engaged
Teams
Delighted
Customers
Profitable
Growth

Page 14
PRIORITY: TRANSFORMING PERFORMANCE
• 22 divestitures and 13 closed operations
• Targeted growth:
o 21% volume growth – global Intermediate Bulk Containers (IBC)1
o 28% revenue growth – Paper Packaging specialty products1
• New facilities:
o Germany IBC/reconditioning plant
o Saudi Arabia steel drum plant
o CorrChoice sheet feeder
1H1 2016 vs H1 2014
Optimize and strengthen the portfolio
Great progress made on the Transformation commitments
Engaged
Teams
Delighted
Customers
Profitable
Growth

Page 15
PRIORITY: TRANSFORMING PERFORMANCE
• 19.6% = Trailing four quarter gross profit margin
• Disciplined execution of commercial excellence, supply chain and operational
excellence
• Pursuing quality of market share over quantity and enhancing product mix for
profitability
Great progress made on the Transformation commitments
Expanding margins through fundamental operating improvements
Engaged
Teams
Delighted
Customers
Profitable
Growth

Page 16
PRIORITY: TRANSFORMING PERFORMANCE
• 2X improvement1 in anticipated Free Cash Flow between 2015 and 2016
• $84M reduction in SG&A between 2014 and 2015, $30-$35M reduction in 2016
• Cost control mechanisms implemented for sustainability
1Assumes midpoint of 2016 free cash flow outlook of $130M -$160M. Free cash flow is defined as net cash provided by operating activities less cash paid for capital expenditures.
Great progress made on the Transformation commitments
Fiscal discipline
Engaged
Teams
Delighted
Customers
Profitable
Growth

Page 17
GREIF’S VISION AND STRATEGIC PRIORITIES
VISION:
In Industrial Packaging, be the best
performing customer service
company in the world
Three strategic priorities:
Building teams aligned to value
delivery
Customer service excellence
Achieving transformational
performance
1
2
3
Highly
engaged and
productive
employees…
Provide a
differentiated
experience…
That drives
loyalty, growth
and
profitability
Engaged
Teams
Delighted
Customers
Profitable
Growth
Our vision is founded in the service-profit chain

Tim Bergwall
Division President
Paper Packaging & Services

Page 19
PAPER PACKAGING: UNIQUE, SUSTAINABLE BUSINESS MODEL
PPS’ strategic goals:
Balanced growth between mills
and converting operations
Reshape portfolio through
growth in specialty products
Expand service and customer
support capabilities
Focus on people development
and continuous improvement
teams
1
2
3
4
PPS
Highly
engaged and
productive
employees…
Provide a
differentiated
experience…
That drives
loyalty, growth
and
profitability
Engaged
Teams
Delighted
Customers
Profitable
Growth

Page 20
PAPER PACKAGING: UNIQUE, SUSTAINABLE BUSINESS MODEL
A non-conflict partner to the entire
corrugated packaging industry…Sheet Feeder Sales
Sheet
Plants
66%
Corrugator
Plants
34%Go to Market Model
PPS
Engaged
Teams
Delighted
Customers
Profitable
Growth

Page 21
PAPER PACKAGING: CUSTOMER SERVICE EXCELLENCE
18 81PPS
Customer Satisfaction Index (CSI) scores
0
25
50
75
100
Q1 2
015
Q2 2
015
Q3 2
015
Q4 2
015
Q1 2
016
Q2 2
016
Target
Net Promoter Score
PassivesDetractors Promoters
Differentiate through Reliability
• >96% CSI score historically
• Complex orders, highest quality,
shortest lead times on all products
• Customer relationships span
decades
PPS
Engaged
Teams
Delighted
Customers
Profitable
Growth

Page 22
New Litho-Laminated Line New Specialty Coater New High Speed Corrugator
Expanding Specialty Sales
PAPER PACKAGING: TRANSFORMING PERFORMANCE
PORTFOLIO IMPROVEMENTS = PROFITABLE GROWTH
$0$5,000
$10,000$15,000$20,000$25,000$30,000$35,000
FY14 (H1) FY15 (H1) FY16(H1)
Bulk Pkg, LeaderCorr Signboard, Litho-laminated Sheets, Coated
Containerboard, Ultralightweight Containerboard
PPS
Sa
les$
(0
00
)
Engaged
Teams
Delighted
Customers
Profitable
Growth

Page 23
PAPER PACKAGING: TRANSFORMING PERFORMANCE
GROSS MARGIN
Total Efficiency1 Rankings of 138
Containerboard Machines
Riverville has leading efficiencies
Structural cost improvements
• 14% reduction in Riverville energy
consumption
• Riverville Mill – industry leading
efficiencies
• Sheet Feeders – waste down 12%;
productivity up 6% since start of
Transformation
PPS1Total Efficiencies defined as 100% - (% downtime for maintenance)*(% down for breaks)*( % defects).
Engaged
Teams
Delighted
Customers
Profitable
Growth
-14%

Page 24
PAPER PACKAGING: TRANSFORMING PERFORMANCE
FISCAL DISCIPLINE
• Generating cash from working capital
o Initiatives on inventory
management, payment terms
and improving collections
• Over $5M reduction in discretionary
spend since 2014
Operating Working Capital ($M)1
Apr 2015 vs. Apr 2016
0
25
50
75
100
Apr-15 Apr-16
CASH MANAGEMENT
Containerboard Inventory Below 2015
Daily Sales Outstanding 37 days
Unearned Discounts Down 55%
Accounts Payable Extended Terms Initiatives
PPS1Note: A reconciliation of the differences between all historical non-GAAP financial measures used in this presentation with the most directly comparable GAAP financial measures is included in the appendix of this presentation.
Engaged
Teams
Delighted
Customers
Profitable
Growth

Page 25
PAPER PACKAGING: KEY TAKEAWAYS
Well positioned in a shifting industry
Providing a unique value proposition,
recognized by customers
People and mindsets to drive
continuous improvement and structural
cost reductions
New asitrade at
Michigan Packaging, Michigan
Paper machine at
Massillon, Ohio
1
2
3
PPS
Flexible Products
& Services
Hari Kumar
Division President
Page 27
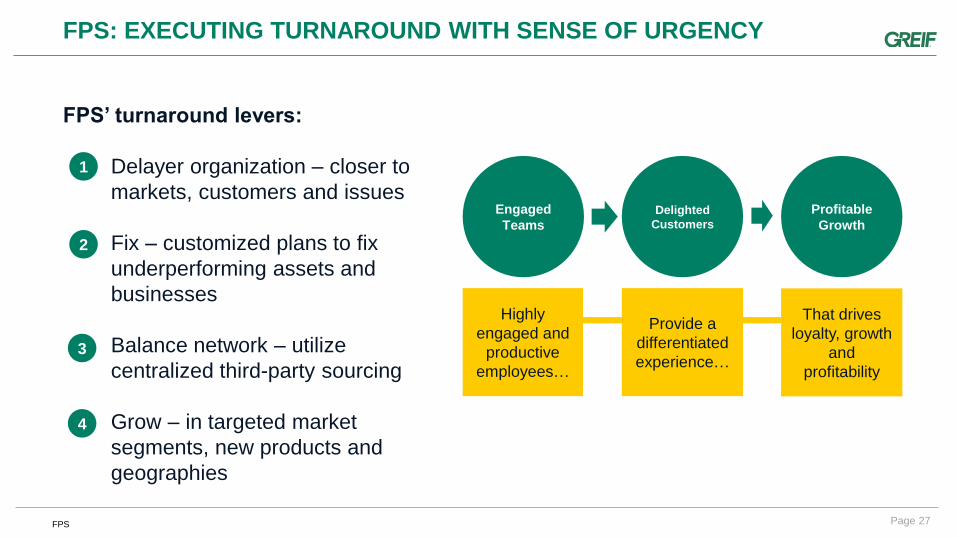
FPS: EXECUTING TURNAROUND WITH SENSE OF URGENCY
FPS’ turnaround levers:
Delayer organization – closer to
markets, customers and issues
Fix – customized plans to fix
underperforming assets and
businesses
Balance network – utilize
centralized third-party sourcing
Grow – in targeted market
segments, new products and
geographies
1
2
3
4
FPS
Highly
engaged and
productive
employees…
Provide a
differentiated
experience…
That drives
loyalty, growth
and
profitability
Engaged
Teams
Delighted
Customers
Profitable
Growth

Page 28
FPS: CUSTOMER SERVICE EXCELLENCE
Customer Satisfaction Index (CSI) scores
0
25
50
75
100
Q1
2015
Q2
2015
Q3
2015
Q4
2015
Q1
2016
Q2
2016
Target
Net Promoter Score
PassivesDetractors Promoters
• Best practices benchmarked and training
being deployed based on case studies
• Actively responding to customer needs
o Launching new Type D anti-static
product
o Infant Food Technology – Belgium
site to be commissioned in
November
FPS
14 41 46FPS Engaged
Teams
Delighted
Customers
Profitable
Growth
Page 29
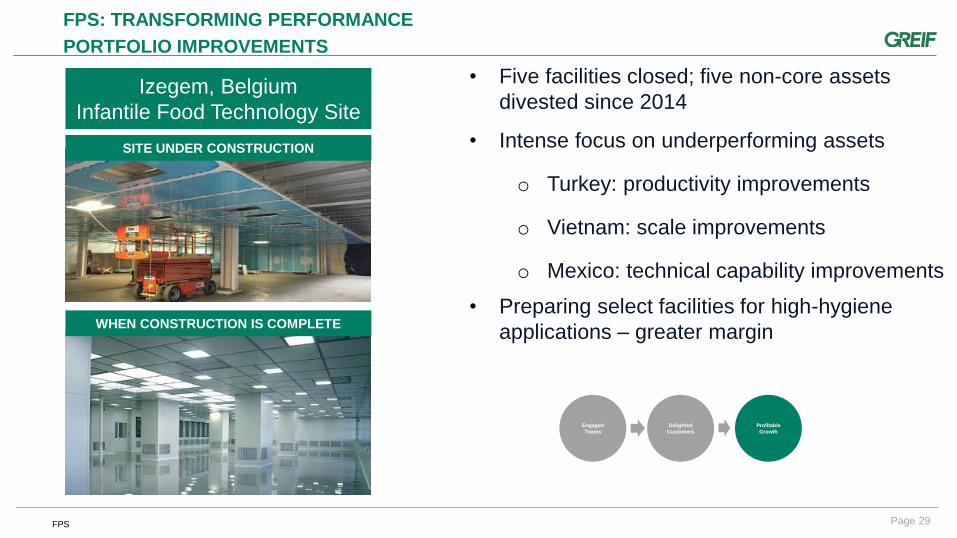
FPS: TRANSFORMING PERFORMANCE
PORTFOLIO IMPROVEMENTS
WHEN CONSTRUCTION IS COMPLETE
SITE UNDER CONSTRUCTION
• Five facilities closed; five non-core assets
divested since 2014
• Intense focus on underperforming assets
o Turkey: productivity improvements
o Vietnam: scale improvements
o Mexico: technical capability improvements
• Preparing select facilities for high-hygiene
applications – greater margin
Izegem, Belgium
Infantile Food Technology Site
FPS
Engaged
Teams
Delighted
Customers
Profitable
Growth

Page 30
FPS: TRANSFORMING PERFORMANCE
GROSS MARGIN IMPROVEMENTS
• Pursuing actions to improve margin:
o Raw material spend – sourcing and
supply chain initiatives
o Centralizing 3rd party sourcing for
greater efficiencies
o Labor costs – need to generate
additional efficiencies in Turkey and
Mexico
• Pursuing margin mix management activities
Gross profit margin (%)
0
5
10
15
20
Q1 2
01
5
Q2 2
01
5
Q3 2
01
5
Q4 2
01
5
Q1 2
01
6
Q2 2
01
6
FPS
Engaged
Teams
Delighted
Customers
Profitable
Growth

Page 31
FPS: TRANSFORMING PERFORMANCE
FISCAL DISCIPLINE
• 360 basis point improvement in SG&A
as a percentage of sales compared to
previous year
• Optimizing inventory in Turkey,
Benelux, Germany and France
• Rationalizing supplier terms
0
5
10
15
20
25
30
35
H1 2015 H1 2016
SG&A ($M)
H1 2015 vs. H1 2016
Operating Working Capital ($M)1
Apr 2015 vs. Apr 2016
0
25
50
75
100
Apr-15 Apr-16
FPS1Note: A reconciliation of the differences between all historical non-GAAP financial measures used in this presentation with the most directly comparable GAAP financial measures is included in the appendix of this presentation.
Engaged
Teams
Delighted
Customers
Profitable
Growth

Page 32
FPS: KEY TAKEAWAYS
Fix is being internally led; not by consultants
Leveraging legacy leadership – deep
experience with local markets
Utilizing lessons learned from the China
FPS turnaround and Greif Transformation
process
3 layer PE Extrusion - Hadimkoy, Turkey
Shop floor - Samandira, Turkey
1
2
3
To date, we have not delivered value.
What is different going forward?
FPS

Question and Answer
Session One

Rigid Industrial
Packaging & Services -Europe, Middle East and Africa
Michael Cronin
Group President

Page 35
RIPS EMEA: STRATEGY FROM THE MARKET BACK
RIPS EMEA’s focus:
Market economics and
competitive positioning – driving
strategy and direction
Customer needs and building
competitive advantage – driving
decision making
Pursuing growth and innovation in
attractive markets – driving our
growth focus
All supported by a revised, flatter,
stronger organization
1
2
3
RIPS - EMEA
Highly
engaged and
productive
employees…
Provide a
differentiated
experience…
That drives
loyalty, growth
and
profitability
Engaged
Teams
Delighted
Customers
Profitable
Growth

Page 36
RIPS EMEA: POST STRATEGIC REALIGNMENT IN EUROPE
Western Europe
Organizational delayering
and addressing
underperforming assets
Southern Europe
Attractive growth
Central Europe
Integration and
product/price mix
Different priorities,
but one goal – stronger
value creation
All supported by a revised, flatter, stronger organization
RIPS - EMEA

Page 37
RIPS EMEA: CUSTOMER SERVICE EXCELLENCE
Customer Satisfaction Index (CSI) scores
0
25
50
75
100
Q1 2
015
Q2 2
015
Q3 2
015
Q4 2
015
Q1 2
016
Q2 2
016
Target
Net Promoter Score
PassivesDetractors Promoters
• CSI measured and reported monthly
• Quality council measuring and driving quality
• Regular assessment of sales force with an
emphasis on value selling
• Pocket Margin analysis guiding pricing and
improvement projects
RIPS - EMEA
21 39 50EMEAEngaged
Teams
Delighted
Customers
Profitable
Growth

Page 38
RIPS EMEA: TRANSFORMING PERFORMANCE
PORTFOLIO IMPROVEMENTS
• Seven underperforming or non-strategic
assets closed or divested since 2014
o Focus on sub-performing plants
• Profit pool analysis being conducted to identify
attractive markets
o IBC growth strategy gaining momentum
• Jubail, Saudi Arabia steel drum plant
construction completed
• New growth opportunities in IBCs in the
Netherlands and conical drums in Spain
Intermediate Bulk Container volumes
(000 units sold)
Q1 2
01
5
Q2 2
01
5
Q3 2
01
5
Q4 2
01
5
Q1 2
01
6
Q2 2
01
6
RIPS - EMEA
Engaged
Teams
Delighted
Customers
Profitable
Growth

Page 39
RIPS EMEA: TRANSFORMING PERFORMANCE
GROSS MARGIN IMPROVEMENTS
• Operating cost reduction plan initiated
• Extended value stream mapping
• Pursuing supply chain optimization –
regional system view
• Emphasis on better product mix and
product management
Gross profit margin (%)
0
5
10
15
20
Q1 2
01
5
Q2 2
01
5
Q3 2
01
5
Q4 2
01
5
Q1 2
01
6
Q2 2
01
6
RIPS - EMEA
Engaged
Teams
Delighted
Customers
Profitable
Growth

Page 40
RIPS EMEA: TRANSFORMING PERFORMANCE
SUPPLY CHAIN OPTIMIZATION
Central Inventory Control
• Reduced & shared inventory
• Regional decoiling centres
• Improved visibility (inventory & orders)
Sales & Operations Planning
• Improved forecast
• Better planning
• Improved purchasing decisions
Network Optimization
• Better plant utilization
• Lower cost to serve
• Potential for central distribution
Agile Lean Supply Chain = Cost + Speed = Customer
Generate Forecasts
Demand Planning
Supply Planning
Pre-S&OP Meeting
S&OP Meeting
RIPS - EMEA

Page 41
RIPS EMEA: TRANSFORMING PERFORMANCE
FISCAL DISCIPLINE
• Pricing and payment terms policy in place with clear responsibility level
• Focused coordination between sales and operations on margin and working capital
• Leveraging best in class operating working capital (OWC) management
⎼ Some businesses already at world-class level
• SG&A reduction program in place with clear glide path to target
RIPS - EMEA
Engaged
Teams
Delighted
Customers
Profitable
Growth

Page 42
RIPS EMEA: KEY TAKEAWAYS
Fact-based market-based strategy and business planning
New and upgraded organization
Best-in-class operations with fiscal discipline
Aggregated segment business unit supply chain mapping
1
2
3
4
RIPS - EMEA
Jubail, Saudi Arabia steel drum plant
Mendig, Germany IBC
reconditioning plant

Rigid Industrial
Packaging & Services –Asia Pacific (APAC)
Chester Tsai Division President

Page 44
RIPS APAC: EXPANDING MARKET PRESENCE AND MARGIN
RIPS APAC’s strategic goals:
Align team to customer service
excellence and value
Penetrate the IBC market and
expand plastic footprint in South
East Asia
Growing wallet share in premium
product segments that offer higher
margins
Leveraging the Greif Business
System to enhance fiscal discipline
1
2
3
4
Highly
engaged and
productive
employees…
Provide a
differentiated
experience…
That drives
loyalty, growth
and
profitability
Engaged
Teams
Delighted
Customers
Profitable
Growth
RIPS - APAC

Page 45
RIPS APAC: CUSTOMER SERVICE EXCELLENCE
Customer Satisfaction Index (CSI) scores
0
25
50
75
100
Q1 2
015
Q2 2
015
Q3 2
015
Q4 2
015
Q1 2
016
Q2 2
016
Target
Net Promoter Score
PassivesDetractors Promoters
• 32% improvement in China’s customer
satisfaction index scores driving APAC
improvement – better linkage between
sales and operations
• Sales Incentive Plan installed – greater
focus on customer satisfaction, margin and
receivables improvement
• 32% improvement in promoter scores
between NPS wave one and two
12 43 45APAC
Engaged
Teams
Delighted
Customers
Profitable
Growth
RIPS - APAC
Page 46
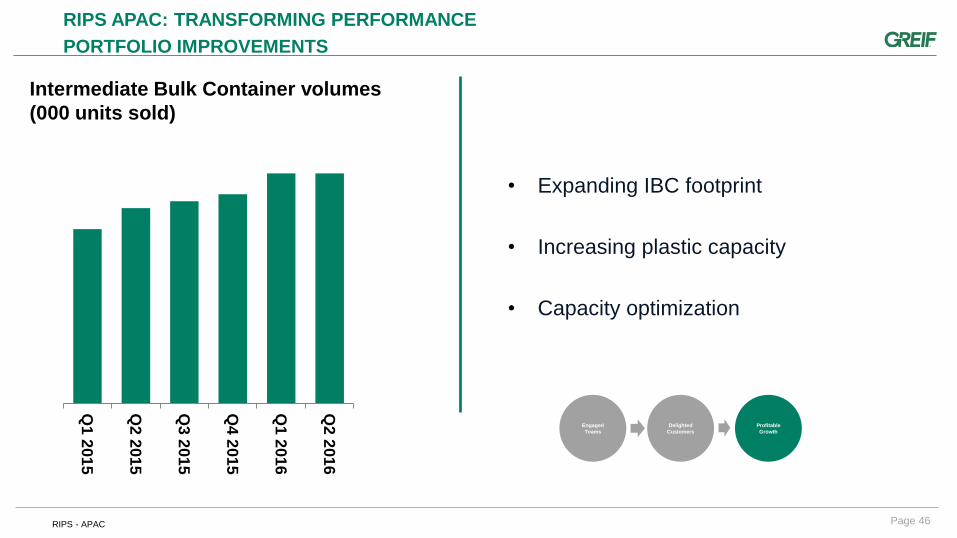
RIPS APAC: TRANSFORMING PERFORMANCE
PORTFOLIO IMPROVEMENTS
• Expanding IBC footprint
• Increasing plastic capacity
• Capacity optimization
Intermediate Bulk Container volumes
(000 units sold)
Q1 2
01
5
Q2 2
01
5
Q3 2
01
5
Q4 2
01
5
Q1 2
01
6
Q2 2
01
6
Engaged
Teams
Delighted
Customers
Profitable
Growth
RIPS - APAC

Page 47
RIPS APAC: TRANSFORMING PERFORMANCE
GROSS MARGIN IMPROVEMENTS AND FISCAL DISCIPLINE
• Fixed underperforming operations
• Rationalized customer mix
• Sales and operation planning integration
• Stabilizing sourcing
• Improving working capital
Gross profit margin (%)
0
5
10
15
20
25
Q1 2
01
5
Q2 2
01
5
Q3 2
01
5
Q4 2
01
5
Q1 2
01
6
Q2 2
01
6
Engaged
Teams
Delighted
Customers
Profitable
Growth
RIPS - APAC

Page 48
APAC: KEY TAKEAWAYS
Controlling what we can control – starts with discipline
Customer satisfaction – delighting customers
Profitable growth – expanding reach
People – team, culture, engagement and empowerment
Dual head blow molding machine - Singapore
APAC team and customers in hygiene gear
(global food safety initiative facility)
1
2
3
4
RIPS - APAC
Rigid Industrial
Packaging & Services -Americas
Ole Rosgaard
Division President

Page 50
RIPS AMERICAS: FOCUSED ON IMPROVING FUNDAMENTALS
RIPS America’s strategic goals:
Increase Customer
Satisfaction Index
Outpace market in profitable
growth
Reduce unplanned downtime
across operational network
Reduce customer complaints
1
2
3
4
RIPS - Americas
Highly
engaged and
productive
employees…
Provide a
differentiated
experience…
That drives
loyalty, growth
and
profitability
Engaged
Teams
Delighted
Customers
Profitable
Growth

Page 51
RIPS AMERICAS: CUSTOMER SERVICE EXCELLENCE
Customer Satisfaction Index (CSI) scores
0
25
50
75
100
Q1
2015
Q2
2015
Q3
2015
Q4
2015
Q1
2016
Q2
2016
Target
Net Promoter Score
PassivesDetractors Promoters
• 30% reduction in corrective action rate
• 510 online customer service training
sessions held for inside sales
• 57% improvement in customer contacts
RIPS - Americas
24 21 55N.
America
Engaged
Teams
Delighted
Customers
Profitable
Growth

Page 52
RIPS AMERICAS: TRANSFORMING PERFORMANCE
PORTFOLIO IMPROVEMENTS
• Three steel plants closed and seven non-core
assets divested since 2014
• Leveraging favorable customer relationships to
drive profitable IBC growth
Intermediate Bulk Container volumes
(000 units sold)
Q1 2
01
5
Q2 2
01
5
Q3 2
01
5
Q4 2
01
5
Q1 2
01
6
Q2 2
01
6
RIPS - Americas
Engaged
Teams
Delighted
Customers
Profitable
Growth

Page 53
RIPS AMERICAS: TRANSFORMING PERFORMANCE
GROSS MARGIN IMPROVEMENTS
• Implemented price and product mix
management
• 10.5% reduction in unplanned downtime since
2015
• Simplified SKU offering
• Variable sales compensation model
implemented
• Targets cascaded to plant level
North America gross profit margin (%)
05
10152025
Q1 2
01
5
Q2 2
01
5
Q3 2
01
5
Q4 2
01
5
Q1 2
01
6
Q2 2
01
6
Latin America gross profit margin (%)
0
5
10
15
20
Q1 2
01
5
Q2 2
01
5
Q3 2
01
5
Q4 2
01
5
Q1 2
01
6
Q2 2
01
6
RIPS - Americas
Engaged
Teams
Delighted
Customers
Profitable
Growth

Page 54
RIPS AMERICAS: TRANSFORMING PERFORMANCE
FISCAL DISCIPLINE
• Emphasis on generating cash from working
capital
o Accomplished: 19 day payment
improvement on 228 suppliers
o Targeting: 30% improvement on days
sales outstanding
• Discretionary spend reduced 19% versus H1
2015
Operating Working Capital ($M)1
Apr 2015 vs. Apr 2016
Discretionary spend ($M)
H1 2015 vs. H1 2016
0
50
100
150
200
Apr-15 Apr-16
0
10
20
30
40
50
H1 2015 H1 2016
RIPS - Americas
Engaged
Teams
Delighted
Customers
Profitable
Growth

Page 55
RIPS AMERICAS: KEY TAKEAWAYS
Business fundamentals are much healthier and on a
path to be best in class
Improving and sustainable profit performance and cash
flow generation
Volume growth in plastic and IBCs
Quality of market share over quantity of market share
Greif colleague at Bradley, IL plastic plant
New clean filling room, Baytown, TX plant
1
2
3
4
RIPS - Americas

Financial reviewLarry Hilsheimer
Executive Vice President and Chief Financial Officer

Page 57
UPGRADED THE CORPORATE FINANCE TEAM AND ENHANCING SYSTEMS
• Upgraded talent across multiple functions,
particularly financial reporting team
• Implemented more rigorous review
processes and centralized cost controls
• Improving systems and controls
Transformation meetings, 2016
A significantly improved team that presides over improved controls
Engaged
Teams
Delighted
Customers
Profitable
Growth

Page 58
SG&A REDUCED BY 20% SINCE 2013
• Sustainable SG&A reductions implemented
• Additional, but smaller, opportunities exist
• Improved culture of accountability
Annual SG&A expense ($M)
$0
$100
$200
$300
$400
$500
$600
2013 2014 2015 2016outlook
Engaged
Teams
Delighted
Customers
Profitable
Growth

Page 59
MANAGEABLE DEBT PROFILE
Debt profile ($M) at April 30, 2016
$0
$100
$200
$300
$400
$500
$600
2016 2017 2018 2019 2020 2021
Other debt US asset securitization US revolver
Short term borrowings Public debt
• Total debt of $1.1B as of Q2 2016
‒ Leverage ratio of 2.6 of Q2 2016
‒ Target leverage ratio of 2.0 – 2.5X coming out
of 2017
• Declining debt profile
‒ $300M in senior notes due in 2017; exploring
multiple refinancing options available due to
low leverage, improved results and strong
balance sheet
‒ Business needs funded through operating cash
flows and working capital management
• Near term capital allocation priorities
‒ Fund maintenance and capital projects
‒ Pay dividend
‒ Pay down debt

Page 60
TRACKING TO 2017 TRANSFORMATION COMMITMENTS
Greif 2014 and 2017 financial ratios
2014 Actual 2017
Gross Profit 19.1% 20.0%
SG&A 11.7% 10.0%
Operating Profit
before Special Items1 7.5% 10.0%
Operating Working Capital2 9.7% < 7.5%
1Special items include restructuring charges, acquisition-related costs, timberland gains, non-cash asset impairment charges and gain or loss on disposal of properties, plants, equipment and businesses, net.2Operating Working Capital percentage is calculated using the October 31, 2014 balances of trade accounts receivable, plus inventories less accounts payable as a percentage of net sales for fiscal 2014.
Note: A reconciliation of the differences between all historical non-GAAP financial measures used in this presentation with the most directly comparable GAAP financial measures is included in the appendix of this presentation.
Greif’s trailing four quarter gross margin percentage = 19.6%
Engaged
Teams
Delighted
Customers
Profitable
Growth

Page 61
($M)2017 run rate commitments:
June 10, 2015
2017 run rate commitments:
June 24, 2016
Net Sales $3,831 $3,500
Gross Profit $760 – $770 $720 – $730
SG&A $375 – $385 $345 – $355
Operating Profit
before Special Items1 $375 – $395 $365 – $385
Free Cash Flow2 $225 – $235 $205 – $225
TRACKING TO 2017 TRANSFORMATION COMMITMENTS
Greif 2017 consolidated Transformation commitments
1Special items include restructuring charges, acquisition-related costs, timberland gains, non-cash asset impairment charges and gain or loss on disposal of properties, plants, equipment and businesses, net.2Free cash flow is defined as net cash provided by operating activities less cash paid for capital expenditures.
Greif 2017 consolidated Transformation Operating
Profit Before Special Item commitment updated for
foreign exchange changes only
Engaged
Teams
Delighted
Customers
Profitable
Growth

Page 62
($M)
2017 run rate
commitments:
June 10, 2015
2017 run rate
commitments:
June 24, 2016
Trends
Net Sales $887 $640 Weaker containerboard
pricing and higher fiber
costs year to dateGross Profit $195 – $205 $152 – $162
SG&A $50 – $55 $46 – $51
Operating Profit
before Special Items1 $145 – $150 $106 – $111
PAPER PACKAGING & SERVICES:
2017 TRANSFORMATION COMMITMENTS
1Special items include restructuring charges, acquisition-related costs, non-cash asset impairment charges and gain or loss on disposal of properties, plants, equipment and businesses, net.
Network performance helping to offset a challenging environment
Engaged
Teams
Delighted
Customers
Profitable
Growth

Page 63
($M)
2017 run rate
commitments:
June 10, 2015
2017 run rate
commitments:
June 24, 2016
Trends
Net Sales $315 $290 Instilling a sense of
urgency to fix
underperforming
operations
Gross Profit $55 – $65 $43 – $53
SG&A $45 – $50 $38 – $43
Operating Profit
before Special Items1 $10 – $15 $5 – $10
FLEXIBLE PRODUCTS & SERVICES:
2017 TRANSFORMATION COMMITMENTS
1Special items include restructuring charges, acquisition-related costs, non-cash asset impairment charges and gain or loss on disposal of properties, plants, equipment and businesses, net.
Accelerating the pace of change at FPS
Engaged
Teams
Delighted
Customers
Profitable
Growth

Page 64
($M)
2017 run rate
commitments:
June 10, 2015
2017 run rate
commitments:
June 24, 2016
Trends
Net Sales $2,605 $2,544 Accelerating gross profit
improvement
Focused on quality of
market share over
quantity of market share
Gross Profit $495 – $505 $506 – $516
SG&A $280 – $285 $256 – $261
Operating Profit
before Special Items1 $215 – $220 $250 – $255
RIGID INDUSTRIAL PACKAGING & SERVICES:
2017 TRANSFORMATION COMMITMENTS
1Special items include restructuring charges, acquisition-related costs, non-cash asset impairment charges and gain or loss on disposal of properties, plants, equipment and businesses, net.
RIPS is getting back to basics and showing upside
Engaged
Teams
Delighted
Customers
Profitable
Growth

Page 65
($M)
2017 run rate
commitments:
June 10, 2015
2017 run rate
commitments:
June 24, 2016
Trends
Net Sales $24 $26 Steady performance
Gross Profit $5 – $15 $4 – $14
SG&A $0 – $5 $0 – $5
Operating Profit
before Special Items1 $5 – $10 $4 – $9
LAND MANAGEMENT:
2017 TRANSFORMATION COMMITMENTS
Greif’s land position offers opportunities beyond sustainable timber harvesting
1Special items include restructuring charges, acquisition-related costs, timberland gains, non-cash asset impairment charges and gain or loss on disposal of properties, plants, equipment and businesses, net.
Engaged
Teams
Delighted
Customers
Profitable
Growth
Page 66
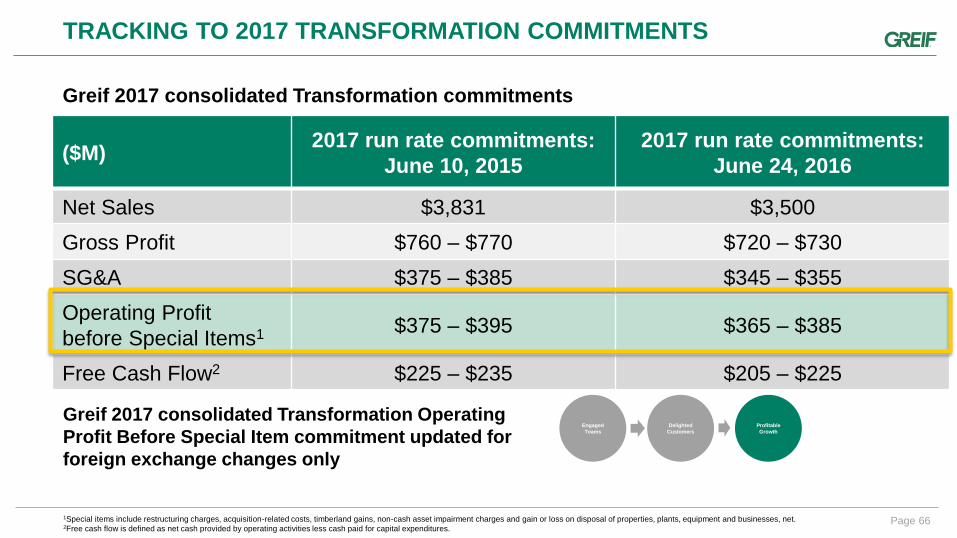
($M)2017 run rate commitments:
June 10, 2015
2017 run rate commitments:
June 24, 2016
Net Sales $3,831 $3,500
Gross Profit $760 – $770 $720 – $730
SG&A $375 – $385 $345 – $355
Operating Profit
before Special Items1 $375 – $395 $365 – $385
Free Cash Flow2 $225 – $235 $205 – $225
TRACKING TO 2017 TRANSFORMATION COMMITMENTS
Greif 2017 consolidated Transformation commitments
1Special items include restructuring charges, acquisition-related costs, timberland gains, non-cash asset impairment charges and gain or loss on disposal of properties, plants, equipment and businesses, net.2Free cash flow is defined as net cash provided by operating activities less cash paid for capital expenditures.
Greif 2017 consolidated Transformation Operating
Profit Before Special Item commitment updated for
foreign exchange changes only
Engaged
Teams
Delighted
Customers
Profitable
Growth

Question and Answer
Session Two

Page 68
GREIF’S VISION AND STRATEGIC PRIORITIES
VISION:
In Industrial Packaging, be the best
performing customer service
company in the world
Three strategic priorities:
Building teams aligned to value
delivery
Customer service excellence
Achieving transformational
performance
1
2
3
Highly
engaged and
productive
employees…
Provide a
differentiated
experience…
That drives
loyalty, growth
and
profitability
Engaged
Teams
Delighted
Customers
Profitable
Growth
Our vision is founded in the service-profit chain

Page 69
GREIF’S INVESTMENT THESIS
Best customer
service
company in
industrial
packaging
Mitigate risk
through a
diverse, global
portfolio
Comprehensive
packaging
provider, with
leverage to the
industrial
economy
Reliable
earnings and
cash flow
generation
Share price
growth and
substantial and
secure dividend
yield1
1According to Goldman Sachs, Greif’s dividend yield places it in the 96th percentile of companies ranked by dividend yield in the S&P 500 (data as of March 31, 2016)
Undergoing Transformation to regain market credibility and improve operations

Appendix

Page 71
RIPS NA: Key end markets (by revenue)
RIPS NA: Key products (by revenue)
Steel
Plastics
Fibre
IBCs
RIPS AMERICAS: 72 FACILTIES LOCATED ACROSS TWO CONTINENTS
Industrial Chemicals
Other
Food & Beverage
Lubricants
Specialty Chemicals
Agro-Chemicals
Paints & Coatings
Pharmaceuticals
Oil & Gas
Flavors and Fragrances
Page 72
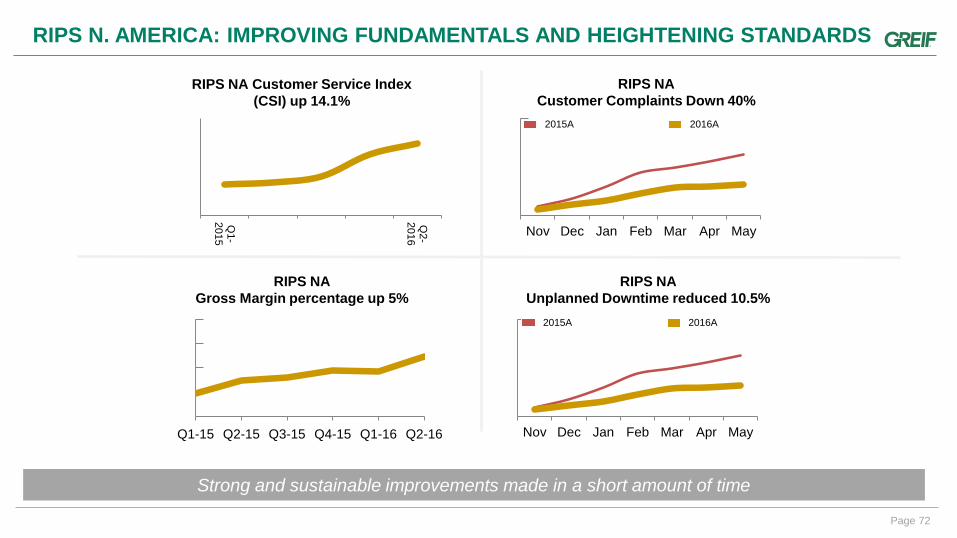
RIPS N. AMERICA: IMPROVING FUNDAMENTALS AND HEIGHTENING STANDARDS
RIPS NA Customer Service Index
(CSI) up 14.1%
Q1-
2015
Q2-
2016
RIPS NA
Customer Complaints Down 40%
Nov Dec Jan Feb Mar Apr May
2015A 2016A
RIPS NA
Gross Margin percentage up 5%
Q1-15 Q2-15 Q3-15 Q4-15 Q1-16 Q2-16
RIPS NA
Unplanned Downtime reduced 10.5%
Nov Dec Jan Feb Mar Apr May
2015A 2016A
Strong and sustainable improvements made in a short amount of time

Page 73
RIPS EMEA: GLOBAL REACH AND SCALE
RIPS EMEA: Key end markets (by revenue)
RIPS EMEA: Key products (by revenue)
Steel
Plastics
IBCs
Petrol Prod, Lube Oils&Adds
Bulk/Commodity Chemicals
Solid Food Prod,Pastes&Ed oils
Specialty Chemicals
Paints,Coatings,Inks,Adhesives
Blenders,fillers & chem distr.
Packaging Distributors
Silicones
Flavours & fragrances
Other
Agro Chemicals

Page 74
APAC: EXPANDING REACH ACROSS COUNTRIES AND PRODUCTS
RIPS APAC: Key end markets (by revenue)
RIPS APAC: Key products (by revenue)
Steel
Plastics
IBCs
Bulk/Commodity Chemicals
Agro chemicals
Specialty chemicals
Blenders,fillers & chem distr.
Detergents, surfactants
Paints,coatings,inks,adhesives
Flavors and fragrances
Solid food products
Solvents & glycol-based prod
Petrol prod, lube oils & additives
Misc.
Packaging distributors
Pharmaceuticals & personal care
Silicones
Waste Industry

Page 75
PAPER PACKAGING: NEWER NETWORK, SOLID RETURNS
Corrugated
Sheet
Feeders
Containerboard
Mills
PPS: Key products (by revenue)
Since 2009, PPS has invested over $200M in our 7 operations
Mills
Sheet
Box Board

Page 76
2017 COMMITMENT ASSUMPTIONS
• Assumed market growth rate of 0-1%
• Raw material costs assumed flat against current indices in the markets in which we participate
• Major raw material price increases are passed to customers through price adjustment mechanisms in contracts or
otherwise with customary delay
• The FX impact was calculated using actual year to date FX rates in 2016 through April and the assumption that the
rates remain constant at the April rates through the remainder of the year
• Salary/wage increase assumed at historical rates
• For purposes of calculation of run rate free cash flow exiting 2017, we have assumed an effective cash tax rate range
of 37-40%
• Cap-Ex at $90 - 120M
• $75-85M restructuring costs estimated for 2015-17 period
• All divestitures completed by the end of FY2016; no material acquisitions

Page 77
MANAGEMENT TEAM BIOGRAPHIES
Peter G. Watson
Peter G. Watson was named Greif’s President and Chief Executive Officer on November 1, 2015 after previously serving as Chief Operating Officer. Since joining Greif
in 1999, Pete has served in a variety of positions, including Group President for Paper Packaging, Land Management, and Global Sourcing and Supply Chain. He also
served as Division President of Paper Packaging, and President of CorrChoice (a Greif division). Prior to joining Greif, Pete worked in several management positions
with Union Camp Corporation, later acquired by International Paper. Pete holds a Masters and Bachelor’s degree (cum laude) from Springfield College in
Massachusetts. Pete is Chairman of the Board of Directors of the Fibre Box Association and is on the Board of Directors of the American Forest & Paper Association.
Larry A. Hilsheimer
Larry A. Hilsheimer was named Greif’s Chief Financial Officer on May 12, 2014. Previously, Larry was Executive Vice President and Chief Financial Officer of Scotts
Miracle-Gro, Executive Vice President and Chief Financial Officer of Nationwide Mutual Insurance Company, and Vice Chairman and Regional Managing Partner for
Deloitte & Touche USA, LLP. Larry is a graduate of Fisher College of Business at The Ohio State University with a bachelor’s degree in accounting and a law degree
from Capital University Law School. Larry serves on the Board of Directors of IBP (NYSE). He has served on numerous civic and charitable boards and currently serves
the community as a board member of Battelle for Kids and on the audit committee of The Ohio State University. He sits on the Dean’s Advisory Council at Fisher and is
a board member for The Ohio State University Alumni Association.
Gary R. Martz
Gary R. Martz has served as Executive Vice President since June 2010 (and prior to that as Senior Vice President) and as General Counsel and Secretary since joining
the Company in 2002. From March 2014 until May 2014, Gary also served as Chief Administrative Officer. Since May 2014, Gary has assumed responsibility for the
management of the Company’s global real estate services department. From June 2005 until May 2013, Gary served as President of Soterra LLC, which operates the
Company’s Land Management business segment. Prior to 2002, he was a partner in the law firm of Baker & Hostetler LLP. Gary graduated from the University of
Toledo with a Bachelor’s degree (magna cum laude) and holds a Juris Doctor degree (with honors) from the Moritz College of Law at The Ohio State University.
DeeAnne Marlow
DeeAnne Marlow joined Greif in May 2015. She was previously with Cummins, Inc. and has more than 25 years of broad HR experience spanning industrial, healthcare
and consumer products industries. Holds a BA in Business from Luther College, with an MBA from the University of South Dakota. She is SPHR Certified and is a Six
Sigma Green Belt.

Page 78
MANAGEMENT TEAM BIOGRAPHIES
Michael Cronin Group President, RIPS EMEA, APAC• 40 years’ experience
• Former President of a European Packaging Company
• Former CEO of global flexible packaging company
Ole Rosgaard Division President, RIPS Americas• 25 years’ experience
• Worked internationally in 9 countries
Chester Tsai Division President, RIPS APAC• 27 years’ experience
• Worked internationally in Japan, Australia, Taiwan, India and China
Tim Bergwall Division President, PPS & Soterra• 29 years’ experience
• Chairman, AFPA containerboard sector
Hari Kumar Division President, FPS• 23 years’ experience
• Former General Manager and Sales Director
• Previous partner of consultancy with expertise in Business Transformation practices
Page 79
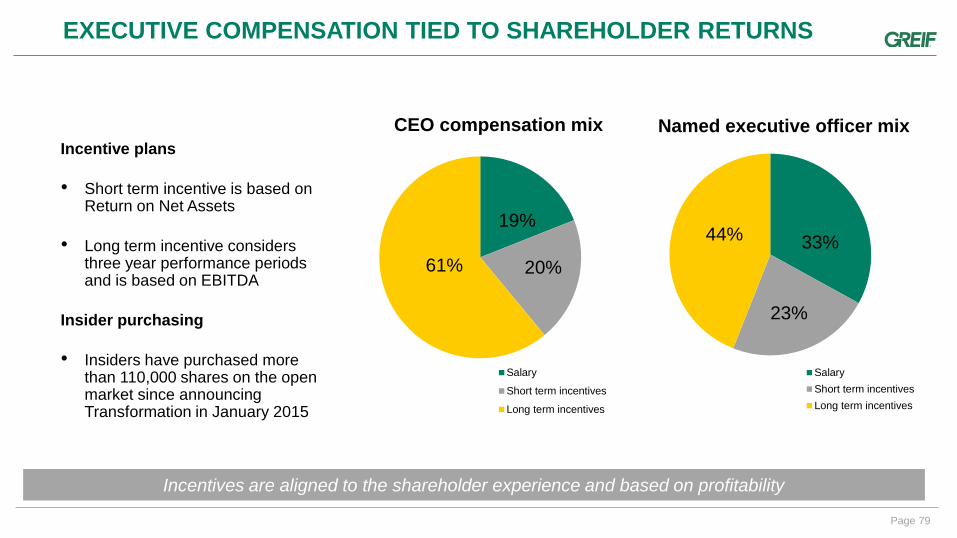
EXECUTIVE COMPENSATION TIED TO SHAREHOLDER RETURNS
19%
20%61%
CEO compensation mix
Salary
Short term incentives
Long term incentives
33%
23%
44%
Named executive officer mix
Salary
Short term incentives
Long term incentives
Incentive plans
• Short term incentive is based on Return on Net Assets
• Long term incentive considers three year performance periods and is based on EBITDA
Insider purchasing
• Insiders have purchased more than 110,000 shares on the open market since announcing Transformation in January 2015
Incentives are aligned to the shareholder experience and based on profitability

Page 80
YTD GAAP TO NON-GAAP RECONCILIATION OF SELECTED FINANCIAL INFORMATION EXCLUDING THE IMPACT OF DIVESTITURES
2015 2014 2015 2014
Operating profit (loss):
Rigid Industrial Packaging & Services $ 10.9 $ 46.7 $ 86.4 $ 170.1
Paper Packaging 32.6 41.4 109.3 125.8
Flexible Products & Services (12.8) (56.2) (36.6) (78.6)
Land Management 1.4 5.6 33.7 32.0
Total operating profit (loss) 32.1 37.5 192.8 249.3
Restructuring charges:
Rigid Industrial Packaging & Services 9.2 3.8 29.6 9.6
Paper Packaging 1.2 - 2.2 -
Flexible Products & Services 2.8 1.8 8.1 6.5
Land Management 0.1 - 0.1 -
Total restructuring charges 13.3 5.6 40.0 16.1
Acquisition-related costs:
Rigid Industrial Packaging & Services - 0.4 0.3 1.6
Total acquisition-related costs - 0.4 0.3 1.6
Timberland gains:
Land Management - - (24.3) (17.1)
Total timberland gains - - (24.3) (17.1)
Non-cash asset impairment charges:
Rigid Industrial Packaging & Services 22.1 3.9 43.4 11.6
Paper Packaging - - 0.8 -
Flexible Products & Services 1.5 66.3 1.7 74.2
Total non-cash asset impairment charges 23.6 70.2 45.9 85.8
(Gain) loss on disposal of properties, plants, equipment and businesses, net:
Rigid Industrial Packaging & Services 0.3 1.1 2.7 10.3
Paper Packaging (0.5) (4.2) (0.5) (5.1)
Flexible Products & Services 3.2 (18.3) 2.7 (19.6)
Land Management - (2.6) (2.7) (5.4)
Total (gain) loss on disposal of properties, plants, equipment and
businesses, net 3.0 (24.0) 2.2 (19.8)
Impact of Venezuela devaluation on cost of products sold:
Rigid Industrial Packaging & Services - - 9.3 -
Total Impact of Venezuela devaluation on cost of products sold - - 9.3 -
Operating profit (loss) before special items:
Rigid Industrial Packaging & Services 42.5 55.9 171.7 203.2
Paper Packaging 33.3 37.2 111.8 120.7
Flexible Products & Services (5.3) (6.4) (24.1) (17.5)
Land Management 1.5 3.0 6.8 9.5
Total operating profit (loss) before special items $ 72.0 $ 89.7 $ 266.2 $ 315.9
Three months ended Twelve months ended
October 31 October 31(Dollars in Millions)

Page 81
OWC AS A PERCENTAGE OF FISCAL 2014 NET SALES
FY 2014
Trade accounts receivable 501$
Inventories 381$
Accounts Payable (471)$
411$
Net Sales 4,239.1$
OWC as % of Net Sales 9.7%
(Dollars in Millions)

Page 82
$ % $ % $ % $ % $ %
Net Sales 839.6 771.4 868.5 930.0 3,409.5
Gross Profit 173.7 20.7% 151.3 19.6% 168.0 19.3% 166.8 17.9% 659.8 19.4%
Venezuela inventory revaluation (special item) - - - 9.3 9.3
Gross Profit after Venezuela inventory revlauation 173.7 20.7% 151.3 19.6% 168.0 19.3% 176.1 18.9% 669.1 19.6%
SG&A 94.5 11.3% 93.2 12.1% 96.0 11.1% 96.9 10.4% 380.6 11.2%
OPBSI 79.3 9.4% 58.1 7.5% 72.0 8.3% 79.3 8.5% 288.7 8.5%
Q2 2016 Q1 2016 Q4 2015 Q3 2015 TTM
(Dollars in Millions)
TRAILING FOUR QUARTER: GROSS PROFIT MARGIN, SG&A RATIO AND OPERATING PROFIT BEFORE SPECIAL ITEM MARGIN
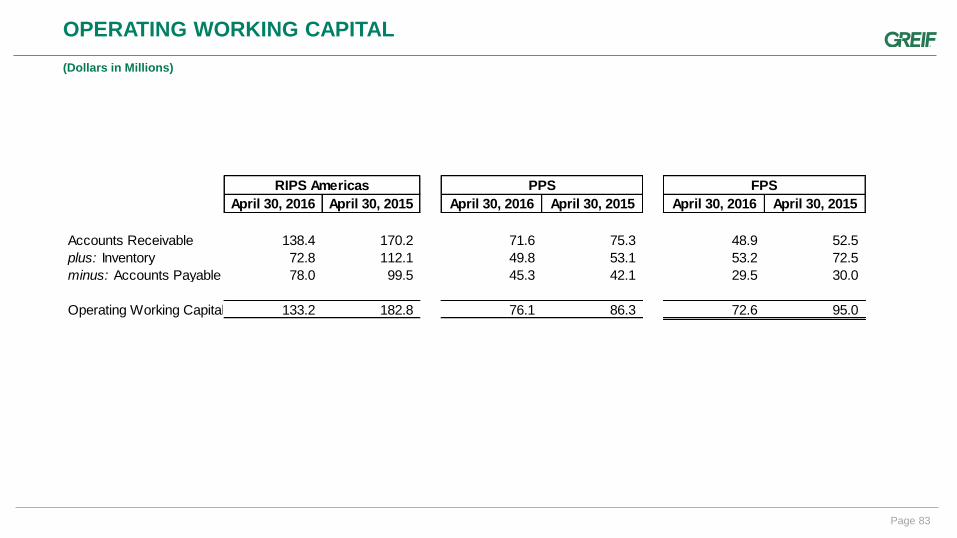
Page 83
April 30, 2016 April 30, 2015 April 30, 2016 April 30, 2015 April 30, 2016 April 30, 2015
Accounts Receivable 138.4 170.2 71.6 75.3 48.9 52.5
plus: Inventory 72.8 112.1 49.8 53.1 53.2 72.5
minus: Accounts Payable 78.0 99.5 45.3 42.1 29.5 30.0
Operating Working Capital 133.2 182.8 76.1 86.3 72.6 95.0
FPSRIPS Americas PPS
OPERATING WORKING CAPITAL
(Dollars in Millions)

Page 84
NOTE ON FORWARD LOOKING STATEMENTS
• With respect to all forward looking non-GAAP measures including Operating Profit Before
Special Items and Free Cash Flow, no reconciliation is included in this presentation
because, due to the high variability and difficulty in making accurate forecasts and
projections of some of the excluded information, together with some of the excluded
information not being ascertainable or accessible, we are unable to quantify certain
amounts that would be required to be included in the most directly comparable GAAP
financial measure without unreasonable efforts.

Page 85
KEY DEFINITIONS
• Customer Satisfaction Index: Customer Satisfaction Index is an internal measure of a
plants or businesses performance against selected parameters that customers experience,
giving us an indication of our level of meeting our customers basic needs. Components
include: customer complaints received; customer complaints open greater than 30 days;
credits raised; number of late deliveries; and the number of deliveries. Categories are
weighted by importance. Customer complaints and customers weighting for complaint
responses may be considered more important than a credit request. Late delivery to a
customer may also be more inconvenient than a credit. Therefore each category is
measured, multiplied by a factor, before adding all the scores together.
• Net Promoter Score: a management tool that can be used to gauge the loyalty of a firm's
customer relationships. It serves as an alternative to traditional customer satisfaction
research and claims to be correlated with revenue growth. NPS can be as low as −100
(everybody is a detractor) or as high as +100 (everybody is a promoter). An NPS that is
positive (i.e., higher than zero) is felt to be good, and an NPS of +50 is excellent.

Page 86
RIPS IS A DEMONSTRATED MARKET LEADER
Steel
#1
Plastic
#2
Fibre
#1
IBC
#3
Filling & Blending
#1
Rigid Pkg.
Recon.
#4
