green light to illuminate signal transduction events
TRANSCRIPT
Special Issue – Imaging Cell Biology
Green light to illuminate signaltransduction eventsTamas Balla
Section on Molecular Signal Transduction, Program on Developmental Neuroscience, Eunice Kennedy Shriver National Institute
of Child Health and Human Development, National Institutes of Health, Bethesda, MD 20892, USA
Review
When cells are exposed to hormones that act on cellsurface receptors, information is processed through theplasma membrane into the cell interior via second mes-sengers generated in the inner leaflet of the plasmamembrane. Individual biochemical steps along this cas-cade have been characterized from ligand binding toreceptors through to activation of guanine nucleotidebinding proteins and their downstream effectors such asadenylate cyclase or phospholipase C. However, thecomplexity of temporal and spatial integration of thesemolecular events requires that they are studied in intactcells. The great expansion of fluorescent techniques andimproved imaging technologies such as confocal andTIRF microscopy combined with genetically-engineeredprotein modules has provided a completely newapproach to signal transduction research. Spatial defi-nition of biochemical events followed with real-timetemporal resolution has become a standard goal, andseveral new techniques are now breaking the resolutionbarrier of light microscopy.
IntroductionThe concept of second messengers arose from the realiz-ation that many hormones and neurotransmitters do notpenetrate the cell membrane but bind to receptors at thesurface of the cell. To communicate external cues to the cellinterior, these receptors must generate intracellular mes-sengers to initiate a cellular response. The informationflow from cell-surface receptors all the way to the responsemachinery of the cells, irrespective of whether the responseis contraction, secretion or gene activation, has been thesubject of intense studies over the past 50 years. Anomaliesin such pathways are the underlying cause of most humandiseases [1–3], highlighting the importance of signal trans-duction research.
Classical studies targeting what are now known as Gprotein-coupled receptors (GPCRs) found that these recep-tors communicate with GTP-binding proteins and activateenzymes that generate second messengers including cyclicadenosine- or guanosine monophosphates (cAMP andcGMP) [4], the Ca2+-mobilizing inositol 1,4,5-trisphosphate(InsP3) [5], or Ca2+ itself. These second messengers thenactivate a variety of proteins including ion channels, tran-scription factors and other regulatory proteins eitherdirectly or via the modulation of protein- and lipid kinases
Corresponding author: Balla, T. ([email protected]).
0962-8924/$ – see front matter . Published by Elsevier Ltd. doi:10.1016/j.tcb.2009.08.001 Availa
or phosphatases [6]. Each of these processes has beendelineated in vitro with biochemical methods employingextracted cell components, and these have rapidlyadvanced the field. However, several observations suggestthat this linear chain of information transfer is an over-simplification and the overall increase in second messen-ger concentration does not necessarily correlate with thebiological response [7]. Apparently similar increases incytoplasmic cAMP can reflect very different local cAMPelevations, and can therefore have completely differentbiological outcomes depending on the receptors or theCa2+ channels involved [8,9]. As more molecular detailsare revealed as to how second messengers interact withtheir downstream targets it is becoming obvious that theseintracellular signals are highly restricted in space andtime; it is therefore necessary to obtain information bothon their intracellular locations and temporal patterns. Atthe same time, significant progress is being made in ourunderstanding of the changes of structure and confor-mation taking place in a large number of proteins followingtheir activation. The genomic era has revealed themodularnature of most signal transduction proteins and has ident-ified many basic protein folds [10]; these now can beidentified by simple sequence analysis tools. Moreover,fluorescence methods including the appearance of geneti-cally encoded fluorescent proteins and parallel advances inmicroscopy techniques have all contributed to a change inhow signal transduction research is conducted. Currentstandards demand that each step in the second-messengeractivation cascade is followed in single living cells, and at aspatial resolution that can break the limits of light micro-scopy (see Lidke andWilson, and Larson et al. in this issue,and Box 1). Here we summarize the current state offluorescence techniques as they are applied to the individ-ual elements of the information chain from the receptorsall the way to protein kinases.
Basic principles of fluorescence techniques used tofollow signaling eventsMany studies use proteins tagged with the green fluor-escent protein (GFP) or its variants [11] to determine thelocalization of proteins within the cell. This method hascontributed tremendously to our knowledge of cell biology.Fluorescence tagging gives excellent information on thesteady-state distribution of proteins and, combined withphotobleaching or photoactivation, can also address the
ble online 8 October 2009 575
Box 1. Advances in fluorescence microscopy
The success of fluorescence imaging tools is greatly aided by the
enormous progress made on the microscopy front. Laser confocal
microscopy and total internal reflection fluorescence (TIRF) micro-
scopy have made it possible to analyze signals that originate from a
thin optical section of the cell, thereby increasing the signal-to-noise
ratio and spatial resolution. A further giant step was the appearance
of super-resolution (SR) fluorescence microscopy, named ‘Techni-
que of the Year, 2008’ by Nature Methods [117,118]. SR refers to
several recently developed techniques by which the resolution
barrier of light microscopes, as defined in Abbe’s law, has been
broken and thus allows the generation of nanoscale images with
light microscopy. These techniques emerged from separate efforts
conducted by a handful of different laboratories and individuals
[118]. Some of these methods utilize single-molecule fluorescent
detection that takes advantage of photoactivable fluorescent indica-
tors. Here, repeated cycles of low-level excitation followed by
permanent photobleaching generates a series of images each
showing the location of only a few individual molecules. The
individual locations are then compiled from thousands of images
to reconstruct the distribution of a large number of molecules. These
methods include photoactivation localization microscopy (PALM)
[119] and FPALM (fluorescence PALM) [120]. A similar principle was
used in stochastic optical reconstruction microscopy (STORM) using
photoswitchable dyes [121]. An alternative way of increasing
resolution is to use special illumination to effectively decrease the
focal spot size in stimulated emission depletion (STED) microscopy
[122] and saturated structured illumination microscopy (SSIM) [123].
More detailed description and discussion of these techniques can be
found in articles by Lippincott-Schwartz, Lidke and Wilson, and
Larson et al. in this issue.
Review Trends in Cell Biology Vol.19 No.11
dynamics of protein trafficking [12]. However, the GFP tagitself can affect protein localization, and expressedproteins may not have their binding partner present insufficient amounts for proper trafficking or localization,sometimes leading to false results (See Figure 1A andSnapp, in this issue).
It is a completely different task to design fluorescentprobes that allow quantitative assessment of concen-trations or activation states of molecules. Such probes haveto possess conformation-specific recognition. In the sim-plest cases the activation status of a protein is reflected inthe redistribution of the fluorescent probe within the cells.For example, a fluorescent protein module is recruitedfrom the cytosol to the plasma membrane where it bindsto a specific conformation of a plasma membrane protein(Figure 1B). This principle is very simple, and is oftensufficient to follow the activation process, but this will notwork if the amount of the probe that is moving representsonly a small fraction of the total fluorescence expressed inthe cytosol. In the case of most protein targets, the proteinof interest has to be transfected along with the reporterconstruct. However, this method is being used successfullyto detect lipid messengers in the membrane (see below).The quantification of the recruitment process is not easilyachievable in single cells (see Ref. [13] for some examples).
An ideal probe alters its fluorescence properties in aconformation-specific manner. This is best exemplified bythe small fluorescent molecules used for measurements ofintracellular Ca2+ or other ions [14]. These probes drasti-cally change their emission or excitation spectra upon ion-binding (Figure 1C). Similarly useful are fluorescent mol-ecules that change their properties depending on thehydrophobicity of their environment. Such fluorescentmolecules can be conjugated to recombinant proteins orattached with relatively simple chemistry to geneticallyencoded tags such as the tetracysteine tag [15], the SNAP-tag [16], or Halotag [17], or can be recognized and high-lighted by single chain antibodies [18]. Proper placement ofsuch fluorophores can effectively report a conformationchange because they alter their fluorescence to reflectthe changing hydrophobicity of their surroundings(Figure 1D). Unfortunately, genetically engineered fluor-escent proteins usually do not show profound spectralchanges upon conformation change in the protein to whichthey are attached. There are, however, exceptions to this
576
rule, as one of the most robust Ca2+ indicators only con-tains a single fluorophore (a circularly permutated EGFP)placed between calmodulin and the M13 peptide frommyosin light chain kinase (MLCK) [19–22] (see below)(Figure 1E). Some fluorescent proteins show significantpH sensitivity (normally an undesirable feature) that canbe utilized to monitor pH changes in vesicular compart-ments [23], but this cannot be used to monitor confor-mation transitions. This caveat is addressed by utilizingForster resonance energy transfer (FRET) between twogenetically engineered fluorescent proteins placed in theappropriate positions relative to one another (see Box 2).Although FRET is often discussed in the context of chan-ging molecular distance, the dipole orientation of the twofluorophores also has a significant impact on the FRETefficiency that can be detected. Therefore, many of theintramolecular FRET sensors (in which both fluorophoresare part of the same molecular probe) register changes inFRET – either an increase or a decrease – due to changes inorientation instead of, or in addition to, changing thedistance between the two fluorophores. These principlesare utilized by most currently used FRET sensors [24,25](Figure 1F).
Measuring the activation state of GPCRsGPCRs undergo a conformation change upon binding ofagonist-ligands (Figure 2A). This conformation change isthe result of the repositioning of the transmembranehelices that eventually affect regions in the inner side ofthe protein. One such change is the movement of intra-cellular (IC) loops (usually but not exclusively the 3rd ICloop) that affects the interaction with heterotrimeric Gproteins and perhaps with other proteins such as G proteinreceptor kinases (GRKs) [26]. Another well-documentedchange is the exposure of the receptor’s tail region thatusually undergoes phosphorylation followed by interactionwith arrestins [27]. Ligand activation and the ensuingconformation change can elicit a FRET response in GPCRstagged with a pair of fluorescent molecules (such as CFPand YFP), one placed within one of the intracellular loopsand the other in the tail of GPCRs (Figure 2B). Thismethodwas first introduced using a2-adrenergic receptors withCFP and YFPmolecules added in the 3rd intracellular loopand at the end of the tail, respectively [28]. Althoughattachment of a GFP molecule to the tails of GPCRs is
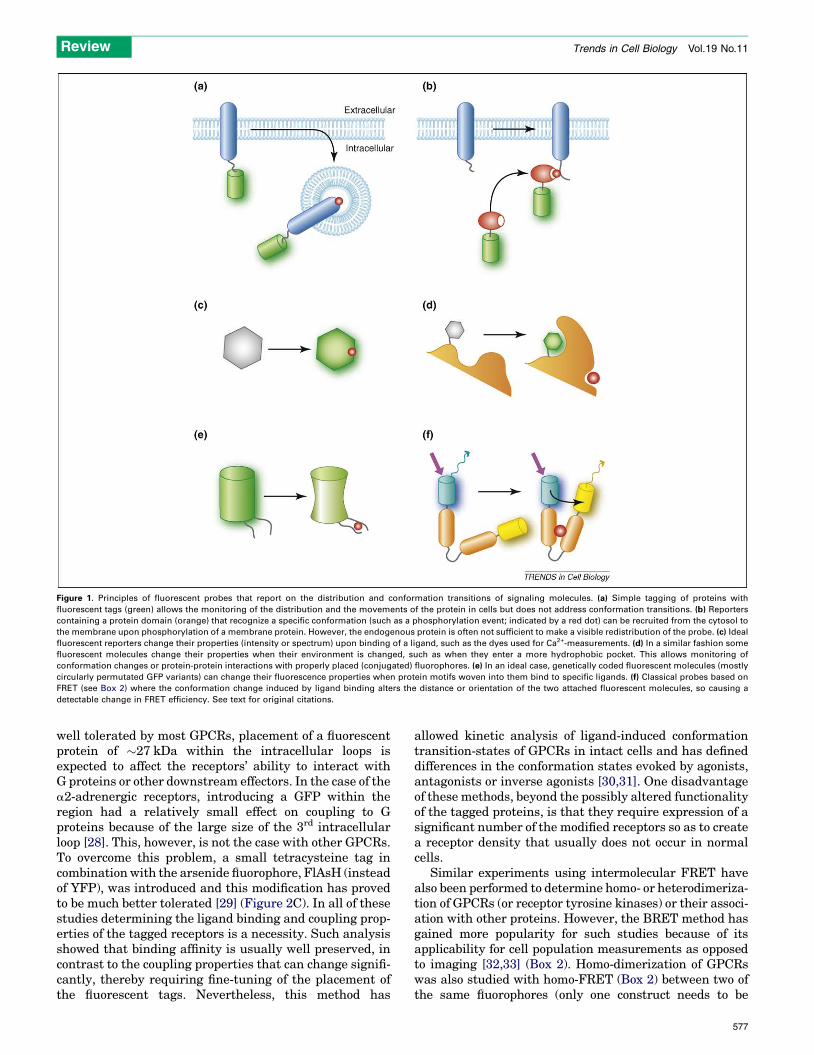
Figure 1. Principles of fluorescent probes that report on the distribution and conformation transitions of signaling molecules. (a) Simple tagging of proteins with
fluorescent tags (green) allows the monitoring of the distribution and the movements of the protein in cells but does not address conformation transitions. (b) Reporters
containing a protein domain (orange) that recognize a specific conformation (such as a phosphorylation event; indicated by a red dot) can be recruited from the cytosol to
the membrane upon phosphorylation of a membrane protein. However, the endogenous protein is often not sufficient to make a visible redistribution of the probe. (c) Ideal
fluorescent reporters change their properties (intensity or spectrum) upon binding of a ligand, such as the dyes used for Ca2+-measurements. (d) In a similar fashion some
fluorescent molecules change their properties when their environment is changed, such as when they enter a more hydrophobic pocket. This allows monitoring of
conformation changes or protein-protein interactions with properly placed (conjugated) fluorophores. (e) In an ideal case, genetically coded fluorescent molecules (mostly
circularly permutated GFP variants) can change their fluorescence properties when protein motifs woven into them bind to specific ligands. (f) Classical probes based on
FRET (see Box 2) where the conformation change induced by ligand binding alters the distance or orientation of the two attached fluorescent molecules, so causing a
detectable change in FRET efficiency. See text for original citations.
Review Trends in Cell Biology Vol.19 No.11
well tolerated by most GPCRs, placement of a fluorescentprotein of �27 kDa within the intracellular loops isexpected to affect the receptors’ ability to interact withG proteins or other downstream effectors. In the case of thea2-adrenergic receptors, introducing a GFP within theregion had a relatively small effect on coupling to Gproteins because of the large size of the 3rd intracellularloop [28]. This, however, is not the case with other GPCRs.To overcome this problem, a small tetracysteine tag incombination with the arsenide fluorophore, FlAsH (insteadof YFP), was introduced and this modification has provedto be much better tolerated [29] (Figure 2C). In all of thesestudies determining the ligand binding and coupling prop-erties of the tagged receptors is a necessity. Such analysisshowed that binding affinity is usually well preserved, incontrast to the coupling properties that can change signifi-cantly, thereby requiring fine-tuning of the placement ofthe fluorescent tags. Nevertheless, this method has
allowed kinetic analysis of ligand-induced conformationtransition-states of GPCRs in intact cells and has defineddifferences in the conformation states evoked by agonists,antagonists or inverse agonists [30,31]. One disadvantageof these methods, beyond the possibly altered functionalityof the tagged proteins, is that they require expression of asignificant number of the modified receptors so as to createa receptor density that usually does not occur in normalcells.
Similar experiments using intermolecular FRET havealso been performed to determine homo- or heterodimeriza-tion of GPCRs (or receptor tyrosine kinases) or their associ-ation with other proteins. However, the BRET method hasgained more popularity for such studies because of itsapplicability for cell population measurements as opposedto imaging [32,33] (Box 2). Homo-dimerization of GPCRswas also studied with homo-FRET (Box 2) between two ofthe same fluorophores (only one construct needs to be
577
Review Trends in Cell Biology Vol.19 No.11
transfected) [34], but the measurements of fluorescenceanisotropy decay needed for homo-FRET analysis requiresspecial instrumentation.
Additional methods to determine the kinetics and con-formation transitionsofGPCRshavebeenbasedonenviron-ment-sensitive fluorescein-maleimide derivativesconjugated to cysteines placed at different positions in areceptor in which all other reactive cysteines were mutatedto alanines [35,36]. Thismethod, however, required purifiedreceptors labeled with the respective fluorophores and didnot allow studies of in situ receptors within the intact cell.
Probes to test the activation status of G-proteinsHeterotrimeric G proteins
G-protein coupling and activation is almost inseparablefrom GPCR function. Heterotrimeric G proteins are mem-brane-associated transducing modules that consist of alarger a-subunit that is palmitoylated and smaller b andg subunits that form a stable dimer that is also anchored tomembranes by lipid modification [37]. It has long beenpostulated that activated GPCRs cause a dissociation ofGa and Gbg subunits and allow the exchange of GDP toGTP within the Ga subunits to generate the active confor-mation ready to engage different effector proteins [38](Figure 2A). It is now understood that free bg subunitscan also activate several effectors including enzymes andion channels.What remainsambiguous ishowtheG-protein
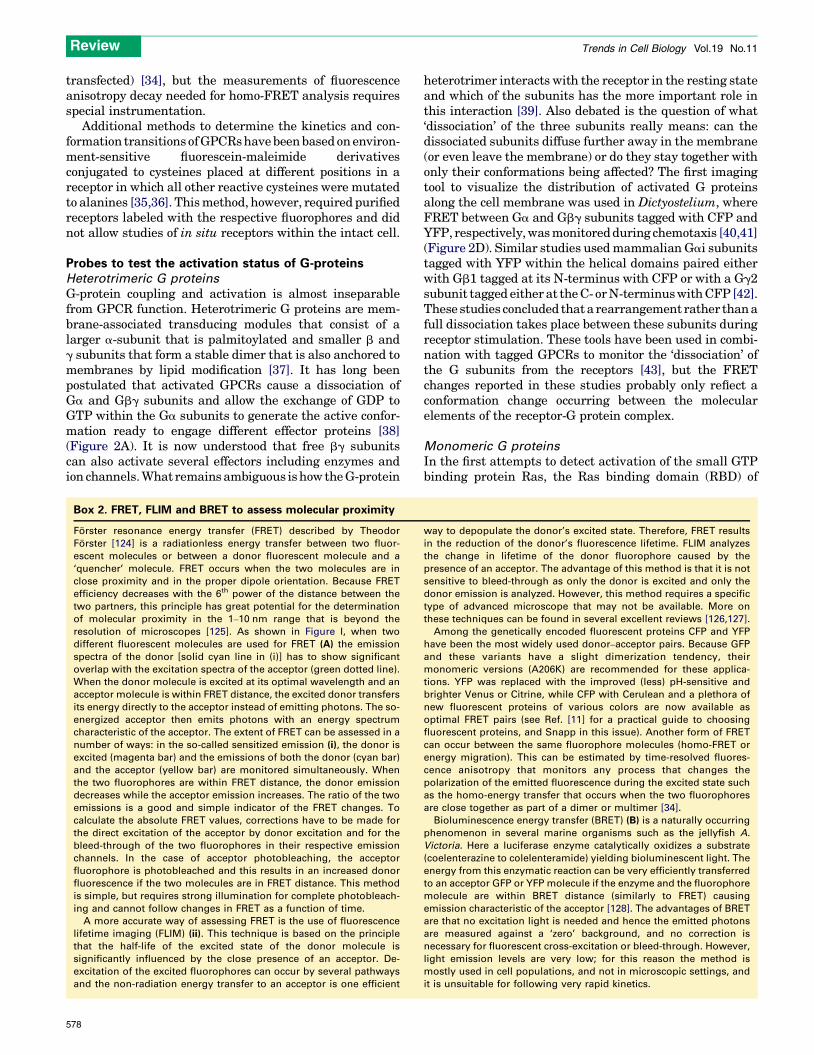
Box 2. FRET, FLIM and BRET to assess molecular proximity
Forster resonance energy transfer (FRET) described by Theodor
Forster [124] is a radiationless energy transfer between two fluor-
escent molecules or between a donor fluorescent molecule and a
‘quencher’ molecule. FRET occurs when the two molecules are in
close proximity and in the proper dipole orientation. Because FRET
efficiency decreases with the 6th power of the distance between the
two partners, this principle has great potential for the determination
of molecular proximity in the 1–10 nm range that is beyond the
resolution of microscopes [125]. As shown in Figure I, when two
different fluorescent molecules are used for FRET (A) the emission
spectra of the donor [solid cyan line in (i)] has to show significant
overlap with the excitation spectra of the acceptor (green dotted line).
When the donor molecule is excited at its optimal wavelength and an
acceptor molecule is within FRET distance, the excited donor transfers
its energy directly to the acceptor instead of emitting photons. The so-
energized acceptor then emits photons with an energy spectrum
characteristic of the acceptor. The extent of FRET can be assessed in a
number of ways: in the so-called sensitized emission (i), the donor is
excited (magenta bar) and the emissions of both the donor (cyan bar)
and the acceptor (yellow bar) are monitored simultaneously. When
the two fluorophores are within FRET distance, the donor emission
decreases while the acceptor emission increases. The ratio of the two
emissions is a good and simple indicator of the FRET changes. To
calculate the absolute FRET values, corrections have to be made for
the direct excitation of the acceptor by donor excitation and for the
bleed-through of the two fluorophores in their respective emission
channels. In the case of acceptor photobleaching, the acceptor
fluorophore is photobleached and this results in an increased donor
fluorescence if the two molecules are in FRET distance. This method
is simple, but requires strong illumination for complete photobleach-
ing and cannot follow changes in FRET as a function of time.
A more accurate way of assessing FRET is the use of fluorescence
lifetime imaging (FLIM) (ii). This technique is based on the principle
that the half-life of the excited state of the donor molecule is
significantly influenced by the close presence of an acceptor. De-
excitation of the excited fluorophores can occur by several pathways
and the non-radiation energy transfer to an acceptor is one efficient
578
heterotrimer interacts with the receptor in the resting stateand which of the subunits has the more important role inthis interaction [39]. Also debated is the question of what‘dissociation’ of the three subunits really means: can thedissociated subunits diffuse further away in the membrane(or even leave the membrane) or do they stay together withonly their conformations being affected? The first imagingtool to visualize the distribution of activated G proteinsalong the cell membrane was used in Dictyostelium, whereFRET between Ga and Gbg subunits tagged with CFP andYFP, respectively,wasmonitoredduring chemotaxis [40,41](Figure 2D). Similar studies usedmammalian Gai subunitstagged with YFP within the helical domains paired eitherwith Gb1 tagged at its N-terminus with CFP or with a Gg2subunit tagged either at theC- orN-terminuswithCFP [42].These studies concluded thata rearrangement rather thanafull dissociation takes place between these subunits duringreceptor stimulation. These tools have been used in combi-nation with tagged GPCRs to monitor the ‘dissociation’ ofthe G subunits from the receptors [43], but the FRETchanges reported in these studies probably only reflect aconformation change occurring between the molecularelements of the receptor-G protein complex.
Monomeric G proteins
In the first attempts to detect activation of the small GTPbinding protein Ras, the Ras binding domain (RBD) of
way to depopulate the donor’s excited state. Therefore, FRET results
in the reduction of the donor’s fluorescence lifetime. FLIM analyzes
the change in lifetime of the donor fluorophore caused by the
presence of an acceptor. The advantage of this method is that it is not
sensitive to bleed-through as only the donor is excited and only the
donor emission is analyzed. However, this method requires a specific
type of advanced microscope that may not be available. More on
these techniques can be found in several excellent reviews [126,127].
Among the genetically encoded fluorescent proteins CFP and YFP
have been the most widely used donor–acceptor pairs. Because GFP
and these variants have a slight dimerization tendency, their
monomeric versions (A206K) are recommended for these applica-
tions. YFP was replaced with the improved (less) pH-sensitive and
brighter Venus or Citrine, while CFP with Cerulean and a plethora of
new fluorescent proteins of various colors are now available as
optimal FRET pairs (see Ref. [11] for a practical guide to choosing
fluorescent proteins, and Snapp in this issue). Another form of FRET
can occur between the same fluorophore molecules (homo-FRET or
energy migration). This can be estimated by time-resolved fluores-
cence anisotropy that monitors any process that changes the
polarization of the emitted fluorescence during the excited state such
as the homo-energy transfer that occurs when the two fluorophores
are close together as part of a dimer or multimer [34].
Bioluminescence energy transfer (BRET) (B) is a naturally occurring
phenomenon in several marine organisms such as the jellyfish A.
Victoria. Here a luciferase enzyme catalytically oxidizes a substrate
(coelenterazine to colelenteramide) yielding bioluminescent light. The
energy from this enzymatic reaction can be very efficiently transferred
to an acceptor GFP or YFP molecule if the enzyme and the fluorophore
molecule are within BRET distance (similarly to FRET) causing
emission characteristic of the acceptor [128]. The advantages of BRET
are that no excitation light is needed and hence the emitted photons
are measured against a ‘zero’ background, and no correction is
necessary for fluorescent cross-excitation or bleed-through. However,
light emission levels are very low; for this reason the method is
mostly used in cell populations, and not in microscopic settings, and
it is unsuitable for following very rapid kinetics.
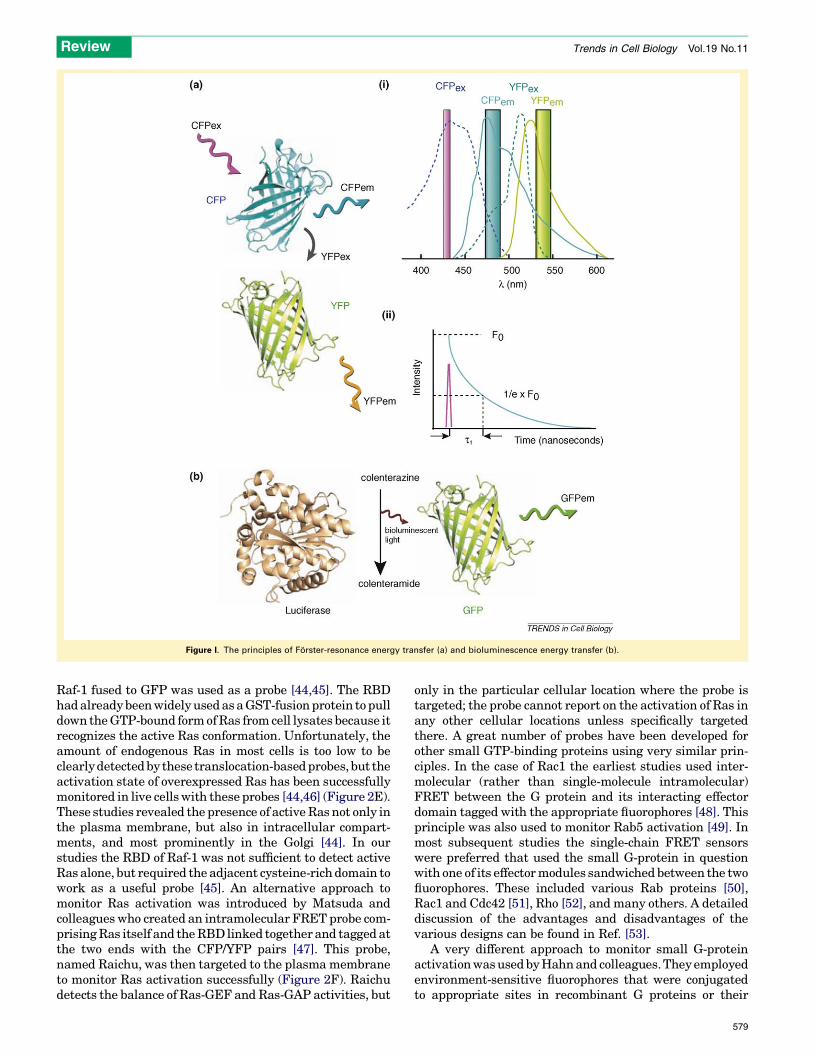
Figure I. The principles of Forster-resonance energy transfer (a) and bioluminescence energy transfer (b).
Review Trends in Cell Biology Vol.19 No.11
Raf-1 fused to GFP was used as a probe [44,45]. The RBDhadalreadybeenwidelyusedasaGST-fusionprotein topulldown theGTP-bound formofRas fromcell lysates because itrecognizes the active Ras conformation. Unfortunately, theamount of endogenous Ras in most cells is too low to beclearlydetectedby these translocation-basedprobes, but theactivation state of overexpressed Ras has been successfullymonitored in live cellswith these probes [44,46] (Figure 2E).These studies revealed the presence of activeRas not only inthe plasma membrane, but also in intracellular compart-ments, and most prominently in the Golgi [44]. In ourstudies the RBD of Raf-1 was not sufficient to detect activeRas alone, but required the adjacent cysteine-rich domain towork as a useful probe [45]. An alternative approach tomonitor Ras activation was introduced by Matsuda andcolleagues who created an intramolecular FRET probe com-prisingRas itself and theRBDlinked togetherand tagged atthe two ends with the CFP/YFP pairs [47]. This probe,named Raichu, was then targeted to the plasmamembraneto monitor Ras activation successfully (Figure 2F). Raichudetects the balance of Ras-GEF and Ras-GAP activities, but
only in the particular cellular location where the probe istargeted; the probe cannot report on the activation of Ras inany other cellular locations unless specifically targetedthere. A great number of probes have been developed forother small GTP-binding proteins using very similar prin-ciples. In the case of Rac1 the earliest studies used inter-molecular (rather than single-molecule intramolecular)FRET between the G protein and its interacting effectordomain tagged with the appropriate fluorophores [48]. Thisprinciple was also used to monitor Rab5 activation [49]. Inmost subsequent studies the single-chain FRET sensorswere preferred that used the small G-protein in questionwith one of its effectormodules sandwichedbetween the twofluorophores. These included various Rab proteins [50],Rac1 and Cdc42 [51], Rho [52], and many others. A detaileddiscussion of the advantages and disadvantages of thevarious designs can be found in Ref. [53].
A very different approach to monitor small G-proteinactivationwasusedbyHahnand colleagues.Theyemployedenvironment-sensitive fluorophores that were conjugatedto appropriate sites in recombinant G proteins or their
579
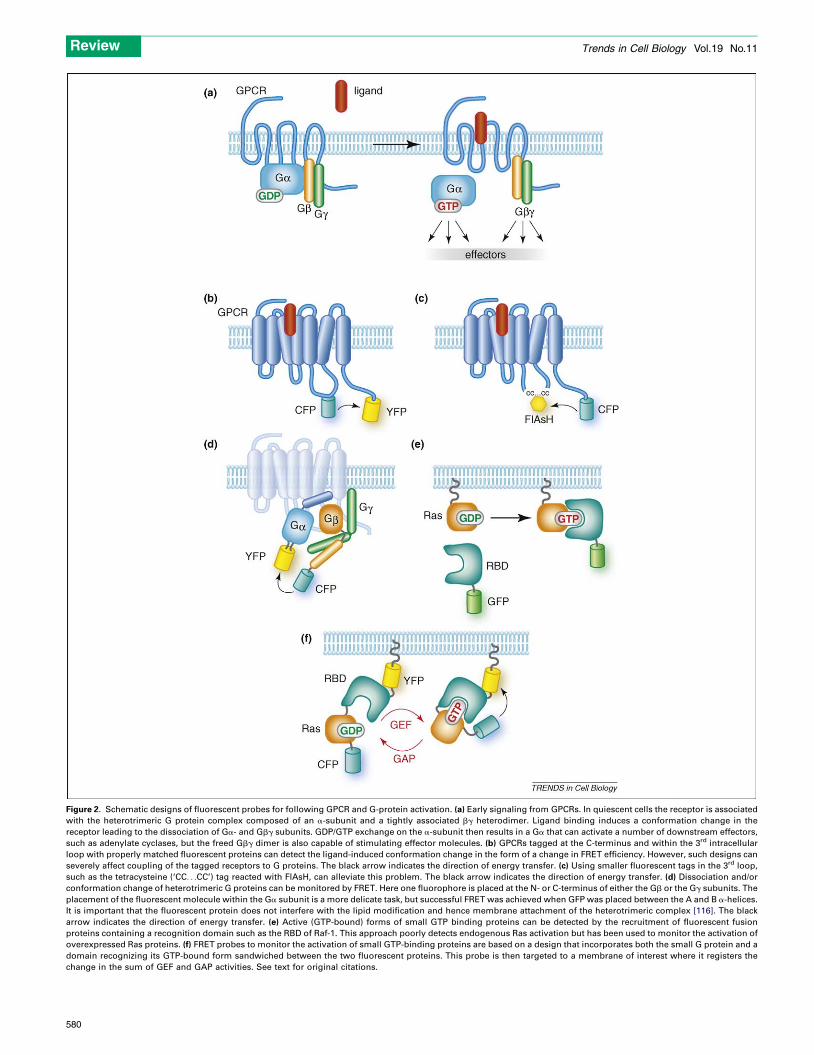
Figure 2. Schematic designs of fluorescent probes for following GPCR and G-protein activation. (a) Early signaling from GPCRs. In quiescent cells the receptor is associated
with the heterotrimeric G protein complex composed of an a-subunit and a tightly associated bg heterodimer. Ligand binding induces a conformation change in the
receptor leading to the dissociation of Ga- and Gbg subunits. GDP/GTP exchange on the a-subunit then results in a Ga that can activate a number of downstream effectors,
such as adenylate cyclases, but the freed Gbg dimer is also capable of stimulating effector molecules. (b) GPCRs tagged at the C-terminus and within the 3rd intracellular
loop with properly matched fluorescent proteins can detect the ligand-induced conformation change in the form of a change in FRET efficiency. However, such designs can
severely affect coupling of the tagged receptors to G proteins. The black arrow indicates the direction of energy transfer. (c) Using smaller fluorescent tags in the 3rd loop,
such as the tetracysteine (‘CC. . .CC’) tag reacted with FlAsH, can alleviate this problem. The black arrow indicates the direction of energy transfer. (d) Dissociation and/or
conformation change of heterotrimeric G proteins can be monitored by FRET. Here one fluorophore is placed at the N- or C-terminus of either the Gb or the Gg subunits. The
placement of the fluorescent molecule within the Ga subunit is a more delicate task, but successful FRET was achieved when GFP was placed between the A and B a-helices.
It is important that the fluorescent protein does not interfere with the lipid modification and hence membrane attachment of the heterotrimeric complex [116]. The black
arrow indicates the direction of energy transfer. (e) Active (GTP-bound) forms of small GTP binding proteins can be detected by the recruitment of fluorescent fusion
proteins containing a recognition domain such as the RBD of Raf-1. This approach poorly detects endogenous Ras activation but has been used to monitor the activation of
overexpressed Ras proteins. (f) FRET probes to monitor the activation of small GTP-binding proteins are based on a design that incorporates both the small G protein and a
domain recognizing its GTP-bound form sandwiched between the two fluorescent proteins. This probe is then targeted to a membrane of interest where it registers the
change in the sum of GEF and GAP activities. See text for original citations.
Review Trends in Cell Biology Vol.19 No.11
580
Review Trends in Cell Biology Vol.19 No.11
effectors and injected into live cells (see Figure 1D for theprinciple of this technique). The method was used to imageactivated Cdc42 [54] and RhoA [55] during cell migration.The advantage of this method is that it is more sensitivethan the FRET-based probes and small amounts of injectedproteins are sufficient to detect the activation of the Gprotein without distortion of the biology. Disadvantagesof the method are that it requires conjugation of the fluor-ophore to recombinant proteins at specific sites that can bechallenging and requires injection of the protein into cells.
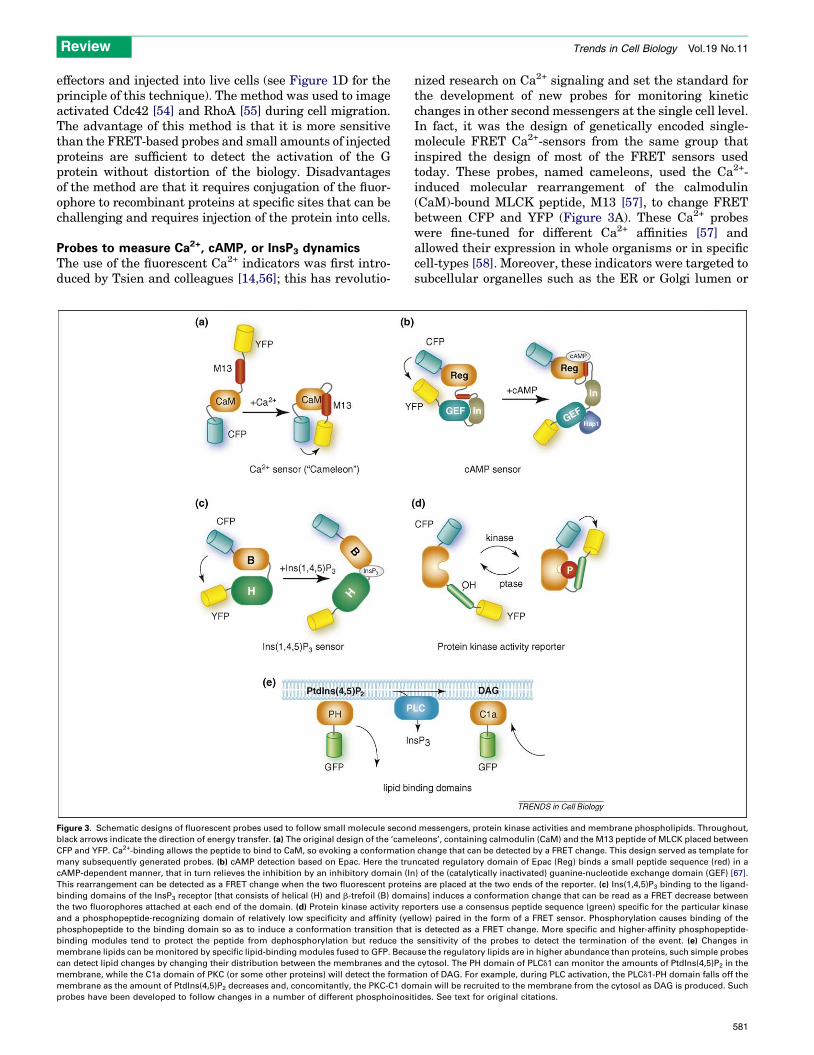
Probes to measure Ca2+, cAMP, or InsP3 dynamicsThe use of the fluorescent Ca2+ indicators was first intro-duced by Tsien and colleagues [14,56]; this has revolutio-
Figure 3. Schematic designs of fluorescent probes used to follow small molecule secon
black arrows indicate the direction of energy transfer. (a) The original design of the ‘came
CFP and YFP. Ca2+-binding allows the peptide to bind to CaM, so evoking a conformation
many subsequently generated probes. (b) cAMP detection based on Epac. Here the tru
cAMP-dependent manner, that in turn relieves the inhibition by an inhibitory domain (In
This rearrangement can be detected as a FRET change when the two fluorescent protei
binding domains of the InsP3 receptor [that consists of helical (H) and b-trefoil (B) doma
the two fluorophores attached at each end of the domain. (d) Protein kinase activity rep
and a phosphopeptide-recognizing domain of relatively low specificity and affinity (ye
phosphopeptide to the binding domain so as to induce a conformation transition that
binding modules tend to protect the peptide from dephosphorylation but reduce the
membrane lipids can be monitored by specific lipid-binding modules fused to GFP. Beca
can detect lipid changes by changing their distribution between the membranes and the
membrane, while the C1a domain of PKC (or some other proteins) will detect the forma
membrane as the amount of PtdIns(4,5)P2 decreases and, concomitantly, the PKC-C1 do
probes have been developed to follow changes in a number of different phosphoinosi
nized research on Ca2+ signaling and set the standard forthe development of new probes for monitoring kineticchanges in other second messengers at the single cell level.In fact, it was the design of genetically encoded single-molecule FRET Ca2+-sensors from the same group thatinspired the design of most of the FRET sensors usedtoday. These probes, named cameleons, used the Ca2+-induced molecular rearrangement of the calmodulin(CaM)-bound MLCK peptide, M13 [57], to change FRETbetween CFP and YFP (Figure 3A). These Ca2+ probeswere fine-tuned for different Ca2+ affinities [57] andallowed their expression in whole organisms or in specificcell-types [58]. Moreover, these indicators were targeted tosubcellular organelles such as the ER or Golgi lumen or
d messengers, protein kinase activities and membrane phospholipids. Throughout,
leons’, containing calmodulin (CaM) and the M13 peptide of MLCK placed between
change that can be detected by a FRET change. This design served as template for
ncated regulatory domain of Epac (Reg) binds a small peptide sequence (red) in a
) of the (catalytically inactivated) guanine-nucleotide exchange domain (GEF) [67].
ns are placed at the two ends of the reporter. (c) Ins(1,4,5)P3 binding to the ligand-
ins] induces a conformation change that can be read as a FRET decrease between
orters use a consensus peptide sequence (green) specific for the particular kinase
llow) paired in the form of a FRET sensor. Phosphorylation causes binding of the
is detected as a FRET change. More specific and higher-affinity phosphopeptide-
sensitivity of the probes to detect the termination of the event. (e) Changes in
use the regulatory lipids are in higher abundance than proteins, such simple probes
cytosol. The PH domain of PLCd1 can monitor the amounts of PtdIns(4,5)P2 in the
tion of DAG. For example, during PLC activation, the PLCd1-PH domain falls off the
main will be recruited to the membrane from the cytosol as DAG is produced. Such
tides. See text for original citations.
581
Review Trends in Cell Biology Vol.19 No.11
into themitochondrialmatrix (reviewed in Ref. [59]). Theseprobes underwent significant evolution that changed thefluorophores [22,57] or replaced calmodulin/M13 with tro-ponin C as the Ca2+-binding module [60]. Although some-what counter-intuitive, one of the best genetically encodedCa2+ probes, GCaMP2 (or pericam), consists of only onefluorophore – a circularly permutated EGFP – CaMand theM13 peptide, yet Ca2+ binding causes a significant spectralchange in its fluorescence [21,22]. How the rearrangementof the Ca2+-binding module leads to changes in fluor-escence had just begun to unfold when the crystal structureof this probewas recently solved in its Ca2+-free and -boundstates [61]. Other single fluorophore-based Ca2+ sensorscontaining a Ca2+-binding EF-hand placed between the b-strands of the fluorophore barrel have also been used withsome success [62] (see Figure 1E for this principle of thismethod). Another Ca2+-sensor specifically designed totrack ER luminal Ca2+ was based on the Ca2+/calreticu-lin-induced conformation of the kringle domain of apo(A)[63]. This probe has the advantage of not buffering Ca2+ asit does not contain a Ca2+ binding site, but can stillsequester Ca2+/calreticulin. Detailed description and com-parison of most of these probes can be found in recentreviews [58,59].
Although cAMP was the first second messengerdescribed (beyond Ca2+), it took some time before probeswere developed to follow cAMP changes in living cells. Thefirst cAMP probe took advantage of the cAMP-induceddissociation of the regulatory and catalytic subunits ofPKA as the readout by measuring the cAMP-induceddecrease of FRET between these molecules [64]. However,in the initial reports the production of recombinantproteins and fluorescent labeling in vitro was requiredas well as injection of the purified proteins into cells[64]. Soon this approach was simplified by using theCFP/YFP pairs to tag the catalytic and regulatory subu-nits, respectively, so allowing expression of these proteinswithin the cell [65]. Because of the relatively slow dis-sociation of these subunits, however, more useful probes tofollow rapid cAMP kinetics were developed using thecAMP-binding segment of the cAMP-sensitive Rap1nucleotide exchange factor, Epac [66–68]. These single-molecule FRET-based cAMP sensors gave a whole newdimension to cAMP research and significant efforts werecommitted to the optimization of their performance [69].Comparison of the signals obtained with these cAMPprobes with those that record PKA enzyme activity (seebelow) has helped to highlight the importance of compart-mentalized signal transmission [70]. A similar develop-ment led from an original, PKG-based intramolecularsensor for cGMP [71] to a newer sensor based on theisolated nucleotide-binding domain of phosphodiesterase5 [72].
For those who have studied the mechanism of action ofCa2+-mobilizing hormones, the discovery that Ins(1,4,5)P3
provides the link between phosphoinositide turnover andCa2+mobilization [5] was a definingmoment. Ever since itsdiscovery there has been a desire to monitor Ins(1,4,5)P3
changes in individual cells. This has only become possibleafter the cloning of the Ins(1,4,5)P3 receptors and theunderstanding of the features of their Ins(1,4,5)P3 binding
582
domain [73–75]. The minimal Ins(1,4,5)P3 binding regionwas then used sandwiched between YFP and CFP as anInsP3 sensor by several groups [76–78] including our own[79]. Some of these constructs showed better responsesthan others because of the varying affinities to Ins(1,4,5)P3,and the best of these, termed IRIS, was the result ofthorough optimization [78]. Several studies also suggestedthat the Ins(1,4,5)P3-induced displacement of thePLCd1PH domain from membrane PtdIns(4,5)P2 (seebelow) could be used as an Ins(1,4,5)P3 reporter [80].Although translocation of the PLCd1PH domain fromthe membrane to the cytosol is a good reflection of PLCactivation, the probe does not solely reflect changes inIns(1,4,5)P3 levels (see Ref. [81] for a discussion of thisproblem).
Probes to measure protein kinase or phosphataseactivitiesProtein phosphorylation cascades are the ultimate meansof information flow along diverse signaling pathways [6].The principle underlying the analysis of kinase activities insingle cells is again based on FRET changes elicited whenphosphorylation of a peptide induces binding to a down-stream effector protein [82]. This phosphorylation-depend-ent binding can be translated to changes in FRETusing theusual CFP/YFP pairs of fluorophores. In the case of PKAthe first such reporter, AKAR (A-kinase activity reporter),contained a peptide with a PKA consensus phosphoryl-ation site and the 14-3-3 protein as the phosphopeptide-binding module placed between the two fluorescentproteins [83]. Nuclear targeting or tethering of this repor-ter to A-kinase itself clearly showed kinetic differences ofPKA activation, emphasizing the impact of compartmen-talized substrate placement [83]. Because of the tightbinding of 14-3-3 to the phosphopeptide, the AKAR repor-ter interfered with dephosphorylation and was slow toregister a decrease in PKA activity. An improved versionof the reporter (AKAR2) was thenmade by substituting the14-3-3 module with the forkhead associated domain 1(FHA1), a low-specificity phosphothreonine-bindingdomain with submicromolar binding affinity. Additionally,the peptide sequence was optimized for better interactionwith FHA1[84]. Based on this general design similarreporters were developed for PKC [85,86], PKB/Akt[87,88], and PKD [89]. Another Akt activity reporter usedbioluminescence complementation in which the FHA1-peptide module was placed between two halves of fireflyluciferase. Here, Akt activation separates the luciferasehalves causing a decrease in bioluminescence [90]. Anadvantage of all of these indicators is that they can betargeted to different cell or membrane compartmentswhere they report significant differences between theiractivation patterns [86,91].
The first tyrosine kinase reporters were designed withsimilar principles using specific SH2 domains as phospho-tyrosyl recognition domains for EGFR and Src and thewhole CRK molecule for Abl, in each case placed betweenthe CFP/YFP pairs of fluorophores [92]. Because the earlySrc reporter showed poor specificity, an improved versionwas made using a peptide sequence from p130cas as thephosphate acceptor module [93]. Targeting of this Src
Review Trends in Cell Biology Vol.19 No.11
reporter to ‘raft’ and ‘non-raft’ regions of the plasma mem-brane revealed dramatic differences in the speed andextent of activation after growth factor stimulation [94].
Similar FRET-based probes are also being developed tofollow phosphatase activation. A calcineurin-activity probehas recently been reported based on a truncated version ofthe transcription factorNFAT1 that contains itsN-terminalregulatory domain [95]. This reporter, termed CaNAR1,shows promise and will probably be followed by other phos-phatase reporters, although the limited specificity of phos-phatases against phosphorylated target sequences makesthis task more challenging than in the case of kinases.
Making lipid messengers visibleAlthough the importance of lipid messengers in cell regu-lation has long been established, the study of lipids hasalways been more difficult than of proteins. Lipids requirespecial extraction and separation procedures, they aremostly detected by isotope incorporation with complexlabeling kinetics, and are not as easy as proteins to detectwith antibodies. However, the importance of phosphoinosi-tides, serving not only as precursors of important messen-gers such as DAG and Ins(1,4,5)P3, but also as membrane-bound regulators and organizers of signaling domains [96],has made these lipids the focus of enormous interest. Thehighly compartmentalized production and actions of phos-phoinositides demanded the development of new methodsfor their visualization. This was achieved by simple proteinmodules originating from proteins that specifically recog-nize and respond to lipid changes when fused to GFPvariants.
Diacylglycerol (DAG)
DAG is one of the most important lipid second messengersgenerated from phosphoinositides by PLC activation, orindirectly from phosphatidylcholine by PLD and phospha-tidic acid phosphohydrolase. DAG imaging was based onDAG binding to C1 domains found in several proteins,including PKC, PKD, and many others [97], and severalsuch sensors have been introduced [98–100]. Most of thesereport on DAG production by their recruitment from thecytosol to the site of DAG formation, mostly at the plasmamembrane (Figure 3E), but FRET-based sensors using C1domains and targeted to different membranes have alsobeen reported [101].
Phosphatidic acid (PtdA)
Several protein domains are known to bind to PtdA [102],including the PX domain of p47phox [103], a PtdA-recog-nizing domain of Raf-1 [104], and protein phosphatase-1g
[105]. Imaging PtdA distribution in live cells has beenreported using the GFP-fused PtdA binding domain ofthe yeast Spo20p protein [106]. However, not enoughreports have been published using this probe to judge itsgeneral utility for PtdA imaging, even though many inves-tigators have expressed desire to find a reliable probe tomonitor PtdA changes inside the cell.
Phosphoinositides
Phosphoinositide imaging was made possible after the dis-covery of the phosphoinositide binding of pleckstrin
homology (PH) domains [107], followed by the identificationof other phosphoinositide recognizing domains such as theFYVE domains [108] or PX domains [109]. GFP-fused PHdomains have been used to image PtdIns(4,5)P2, PtdIns3P,PtdIns(3,4)P2 and PtdIns4P (see Ref. [13] for a detailed listand original citations). There are published reports onproteins recognizing PtdIns5P and PtdIns(3,5)P2 [13] butimaging of these lipidshasnot beenas successful aswith theother lipid species. Similarly, no success has yet beenreported with the imaging of PtdIns itself. The successfulinositol lipid probes again report on lipid production bytranslocating from the cytosol to the site where the lipidaccumulates (Figure 3E), but in some instances the localiz-ation of the probe to the membrane also depends on othermembrane components (usually active small GTP-bindingproteins). This is especially true for domains that recognizemono-phosphorylated inositides. This dual recognition andthe inhibitory effect of the domains at high expression levelson trafficking and signaling limit their usefulness. Therehave been successful attempts to use FRET for phosphoi-nositide detection. In the simplest approach, two versions oftheprobes – one taggedwithCFP, the otherwithYFP –wereco-transfected into cells and FRET was detected only whenthe probes were recruited to the membranes [110]. It is noteasy to design a single molecule FRET probe for lipiddetection because PH domains usually do not undergo alarge conformation change upon lipid binding. To overcomethis problem single molecule FRET probes were designedwhere the Akt PH domain was combined with a basic‘pseudo ligand’ peptide or protein sequence that presumablyoccupied the PtdIns(3,4,5)P3 binding site in the absence ofthe lipid but was displaced upon lipid binding, so inducing aconformation change that could be monitored by FRET[87,111]. This design, however, has not been generallyapplied to inositide imaging. Even so, these tools havehelped to advance the field tremendously. Detailed descrip-tions of phosphoinositide imaging tools including technicalnotes have appeared in several recent publications[112,113].
Concluding remarksProgress in signal transduction research over the last 40yearshasbeenbreathtaking. It isnoteworthy,however, thatthe diversity of cell surface receptors and the complexity ofthe kinase cascades contrasts with the small number ofsecond messenger mechanisms. In a majority of signalingcascades cAMP or Ca2+ serve as the second messenger,raising thequestionofwhycellsneed thevarietyof receptorsif most of these couple to one or other of these secondmessengers. The answer must lie in the compartmentaliza-tion and channeling of these signals to specific downstreameffector pathways. It is increasingly evident that cellsorganize their signal transduction molecules into signalingcomplexes in which the molecular interactions are linked tofunctionally distinct outcomes. The plethora of A-kinaseanchoring proteins (AKAPs) that serve as scaffolds to linkA-kinases and cAMP degradation to specific cellularresponses is a good example [114], as is the scaffolding oftheMAPKpathways [115]. Paradoxically, low-affinity inter-actions suit these forms of organization better as they onlyrespond to messengers that are locally generated, thereby
583
Review Trends in Cell Biology Vol.19 No.11
reaching the high local levels required to activate the effec-tor of the complex, and do not respond to the overallelevations measured in the cytoplasm. By the same token,the specificityof the signalingpathwaysprobablyworksbestat low levels of stimulation; themaximal stimulation that isoften used, because it generates a measurable signal, maylargely mask specificity. All of these considerations suggestthat we need to further refine our research tools in order tobe able to study signals during moderate stimulation andwithout significantdistortionby the reporters used.This is achallenging task aswe already find thatmost reporters onlygive reliable resultswhenused at such lowexpression levelsthat require the best microscopes with the highest sensi-tivity to followtheirfluorescence.This leavesa lotof roomforimprovement both on the side of chemistry and molecularbiology of fluorescent reporters and microscope sensitivity.Nevertheless, the tools listed in this brief review are testa-ments to the resolve and commitment of many scientists tothis cause, and guarantees continued progress not only inwhat signaling events we can observe but also how wecomprehend the principles that govern their organization.
AcknowledgementsThe research of TB is supported by the Intramural Research Program ofthe Eunice Kennedy Shriver National Institute of Child Health andHuman Development of the National Institutes of Health.
References1 Carnegie, G.K. et al. (2009) A-kinase anchoring proteins: from protein
complexes to physiology and disease. IUBMB Life 61, 394–4062 Kok, K. et al. (2009) Regulation of phosphoinositide 3-kinase
expression in health and disease. Trends Biochem. Sci. 34, 115–1273 Bezprozvanny, I. (2009) Calcium signaling and neurodegenerative
diseases. Trends Mol. Med. 15, 89–1004 Sutherland, E.W. and Rall, T.W. (1958) Fractionation and
characterization of a cyclic adenine ribonucleotide formed by tissueparticles. J. Biol. Chem. 232, 1077–1091
5 Streb, H. et al. (1983) Release of Ca2+ from a nonmitochondrialintracellular store in pancreatic acinar cells by inositol-1,4,5-trisphosphate. Nature 306, 67–68
6 Greengard, P. (1978) Phosphorylated proteins as physiologicaleffectors. Science 199, 146–152
7 Sala, G.B. et al. (1979) Adrenocorticotropin action in isolated adrenalcells. The intermediate role of cyclic AMP in stimulation ofcorticosterone synthesis. J. Biol. Chem. 254, 3861–3865
8 Rich, T.C. et al. (2001) A uniform m extracellular stimulus triggersdistinct cAMP signals in different compartments of a simple cell. Proc.Natl. Acad. Sci. U. S. A. 98, 13049–13054
9 Leroy, J. et al. (2008) Spatiotemporal dynamics of beta-adrenergiccAMP signals and L-type Ca2+ channel regulation in adult ratventricular myocytes: role of phosphodiesterases. Circ. Res. 102,1091–1100
10 Lemmon,M.A. (2008) Membrane recognition by phospholipid-bindingdomains. Nat. Rev. Mol. Cell Biol. 9, 99–111
11 Shaner, N.C. et al. (2005) A guide to choosing fluorescent proteins.Nat. Methods 2, 905–909
12 Lippincott-Schwartz, J. et al. (1999) Monitoring the dynamics andmobility of membrane proteins tagged with green fluorescent protein.Methods Cell Biol. 58, 261–281
13 Balla, T. and Varnai, P. (2009) Visualization of cellularphosphoinositide pools with GFP-fused protein-domains. Curr.Protoc. Cell Biol. Chapter 24, Unit 24.24
14 Grynkiewicz, G. et al. (1985) A new generation of Ca2+ indicators withgreatly improved fluorescence properties. J. Biol. Chem. 260, 3440–
345015 Adams, S.R. et al. (2002) New biarsenical ligands and tetracysteine
motifs for protein labeling in vitro and in vivo: synthesis and biologicalapplications. J. Am. Chem. Soc. 124, 6063–6076
584
16 Keppler, A. et al. (2003) A general method for the covalent labeling offusion proteins with small molecules in vivo. Nat. Biotechnol. 21, 86–
8917 Reck-Peterson, S.L. et al. (2006) Single-molecule analysis of dynein
processivity and stepping behavior. Cell 126, 335–34818 Szent-Gyorgyi, C. et al. (2008) Fluorogen-activating single-chain
antibodies for imaging cell surface proteins. Nat. Biotechnol. 26,235–240
19 Baird, G.S. et al. (1999) Circular permutation and receptor insertionwithin green fluorescent proteins. Proc. Natl. Acad. Sci. U. S. A. 96,11241–11246
20 Ohkura, M. et al. (2005) Genetically encoded bright Ca2+ probeapplicable for dynamic Ca2+ imaging of dendritic spines. Anal.Chem. 77, 5861–5869
21 Nagai, T. et al. (2001) Circularly permuted greenfluorescent proteinsengineered to sense Ca2+. Proc. Natl. Acad. Sci. U. S. A. 98, 3197–
320222 Nagai, T. et al. (2004) Expanded dynamic range of fluorescent
indicators for Ca2+ by circularly permuted yellow fluorescentproteins. Proc. Natl. Acad. Sci. U. S. A. 101, 10554–10559
23 Llopis, J. et al. (1998) Measurement of cytosolic, mitochondrial, andGolgi pH in single living cells with green fluorescent proteins. Proc.Natl. Acad. Sci. U. S. A. 95, 6803–6808
24 Miyawaki, A. and Tsien, R.Y. (2000) Monitoring proteinconformations and interactions by fluorescence resonance energytransfer between mutants of green fluorescent protein. MethodsEnzymol. 327, 472–500
25 Allen, M.D. et al. (2008) Dynamic visualization of signaling activitiesin living cells. Sci. Signal. 1, pt6
26 Rosenbaum, D.M. et al. (2009) The structure and function of G-protein-coupled receptors. Nature 459, 356–363
27 Moore, C.A. et al. (2007) Regulation of receptor trafficking by GRKsand arrestins. Annu. Rev. Physiol. 69, 451–482
28 Vilardaga, J.P. et al. (2003) Measurement of the millisecondactivation switch of G protein-coupled receptors in living cells. Nat.Biotechnol. 21, 807–812
29 Hoffmann, C. et al. (2005) A FlAsH-based FRET approach todetermine G protein-coupled receptor activation in living cells. Nat.Methods 2, 171–176
30 Zurn, A. et al. (2009) Fluorescence resonance energy transfer analysisof alpha 2a-adrenergic receptor activation reveals distinct agonist-specific conformational changes. Mol. Pharmacol. 75, 534–541
31 Lohse, M.J. et al. (2008) Optical techniques to analyze real-timeactivation and signaling of G-protein-coupled receptors. TrendsPharmacol. Sci. 29, 159–165
32 Bouvier, M. et al. (2007) BRET analysis of GPCR oligomerization:newer does not mean better. Nat. Methods 4, 3–4
33 Pfleger, K.D. and Eidne, K.A. (2006) Illuminating insights intoprotein-protein interactions using bioluminescence resonanceenergy transfer (BRET). Nat. Methods 3, 165–174
34 Gautier, I. et al. (2001) Homo-FRET microscopy in living cells tomeasure monomer-dimer transition of GFP-tagged proteins.Biophys. J. 80, 3000–3008
35 Gether, U. et al. (1997) Agonists induce conformational changes intransmembrane domains III and VI of the beta2 adrenoceptor.EMBOJ. 16, 6737–6747
36 Kobilka, B.K. and Gether, U. (2002) Use of fluorescence spectroscopyto study conformational changes in the beta 2-adrenoceptor. MethodsEnzymol. 343, 170–182
37 Gilman, A.G. (1987) G proteins:transducers of receptor-generatedsignals. Annu. Rev. Biochem. 56, 615–649
38 Oldham, W.M. and Hamm, H.E. (2008) Heterotrimeric G proteinactivation by G-protein-coupled receptors. Nat. Rev. Mol. Cell Biol.9, 60–71
39 Rebois, R.V. et al. (2002) Elucidating kinetic and thermodynamicconstants for interaction of G protein subunits and receptors bysurface plasmon resonance spectroscopy. Methods Enzymol. 344,15–42
40 Janetopoulos, C. et al. (2001) Receptor-mediated activation ofheterotrimeric G-proteins in living cells. Science 291, 2408–2411
41 Janetopoulos, C. and Devreotes, P. (2002) Monitoring receptor-mediated activation of heterotrimeric G-proteins by fluorescenceresonance energy transfer. Methods 27, 366–373
Review Trends in Cell Biology Vol.19 No.11
42 Bunemann, M. et al. (2003) Gi protein activation in intact cellsinvolves subunit rearrangement rather than dissociation. Proc.Natl. Acad. Sci. U. S. A. 100, 16077–16082
43 Jensen, J.B. et al. (2009) Fluorescence changes reveal kinetic steps ofmuscarinic receptor-mediated modulation of phosphoinositides andKv7.2/7.3 K+ channels. J. Gen. Physiol. 133, 347–359
44 Chiu, V.K. et al. (2002) Ras signalling on the endoplasmic reticulumand the Golgi. Nat. Cell. Biol. 4, 343–350
45 Bondeva, T. et al. (2002) Structural determinants of Ras-Rafinteraction analyzed in live cells. Mol. Biol. Cell. 13, 2323–2333
46 Bivona, T.G. et al. (2006) Analysis of Ras activation in living cells withGFP-RBD. Methods Enzymol. 407, 128–143
47 Mochizuki, N. et al. (2001) Spatio-temporal images of growth factor-induced activation of Ras and Rap1. Nature 411, 1065–1068
48 Kraynov, V.S. et al. (2000) Localized Rac activation dynamicsvisualized in living cells. Science 290, 333–337
49 Galperin, E. and Sorkin, A. (2003) Visualization of Rab5 activity inliving cells by FRET microscopy and influence of plasma-membrane-targeted Rab5 on clathrin-dependent endocytosis. J. Cell. Sci. 116,4799–4810
50 Kitano, M. et al. (2008) Imaging of Rab5 activity identifies essentialregulators for phagosome maturation. Nature 453, 241–245
51 Itoh, R.E. et al. (2002) Activation of rac and cdc42 video imaged byfluorescent resonance energy transfer-based single-molecule probesin the membrane of living cells. Mol. Cell. Biol. 22, 6582–6591
52 Yoshizaki, H. et al. (2003) Activity of Rho-family GTPases duringcell division as visualized with FRET-based probes. J. Cell Biol. 162,223–232
53 Pertz, O. and Hahn, K.M. (2004) Designing biosensors for Rho familyproteins–deciphering the dynamics of Rho family GTPase activationin living cells. J. Cell Sci. 117, 1313–1318
54 Nalbant, P. et al. (2004) Activation of endogenous Cdc42 visualized inliving cells. Science 305, 1615–1619
55 Pertz, O. et al. (2006) Spatiotemporal dynamics of RhoA activity inmigrating cells. Nature 440, 1069–1072
56 Tsien, R.Y. et al. (1982) Calcium homeostasis in intact lymphocytes:cytoplasmic free calcium monitored with a new, intracellularlytrapped fluorescent indicator. J. Cell Biol. 94, 325–334
57 Miyawaki, A. et al. (1997) Fluorescent indicators for Ca2+ based ongreen fluorescent proteins and calmodulin. Nature 388, 882–887
58 Hires, S.A. et al. (2008) Reporting neural activity with geneticallyencoded calcium indicators. Brain Cell. Biol. 36, 69–86
59 McCombs, J.E. and Palmer, A.E. (2008) Measuring calcium dynamicsin living cells with genetically encodable calcium indicators. Methods46, 152–159
60 Mank, M. et al. (2008) A genetically encoded calcium indicator forchronic in vivo two-photon imaging. Nat. Methods 5, 805–811
61 Wang, Q. et al. (2008) Structural basis for calcium sensing byGCaMP2. Structure 16, 1817–1827
62 Zou, J. et al. (2007) Developing sensors for real-time measurement ofhigh Ca2+ concentrations. Biochemistry 46, 12275–12288
63 Osibow, K. et al. (2006) A new type of non-Ca2+-buffering Apo(a)-basedfluorescent indicator for intraluminal Ca2+ in the endoplasmicreticulum. J. Biol. Chem. 281, 5017–5025
64 Adams, S.R. et al. (1991) Fluorescence ratio imaging of cyclic AMP insingle cells. Nature 349, 694–697
65 Zaccolo, M. et al. (2000) A genetically encoded, fluorescent indicatorfor cyclic AMP in living cells. Nat. Cell Biol. 2, 25–29
66 Nikolaev, V.O. et al. (2004) Novel single chain cAMP sensors forreceptor-induced signal propagation. J. Biol. Chem. 279, 37215–37218
67 Ponsioen, B. et al. (2004) Detecting cAMP-induced Epac activation byfluorescence resonance energy transfer: Epac as a novel cAMPindicator. EMBO Rep. 5, 1176–1180
68 DiPilato, L.M. et al. (2004) Fluorescent indicators of cAMP and Epacactivation reveal differential dynamics of cAMP signaling withindiscrete subcellular compartments. Proc. Natl. Acad. Sci. U. S. A.101, 16513–16518
69 van der Krogt, G.N. et al. (2008) A comparison of donor-acceptor pairsfor genetically encoded FRET sensors: application to the Epac cAMPsensor as an example. PLoS ONE 3, e1916
70 Dunn, T.A. et al. (2006) Imaging of cAMP levels and protein kinase Aactivity reveals that retinal waves drive oscillations in second-messenger cascades. J. Neurosci. 26, 12807–12815
71 Honda, A. et al. (2001) Spatiotemporal dynamics of guanosine 30,50-cyclic monophosphate revealed by a genetically encoded, fluorescentindicator. Proc. Natl. Acad. Sci. U. S. A. 98, 2437–2442
72 Nikolaev, V.O. et al. (2006) Fluorescent sensors for rapid monitoringof intracellular cGMP. Nat. Methods 3, 23–25
73 Furuichi, T. et al. (1989) Primary structure and functional expressionof the inositol 1,4,5-trisphosphate-binding protein P400. Nature 342,32–38
74 Yoshikawa, F. et al. (1996) Mutational analysis of the ligand bindingsite of the inositol 1,4,5-trisphosphate receptor. J. Biol. Chem. 271,18277–18284
75 Bosanac, I. et al. (2002) Structure of the inositol 1,4,5-trishphosphatereceptor binding core in complex with its ligand.Nature 420, 696–700
76 Tanimura, A. et al. (2004) Fluorescent biosensor for quantitative real-time measurements of inositol 1,4,5-trisphosphate in single livingcells. J. Biol. Chem. 279, 38095–38098
77 Remus, T.P. et al. (2006) Biosensors to measure inositol 1,4,5-trisphosphate concentration in living cells with spatiotemporalresolution. J. Biol. Chem. 281, 608–616
78 Matsu-ura, T. et al. (2006) Cytosolic inositol 1,4,5-trisphosphatedynamics during intracellular calcium oscillations in living cells. J.Cell Biol. 173, 755–765
79 van Zeijl, L. et al. (2007) Regulation of connexin43 gap junctionalcommunication by phosphatidylinositol 4,5-bisphosphate. J. Cell Biol.177, 881–891
80 Hirose, K. et al. (1999) Spatiotemporal dynamics of inositol 1,4,5-trisphosphate that underlies complex Ca2+ mobilization patterns.Science 284, 1527–1530
81 Varnai, P. and Balla, T. (2006) Live cell imaging of phosphoinositidedynamics with fluorescent protein domains. Biochim. Biophys. Acta1761, 957–967
82 Ni, Q. et al. (2006) Analyzing protein kinase dynamics in living cellswith FRET reporters. Methods 40, 279–286
83 Zhang, J. et al. (2001) Genetically encoded reporters of protein kinaseA activity reveal impact of substrate tethering. Proc. Natl. Acad. Sci.U. S. A. 98, 14997–15002
84 Zhang, J. et al. (2005) Insulin disrupts beta-adrenergic signalling toprotein kinase A in adipocytes. Nature 437, 569–573
85 Violin, J.D. et al. (2003) A genetically encoded fluorescent reporterreveals oscillatory phosphorylation by protein kinase C. J. Cell. Biol.161, 899–909
86 Gallegos, L.L. et al. (2006) Targeting protein kinase C activity reporterto discrete intracellular regions reveals spatiotemporal differences inagonist-dependent signaling. J. Biol. Chem. 281, 30947–30956
87 Sasaki, K. et al. (2003) Fluorescent indicators for Akt/protein kinase Band dynamics of Akt activity visualized in living cells. J. Biol. Chem.278, 30945–30951
88 Kunkel, M.T. et al. (2005) Spatio-temporal dynamics of protein kinaseB/Akt signaling revealed by a genetically encoded fluorescentreporter. J. Biol. Chem. 280, 5581–5587
89 Kunkel, M.T. et al. (2007) Calcium-dependent regulation of proteinkinase D revealed by a genetically encoded kinase activity reporter. J.Biol. Chem. 282, 6733–6742
90 Zhang, L. et al. (2007) Molecular imaging of Akt kinase activity. Nat.Med. 13, 1114–1119
91 Gao, X. and Zhang, J. (2008) Spatiotemporal analysis of differentialAkt regulation in plasmamembranemicrodomains.Mol. Biol. Cell 19,4366–4373
92 Ting, A.Y. et al. (2001) Genetically encoded fluorescent reporters ofprotein tyrosine kinase activities in living cells. Proc. Natl. Acad. Sci.U. S. A. 98, 15003–15008
93 Wang, Y. et al. (2005) Visualizing the mechanical activation of Src.Nature 434, 1040–1045
94 Seong, J. et al. (2009) Visualization of Src activity at differentcompartments of the plasma membrane by FRET imaging. Chem.Biol. 16, 48–57
95 Newman, R.H. and Zhang, J. (2008) Visualization of phosphataseactivity in living cells with a FRET-based calcineurin activity sensor.Mol. Biosyst. 4, 496–501
96 Di Paolo, G. and De Camilli, P. (2006) Phosphoinositides in cellregulation and membrane dynamics. Nature 443, 651–657
97 Newton, A.C. (2009) Lipid activation of protein kinases. J. Lipid. Res.50, S266–271
585
Review Trends in Cell Biology Vol.19 No.11
98 Oancea, E. et al. (1998) Green fluorescent protein (GFP)-taggedcysteine-rich domains from protein kinase C as a fluorescentindicators for diacylglycerol signaling in living cells. J. Cell Biol.140, 485–498
99 Meyer, T. and Oancea, E. (1998) Protein kinase C as a molecularmachine for decoding calcium and diacylglycerol signals. Cell 95,307–318
100 Dries, D.R. et al. (2007) A single residue in the C1 domain sensitizesnovel protein kinase C isoforms to cellular diacylglycerol production.J. Biol. Chem. 282, 826–830
101 Sato, M. et al. (2006) Imaging diacylglycerol dynamics at organellemembranes. Nat. Methods 3, 797–799
102 Wang, X. et al. (2006) Signaling functions of phosphatidic acid. Prog.Lipid Res. 45, 250–278
103 Karathanassis, D. et al. (2002) Binding of the PX domain of p47phox tophosphatidylinositol 3,4-bisphosphate and phosphatidic acid ismasked by an intramolecular interaction. EMBO J. 21, 5057–5068
104 Rizzo, M.A. et al. (2000) The recruitment of Raf-1 to membranes ismediated by direct interaction with phosphatidic acid and isindependent of association with Ras. J. Biol. Chem. 275, 23911–23918
105 Jones, J.A. et al. (2005) Identification of a novel phosphatidic acidbinding domain in protein phosphatase-1. Biochemistry 44, 13235–
13245106 Zeniou-Meyer, M. et al. (2007) Phospholipase D1 production of
phosphatidic acid at the plasma membrane promotes exocytosis oflarge dense-core granules at a late stage. J. Biol. Chem. 282, 21746–
21757107 Cohen, G.B. et al. (1995) Modular binding domains in signal
transduction proteins. Cell 80, 237–248108 Kutateladze, T.G. et al. (1999) Phosphatidylinositol 3-Phosphate
recognition by the FYVE domain. Mol. Cell 3, 805–811109 Kanai, F. et al. (2001) The PX domains of p47phox and p40phox bind
to lipid products of PI(3)K. Nat. Cell Biol. 3, 675–678110 van Der Wal, J. et al. (2001) Monitoring Phospholipase C activation
kinetics in live cells by FRET. J. Biol. Chem. 276, 15337–15344111 Ananthanarayanan, B. et al. (2005) Signal propagation from
membrane messengers to nuclear effectors revealed by reporters ofphosphoinositide dynamics and Akt activity. Proc. Natl. Acad. Sci. U.S. A. 102, 15081–15086
586
112 Komander, D. et al. (2004) Structural insights into the regulation ofPDK1 by phosphoinositides and inositol phosphates. EMBO J. 23,3918–3928
113 Varnai, P. and Balla, T. (2008) Live cell imaging of phosphoinositideswith expressed inositide binding protein domains. Methods 46,167–176
114 Beene, D.L. and Scott, J.D. (2007) A-kinase anchoring proteins takeshape. Curr. Opin. Cell Biol. 19, 192–198
115 Kolch, W. (2005) Coordinating ERK/MAPK signalling throughscaffolds and inhibitors. Nat. Rev. Mol. Cell Biol. 6, 827–837
116 Hynes, T.R. et al. (2004) Cellular localization of GFP-tagged alphasubunits. Methods Mol. Biol. 237, 233–246
117 Lippincott-Schwartz, J. and Manley, S. (2009) Putting super-resolution fluorescence microscopy to work. Nat. Methods 6, 21–23
118 Chi, K.R. (2009) Super-resolution microscopy: breaking the limits.Nat. Methods 6, 15–18
119 Betzig, E. et al. (2006) Imaging intracellular fluorescent proteins atnanometer resolution. Science 313, 1642–1645
120 Hess, S.T. et al. (2006) Ultra-high resolution imaging by fluorescencephotoactivation localization microscopy. Biophys. J. 91, 4258–4272
121 Bates, M. et al. (2007) Multicolor super-resolution imaging withphoto-switchable fluorescent probes. Science 317, 1749–1753
122 Klar, T.A. et al. (2000) Fluorescence microscopy with diffractionresolution barrier broken by stimulated emission. Proc. Natl. Acad.Sci. U. S. A. 97, 8206–8210
123 Kner, P. et al. (2009) Super-resolution video microscopy of live cells bystructured illumination. Nat. Methods 6, 339–342
124 Forster, T. (1948) Zwushenmolekulare Energiewanderung undFluoreszenz. Ann. Physik. 2, 55–75
125 Edidin, M. (2003) Fluorescence resonance energy transfer: techniquesfor measuring molecular conformation and molecular proximity.Curr. Protoc. Immunol. Chapter 18, Unit 18.10
126 van Munster, E.B. and Gadella, T.W. (2005) Fluorescence lifetimeimaging microscopy (FLIM). Adv. Biochem. Eng. Biotechnol. 95,143–175
127 Wallrabe, H. and Periasamy, A. (2005) Imaging protein moleculesusing FRET and FLIM microscopy. Curr. Opin. Biotechnol. 16, 19–27
128 Hastings, J.W. (1996) Chemistries and colors of bioluminescentreactions: a review. Gene 173, 5–11