greek fixed income monitor
TRANSCRIPT
Ilias Lekkos [email protected] Veni Arakelian [email protected] Rotsika [email protected] Giannakidis [email protected]
Piraeus BankAmerikis 4, 105 64, AthensTel: 210 328 8187, Fax: 210 328 8605
[email protected] Page: <PBGR>
Piraeus Bank Government Bond Index: {PBGGGSBI Index<GO>}
Weighted Average Yield: {PBGGGWAY Index<GO>}
Piraeus Bank Government Bond Index : {PBGGGCBI Index<GO>}
Weighted Average Yield : {PBGGIWAY Index<GO>}
} Latest Developments in Greek Bond Market
} Greek Government Bonds Yield Curve Evolution
} Greek Government Bonds Interest Rate Curve Estimation
} Piraeus Bank Greek Government Bond Index
} Piraeus Bank Greek Corporate Bond Index
2March 2015
3
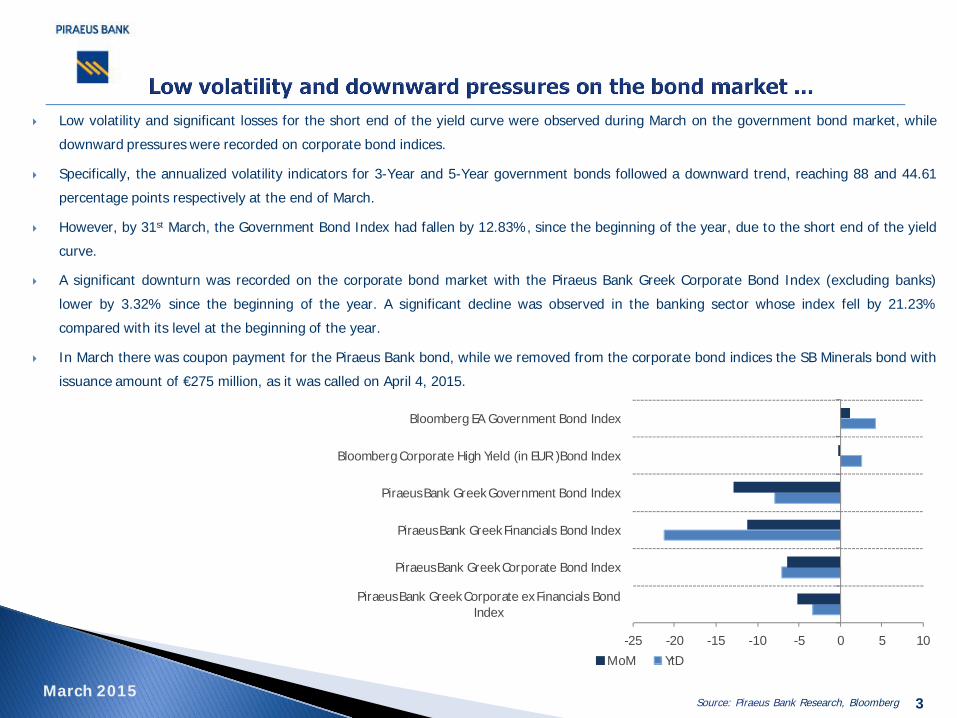
} Low volatility and significant losses for the short end of the yield curve were observed during March on the government bond market, while
downward pressures were recorded on corporate bond indices.
} Specifically, the annualized volatility indicators for 3-Year and 5-Year government bonds followed a downward trend, reaching 88 and 44.61
percentage points respectively at the end of March.
} However, by 31st March, the Government Bond Index had fallen by 12.83%, since the beginning of the year, due to the short end of the yield
curve.
} A significant downturn was recorded on the corporate bond market with the Piraeus Bank Greek Corporate Bond Index (excluding banks)
lower by 3.32% since the beginning of the year. A significant decline was observed in the banking sector whose index fell by 21.23%
compared with its level at the beginning of the year.
} In March there was coupon payment for the Piraeus Bank bond, while we removed from the corporate bond indices the SB Minerals bond with
issuance amount of €275 million, as it was called on April 4, 2015.
Source: Piraeus Bank Research, Bloomberg
-25 -20 -15 -10 -5 0 5 10
Piraeus Bank Greek Corporate ex Financials Bond Index
Piraeus Bank Greek Corporate Bond Index
Piraeus Bank Greek Financials Bond Index
Piraeus Bank Greek Government Bond Index
Bloomberg Corporate High Yield (in EUR )Bond Index
Bloomberg EA Government Bond Index
MoM YtD
March 2015
4
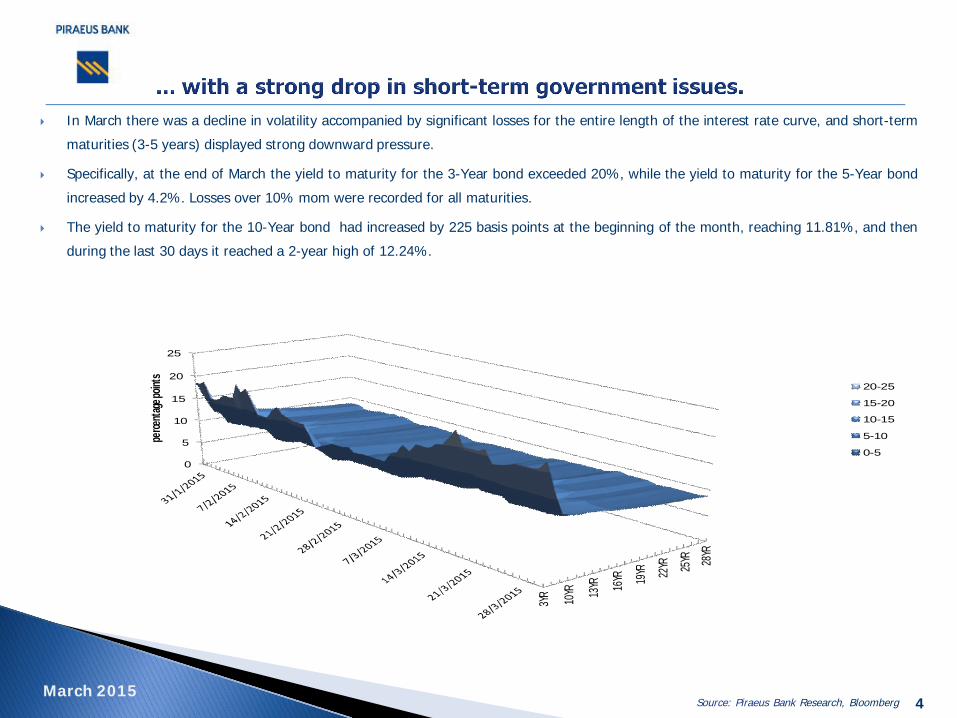
} In March there was a decline in volatility accompanied by significant losses for the entire length of the interest rate curve, and short-term
maturities (3-5 years) displayed strong downward pressure.
} Specifically, at the end of March the yield to maturity for the 3-Year bond exceeded 20%, while the yield to maturity for the 5-Year bond
increased by 4.2%. Losses over 10% mom were recorded for all maturities.
} The yield to maturity for the 10-Year bond had increased by 225 basis points at the beginning of the month, reaching 11.81%, and then
during the last 30 days it reached a 2-year high of 12.24%.
3YR 10YR 13
YR 16YR 19
YR 22YR 25
YR 28YR
0
5
10
15
20
25
perce
ntag
e poin
ts
20-25
15-20
10-15
5-10
0-5
March 2015Source: Piraeus Bank Research, Bloomberg
5
Estimated Interest Rate Curve Estimated Forward Rate Curve
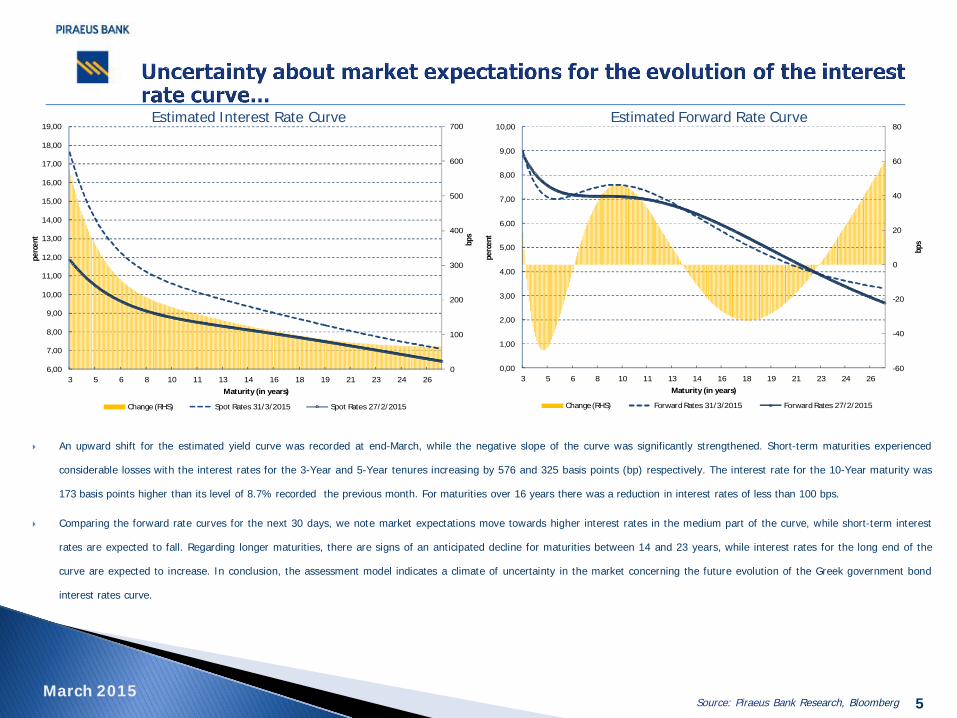
} An upward shift for the estimated yield curve was recorded at end-March, while the negative slope of the curve was significantly strengthened. Short-term maturities experienced
considerable losses with the interest rates for the 3-Year and 5-Year tenures increasing by 576 and 325 basis points (bp) respectively. The interest rate for the 10-Year maturity was
173 basis points higher than its level of 8.7% recorded the previous month. For maturities over 16 years there was a reduction in interest rates of less than 100 bps.
} Comparing the forward rate curves for the next 30 days, we note market expectations move towards higher interest rates in the medium part of the curve, while short-term interest
rates are expected to fall. Regarding longer maturities, there are signs of an anticipated decline for maturities between 14 and 23 years, while interest rates for the long end of the
curve are expected to increase. In conclusion, the assessment model indicates a climate of uncertainty in the market concerning the future evolution of the Greek government bond
interest rates curve.
-60
-40
-20
0
20
40
60
80
0,00
1,00
2,00
3,00
4,00
5,00
6,00
7,00
8,00
9,00
10,00
3 5 6 8 10 11 13 14 16 18 19 21 23 24 26
bps
perc
ent
Maturity (in years)
Change (RHS) Forward Rates 31/3/2015 Forward Rates 27/2/2015
0
100
200
300
400
500
600
700
6,00
7,00
8,00
9,00
10,00
11,00
12,00
13,00
14,00
15,00
16,00
17,00
18,00
19,00
3 5 6 8 10 11 13 14 16 18 19 21 23 24 26
bps
perc
ent
Maturity (in years)
Change (RHS) Spot Rates 31/3/2015 Spot Rates 27/2/2015
March 2015Source: Piraeus Bank Research, Bloomberg
6
10year-3year spread Annualized Monthly Volatility Indices
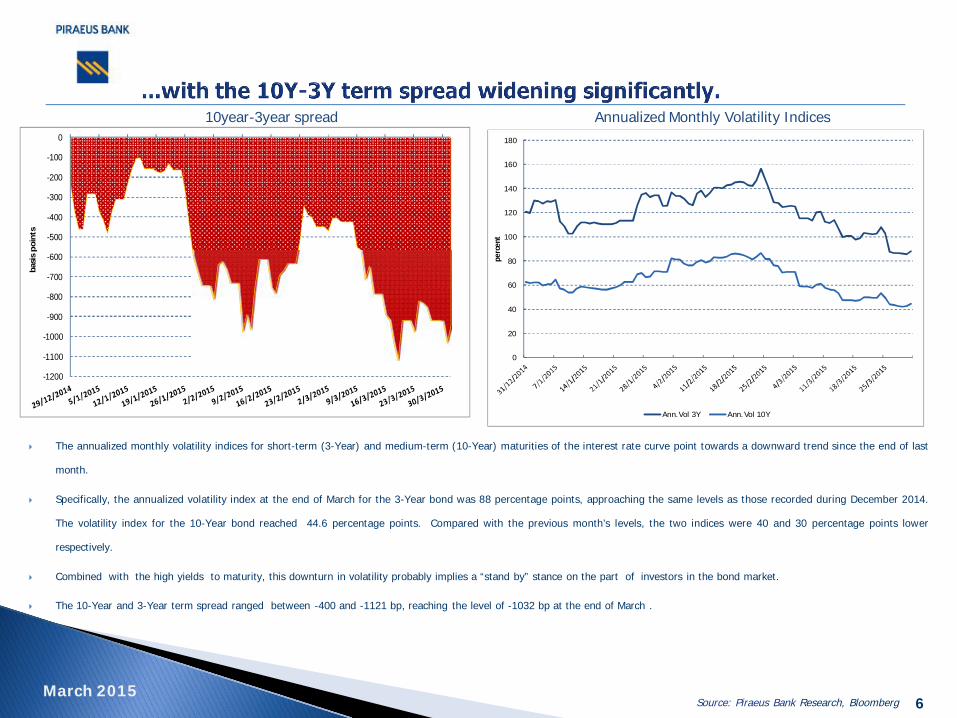
} The annualized monthly volatility indices for short-term (3-Year) and medium-term (10-Year) maturities of the interest rate curve point towards a downward trend since the end of last
month.
} Specifically, the annualized volatility index at the end of March for the 3-Year bond was 88 percentage points, approaching the same levels as those recorded during December 2014.
The volatility index for the 10-Year bond reached 44.6 percentage points. Compared with the previous month’s levels, the two indices were 40 and 30 percentage points lower
respectively.
} Combined with the high yields to maturity, this downturn in volatility probably implies a “stand by” stance on the part of investors in the bond market.
} The 10-Year and 3-Year term spread ranged between -400 and -1121 bp, reaching the level of -1032 bp at the end of March .
0
20
40
60
80
100
120
140
160
180
perc
ent
Ann. Vol 3Y Ann. Vol 10Y
-1200
-1100
-1000
-900
-800
-700
-600
-500
-400
-300
-200
-100
0
bas
is p
oin
ts
March 2015Source: Piraeus Bank Research, Bloomberg
7
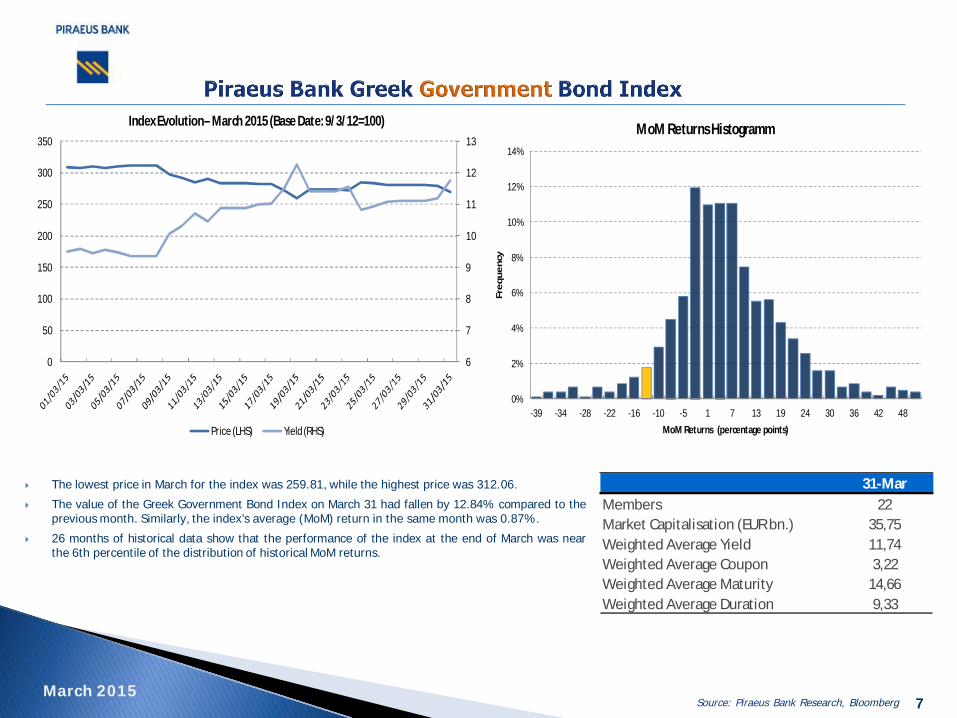
} The lowest price in March for the index was 259.81, while the highest price was 312.06.
} The value of the Greek Government Bond Index on March 31 had fallen by 12.84% compared to theprevious month. Similarly, the index’s average (MoM) return in the same month was 0.87%.
} 26 months of historical data show that the performance of the index at the end of March was nearthe 6th percentile of the distribution of historical MoM returns.
6
7
8
9
10
11
12
13
0
50
100
150
200
250
300
350
Index Evolution– March 2015 (Base Date: 9/3/12=100)
Price (LHS) Yield (RHS)
0%
2%
4%
6%
8%
10%
12%
14%
-39 -34 -28 -22 -16 -10 -5 1 7 13 19 24 30 36 42 48
Fre
qu
en
cy
MoM Returns (percentage points)
MoM Returns Histogramm
31-MarMembers 22Market Capitalisation (EUR bn.) 35,75Weighted Average Yield 11,74Weighted Average Coupon 3,22Weighted Average Maturity 14,66Weighted Average Duration 9,33
March 2015Source: Piraeus Bank Research, Bloomberg
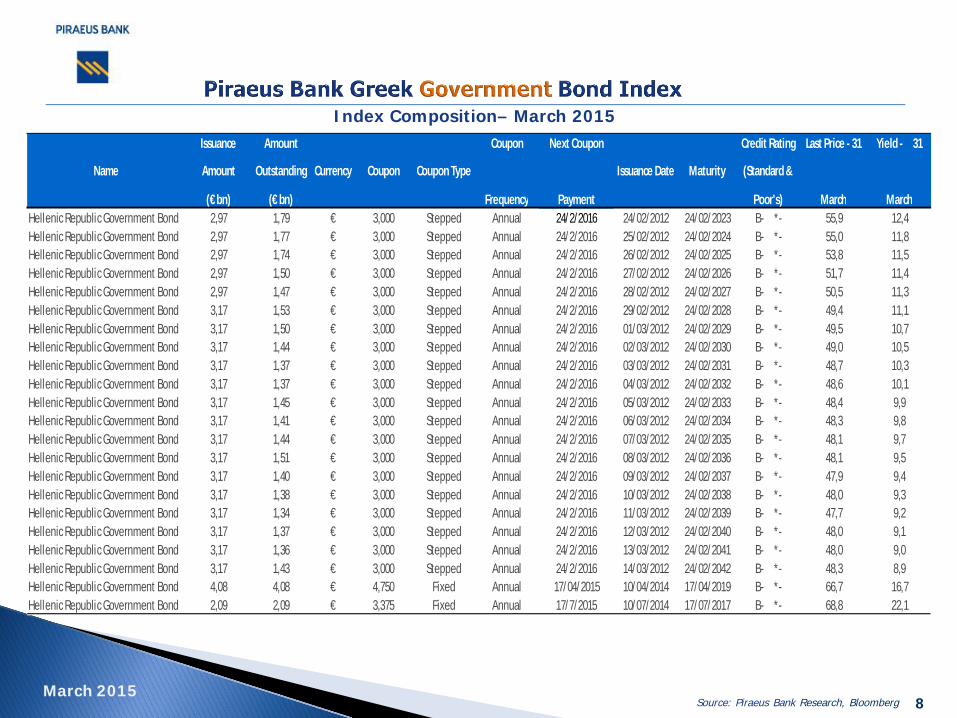
Index Composition– March 2015
8
Name
Issuance
Amount
(€ bn)
Amount
Outstanding
(€ bn)
Currency Coupon Coupon Type
Coupon
Frequency
Next Coupon
Payment
Issuance Date Maturity
Credit Rating
(Standard &
Poor's)
Last Price - 31
March
Yield - 31
MarchHellenic Republic Government Bond 2,97 1,79 € 3,000 Stepped Annual 24/2/2016 24/02/2012 24/02/2023 B- *- 55,9 12,4Hellenic Republic Government Bond 2,97 1,77 € 3,000 Stepped Annual 24/2/2016 25/02/2012 24/02/2024 B- *- 55,0 11,8Hellenic Republic Government Bond 2,97 1,74 € 3,000 Stepped Annual 24/2/2016 26/02/2012 24/02/2025 B- *- 53,8 11,5Hellenic Republic Government Bond 2,97 1,50 € 3,000 Stepped Annual 24/2/2016 27/02/2012 24/02/2026 B- *- 51,7 11,4Hellenic Republic Government Bond 2,97 1,47 € 3,000 Stepped Annual 24/2/2016 28/02/2012 24/02/2027 B- *- 50,5 11,3Hellenic Republic Government Bond 3,17 1,53 € 3,000 Stepped Annual 24/2/2016 29/02/2012 24/02/2028 B- *- 49,4 11,1Hellenic Republic Government Bond 3,17 1,50 € 3,000 Stepped Annual 24/2/2016 01/03/2012 24/02/2029 B- *- 49,5 10,7Hellenic Republic Government Bond 3,17 1,44 € 3,000 Stepped Annual 24/2/2016 02/03/2012 24/02/2030 B- *- 49,0 10,5Hellenic Republic Government Bond 3,17 1,37 € 3,000 Stepped Annual 24/2/2016 03/03/2012 24/02/2031 B- *- 48,7 10,3Hellenic Republic Government Bond 3,17 1,37 € 3,000 Stepped Annual 24/2/2016 04/03/2012 24/02/2032 B- *- 48,6 10,1Hellenic Republic Government Bond 3,17 1,45 € 3,000 Stepped Annual 24/2/2016 05/03/2012 24/02/2033 B- *- 48,4 9,9Hellenic Republic Government Bond 3,17 1,41 € 3,000 Stepped Annual 24/2/2016 06/03/2012 24/02/2034 B- *- 48,3 9,8Hellenic Republic Government Bond 3,17 1,44 € 3,000 Stepped Annual 24/2/2016 07/03/2012 24/02/2035 B- *- 48,1 9,7Hellenic Republic Government Bond 3,17 1,51 € 3,000 Stepped Annual 24/2/2016 08/03/2012 24/02/2036 B- *- 48,1 9,5Hellenic Republic Government Bond 3,17 1,40 € 3,000 Stepped Annual 24/2/2016 09/03/2012 24/02/2037 B- *- 47,9 9,4Hellenic Republic Government Bond 3,17 1,38 € 3,000 Stepped Annual 24/2/2016 10/03/2012 24/02/2038 B- *- 48,0 9,3Hellenic Republic Government Bond 3,17 1,34 € 3,000 Stepped Annual 24/2/2016 11/03/2012 24/02/2039 B- *- 47,7 9,2Hellenic Republic Government Bond 3,17 1,37 € 3,000 Stepped Annual 24/2/2016 12/03/2012 24/02/2040 B- *- 48,0 9,1Hellenic Republic Government Bond 3,17 1,36 € 3,000 Stepped Annual 24/2/2016 13/03/2012 24/02/2041 B- *- 48,0 9,0Hellenic Republic Government Bond 3,17 1,43 € 3,000 Stepped Annual 24/2/2016 14/03/2012 24/02/2042 B- *- 48,3 8,9Hellenic Republic Government Bond 4,08 4,08 € 4,750 Fixed Annual 17/04/2015 10/04/2014 17/04/2019 B- *- 66,7 16,7Hellenic Republic Government Bond 2,09 2,09 € 3,375 Fixed Annual 17/7/2015 10/07/2014 17/07/2017 B- *- 68,8 22,1
March 2015Source: Piraeus Bank Research, Bloomberg
9
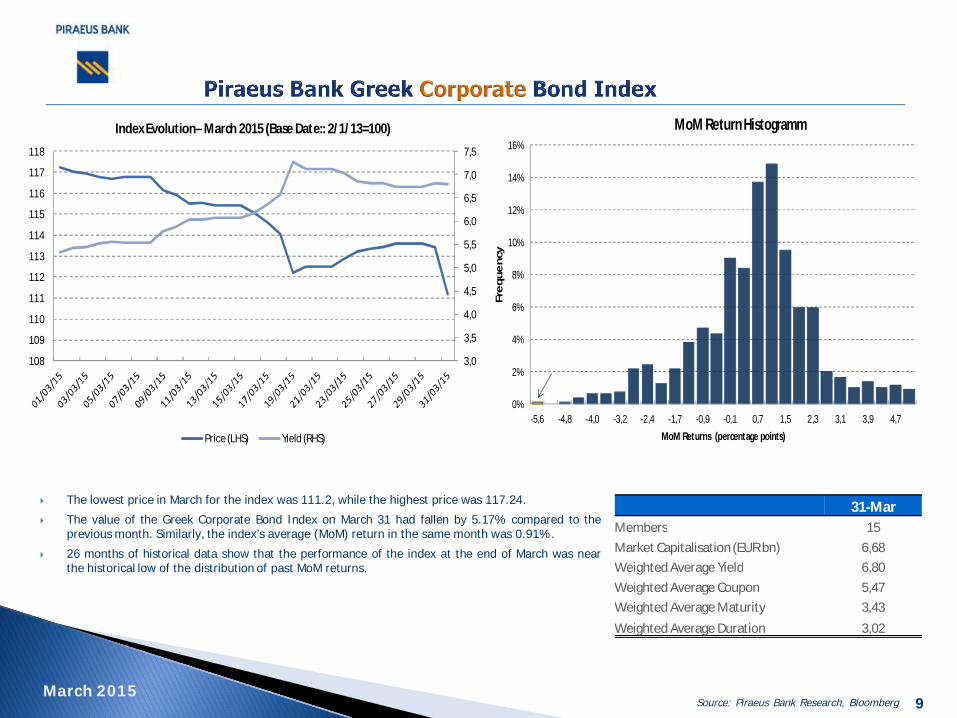
} The lowest price in March for the index was 111.2, while the highest price was 117.24.
} The value of the Greek Corporate Bond Index on March 31 had fallen by 5.17% compared to theprevious month. Similarly, the index’s average (MoM) return in the same month was 0.91%.
} 26 months of historical data show that the performance of the index at the end of March was nearthe historical low of the distribution of past MoM returns.
3,0
3,5
4,0
4,5
5,0
5,5
6,0
6,5
7,0
7,5
108
109
110
111
112
113
114
115
116
117
118
Index Evolution– March 2015 (Base Date:: 2/1/13=100)
Price (LHS) Yield (RHS)
0%
2%
4%
6%
8%
10%
12%
14%
16%
-5,6 -4,8 -4,0 -3,2 -2,4 -1,7 -0,9 -0,1 0,7 1,5 2,3 3,1 3,9 4,7
Fre
qu
en
cy
MoM Returns (percentage points)
MoM Return Histogramm
31-MarMembers 15
Market Capitalisation (EUR bn) 6,68
Weighted Average Yield 6,80
Weighted Average Coupon 5,47
Weighted Average Maturity 3,43
Weighted Average Duration 3,02
March 2015Source: Piraeus Bank Research, Bloomberg
Index Composition– March 2015
10
Name
Issuance
Amount
(€ mn)
Amount
Outstanding
(€ mn)
Currency Coupon Coupon Type
Coupon
Frequency
Next Coupon
Payment
Issuance Date Maturity
Credit Rating
(Standard &
Poor's)
Last Price - 31
March
Yield - 31
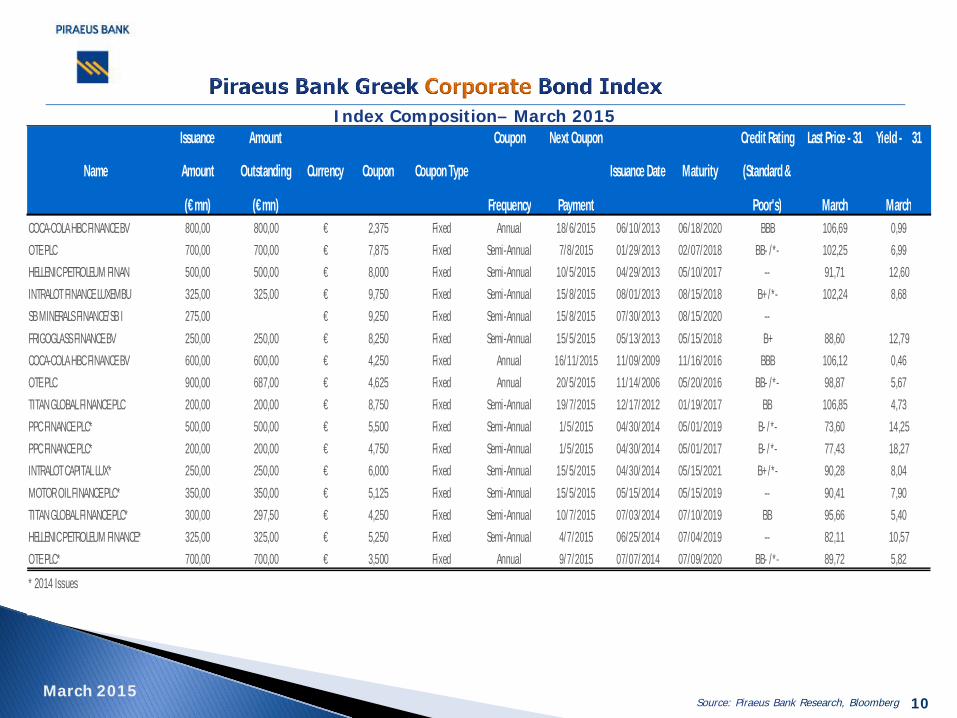
MarchCOCA-COLA HBC FINANCE BV 800,00 800,00 € 2,375 Fixed Annual 18/6/2015 06/10/2013 06/18/2020 BBB 106,69 0,99
OTE PLC 700,00 700,00 € 7,875 Fixed Semi-Annual 7/8/2015 01/29/2013 02/07/2018 BB- /*- 102,25 6,99
HELLENIC PETROLEUM FINAN 500,00 500,00 € 8,000 Fixed Semi-Annual 10/5/2015 04/29/2013 05/10/2017 -- 91,71 12,60
INTRALOT FINANCE LUXEMBU 325,00 325,00 € 9,750 Fixed Semi-Annual 15/8/2015 08/01/2013 08/15/2018 B+ /*- 102,24 8,68
SB MINERALS FINANCE/SB I 275,00 € 9,250 Fixed Semi-Annual 15/8/2015 07/30/2013 08/15/2020 --
FRIGOGLASS FINANCE BV 250,00 250,00 € 8,250 Fixed Semi-Annual 15/5/2015 05/13/2013 05/15/2018 B+ 88,60 12,79
COCA-COLA HBC FINANCE BV 600,00 600,00 € 4,250 Fixed Annual 16/11/2015 11/09/2009 11/16/2016 BBB 106,12 0,46
OTE PLC 900,00 687,00 € 4,625 Fixed Annual 20/5/2015 11/14/2006 05/20/2016 BB- /*- 98,87 5,67
TITAN GLOBAL FINANCE PLC 200,00 200,00 € 8,750 Fixed Semi-Annual 19/7/2015 12/17/2012 01/19/2017 BB 106,85 4,73
PPC FINANCE PLC* 500,00 500,00 € 5,500 Fixed Semi-Annual 1/5/2015 04/30/2014 05/01/2019 B- /*- 73,60 14,25
PPC FINANCE PLC* 200,00 200,00 € 4,750 Fixed Semi-Annual 1/5/2015 04/30/2014 05/01/2017 B- /*- 77,43 18,27
INTRALOT CAPITAL LUX* 250,00 250,00 € 6,000 Fixed Semi-Annual 15/5/2015 04/30/2014 05/15/2021 B+ /*- 90,28 8,04
MOTOR OIL FINANCE PLC* 350,00 350,00 € 5,125 Fixed Semi-Annual 15/5/2015 05/15/2014 05/15/2019 -- 90,41 7,90
TITAN GLOBAL FINANCE PLC* 300,00 297,50 € 4,250 Fixed Semi-Annual 10/7/2015 07/03/2014 07/10/2019 BB 95,66 5,40
HELLENIC PETROLEUM FINANCE* 325,00 325,00 € 5,250 Fixed Semi-Annual 4/7/2015 06/25/2014 07/04/2019 -- 82,11 10,57
OTE PLC* 700,00 700,00 € 3,500 Fixed Annual 9/7/2015 07/07/2014 07/09/2020 BB- /*- 89,72 5,82
* 2014 Issues
March 2015Source: Piraeus Bank Research, Bloomberg
11
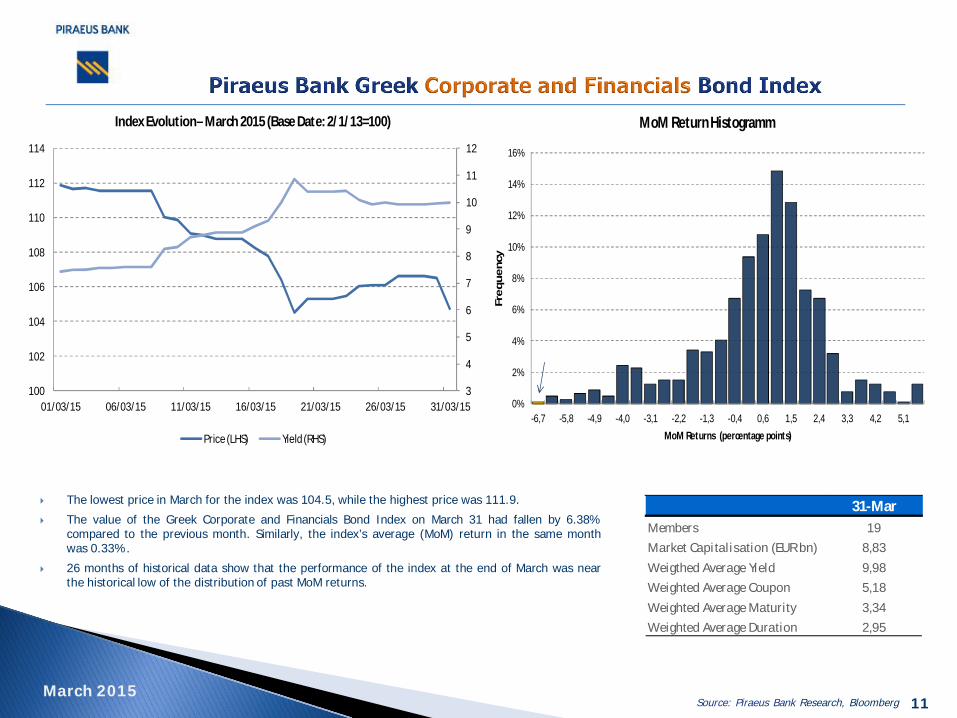
} The lowest price in March for the index was 104.5, while the highest price was 111.9.
} The value of the Greek Corporate and Financials Bond Index on March 31 had fallen by 6.38%compared to the previous month. Similarly, the index’s average (MoM) return in the same monthwas 0.33%.
} 26 months of historical data show that the performance of the index at the end of March was nearthe historical low of the distribution of past MoM returns.
3
4
5
6
7
8
9
10
11
12
100
102
104
106
108
110
112
114
01/03/15 06/03/15 11/03/15 16/03/15 21/03/15 26/03/15 31/03/15
Index Evolution– March 2015 (Base Date: 2/1/13=100)
Price (LHS) Yield (RHS)
0%
2%
4%
6%
8%
10%
12%
14%
16%
-6,7 -5,8 -4,9 -4,0 -3,1 -2,2 -1,3 -0,4 0,6 1,5 2,4 3,3 4,2 5,1
Fre
qu
en
cy
MoM Returns (percentage points)
MoM Return Histogramm
31-MarMembers 19
Market Capitalisation (EUR bn) 8,83
Weigthed Average Yield 9,98
Weighted Average Coupon 5,18
Weighted Average Maturity 3,34
Weighted Average Duration 2,95
March 2015Source: Piraeus Bank Research, Bloomberg
Index Composition– March 2015
12
Name
Issuance
Amount
(€ mn)
Amount
Outstanding
(€ mn)
Currency Coupon Coupon Type
Coupon
Frequency
Next Coupon
Payment
Issuance Date Maturity
Credit Rating
(Standard &
Poor's)
Last Price - 31
March
Yield - 31
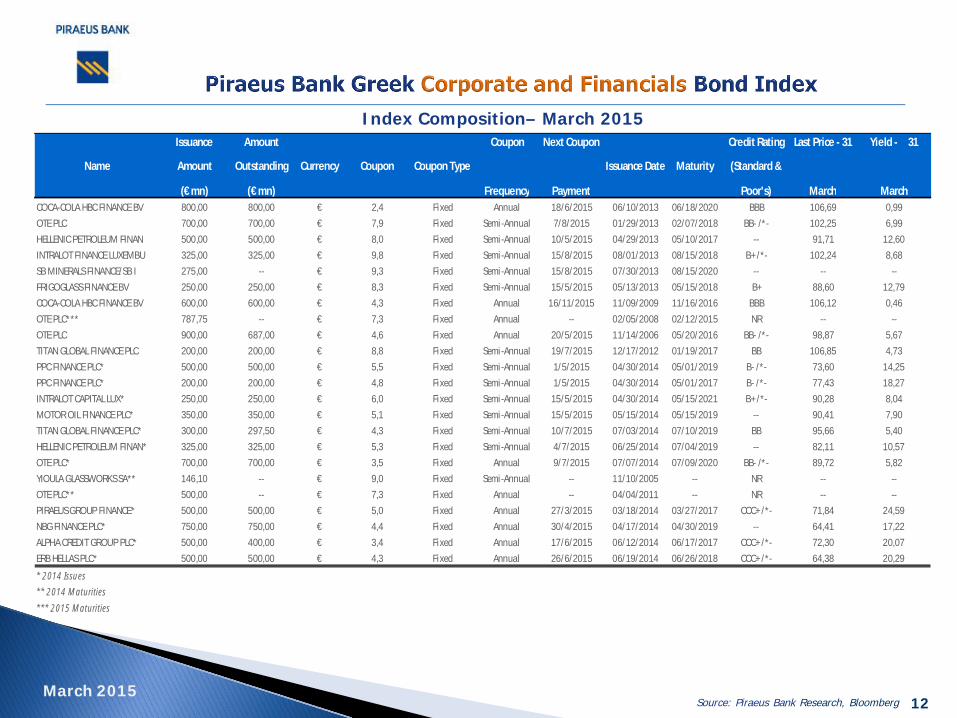
MarchCOCA-COLA HBC FINANCE BV 800,00 800,00 € 2,4 Fixed Annual 18/6/2015 06/10/2013 06/18/2020 BBB 106,69 0,99
OTE PLC 700,00 700,00 € 7,9 Fixed Semi-Annual 7/8/2015 01/29/2013 02/07/2018 BB- /*- 102,25 6,99
HELLENIC PETROLEUM FINAN 500,00 500,00 € 8,0 Fixed Semi-Annual 10/5/2015 04/29/2013 05/10/2017 -- 91,71 12,60
INTRALOT FINANCE LUXEMBU 325,00 325,00 € 9,8 Fixed Semi-Annual 15/8/2015 08/01/2013 08/15/2018 B+ /*- 102,24 8,68
SB MINERALS FINANCE/SB I 275,00 -- € 9,3 Fixed Semi-Annual 15/8/2015 07/30/2013 08/15/2020 -- -- --
FRIGOGLASS FINANCE BV 250,00 250,00 € 8,3 Fixed Semi-Annual 15/5/2015 05/13/2013 05/15/2018 B+ 88,60 12,79
COCA-COLA HBC FINANCE BV 600,00 600,00 € 4,3 Fixed Annual 16/11/2015 11/09/2009 11/16/2016 BBB 106,12 0,46
OTE PLC*** 787,75 -- € 7,3 Fixed Annual -- 02/05/2008 02/12/2015 NR -- --
OTE PLC 900,00 687,00 € 4,6 Fixed Annual 20/5/2015 11/14/2006 05/20/2016 BB- /*- 98,87 5,67
TITAN GLOBAL FINANCE PLC 200,00 200,00 € 8,8 Fixed Semi-Annual 19/7/2015 12/17/2012 01/19/2017 BB 106,85 4,73
PPC FINANCE PLC* 500,00 500,00 € 5,5 Fixed Semi-Annual 1/5/2015 04/30/2014 05/01/2019 B- /*- 73,60 14,25
PPC FINANCE PLC* 200,00 200,00 € 4,8 Fixed Semi-Annual 1/5/2015 04/30/2014 05/01/2017 B- /*- 77,43 18,27
INTRALOT CAPITAL LUX* 250,00 250,00 € 6,0 Fixed Semi-Annual 15/5/2015 04/30/2014 05/15/2021 B+ /*- 90,28 8,04
MOTOR OIL FINANCE PLC* 350,00 350,00 € 5,1 Fixed Semi-Annual 15/5/2015 05/15/2014 05/15/2019 -- 90,41 7,90
TITAN GLOBAL FINANCE PLC* 300,00 297,50 € 4,3 Fixed Semi-Annual 10/7/2015 07/03/2014 07/10/2019 BB 95,66 5,40
HELLENIC PETROLEUM FINAN* 325,00 325,00 € 5,3 Fixed Semi-Annual 4/7/2015 06/25/2014 07/04/2019 -- 82,11 10,57
OTE PLC* 700,00 700,00 € 3,5 Fixed Annual 9/7/2015 07/07/2014 07/09/2020 BB- /*- 89,72 5,82
YIOULA GLASSWORKS SA** 146,10 -- € 9,0 Fixed Semi-Annual -- 11/10/2005 -- NR -- --
OTE PLC** 500,00 -- € 7,3 Fixed Annual -- 04/04/2011 -- NR -- --
PIRAEUS GROUP FINANCE* 500,00 500,00 € 5,0 Fixed Annual 27/3/2015 03/18/2014 03/27/2017 CCC+ /*- 71,84 24,59
NBG FINANCE PLC* 750,00 750,00 € 4,4 Fixed Annual 30/4/2015 04/17/2014 04/30/2019 -- 64,41 17,22
ALPHA CREDIT GROUP PLC* 500,00 400,00 € 3,4 Fixed Annual 17/6/2015 06/12/2014 06/17/2017 CCC+ /*- 72,30 20,07
ERB HELLAS PLC* 500,00 500,00 € 4,3 Fixed Annual 26/6/2015 06/19/2014 06/26/2018 CCC+ /*- 64,38 20,29
* 2014 Issues
** 2014 Maturities
*** 2015 Maturities
March 2015Source: Piraeus Bank Research, Bloomberg
13
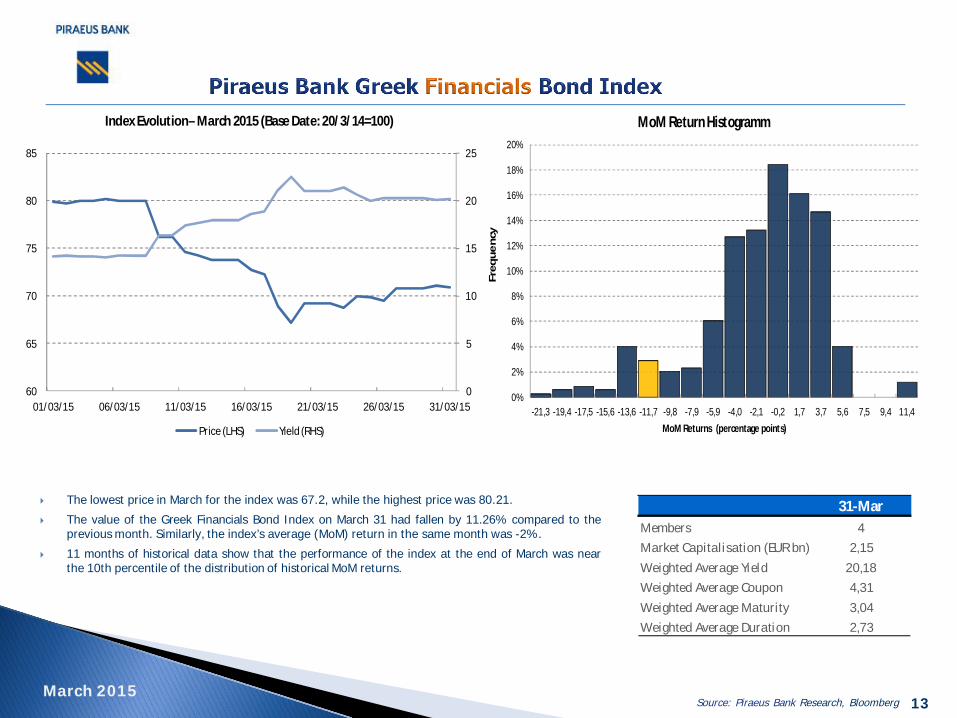
} The lowest price in March for the index was 67.2, while the highest price was 80.21.
} The value of the Greek Financials Bond Index on March 31 had fallen by 11.26% compared to theprevious month. Similarly, the index’s average (MoM) return in the same month was -2%.
} 11 months of historical data show that the performance of the index at the end of March was nearthe 10th percentile of the distribution of historical MoM returns.
31-MarMembers 4
Market Capitalisation (EUR bn) 2,15
Weighted Average Yield 20,18
Weighted Average Coupon 4,31
Weighted Average Maturity 3,04
Weighted Average Duration 2,73
0
5
10
15
20
25
60
65
70
75
80
85
01/03/15 06/03/15 11/03/15 16/03/15 21/03/15 26/03/15 31/03/15
Index Evolution– March 2015 (Base Date: 20/3/14=100)
Price (LHS) Yield (RHS)
0%
2%
4%
6%
8%
10%
12%
14%
16%
18%
20%
-21,3 -19,4 -17,5 -15,6 -13,6 -11,7 -9,8 -7,9 -5,9 -4,0 -2,1 -0,2 1,7 3,7 5,6 7,5 9,4 11,4
Fre
qu
en
cy
MoM Returns (percentage points)
MoM Return Histogramm
March 2015Source: Piraeus Bank Research, Bloomberg
14
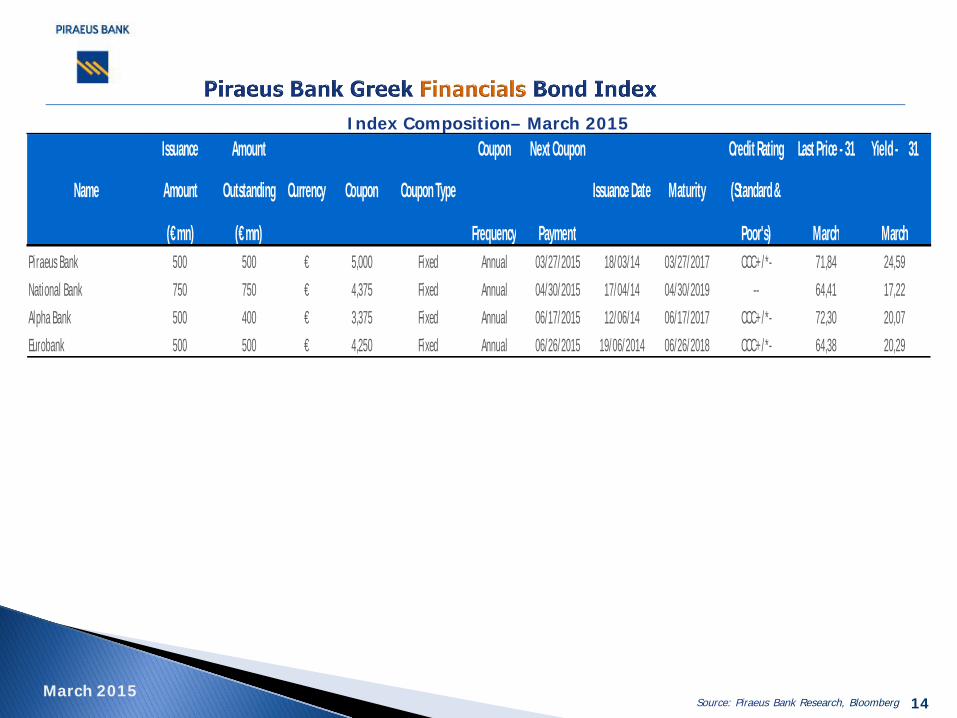
Index Composition– March 2015
Name
Issuance
Amount
(€ mn)
Amount
Outstanding
(€ mn)
Currency Coupon Coupon Type
Coupon
Frequency
Next Coupon
Payment
Issuance Date Maturity
Credit Rating
(Standard &
Poor's)
Last Price - 31
March
Yield - 31
MarchPiraeus Bank 500 500 € 5,000 Fixed Annual 03/27/2015 18/03/14 03/27/2017 CCC+ /*- 71,84 24,59
National Bank 750 750 € 4,375 Fixed Annual 04/30/2015 17/04/14 04/30/2019 -- 64,41 17,22
Alpha Bank 500 400 € 3,375 Fixed Annual 06/17/2015 12/06/14 06/17/2017 CCC+ /*- 72,30 20,07
Eurobank 500 500 € 4,250 Fixed Annual 06/26/2015 19/06/2014 06/26/2018 CCC+ /*- 64,38 20,29
March 2015Source: Piraeus Bank Research, Bloomberg
Disclaimer: This note constitute an investment advertisement, is intended solely for information purposes and it cannot in any way be considered investmentadvice, offer or recommendation to enter into any transaction. The information included in this note may not be construed as suitable investment for the holder,nor may it be considered as an instrument to accomplish specific investment goals or relevant financial needs of the holder and may neither be reckoned as asubstitute to relevant contractual agreements between the Bank and the holder. Before entering into any transaction each individual investor should evaluate theinformation contained in this note and not base his/her decision solely on the information provided. This note cannot be considered investment research andconsequently it was not compiled by Piraeus Bank according to the requirements of the law that are intended to ensure independence in the sector of investmentresearch. Information comprised in this note is based on publically available sources that are considered to be reliable. Piraeus Bank cannot be held accountablefor the accuracy or completeness of the information contained in this note. Views and estimates brought forward in this note represent domestic and internationalmarket trends on the date indicated in the note and they are subject to alteration without previous warning. Piraeus Bank may also include in this note investmentresearch done by third parties. This information is not modified in any way, consequently the Bank cannot be held accountable for the content. The Piraeus BankGroup is and organization with a considerable domestic and international presence, and provides a great variety of investment services. In cases where conflictsof interest issues should arise while Piraeus Bank or the rest of the companies of the group provide investment services in relation to the information provided inthis note, Piraeus Bank and the companies of the Group should be underlined that (the list is not exhaustive): a) No restrictions apply in dealing for own account,or with regards to trading in relation to portfolios managed by Piraeus Bank or companies of its group before the publication of this note, or with regards totrading before an initial public offer. b) It is possible that investment or additional services are provided to the issuers included in this note against a fee. c) It ispossible that Bank or any of its subsidiaries participate in the share capital of any of the issuers included in this note or may attract other interests financial or notfrom them. d) The Bank or any of its subsidiaries may act a market maker or an underwriter for any of the issuers included in the note. e) Piraeus Bank may haveissued similar notes with different or incompatible content with the content of this note. It should be explicitly noted that: a) Figures refer to past performancesand past performances do not constitute a safe indication for future performances. b) Figures constitute simulation of past performances and they are not a safeindication of future performances. c) Any projections or other estimates are not safe indications for future performances. d) Taxation treatment of informationprovided in this note may differ according to the rules that govern each individual investor. Therefore the holder should seek independent advice in relation totaxation rules that may affect him/her. e) Piraeus Bank is not under any obligation to keep data and information provided herein updated.
15March 2015