gravitational waves from merging intermediate …gravitational waves from merging intermediate-mass...
TRANSCRIPT
Gravitational Waves from Merging Intermediate-mass Black Holes.II. Event Rates at Ground-based Detectors
Hisa-aki Shinkai1, Nobuyuki Kanda2, and Toshikazu Ebisuzaki31 Dept. of Information Science and Technology, Osaka Institute of Technology, Kitayama 1-79-1,
Hirakata City, Osaka 573-0196, Japan; [email protected] Dept. of Physics, Osaka City University, Sugimoto 3-3-138, Sumiyoshi, Osaka City,
Osaka 558-8585, Japan; [email protected] Computational Astrophysics Laboratory, Institute of Physical and Chemical Research (RIKEN),
Hirosawa 2-1, Wako City, Saitama 351-0198, Japan; [email protected] 2016 October 28; revised 2016 December 12; accepted 2016 December 22; published 2017 February 1
Abstract
Based on a dynamical formation model of a supermassive black hole (SMBH), we estimate the expectedobservational profile of gravitational waves at ground-based detectors, such as KAGRA or advanced LIGO/VIRGO. Noting that the second generation of detectors have enough sensitivity from 10 Hz and up (especially withKAGRA owing to its location at less seismic noise), we are able to detect the ring-down gravitational wave of a BHwith mass < ´M M2 103 . This enables us to check the sequence of BH mergers to SMBHs via intermediate-mass BHs. We estimate the number density of galaxies from the halo formation model and estimate the number ofBH mergers from the giant molecular cloud model assuming hierarchical growth of merged cores. At the designedKAGRA (and/or advanced LIGO/VIRGO), we find that the BH merger of its total mass ~M M60 is at the peakof the expected mass distribution. With its signal-to-noise ratio ( )r = 10 30 , we estimate the event rate
( )~R 200 20 per year in the most optimistic case, and we also find that BH mergers in the range <M M150 are>R 1 per year for r = 10. Thus, if we observe a BH with more than M100 in future gravitational-wave
observations, our model naturally explains its source.
Key words: globular clusters: general – gravitational waves – quasars: supermassive black holes –stars: black holes
1. Introduction
1.1. Era of Gravitational-wave Astronomy
The direct detections of gravitational waves were announced bythe advanced LIGO group in 2016 (Abbott et al. 2016a, 2016b),and we are at the opening era of “gravitational-wave astronomy.”The LIGO group reported two events (GW150914, GW151226)and one transient event (LVT151012), all three of which areregarded as events of coalescence of binary black holes (BBHs).
The first event (GW150914) was the merger of BHs ofmasses -
+ M36.2 3.85.2 and -
+ M29.1 4.43.7 , which turned into a single
BH of -+ M62.3 3.1
3.7 with spin = -+a 0.68 0.06
0.05, which shows thatthe energy radiation rate is 4.6% of the total mass. The eventoccurred at redshift = -
+z 0.09 0.040.03 and was detected with signal-
to-noise ratio (S/N) r = 23.7. The second event (GW151226)was the merger of BHs with -
+ M14.2 3.78.3 and -
+ M7.5 2.32.3 , which
turned into a single BH of -+ M20.8 1.7
6.1 with spin = -+a 0.74 0.06
0.06,which shows that the energy radiation rate is 4.1% of the totalmass. The event occurred at redshift = -
+z 0.09 0.040.03 and was
detected with r = 13.0 (these numbers were taken from Abbottet al. 2016c).
These announcements were not only valuable on the point ofthe direct detections of the gravitational wave, but also the firstresults confirming the existence of BHs, the existence of BHsof this mass range, and the existence of BBHs. Especially, theexistence of ~ M30 BHs was surprising to the community,since there were no such observational evidences ever before.
1.2. Possible Sources of 30 M BHs
The traditional scenarios for forming BBHs are commonenvelope evolution of primordial binary massive stars
(Belczynski et al. 2016) and dynamical formation in densestar clusters (Portegies Zwart & McMillan 2000).One possible scenario is to suppose that BBHs form
from Population III stars (Bond Carr 1984, Belczynski 2004).Recently, Kinugawa (2014, 2016) predicted event rates basedon this model. Existence of Population III stars is yet to beconfirmed, but they show that a typical BH mass of this modelis at ~ M30 (chirp mass ~ M60 ), and the event rate would be500 yr−1 (50 yr−1 for r 20; Nakano et al. 2015).Recently, M. S. Fujii et al. (2016, in preparation) estimate
BH mergers combining their N-body simulations, modeling ofglobular clusters, and cosmic star-cluster formation history andfind that BH mass distribution has a peak at 10 M and 50 M ,and the event rate for designed LIGO is at most 85 yr−1.In this article, based on the formation scenario of a
supermassive BH (SMBH), we extend the previous model toa sequence of intermediate-mass BHs (IMBHs) and estimatetheir observational detectability at ground-based gravitational-wave detectors.
1.3. SMBH Runaway Path
The formation process of an SMBH is one of the unsolvedproblems in galaxy evolution history. Many possible routeswere suggested by Rees (1978) long ago, but we still debate aplausible route. We do not yet know whether the firstgeneration of BHs are of stellar-mass size or supermassive.See, e.g., Volonteri (2012) and Haiman (2013) for a review.One of the simplest scenarios for forming an SMBH is from
the direct collapse of gas clouds or supermassive stars, ormassive disks (e.g., Umemura et al. 1993; Loeb & Rasio 1994;Shibata & Shapiro 2002; Bromm & Loeb 2004; Begelman
The Astrophysical Journal, 835:276 (8pp), 2017 February 1 doi:10.3847/1538-4357/835/2/276© 2017. The American Astronomical Society. All rights reserved.
1
et al. 2006, 2008). Another scenario is by accretions onto, ormergers of, the remnants of Population III stars (e.g., Haiman& Loeb 2001; Volonteri & Begelman 2010; Johnson et al.2012, 2013). Recent studies suggest that we can construct aformation route of SMBHs without contradicting with currentobservations.
In this article, we take the third route: accumulations of BHs.This route came to be believed when an IMBH (102– M103 )was first discovered in starburst galaxy M82 (Matsumotoet al. 2001; Matsushita et al. 2000). So far, many IMBHs havebeen found in the center of galaxies (for a review, see, e.g.,Greene 2012; Yagi 2012), and also the existence of an IMBHof M104 close to Sgr *A has recently been reported (Tsuboiet al. 2016; see also Portegies Zwart et al. 2006; Fujiiet al. 2008).
This runaway path was first proposed by Ebisuzaki et al.(2001). The scenario consists of three steps: (1) formation ofIMBHs by runaway mergers of massive stars in dense starclusters (Portegies Zwart et al. 2004), (2) accumulations ofIMBHs at the center region of a galaxy due to sinkages ofclusters by dynamical friction, and (3) mergers of IMBHs bymultibody interactions and gravitational radiation. Successivemergers of IMBHs are likely to form an SMBH with a mass
> M106 . Ebisuzaki et al. (2001) predicted that IMBH–IMBHor IMBH–SMBH merging events could be observed on theorder of one per month or even one per week.
Numerical simulations support the above first step (Marchant& Shapiro 1980; Portegies Zwart et al. 1999; Portegies Zwart& McMillan 2002; Portegies Zwart et al. 2004; Baumgardt &Makino 2003), and the second step is also confirmed in arealistic mass-loss model (Matsubayashi et al. 2007), while thethird step is not yet investigated in detail. The discovery of anSMBH binary system (Sudou et al. 2003), together with asimulation of an eccentric evolution of SMBH binaries(Iwasawa et al. 2010), supports this formation scenario throughmerging of IMBHs.
1.4. IMBHs and Gravitational Waves
In Matsubayashi et al. (2004, hereafter Paper I), we pointedout that gravitational waves from IMBHs can be a trigger toprove this process. If the space-based laser interferometers arein action, then their observation ranges (10−4
–10 Hz) are quitereasonable for IMBH mergers. By accumulating data of mergerevents, we can specify the IMBH merger scenario such as theymerge hierarchically or monopolistically.
Later, Fregeau et al. (2006) discussed the event rates ofIMBH–IMBH binary observations at advanced LIGO andVIRGO and concluded that we can expect ∼10 mergers peryear. This work was followed by Gair et al. (2011), includingthe Einstein Telescope project. Amaro-Seoane & Santamaría(2010) also discussed the IMBH–IMBH system, including thepre-merger phase.
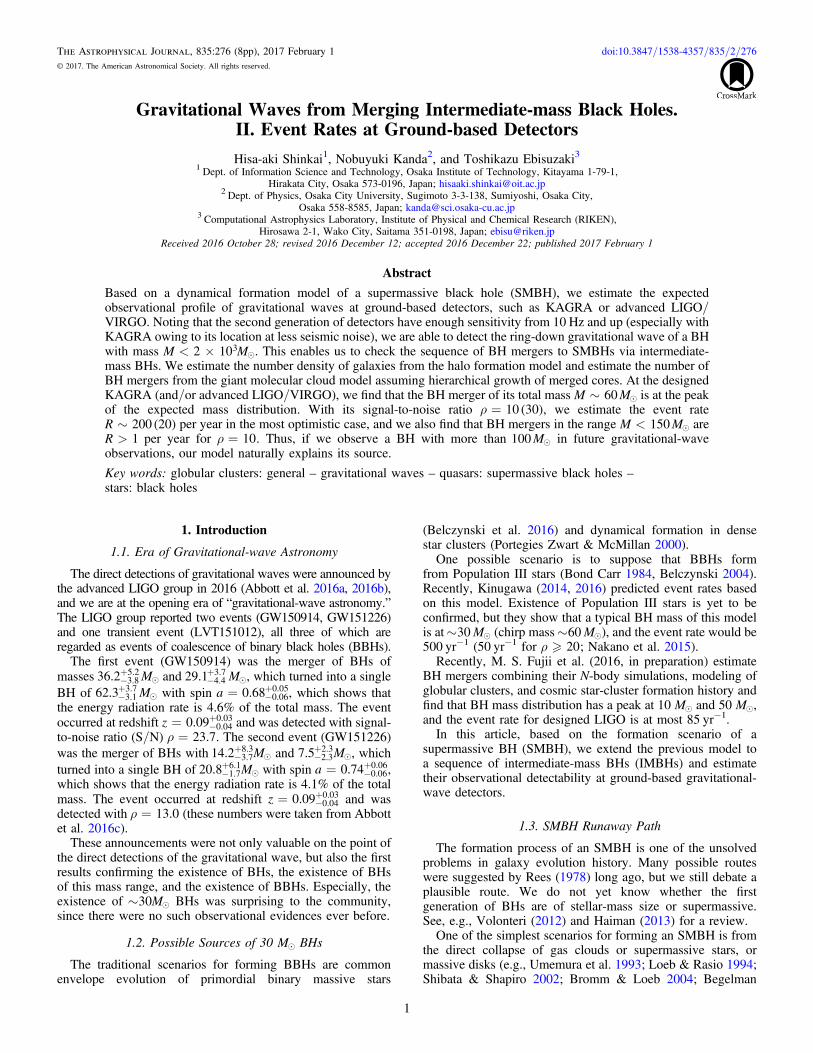
Noting that the second generation of GW interferometershave enough sensitivity at 10 Hz and above (see Figure 1), weare able to detect the ring-down gravitational wave of a BH ofmass < ´M M2 103 .
In this article, we therefore discuss how much we canobserve BH mergers by finding their ring-down part usingdesigned ground-based detectors. We roughly assume the massdistribution of BHs, N(M), in a galaxy or globular cluster,which would be related to the merging history of BHs, andestimate the event rate using the designed strain noise of
KAGRA, which is at the equivalent level with aLIGO/aVIRGO.In addition, recent approaches to gravitational-wave detec-
tion using a torsion-bar antenna (TOBA; Ando et al. 2010;Ishidoshiro et al. 2011) are also quite attractive for this purposesince it covers the low frequency range (0.1–10 Hz). However,the current strain noise amplitude of TOBA is larger comparedto those of interferometers (see Figure 1), and we do notdiscuss the case of TOBA in this article.The organization of the paper is as follows. In Section 2, we
present the basic equations of gravitational radiation fromIMBH binaries. In Section 3, we estimate the event rate ofIMBH mergers under the simplest assumptions on the galaxydistribution and formation process of SMBHs. A summary anddiscussion are presented in Section 4. Throughout the paper,we use c and G for the light speed and gravitational constant,respectively.
2. Black Hole Merger Model
2.1. Ring-down Frequency from BHs
The gravitational waveform of binary-star mergers, whichends up with a single BH, has three typical phases: inspiralphase, merging phase, and ring-down phase. The waveform inthe inspiral phase is called the “chirp signal” from its feature ofincreasing frequency and amplitude. For the case ofGW150914, the frequency was first caught at 35 Hz, and thenit increased to 150 Hz, where the amplitude reached themaximum, which indicates the merger of the binary. The final“ring-down” signal was supposed to be around 300 Hz.As we mentioned in Paper I, for massive BH binaries with
masses greater than M103 , the inspiral frequencies are lessthan 1 Hz. The wavelength of this frequency range isapparently more than the size of Earth, so that its detectionrequires interferometers in space. On the other hand, the ring-down frequency is simply estimated by the quasi-normalfrequency of BHs, +f ifR I , which is determined from the massand spin of the final BH and is estimated to be higher than in itsinspiral phase. The quasi-normal modes are derived aseigenvalues of the wave equations on the perturbed geometry(see, e.g., Leaver 1985). For a BH with mass MT and spin a,fitting functions are also known (Echeverria 1980; Berti et al.
Figure 1. Designed strain noise amplitude of the advanced detectors (advancedLIGO, advanced VIRGO, and KAGRA) and the planned Einstein Telescope.We also plotted that of a torsion-bar antenna (TOBA).
2
The Astrophysical Journal, 835:276 (8pp), 2017 February 1 Shinkai, Kanda, & Ebisuzaki
2006) in the form
( ) ( )= + -f f f a1 , 1Rf
1 2 3
( ) ( )º = + -Qf
fq q a
21 , 2R
I
q1 2 3
where Q is called the quality factor and f q,i i are fittingcoefficients. For the most fundamental mode, which is of thespherical harmonic index =ℓ 2, m=2, the fitting parametersare = = -f f1.5251, 1.15681 2 , = =f q0.1292, 0.70003 1 ,
=q 1.4187,2 and = -q 0.49903 (Berti et al. 2006). Recoveringthe units, we can write the frequency as
[ ] ( )
p=
~⎛⎝⎜
⎞⎠⎟
fc
GMf
M
Mf
2
3.210
kHz . 3
TR
TR
qnm
3
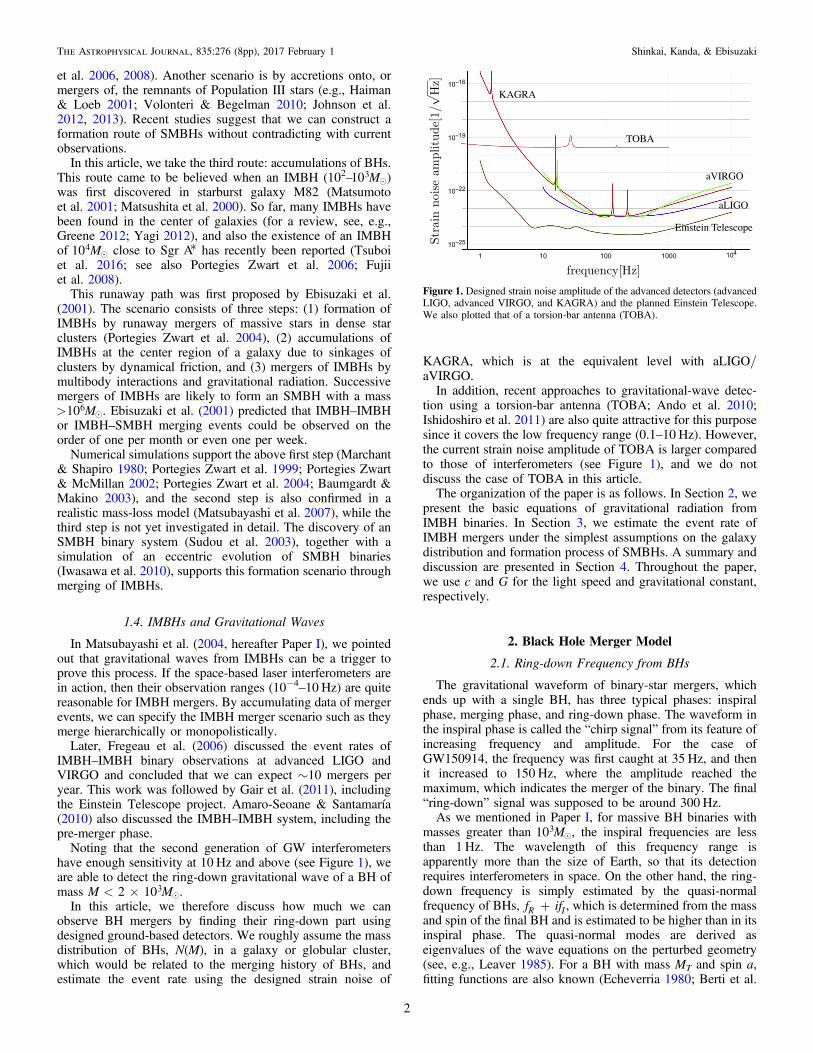
We plot fqnm in Figure 2.Supposing that advanced GW interferometers can detect fqnm
above 10 Hz, then BHs less than 1200 M are within the targetif BHs are nonrotating (a= 0), while BHs less than M2500are in the detectable range for highly rotating cases (a=0.98).
With this simple estimation, we hereafter consider mergersof BHs with total mass less than 2000 M .
2.2. Number of Galaxies in the Universe
In order to model the typical mass of galaxies and itsdistribution, We apply the halo mass function given by Vale &Ostriker (2006), in which they discuss an empirically based,nonparametric model for galaxy luminosities with halo/subhalo masses. They apply the Sheth–Tormen mass function(Sheth & Tormen 1999) for halo number density,
( ) ( )n p
n n= + -⎜ ⎟⎛
⎝⎞⎠
⎛⎝⎜
⎞⎠⎟n M dM
d
dMdM0.322 1
1 2exp
2, 4H 0.6
2
where ( ) ( )n d s= +a z M1c with a=0.707, the linearthreshold for spherical collapse d = 1.686c , and ( )s M is thevariance on the mass scale M. This mass function is roughly~ -M 1.95 at low mass.
Vale & Ostriker (2006) also derive an average number ofgalaxies (subhalos) predicted for a parent halo of mass, whichis roughly given by ~N Msubhalo
0.9 (Figure 12 in their paper).If we regard this relation as a seed of galaxies, then it indicatesthat a typical galaxy has mass – M10 1011 12 .Integrating Equation (4) by the volume as a function of
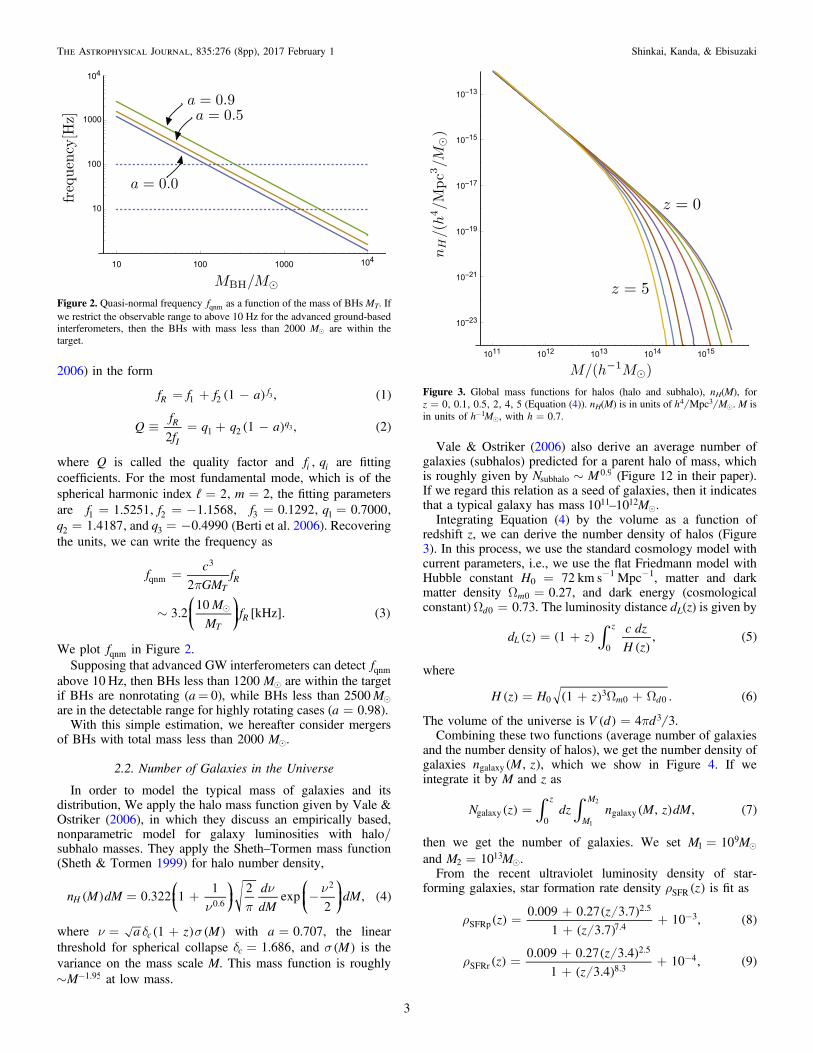
redshift z, we can derive the number density of halos (Figure3). In this process, we use the standard cosmology model withcurrent parameters, i.e., we use the flat Friedmann model withHubble constant H0 = 72 km s−1 Mpc−1, matter and darkmatter density W = 0.27m0 , and dark energy (cosmologicalconstant)W = 0.73d0 . The luminosity distance dL(z) is given by
( ) ( )( )
( )ò= +d z zc dz
H z1 , 5L
z
0
where
( ) ( ) ( )= + W + WH z H z1 . 6m d03
0 0
The volume of the universe is ( ) p=V d d4 33 .Combining these two functions (average number of galaxies
and the number density of halos), we get the number density ofgalaxies ( )n M z,galaxy , which we show in Figure 4. If weintegrate it by M and z as
( ) ( ) ( )ò ò=N z dz n M z dM, , 7z
M
M
galaxy0
galaxy1
2
then we get the number of galaxies. We set =M M1019
and =M M10213 .
From the recent ultraviolet luminosity density of star-forming galaxies, star formation rate density ( )r zSFR is fit as
( ) ( )( )
( )r =++
+ -zz
z
0.009 0.27 3.7
1 3.710 , 8SFRp
2.5
7.43
( ) ( )( )
( )r =++
+ -zz
z
0.009 0.27 3.4
1 3.410 , 9SFRr
2.5
8.34
Figure 2. Quasi-normal frequency fqnm as a function of the mass of BHs MT. Ifwe restrict the observable range to above 10 Hz for the advanced ground-basedinterferometers, then the BHs with mass less than 2000 M are within thetarget.
Figure 3. Global mass functions for halos (halo and subhalo), nH(M), for=z 0, 0.1, 0.5, 2, 4, 5 (Equation (4)). nH(M) is in units of h MMpc4 3 . M is
in units of -h M1 , with h=0.7.
3
The Astrophysical Journal, 835:276 (8pp), 2017 February 1 Shinkai, Kanda, & Ebisuzaki
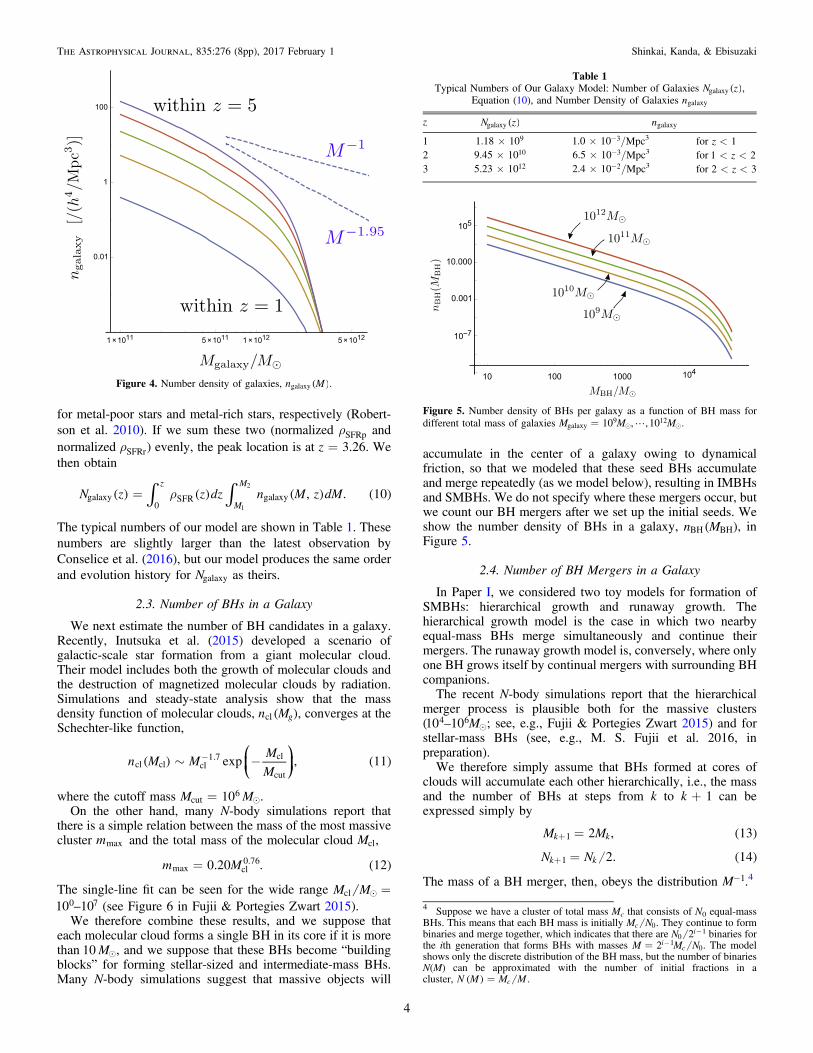
for metal-poor stars and metal-rich stars, respectively (Robert-son et al. 2010). If we sum these two (normalized rSFRp andnormalized rSFRr) evenly, the peak location is at z=3.26. Wethen obtain
( ) ( ) ( ) ( )ò òr=N z z dz n M z dM, . 10z
M
M
galaxy0
SFR galaxy1
2
The typical numbers of our model are shown in Table 1. Thesenumbers are slightly larger than the latest observation byConselice et al. (2016), but our model produces the same orderand evolution history for Ngalaxy as theirs.
2.3. Number of BHs in a Galaxy
We next estimate the number of BH candidates in a galaxy.Recently, Inutsuka et al. (2015) developed a scenario ofgalactic-scale star formation from a giant molecular cloud.Their model includes both the growth of molecular clouds andthe destruction of magnetized molecular clouds by radiation.Simulations and steady-state analysis show that the massdensity function of molecular clouds, ( )n Mgcl , converges at theSchechter-like function,
( ) ( )~ -- ⎛⎝⎜
⎞⎠⎟n M M
M
Mexp , 11cl cl cl
1.7 cl
cut
where the cutoff mass =M M10cut6 .
On the other hand, many N-body simulations report thatthere is a simple relation between the mass of the most massivecluster mmax and the total mass of the molecular cloud Mcl,
( )=m M0.20 . 12max cl0.76
The single-line fit can be seen for the wide range =M Mcl
–10 100 7 (see Figure 6 in Fujii & Portegies Zwart 2015).We therefore combine these results, and we suppose that
each molecular cloud forms a single BH in its core if it is morethan M10 , and we suppose that these BHs become “buildingblocks” for forming stellar-sized and intermediate-mass BHs.Many N-body simulations suggest that massive objects will
accumulate in the center of a galaxy owing to dynamicalfriction, so that we modeled that these seed BHs accumulateand merge repeatedly (as we model below), resulting in IMBHsand SMBHs. We do not specify where these mergers occur, butwe count our BH mergers after we set up the initial seeds. Weshow the number density of BHs in a galaxy, ( )n MBH BH , inFigure 5.
2.4. Number of BH Mergers in a Galaxy
In Paper I, we considered two toy models for formation ofSMBHs: hierarchical growth and runaway growth. Thehierarchical growth model is the case in which two nearbyequal-mass BHs merge simultaneously and continue theirmergers. The runaway growth model is, conversely, where onlyone BH grows itself by continual mergers with surrounding BHcompanions.The recent N-body simulations report that the hierarchical
merger process is plausible both for the massive clusters( – M10 104 6 ; see, e.g., Fujii & Portegies Zwart 2015) and forstellar-mass BHs (see, e.g., M. S. Fujii et al. 2016, inpreparation).We therefore simply assume that BHs formed at cores of
clouds will accumulate each other hierarchically, i.e., the massand the number of BHs at steps from k to +k 1 can beexpressed simply by
( )=+M M2 , 13k k1
( )=+N N 2. 14k k1
The mass of a BH merger, then, obeys the distribution -M 1.4
Figure 4. Number density of galaxies, ( )n Mgalaxy .
Table 1Typical Numbers of Our Galaxy Model: Number of Galaxies ( )N zgalaxy ,
Equation (10), and Number Density of Galaxies ngalaxy
z ( )N zgalaxy ngalaxy
1 ´1.18 109 ´ -1.0 10 3/Mpc3 for <z 12 ´9.45 1010 ´ -6.5 10 3/Mpc3 for < <z1 23 ´5.23 1012 ´ -2.4 10 2/Mpc3 for < <z2 3
Figure 5. Number density of BHs per galaxy as a function of BH mass fordifferent total mass of galaxies =M M M10 , ,10galaxy
9 12 .
4 Suppose we have a cluster of total mass Mc that consists of N0 equal-massBHs. This means that each BH mass is initially M Nc 0. They continue to formbinaries and merge together, which indicates that there are -N 2i
01 binaries for
the ith generation that forms BHs with masses = -M M N2ic
10. The model
shows only the discrete distribution of the BH mass, but the number of binariesN(M) can be approximated with the number of initial fractions in acluster, ( ) =N M M Mc .
4
The Astrophysical Journal, 835:276 (8pp), 2017 February 1 Shinkai, Kanda, & Ebisuzaki
On the other hand, we know empirically that the mass of thecentral BH of the galaxy, MSMBH, and the total mass of thegalaxy, Mgalaxy, has a relation
( )= ´ -M M2 10 15SMBH4
galaxy
(or equal to 10−3 of the bulge mass; see, e.g., King 2003;McConnell & Ma 2013).
Combining these facts, for a certain galaxy with Mgalaxy, wepick up BHs with total mass MSMBH (equation above), obeyingthe mass distribution of Figure 5. We suppose that picked-upBHs will form an SMBH in its series of mergers in thehierarchical model. Together with galaxy distribution function
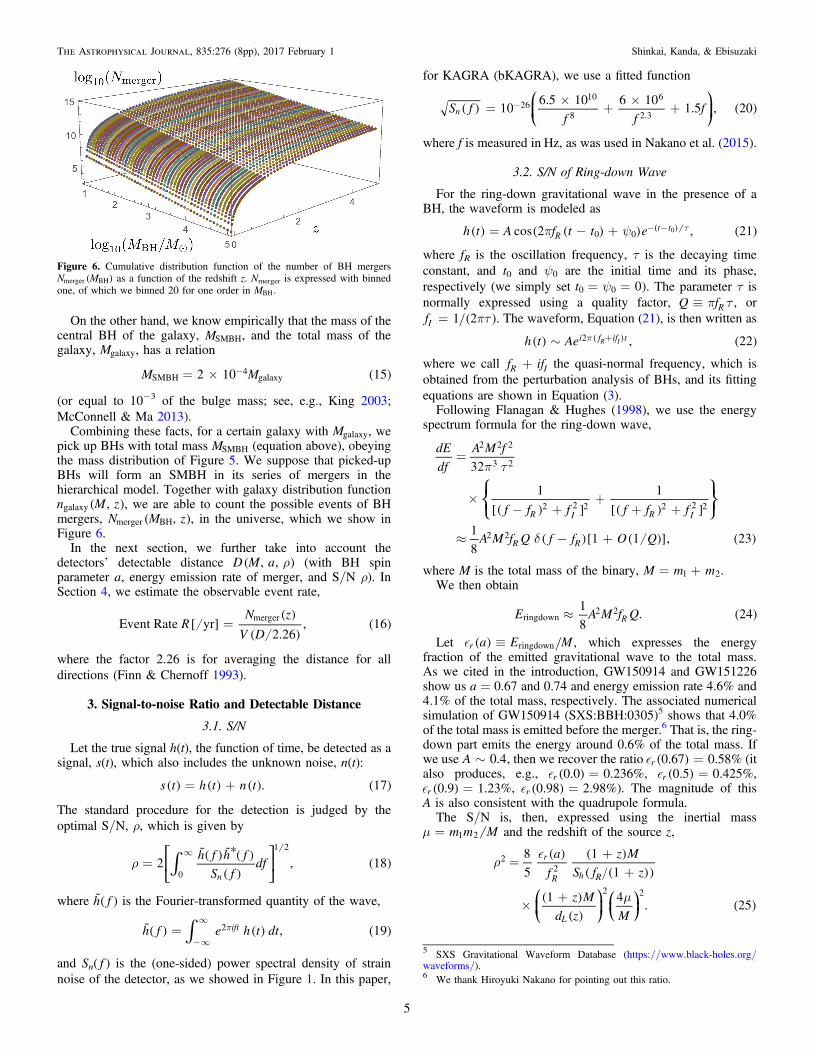
( )n M z,galaxy , we are able to count the possible events of BHmergers, ( )N M z,merger BH , in the universe, which we show inFigure 6.
In the next section, we further take into account thedetectors’ detectable distance ( )rD M a, , (with BH spinparameter a, energy emission rate of merger, and S/N ρ). InSection 4, we estimate the observable event rate,
[ ]( )
( )( )=R
N z
V DEvent Rate yr
2.26, 16
merger
where the factor 2.26 is for averaging the distance for alldirections (Finn & Chernoff 1993).
3. Signal-to-noise Ratio and Detectable Distance
3.1. S/N
Let the true signal h(t), the function of time, be detected as asignal, s(t), which also includes the unknown noise, n(t):
( ) ( ) ( ) ( )= +s t h t n t . 17
The standard procedure for the detection is judged by theoptimal S/N, ρ, which is given by
˜( ) ˜ ( )( )
( )*
òr =¥⎡
⎣⎢⎤⎦⎥
h f h f
S fdf2 , 18
n0
1 2
where ˜( )h f is the Fourier-transformed quantity of the wave,
˜( ) ( ) ( )ò= p
-¥
¥h f e h t dt, 19ift2
and Sn( f ) is the (one-sided) power spectral density of strainnoise of the detector, as we showed in Figure 1. In this paper,
for KAGRA (bKAGRA), we use a fitted function
( ) ( )=´
+´
+-⎛⎝⎜
⎞⎠⎟S f
f ff10
6.5 10 6 101.5 , 20n
2610
8
6
2.3
where f is measured in Hz, as was used in Nakano et al. (2015).
3.2. S/N of Ring-down Wave
For the ring-down gravitational wave in the presence of aBH, the waveform is modeled as
( ) ( ( ) ) ( )( )p y= - + t- -h t A f t t ecos 2 , 21Rt t
0 0 0
where fR is the oscillation frequency, τ is the decaying timeconstant, and t0 and y0 are the initial time and its phase,respectively (we simply set y= =t 00 0 ). The parameter τ isnormally expressed using a quality factor, p tºQ fR , or
( )pt=f 1 2I . The waveform, Equation (21), is then written as
( ) ( )( )~ p +h t Ae , 22i f if t2 R I
where we call +f ifR I the quasi-normal frequency, which isobtained from the perturbation analysis of BHs, and its fittingequations are shown in Equation (3).Following Flanagan & Hughes (1998), we use the energy
spectrum formula for the ring-down wave,
[( ) ] [( ) ]
( )[ ( )] ( )
p t
d
=
´- +
++ +
» - +
⎪
⎪
⎪
⎪
⎧⎨⎩
⎫⎬⎭
dE
df
A M f
f f f f f f
A M f Q f f O Q
32
1 1
1
81 1 , 23
R I R I
R R
2 2 2
3 2
2 2 2 2 2 2
2 2
where M is the total mass of the binary, = +M m m1 2.We then obtain
( )»E A M f Q1
8. 24Rringdown
2 2
Let ( ) ºa E Mr ringdown , which expresses the energyfraction of the emitted gravitational wave to the total mass.As we cited in the introduction, GW150914 and GW151226show us a = 0.67 and 0.74 and energy emission rate 4.6% and4.1% of the total mass, respectively. The associated numericalsimulation of GW150914 (SXS:BBH:0305)5 shows that 4.0%of the total mass is emitted before the merger.6 That is, the ring-down part emits the energy around 0.6% of the total mass. Ifwe use ~A 0.4, then we recover the ratio ( ) =0.67 0.58%r (italso produces, e.g., ( ) =0.0 0.236%r , ( ) =0.5 0.425%r ,
( ) =0.9 1.23%r , ( ) =0.98 2.98%r ). The magnitude of thisA is also consistent with the quadrupole formula.The S/N is, then, expressed using the inertial mass
m = m m M1 2 and the redshift of the source z,
( ) ( )( ( ))
( )( )
( )
r
m
=+
+
´+ ⎜ ⎟
⎛⎝⎜
⎞⎠⎟
⎛⎝
⎞⎠
a
f
z M
S f z
z M
d z M
8
5
1
1
1 4. 25
r
R h R
L
22
2 2
Figure 6. Cumulative distribution function of the number of BH mergers( )N Mmerger BH as a function of the redshift z. Nmerger is expressed with binned
one, of which we binned 20 for one order in MBH.
5 SXS Gravitational Waveform Database (https://www.black-holes.org/waveforms/).6 We thank Hiroyuki Nakano for pointing out this ratio.
5
The Astrophysical Journal, 835:276 (8pp), 2017 February 1 Shinkai, Kanda, & Ebisuzaki
Up to here, we see that the S/N is larger when the BH spin a islarge, and it reaches a maximum when =m m1 2.
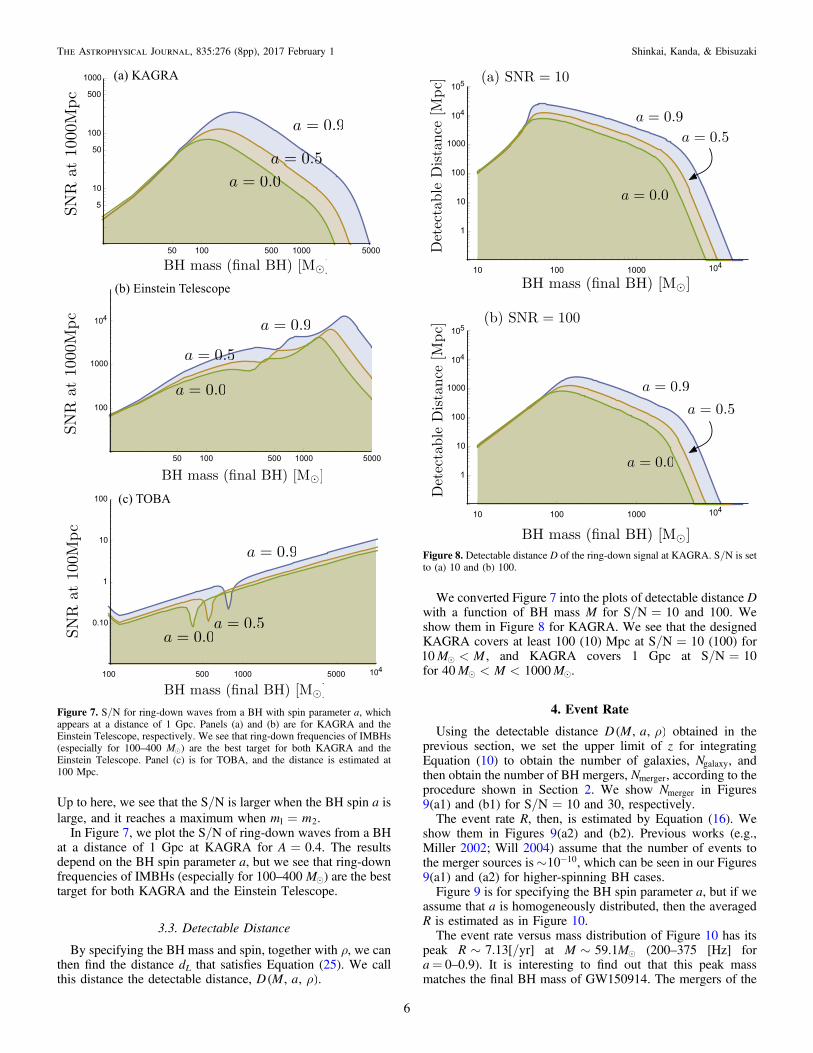
In Figure 7, we plot the S/N of ring-down waves from a BHat a distance of 1 Gpc at KAGRA for A=0.4. The resultsdepend on the BH spin parameter a, but we see that ring-downfrequencies of IMBHs (especially for 100–400 M ) are the besttarget for both KAGRA and the Einstein Telescope.
3.3. Detectable Distance
By specifying the BH mass and spin, together with ρ, we canthen find the distance dL that satisfies Equation (25). We callthis distance the detectable distance, ( )rD M a, , .
We converted Figure 7 into the plots of detectable distance Dwith a function of BH mass M for S/N=10 and 100. Weshow them in Figure 8 for KAGRA. We see that the designedKAGRA covers at least 100 (10) Mpc at S/N=10 (100) for
<M M10 , and KAGRA covers 1 Gpc at S/N=10for < <M M M40 1000 .
4. Event Rate
Using the detectable distance ( )rD M a, , obtained in theprevious section, we set the upper limit of z for integratingEquation (10) to obtain the number of galaxies, Ngalaxy, andthen obtain the number of BH mergers, Nmerger, according to theprocedure shown in Section 2. We show Nmerger in Figures9(a1) and (b1) for S/N=10 and 30, respectively.The event rate R, then, is estimated by Equation (16). We
show them in Figures 9(a2) and (b2). Previous works (e.g.,Miller 2002; Will 2004) assume that the number of events tothe merger sources is~ -10 10, which can be seen in our Figures9(a1) and (a2) for higher-spinning BH cases.Figure 9 is for specifying the BH spin parameter a, but if we
assume that a is homogeneously distributed, then the averagedR is estimated as in Figure 10.The event rate versus mass distribution of Figure 10 has its
peak ~R 7.13[/yr] at ~M M59.1 (200–375 [Hz] fora= 0–0.9). It is interesting to find out that this peak massmatches the final BH mass of GW150914. The mergers of the
Figure 7. S/N for ring-down waves from a BH with spin parameter a, whichappears at a distance of 1 Gpc. Panels (a) and (b) are for KAGRA and theEinstein Telescope, respectively. We see that ring-down frequencies of IMBHs(especially for 100–400 M ) are the best target for both KAGRA and theEinstein Telescope. Panel (c) is for TOBA, and the distance is estimated at100 Mpc.
Figure 8. Detectable distance D of the ring-down signal at KAGRA. S/N is setto (a) 10 and (b) 100.
6
The Astrophysical Journal, 835:276 (8pp), 2017 February 1 Shinkai, Kanda, & Ebisuzaki
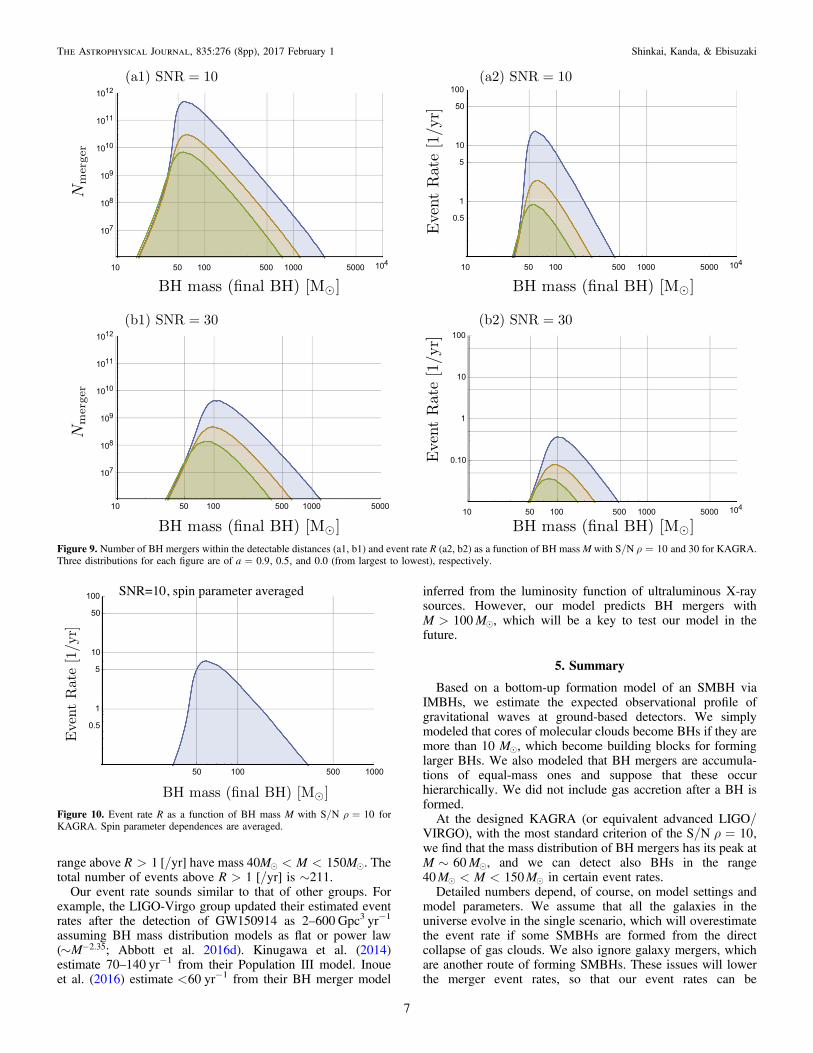
range above >R 1 [/yr] have mass < <M M M40 150 . Thetotal number of events above >R 1 [/yr] is ∼211.
Our event rate sounds similar to that of other groups. Forexample, the LIGO-Virgo group updated their estimated eventrates after the detection of GW150914 as 2–600 Gpc3 yr−1
assuming BH mass distribution models as flat or power law(~ -M 2.35; Abbott et al. 2016d). Kinugawa et al. (2014)estimate 70–140 yr−1 from their Population III model. Inoueet al. (2016) estimate <60 yr−1 from their BH merger model
inferred from the luminosity function of ultraluminous X-raysources. However, our model predicts BH mergers with
>M M100 , which will be a key to test our model in thefuture.
5. Summary
Based on a bottom-up formation model of an SMBH viaIMBHs, we estimate the expected observational profile ofgravitational waves at ground-based detectors. We simplymodeled that cores of molecular clouds become BHs if they aremore than 10 M , which become building blocks for forminglarger BHs. We also modeled that BH mergers are accumula-tions of equal-mass ones and suppose that these occurhierarchically. We did not include gas accretion after a BH isformed.At the designed KAGRA (or equivalent advanced LIGO/
VIRGO), with the most standard criterion of the S/N r = 10,we find that the mass distribution of BH mergers has its peak at
~M M60 , and we can detect also BHs in the range < <M M M40 150 in certain event rates.
Detailed numbers depend, of course, on model settings andmodel parameters. We assume that all the galaxies in theuniverse evolve in the single scenario, which will overestimatethe event rate if some SMBHs are formed from the directcollapse of gas clouds. We also ignore galaxy mergers, whichare another route of forming SMBHs. These issues will lowerthe merger event rates, so that our event rates can be
Figure 9. Number of BH mergers within the detectable distances (a1, b1) and event rate R (a2, b2) as a function of BH mass M with S/N r = 10 and 30 for KAGRA.Three distributions for each figure are of =a 0.9, 0.5, and 0.0 (from largest to lowest), respectively.
Figure 10. Event rate R as a function of BH mass M with S/N r = 10 forKAGRA. Spin parameter dependences are averaged.
7
The Astrophysical Journal, 835:276 (8pp), 2017 February 1 Shinkai, Kanda, & Ebisuzaki
understood at the maximum number. However, the profiles ofevent rates in terms of BH mass (Figure 10) will remain thesame; therefore, our model’s feature, the existence ofgravitational-wave events with BHs larger than 100 M , willbe tested by accumulating actual events.
We conclude that the statistics of the signals will give usboth a galaxy distribution and a formation model of SMBHs, aswell as in the future cosmological models/gravitationaltheories.
We thank the anonymous referee for constructive sugges-tions. This work was supported in part by the Grant-in-Aid forScientific Research Fund of the JSPS (C) No. 25400277 (H.S.),and also by MEXT Grant-in-Aid for Scientific Research onInnovative Areas “New Developments in AstrophysicsThrough Multi-Messenger Observations of Gravitational WaveSources” (No. 24103005) (N.K.).
References
Abbott, B., et al. (LIGO Scientific Collaboration and Virgo Collaboration)2016a, PhRvL, 116, 061102
Abbott, B., et al. (LIGO Scientific Collaboration and Virgo Collaboration)2016b, PhRvL, 116, 241103
Abbott, B., et al. (LIGO Scientific Collaboration and Virgo Collaboration)2016c, PhRvX, 6, 041015
Abbott, B., et al. (LIGO Scientific Collaboration and Virgo Collaboration)2016d, ApJL, 833, 1
Amaro-Seoane, P., & Santamaría, L. 2010, ApJ, 722, 1197Ando, M., Ishidoshiro, K., Yamamoto, K., et al. 2010, PhRvL, 105, 161101Baumgardt, H., & Makino, J. 2003, MNRAS, 340, 227Begelman, M. C., Rossi, E. M., & Armitage, P. J. 2008, MNRAS, 387, 1649Begelman, M. C., Volonteri, M., & Rees, M. J. 2006, MNRAS, 370, 289Belczynski, K., Daniel, E. H., Tomasz, B., & O’Shaughnessy, R. 2016, Natur,
534, 512Belczynski, K., Tomasz, B., & Bronislaw, R. 2004, ApJL, 608, L45Berti, E., Cardoso, V., & Will, C. M. 2006, PhRvD, 73, 064030Bond, J. R., & Carr, B. J. 1984, MNRAS, 207, 585Bromm, V., & Loeb, A. 2004, NewA, 9, 353Conselice, C. J., Wilkinson, A., Duncan, K., & Mortlock, A. 2016, ApJ, 830, 83Ebisuzaki, T., Makino, J., Tsuru, T. G., et al. 2001, ApJL, 562, L19Echeverria, F. 1980, PhRvD, 40, 3194Finn, L. S., & Chernoff, D. F. 1993, PhRvD, 47, 2198Flanagan, É. É., & Hughes, S. A. 1998, PhRvD, 57, 4535Fregeau, J. M., Larson, S. L., Coleman Miller, M., O’Shaughnessy, R., &
Rasio, F. A. 2006, ApJL, 646, L135Fujii, M. S., Iwasawa, M., Funato, Y., & Makino, J. 2008, ApJ, 686, 1082
Fujii, M. S., & Portegies Zwart, S. 2015, MNRAS, 449, 726Gair, J. R., Mandel, I., Coleman Miller, M., & Volonteri, M. 2011, GReGr,
43, 485Greene, J. 2012, NatCo, 3, 1304Haiman, Z. 2013, The First Galaxies, Vol. 396, ed. T. Wiklind,
B. Mobasher, & V. Bromm, 293, arXiv:1203.6075Haiman, Z., & Loeb, A. 2001, ApJ, 552, 459Inoue, Y., Tanaka, Y. T., & Isobe, N. 2016, MNRAS, 461, 4329Inutsuka, S., Inoue, T., Iwasaki, K., & Hosokawa, T. 2015, A&A, 580, A49Ishidoshiro, K., Ando, M., Takamori, A., et al. 2011, PhRvL, 106, 161101Iwasawa, M., An, S., Matsubayashi, T., Funato, Y., & Makino, J. 2010,
arXiv:1011.4017Johnson, J. L., Whalen, D. J., Fryer, C. L., & Li, H. 2012, ApJ, 750, 66Johnson, J. L., Whalen, D. J., Li, H., & Holz, D. E. 2013, ApJ, 771, 116King, A. 2003, ApJL, 596, L27Kinugawa, T., Miyamoto, A., Kanda, N., & Nakamura, T. 2016, MNRAS,
456, 1093Kinugawa, T., Inayoshi, K., Hotokezaka, K., Nakauchi, D., & Nakamura, T.
2014, MNRAS, 442, 2963Leaver, E. W. 1985, RSPSA, A402, 285Loeb, A., & Rasio, F. A. 1994, ApJ, 432, 52Marchant, A. B., & Shapiro, S. L. 1980, ApJ, 239, 685Matsubayashi, T., Makino, J., & Ebisuzaki, T. 2007, ApJ, 656, 879Matsubayashi, T., Shinkai, H., & Ebisuzaki, T. 2004, ApJ, 614, 864 (Paper I)Matsumoto, H., Tsuru, T. G., Koyama, K., et al. 2001, ApJL, 547, L25Matsushita, S., Kawabe, R., Matsumoto, H., et al. 2000, ApJL, 545, L107McConnell, N. J., & Ma, C. P. 2013, ApJ, 764, 184Miller, M. C. 2002, ApJ, 581, 438Nakano, H., Tanaka, T., & Nakamura, T. 2015, PhRvD, 92, 064003Portegies Zwart, S. F., Holger, B., Piet, H., Makino, J., & McMillan, S. L. W.
2004, Natur, 428, 724Portegies Zwart, S. F., Makino, J., McMillan, S. L. W., & Hut, P. 1999, A&A,
348, 117Portegies Zwart, S. F., & McMillan, S. L. W. 2000, ApJL, 528, L17Portegies Zwart, S. F., & McMillan, S. L. W. 2002, ApJ, 576, 899Portegies Zwart, S. F., Baumgardt, H., McMillan, S. L. W., et al. 2006, ApJ,
641, 319Rees, M. J. 1978, Observatory, 98, 210Robertson, B. E., & Ellis, R. S. 2012, ApJ, 744, 95Robertson, B. E., Ellis, R. S., Dunlop, J. S., McLure, R. J., & Stark, D. P. 2010,
Natur, 468, 55Sheth, R. K., & Tormen, G. 1999, MNRAS, 308, 119Shibata, M., & Shapiro, S. L. 2002, ApJL, 572, L39Sudou, H., Iguchi, S., Murata, Y., & Taniguchi, Y. 2003, Sci, 300, 1263Tsuboi, M., Kitamura, Y., Miyoshi, M., et al. 2016, PASJ, 68, L7Umemura, M., Loeb, A., & Turner, E. L. 1993, ApJ, 419, 459Vale, A., & Ostriker, J. P. 2006, MNRAS, 371, 1173Volonteri, M. 2012, Sci, 337, 544Volonteri, M., & Begelman, M. C. 2010, MNRAS, 409, 1022Will, C. M. 2004, ApJ, 611, 1080Yagi, K. 2012, CQGra, 29, 075005
8
The Astrophysical Journal, 835:276 (8pp), 2017 February 1 Shinkai, Kanda, & Ebisuzaki