graphical notations for syllogisms: how alternative...
TRANSCRIPT

Graphical notations for syllogisms: how alternative representations impact the accessibility of concepts
Peter C-H. Cheng
Department of Informatics, University of Sussex
Falmer, Brighton, BN1 9QJ, UK
Email: [email protected]
Phone: +44 (0)1273 873652
Fax: +44 (0)1273 877873
Abstract Five notations for standard and multi-premise syllogisms are examined. Four are existing
notations (verbal propositions, Euler Diagrams, Venn Diagrams and Englebretsen's Linear
Diagrams) and one a novel diagrammatic system – Category Pattern Diagrams (CPDs).
CPDs integrate spatial location, linear ordering and properties of graphical objects in a
comprehensive representational format to encode information about syllogisms, which
provides a contrast to the use of degrees of spatial containment in the existing diagrammatic
systems. The comparison of the five notations reveals how their underlying representational
schemes can substantially impact the effectiveness of the encoding of the core concepts of the
knowledge domain; in particular whether the core domain concepts are readily accessible as
perceptual inferences and thus the notations are semantically transparent. The relative merits
of CPDs provide some support for claims about the utility of the Representational Epistemic
design principles that were used to create CPDs.
13 August 2013

2
Graphical abstract
Keywords Euler diagram, Venn diagram, Linear diagram, Category Pattern Diagram, Representational
format, Syllogism, Sorite, Perceptual Inferences, Semantic transparency, Representational
epistemology
M
S P !"
S M P
P M S
P M S
P M S
P M S
Category Pattern Diagram
Venn Diagram Linear Diagram Euler Diagram

1
Graphical notations for syllogisms: how alternative representations impact the accessibility of concepts
1. Introduction What constitutes an effective notation to support logical reasoning, or more generally any
form of reasoning? Answering this question has been of enduring interest to the disciplines
of psychology, cognitive science, computing and logic, because of the insights that are to be
gained into the way that alternative notations provide different perspectives on the knowledge
that they encode and because of the impact that notations have on the ease of reasoning and
problem solving (e.g., [10], [13], [15], [18], [23]). Much of the work on this question has
focussed on comparison of sentential notations versus diagrams. Sentential notations include
written natural language, or semi-formalised renderings of it, and formula notations from
logic, mathematics or computing. In the case of studies of syllogistic inference, the
diagrammatic representations studied have typically used the degree of spatial containment
(or overlap) of certain graphical components with others as a primary form of representing
information about relations among sets and assignment of members to sets: shapes within or
overlapping other shapes and the placement of symbols within areas created by such
overlapping shapes. Euler [9] and Venn [22] diagrams are the best known, but Englebretsen
[8] introduced Linear diagrams more recently.
Here we continue the venerable approach of comparing alternative notations of
syllogistic logic by contrasting verbal propositions and these three spatial-diagrammatic
notations. However, we will attempt to gain increased theoretical leverage by introducing a
novel diagrammatic notation that does not use degree of spatial containment as its primary
means of encoding information — Categorical Pattern Diagrams (CPDs). The creation of
CPDs is part of a larger programme of work that is studying the nature of representational
systems using the Representational Epistemic (REEP) approach [1]-[5]. The REEP approach
claims that the key to understanding the efficacy of a notational system, in the round, is to
focus on how the specific representational schemes (or formats [13]) of a notation encode the
core concepts that permeate a knowledge domain. For example, set theoretic notations and
the axioms of probability are the ever-present ideas when one deals with the topic of chance
and probability; even when they are not being explicitly addressed, they are inescapable
because they define the essence of the topic (without them the topic would be another topic).

2
Representational schemes are generic information structures that specify how certain aspects
of a topic are encoded in a particular notational system. For example, Probability Space
diagrams [2] were deliberately designed to exploit a representational scheme for sets based
on divisions of line segments and a separate representational scheme for magnitudes of
chance based on the length of line segments. Another central claim of the REEP approach is
that good theoretical and empirical leverage for studies of notational systems may be
obtained by creating new representational systems as novel codifications of knowledge. For
example, a particular innovation of Probability Space diagrams was to combine the
representational schemes for set information and magnitudes of chance by applying them to
the same line segments so as to coherently integrate both core conceptual perspectives.
Other representational systems that have also been created under the REEP approach
include novel notations for electricity [1], school algebra [3], event timetabling, personnel
rostering, and production planning and scheduling [5]. The successful evaluation of these
new systems has permitted various theoretical claims about the efficacy of representational
systems to be formulated by generalizing over their common characteristics. It is claimed
that to effectively support comprehension, problem solving and conceptual learning a
representational system should possess various forms of semantic transparency [1, 2, 5].
Forms of semantic transparency, among others, include: (a) the integration of concepts at
different levels of abstraction in the target knowledge domain; (b) the integration of concepts
across the different perspectives or ontologies that may be used to describe the domain; (c)
the integration of concepts at different scales of granularity within the domain; (d) the
integration of qualitative and quantitative inferences about concepts of the domain. The
approach also claims that representations that are semantically transparent are also likely to
be cognitively effective in computational terms, because they require fewer and less
demanding inferences when used to perform tasks in the target domain [1, 2, 5]. Further, the
REEP approach also provides principles for the design of novel representations, which
specify how the sets of core conceptual structures of a domain should be encoded in distinct
but coherently integrated representational schemes in order to achieve semantic transparency
[2, 5]. Four principles have been proposed. (a) For each set of core concepts of a given topic
a different representational scheme should be used in order to differentiate the sets of
concepts from each other. (b) To coherently interrelate the different representational schemes
that encode each set of core concepts an overall global interpretive framework should be
devised. (c) The individual representational scheme for each set of core concepts should

3
coherently encode the various levels or aspects of those concepts. (d) Sets of concepts for
secondary, more peripheral, sets of concepts should be integrated within the global
interpretive scheme. See [1], [2] and [5] for further explanations of the principles and their
application in the design of novel representational systems. By coherently encoding all the
concepts of a topic in a single representational system, the principles aim to make any
concept (core or peripheral) that is necessary for understanding and reasoning about a topic
readily accessible as expressions in the representational system. For an overview of how the
REEP approach contrasts with other approaches to the evaluation and design of notations see
[2].
The central aim of this paper is not (directly) to apply the principles of design to the
creation of a new notation for syllogisms in order to provide further evidence of the utility of
the REEP design principles; rather its purpose it to examine the more fundamental issue of
how alternative representational schemes impact on the semantic transparency of an encoded
domain. This is worthwhile doing in the context of syllogisms, because REEP’s theoretical
claims about semantic transparency have so far been induced from domains in which the core
concepts are largely algebraic, and the new notations to recodify that knowledge have been
largely geometric in nature ([1], [2], [5]). In comparison, syllogisms revolve around set
theoretic and categorical concepts and the existing notations, and the new Categorical Pattern
Diagrams largely exploit spatially based representational schemes. In other words, by
comparing how clearly and coherently each of the five different notations encode the
essential concepts of this domain, we will see how substantially semantic transparency may
be affected. Moreover, these effects are made particularly stark when quite different classes
of representational schemes are compared, such as sentential versus spatial schemes as
commonly contrasted in previous work (see above), but as will be seen substantial semantic
transparency effects exist even between variants of the same representational scheme.
Syllogistic reasoning provides a good case domain to address such issues for two
reasons. On the one hand, the domain’s scope is sufficiently constrained to allow a
thoroughgoing analysis of a comprehensive range of the concepts and inferences that are
central to understanding the topic. On the other hand, the topic nevertheless has ample
conceptual complexity to pose interesting challenges to alternative notations that in turn
provides good theoretical weight to drive investigations. For example, an effective notational
system should support its user’s access to, and reasoning about, the core concepts that
underpin syllogisms, which include: the identity of the given sets, or terms; subsets as

4
relations among the given sets; the membership status of subsets; the character of
propositions (quality and quantity); the structure of terms within the premises of syllogisms
(middle term is common, syllogism Figures); meaningful justifications of the correctness of
rules used to assess the validity of syllogisms. Do the five notational systems possess the
desirable characteristics of semantic transparency noted above? Can information at different
levels of abstraction be related; for instance, can general overarching concepts be simply
reified? Do they enable information at different levels of granularity, from individual terms
to whole syllogisms, to mutually constrain each other’s interpretation? Are alternative
perspectives, such as the structure of the premises and conditions for validity, easily related
within each representational system?
Section 2 of this paper gives a quick refresher about syllogisms and introduces the
sentential notation. Section 3 describes Euler, Venn and Englebretsen’s Linear diagrams [8].
Section 4 introduces CPDs, including the system’s syntax, semantics and its rules for testing
the validity of standard syllogisms. Section 5 challenges the notations by considering how
they support judgements about the validity of multi-premise syllogisms, specifically sorites.
The five notational systems are considered in some detail to provide a sound basis for their
comparison in the final section, which addresses their semantic transparency and considers
the impact their alternative representational schemes have on the efficacy of encoding core
information about the domain.
2. Syllogisms in the sentential notation The reader is unlikely to need an introduction to syllogisms (as can be found in [6] and [12],
for example). However, a brief overview is given in order to provide a reminder of the rich
terminology that is used to describe syllogisms. Consider two syllogisms, Sy1 and Sy2.
Sy1
No diagrams are sentential notations
All Venn Diagrams are diagrams
–––––––––––––––––––––––––––––––
No Venn Diagrams are sentential notations
Sy2.
All Category Pattern Diagrams (CPDs) are diagrams

5
All diagrams are effective representations
No effective representations are poor systems for learning
Some poor systems for learning are sentential notations
––––––––––––––––––––––––––––––––––––––––––––
No CPDs are sentential notations
Sy1 is a classical two-premise syllogism, consisting of a major premise, a minor premise and
a conclusion. The middle term, M (‘diagrams’), occurs in both premises and the predicate, P
(‘sentential notations’), and the subject, S (‘Venn diagrams’), are the major and minor terms
of the major or the minor premises, respectively. S always precedes P in syllogism
conclusions. (M is a subject in the major premise and a predicate in the minor premise.) The
quantity and quality of Sy1’s major premise happens to be universal and negative (No M are
P); such propositions are labeled E. Sy1’s minor premise is universal and affirmative (All S
are M); labeled A. The conclusion is also an E proposition (No S are P). Particular
affirmative propositions are labeled I and particular negative propositions labeled O. The
mood of a syllogism is its particular permutation of proposition types for the two premises
and the conclusion: Sy1’s mood is EAE. The four possible permutations of the order of the
premise terms are called Figures; Sy1 is of Figure type 1: M-P, S-M. The Mood and Figure
type of Sy1 may be summarized as EAE-1 and like all valid syllogisms has been given a
name, “Celarent” [6].
To determine the validity of syllogisms in verbal form, one may apply five rules
concerning the quality and quantity of the propositions. The quality rules state: (QL1) no
conclusion may follow when both premises are negative; (QL2) a conclusion is negative
when either premise is negative; (QL3) a negative conclusion cannot follow from two
affirmative premises. The quantity rules rely upon the notation of distribution, which is the
extent to which all the members of a category are affected in a proposition [6]; e.g., S is
distributed in All S are P, but variable P is not. The quantity rules state: (QN1) the middle
term must be distributed in one or both premises; (QN2) if a term in the premises is not
distributed, then it must not be distributed in the conclusion. These rules are challenging to
understand and apply, and explanations of how they determine the validity of inferences are
not straightforward.

6
Clearly making syllogistic inferences verbally is difficult and is well known to be
error-prone [12]. Thus, various notations have been created in history, and more recently,
that exploit the spatial properties of diagrams in order to support reasoning.
———— Fig 1 about here ————
3. Three extant notations This section introduces Venn diagrams [22], Euler diagrams [9] and Englebretsen's Linear
diagrams [8] that are the conventional diagrammatic notations adopted here. Many variants
of Venn and Euler diagrams have been proposed (e.g., [11], [17], [21]), some of which
extend and combine features of the original notations. However, the “basic” variants of these
diagrammatic notations with their associated inference methods have been chosen, because
they possess relatively straightforward representational schemes. Such “primitive”
representational schemes make the analysis of the accessibility of concepts a feasible
endeavour, and because they are quite distinctive they provide good contrasts to drive the
considerations about semantic transparency.
The middle three rows of Fig 1 (Fig 1.2-1.4) show how the notations encode the four
types of syllogistic propositions, which are verbally stated on the top row. In the Euler and
Venn diagrams a circle represents each term, and in Linear diagrams a set is represented by a
line segment starting with a dot to the right. Degree of spatial containment is used in Euler
diagrams to encode relations among the sets, whereas shading and a cross contained within a
region or zone are used to represent empty or non-empty sub-sets in the Venn diagrams. The
superposition of one line segment upon another in Linear diagrams represents members that
are in both sets, so Fig 1.4.A shows all elements of R are included in T. Disjoint sets are
shown by parallel lines, Fig 1.4.E, and intersecting lines show that some elements are shared
by both sets, Fig 1.4.I. The representation of proposition O is more complex, as it has two
forms depending on whether the element of the set in question, R, is shown as a dot, Fig
1.4.O.i, or whether it is a line segment, in which case it must be intersected by an explicit line
representing the complement of the other set, ¬T.
———— Fig 2 about here ————
Fig 2 shows representations of the EAE Mood syllogism that is valid for both Figure
types 1 and 2. For the Euler, Venn and Linear diagrams, premise diagrams are drawn (Fig
2.E and A) and composed into a result diagram (Fig 2.Res), which is inspected to see whether
it is compatible with the conclusion diagram (Fig 2.Con) – the term result diagram is used to
7
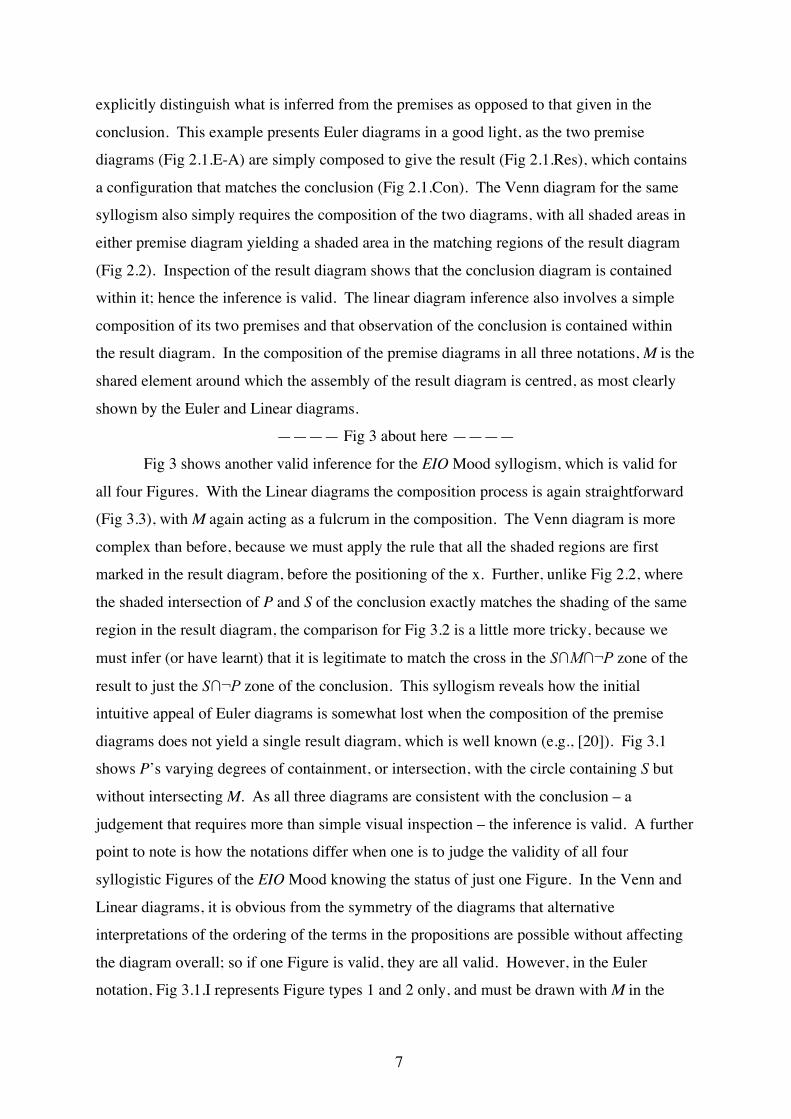
explicitly distinguish what is inferred from the premises as opposed to that given in the
conclusion. This example presents Euler diagrams in a good light, as the two premise
diagrams (Fig 2.1.E-A) are simply composed to give the result (Fig 2.1.Res), which contains
a configuration that matches the conclusion (Fig 2.1.Con). The Venn diagram for the same
syllogism also simply requires the composition of the two diagrams, with all shaded areas in
either premise diagram yielding a shaded area in the matching regions of the result diagram
(Fig 2.2). Inspection of the result diagram shows that the conclusion diagram is contained
within it; hence the inference is valid. The linear diagram inference also involves a simple
composition of its two premises and that observation of the conclusion is contained within
the result diagram. In the composition of the premise diagrams in all three notations, M is the
shared element around which the assembly of the result diagram is centred, as most clearly
shown by the Euler and Linear diagrams.
———— Fig 3 about here ————
Fig 3 shows another valid inference for the EIO Mood syllogism, which is valid for
all four Figures. With the Linear diagrams the composition process is again straightforward
(Fig 3.3), with M again acting as a fulcrum in the composition. The Venn diagram is more
complex than before, because we must apply the rule that all the shaded regions are first
marked in the result diagram, before the positioning of the x. Further, unlike Fig 2.2, where
the shaded intersection of P and S of the conclusion exactly matches the shading of the same
region in the result diagram, the comparison for Fig 3.2 is a little more tricky, because we
must infer (or have learnt) that it is legitimate to match the cross in the S∩M∩¬P zone of the
result to just the S∩¬P zone of the conclusion. This syllogism reveals how the initial
intuitive appeal of Euler diagrams is somewhat lost when the composition of the premise
diagrams does not yield a single result diagram, which is well known (e.g., [20]). Fig 3.1
shows P’s varying degrees of containment, or intersection, with the circle containing S but
without intersecting M. As all three diagrams are consistent with the conclusion – a
judgement that requires more than simple visual inspection – the inference is valid. A further
point to note is how the notations differ when one is to judge the validity of all four
syllogistic Figures of the EIO Mood knowing the status of just one Figure. In the Venn and
Linear diagrams, it is obvious from the symmetry of the diagrams that alternative
interpretations of the ordering of the terms in the propositions are possible without affecting
the diagram overall; so if one Figure is valid, they are all valid. However, in the Euler
notation, Fig 3.1.I represents Figure types 1 and 2 only, and must be drawn with M in the

8
intersection of the two circles to represent Figure types 3 and 4. The equivalence of all four
Figures is not readily apparent.
———— Fig 4 about here ————
So far valid syllogisms have been considered, in which the inferences though not
trivial have been relatively straightforward. Now consider the invalid III Mood syllogism,
shown in Fig 4 III. The Euler and Linear diagram inferences are clearly complex just by
visual inspection. The two premise Euler diagrams may be combined in six different ways
(Fig 4.1.Res) and the Linear diagrams in five ways (Fig 4.3.Res). For ease of comparison,
the corresponding diagrams for the two notations are in the same relative position in Fig 4.
Although there is one result diagram for each notation that matches its respective conclusion
diagram, the presence of other result diagrams means that inferences other than the one
desired conclusion can be drawn. The construction of the result Venn diagram requires a
further rule: when one zone is not ruled out by shading, as in the Fig 3.2.Res, the x symbol
must be drawn on the curve bisecting the target region, as shown Fig 4.2.Res. The result
diagram has two x symbols in a symmetric layout that is simpler than the multiple Euler and
Linear diagrams. However, this apparent clarity does not eliminate the complexity in the
inference, because the x on the curve means that the represented members may be in either or
both of the zones to either side of the curve. Thus, there are five possible interpretations,
which are implicitly encoded, that match each of the five Linear diagrams. (There are six
Euler diagrams, because the two marked * in Fig 4.1.Res have equivalent interpretations.
The implication of this point is considered further below.)
In summary, there are various benefits and disadvantages to each of the notations.
Euler diagrams are simple because just the relations of interest are drawn and the result
diagram has an appealing immediacy of interpretation, at least for simple cases. However,
the proliferation of result diagrams is an obvious disadvantage in more challenging examples.
Similar comments apply to Linear diagrams, but the proliferation of multiple result diagrams
may not be as severe. Venn diagrams benefit from a common fixed spatial structure – the
canonical configuration of three intersecting circles. However, specific context-dependent
rules must be invoked to apply the shading and placement of the x symbol, and the
interpretation of the result diagram is not always straightforward. Many of these costs and
benefits have been variously noted in the literature (e.g., [20]).

9
4. Category Pattern Diagrams, CPDs CPDs were first introduced in [4] and the presentation here provides a further refinement and
simplification of the notation.
———— Fig 5 about here ————
4.1. Syntax and semantics Fig 5.1-3 shows unary, binary and ternary CPDs. A CPD is based on of a row of horizontally
spaced letters. Each letter has a high and a low node. Line segments, called connectors,
intersect the nodes (run up to or through them). In unary CPDs a single short connector runs
through each node (Fig 5.1). For binary CPDs four connectors run between pairs of
immediately adjacent letters such that the arrangement includes all four possible
combinations of connectors between high and low nodes (Fig 5.2). For higher order CPDs,
this pattern of four connectors between each pair of adjacent letters is repeated for all pairs of
letters (Fig 5.3 shows a ternary CPD and, Fig 8 below shows examples of quaternary and
quinary CPDs). The style of a connector may be a single solid line, a single dashed line or a
double solid line.
A path of connectors, or just path for short, is a single continuous sequence of
connectors that runs between the left most and the right most letters, with just one connector
per constituent binary CPD. The ends of a path may intersect either the high or low node of
these end letters. In unary CPDs a path is a connector. Similarly, in binary CPDs a path is
also a single connector. In the text, we will refer to the paths of a binary CPD using the
expressions R—T, R_T, R \ T, R ⁄ T, which denote the top, bottom, descending and ascending
paths (connectors). In higher order CPDs, paths run in a continuous fashion through the high
or low node of each of the letters between the end letters. In ternary CPDs there are eight
possible paths and in general there are 2m paths in a CPD, where m is the number of terms. In
Fig 5.5 the eight paths of ternary CPDs are grouped in pairs, which have the same set
assignments for S and P, but different assignments for M, for reasons to be explained below.
Each letter is one syllogistic term (variable, category, set). The high and low nodes
represent set membership and set non-membership, respectively, as shown in Fig 5.1-3.
Thus, a path stands for a particular subset (or case) constituted by the conjunction of a
specific combination of inclusions or exclusions of all the terms in the CPD. The unary CPD
has two possible subsets for its term and the binary CPD has four cases between its two
terms. For example, the path/connector intersecting the high node in Fig 5.1 represents the

10
unary relation of P, whereas the connector at the low node is ¬P. The top horizontal path
(M—P) of the binary CPD in Fig 5.2 is M∩P and the descending diagonal (M \ P) is M∩¬P.
Each of the eight paths in a ternary CPD is a subset involving its three terms, so a path is
equivalent to one zone in a Venn diagram, as indicated by the corresponding numbers in Fig
5.4 and 5.5. For instance, path 1 (S—M—P, or —— for short) represents the relation
S∩M∩P, path 2 (\ /) is S∩¬M∩P, and path 3 (—\) is S∩M∩¬P.
The style of a connector indicates what is known about the relation. A single line
solid connector is a some-connector because it indicates that there is (at least) one member of
the subset represented by the connector. The dashed line connector is a none-connector as it
stands for an empty subset. The double solid line is a no-information-connector (no-info),
which explicitly represents the fact that nothing is known about the membership status of the
subset. A path may be constituted of connectors of more than one style. (The choice of
particular connector line style was largely arbitrary but with the proviso that they be ease to
distinguish visually.)
4.2. Representing syllogisms Fig 1.5 shows the binary CPDs for the four standard propositions of syllogisms. The A
proposition, All R are T, is represented by specifying that the subset R∩¬T is empty by
making the path between R and ¬T a none-connector, which encodes the same meaning as
shading in Venn diagrams. Similarly, in the E proposition the path between R and T is a
none-connector. For I and O propositions, some-connector paths run between R and T, or R
and ¬T, respectively. Nothing is specified about all the other relations among the subsets, so
all the other paths are no-info-connectors. Individually these diagrams may be reflected
about a vertical midline without alternating the meaning of the diagram.
Figs 2.4, 3.4, 4.4 show CPD syllogistic inferences. As with the other notations,
premise diagrams are drawn for the given statements, and then they are composed into a
result diagram, which is compared with the conclusion diagram. The result diagram
composition involves adjoining the two binary premise diagrams into a ternary CPD
(diagram 4.Res in Figs 2, 3 and 4). When joining the two premise CPDs, M is put in the
middle, with the major premise (M-P) to the right and the minor premise (S-M) to the left.
The conclusion diagram is drawn to the far right: note that the order of S and P in both the
result and conclusion diagrams is the same so as to facilitate their comparison.

11
4.3. Inference rules To evaluate the validity of a standard syllogism, each connector in the conclusion-CPD is
compared, in turn, to all of the paths in the result-CPD that have the same values of the
subject and predicate terms, S and P. Fig 5.5 identifies the pairs of paths with the same
values of S and P but with different values of M, and names these patterns for ease of
reference. The top conclusion connector, — (S∩P), is matched to the two paths of the ‘top-
triangle’ pattern in the result CPD. Similar the descending diagonal connector, \ (S∩¬P), is
matched to the ‘descending-parallelogram’ pattern; the ‘ascending diagonal’ connector, /
(¬S∩P), is matched to the ‘ascending-parallelogram’ pattern; and, the bottom connector, _
(¬S∩¬P), is matched to the ‘bottom-triangle’ pattern.
Three rules are used in the comparison of a conclusion connector and its matching
paths in the result CPD. Fig 6.1-4 illustrates the operation of these inference rules, taking as
an example the top connector of the conclusion (to the right of the arrow) that is mapped to
the two paths of the top-triangle pattern (left of the arrow).
Rule-none. For a none-connector in the conclusion-CPD, each matching path in the
result-CPD must include a none-connector and a no-info-connector.
Rule-some. For a some-connector in the conclusion: (1) one matching path in the result
CPD must consist of a some-connector and no-info-connector; (2) the other
matching path must consist only of no-info-connectors; (3) all the other non-
matching paths involving the some-connector must include a none-connector.
Rule-no-info. For a no-info-connector in the conclusion either (a) all the matching paths
must consist only of no-info-connectors or (b) one path consists of just no-info-
connectors and the other must include a none-connector with any other type of
connector (represented by the dotted line with the question mark in Fig 6.4).
The rules apply in the same way to the other connectors in the conclusion and their matching
patterns in the result CPD: the only difference to Fig 6.1-4 would be that one or both ends of
the paths would terminate at the low nodes of P and S.
So why do the rules work? Rule-none permits an inference to a none-connector in the
conclusion CPD when both paths each contain a none-connector and a no-info-connector. In
Fig 6.1, the left none-connector in the result-CPD pattern, S—M, specifies that S∩M is
empty, so S∩M∩P is also empty, because it is a subset of S∩M. The right none-connector,
M / P, specifies that ¬M∩P is empty, so S∩¬M∩P is also empty, by the same reasoning.
Therefore, irrespective of M the set S∩P is empty. Rule-none also applies when the none-
12
connectors are in the S \ M and M—P positions. (Each none-connector must be adjoined to a
no-info-connector in this rule, even though one might think that an adjoined none- or some-
connector might allow a none-connector to be inferred. However, as a well-formed binary
CPD must have precisely one none-connector or one some-connector, this would mean we
would have the pattern of connectors shown in Rule-no-info and hence a different result.
Remember that the CPD rules deal simultaneously with the sub-set relations for both M and
¬M, which is a fundamental characteristic syllogism).
Rule-some allows a some-connector to be inferred for the conclusion. In Fig 6.2, the
S—M some-connector says some S are M, but as the M \ P none-connector means all M are
P, then those M that are S must also be P. Without the M \ P none-connector, it is possible
that those M that are S could be ¬P, rather than P.
The first version of the third rule, Rule-no-info-(a), simply says that if nothing is
known about any of the subsets involving M and ¬M then nothing is known about the set that
aggregates those subsets. In the second version, Rule-no-info-(b), neither path provides any
information about the relation between S and P. This is obvious for the path with two no-
info-connectors. The dotted line for M—P with the question mark stands for any type of
connector, which adjoins the S—M none-connector. If M—P is a no-info-connector then that
path tells us nothing about the relation between S and P. Irrespective of whether M—P is a
some-connector or a none-connector no elements are shared between S and P via M, so the
nature of any relation depends on the other path via ¬M, but that consists just of no-info-
connectors. Rule-no-info-(b) holds irrespective of the particular path or the order of the
none-connector and the unknown connector in the path, so long as they are adjoined.
A syllogism is valid in the case that the comparisons between all conclusion CPD
connectors and their matching paths in the result CPD are satisfied by one of these rules.
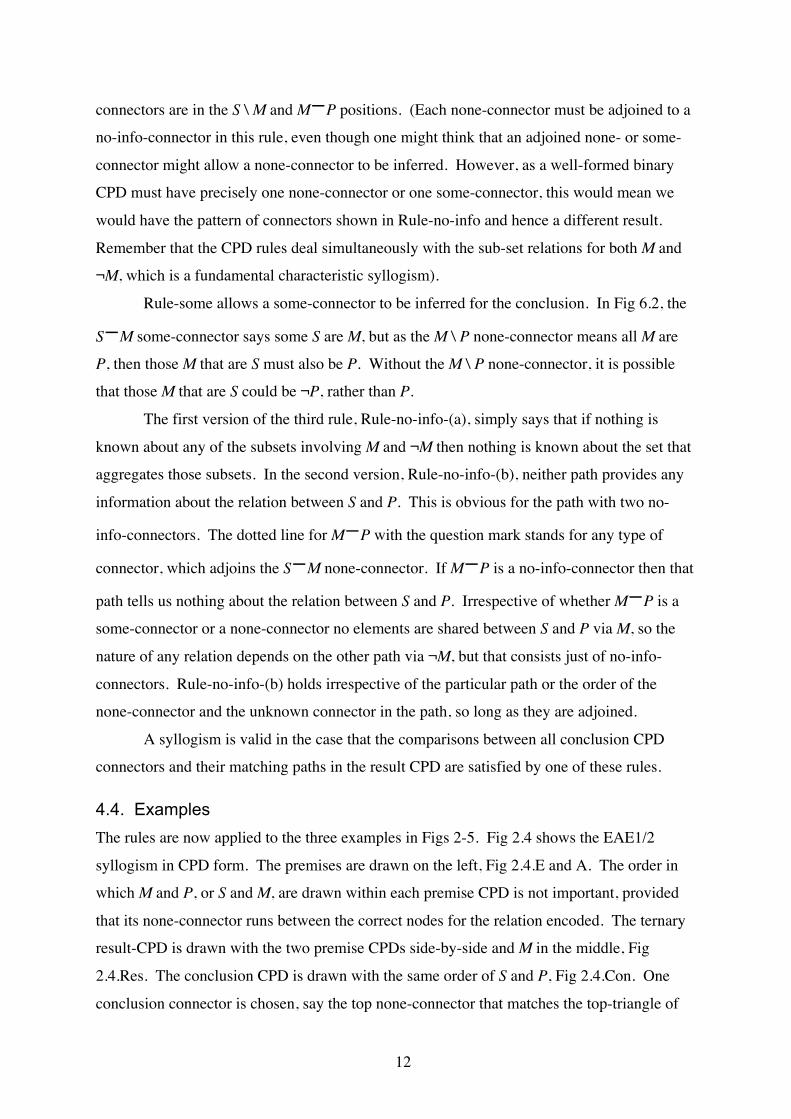
4.4. Examples The rules are now applied to the three examples in Figs 2-5. Fig 2.4 shows the EAE1/2
syllogism in CPD form. The premises are drawn on the left, Fig 2.4.E and A. The order in
which M and P, or S and M, are drawn within each premise CPD is not important, provided
that its none-connector runs between the correct nodes for the relation encoded. The ternary
result-CPD is drawn with the two premise CPDs side-by-side and M in the middle, Fig
2.4.Res. The conclusion CPD is drawn with the same order of S and P, Fig 2.4.Con. One
conclusion connector is chosen, say the top none-connector that matches the top-triangle of
13
the result. Rule-none applies because the top-triangle has one none-connector on each path
of the result-CDP. For the bottom no-info-connector of the conclusion, Rule-no-info-(a)
applies because the bottom-triangle just possesses no-info-connectors. For the ascending and
descending connectors of the conclusion Rule-no-info-(b) applies to the ascending and
descending parallelograms, because they include a none-connector on one path and the other
paths consists of a pair of no-info-connectors. As all four of the conclusion connectors are
implied by their respective sets of result CDP paths, the syllogism is valid.
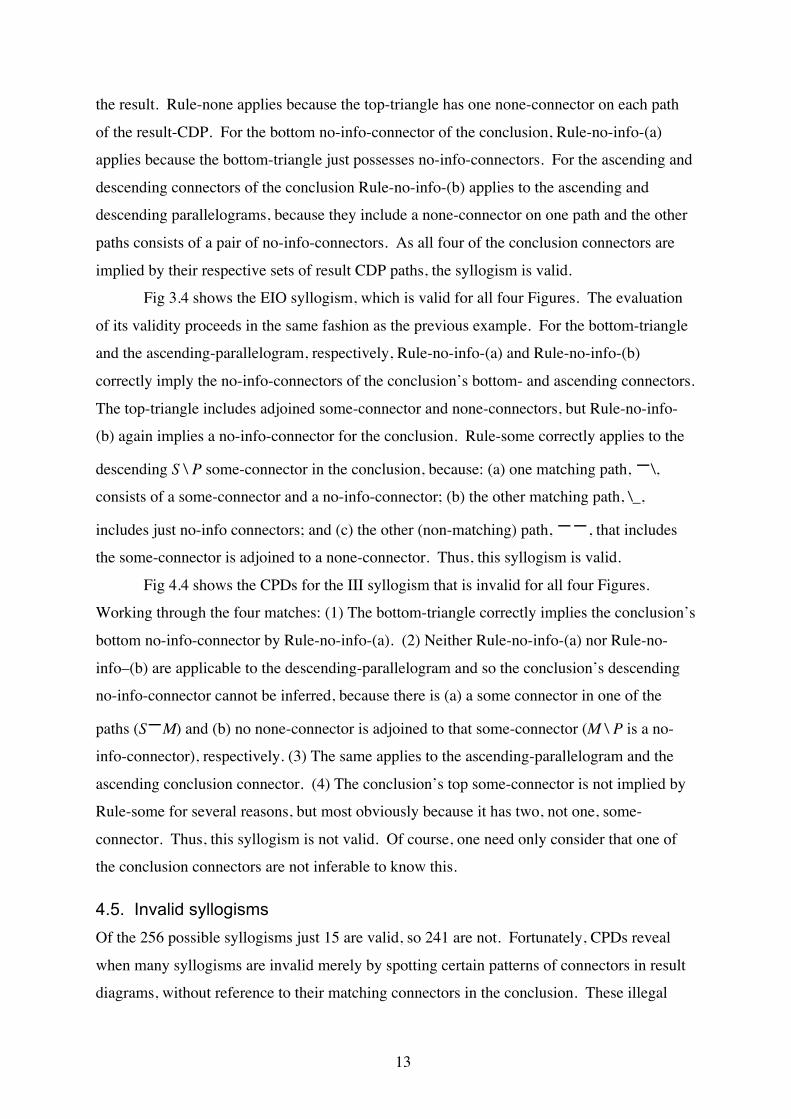
Fig 3.4 shows the EIO syllogism, which is valid for all four Figures. The evaluation
of its validity proceeds in the same fashion as the previous example. For the bottom-triangle
and the ascending-parallelogram, respectively, Rule-no-info-(a) and Rule-no-info-(b)
correctly imply the no-info-connectors of the conclusion’s bottom- and ascending connectors.
The top-triangle includes adjoined some-connector and none-connectors, but Rule-no-info-
(b) again implies a no-info-connector for the conclusion. Rule-some correctly applies to the
descending S \ P some-connector in the conclusion, because: (a) one matching path, —\,
consists of a some-connector and a no-info-connector; (b) the other matching path, \_,
includes just no-info connectors; and (c) the other (non-matching) path, ——, that includes
the some-connector is adjoined to a none-connector. Thus, this syllogism is valid.
Fig 4.4 shows the CPDs for the III syllogism that is invalid for all four Figures.
Working through the four matches: (1) The bottom-triangle correctly implies the conclusion’s
bottom no-info-connector by Rule-no-info-(a). (2) Neither Rule-no-info-(a) nor Rule-no-
info–(b) are applicable to the descending-parallelogram and so the conclusion’s descending
no-info-connector cannot be inferred, because there is (a) a some connector in one of the
paths (S—M) and (b) no none-connector is adjoined to that some-connector (M \ P is a no-
info-connector), respectively. (3) The same applies to the ascending-parallelogram and the
ascending conclusion connector. (4) The conclusion’s top some-connector is not implied by
Rule-some for several reasons, but most obviously because it has two, not one, some-
connector. Thus, this syllogism is not valid. Of course, one need only consider that one of
the conclusion connectors are not inferable to know this.
4.5. Invalid syllogisms Of the 256 possible syllogisms just 15 are valid, so 241 are not. Fortunately, CPDs reveal
when many syllogisms are invalid merely by spotting certain patterns of connectors in result
diagrams, without reference to their matching connectors in the conclusion. These illegal

14
patterns are shown as Fig 6.5-8, where the top triangle pattern has been chosen for the sake of
illustration: the examples hold for all the other patterns in a similar fashion. Like the rules,
these illegal configurations are applicable in general, so the order of the paths may be
reversed and the pattern of connectors reflected. These patterns are interesting, because they
reveal reasons why different classes of syllogism are invalid, which contributes to our deeper
understanding of the inherent logical constraints of syllogisms. In all cases these patterns are
illegal because more than one connector types could be derived.
The illegal pattern in Fig 6.5 has two adjoined some-connectors. A result CPD
containing this pattern could yield either a some-connector or a no-info-connector, because
we do not know whether the subsets S∩M and M∩P have elements in common or not; i.e., if
S∩M∩P has any members or not. In Fig 6.6 there are two some connectors on different
paths. From the S—M some-connector there might or might not be elements that are M and
also P, because of the adjoined no-info-connector. The same is true about ¬M and S with the
M / P some-connector in the other path. Thus, there is more than one possible result. In the
illegal pattern Fig 6.7 a some-connector and a none-connector appear on opposite sides of the
CPD pattern. The reasoning just given applies to the some-connector and further the none-
connector gives no relevant information to determine whether any of the elements are shared
in S∩M∩P, because knowing that ‘¬M are P’ is empty is independent of whether any
members of M∩P exists (‘All M are P’ includes the case that there are no elements in M∩P).
Again, this explains why the some- and none-connectors must be adjoined in the Rule-some.
Fig 6.8 complements the Rule-some: without knowing for sure that all M are P (by the none
connector in the Rule-some), it could equally be the case that members of S∩M are, or are
not, also members of P.
On drawing the result CPD, if any of configurations in Fig 6.5-8 are seen, then it is
known that the syllogism is invalid, without further ado.
4.5. Sound and complete The three inference rules are sufficient to determine the validity of all syllogisms. They have
been programmed into a spreadsheet and applied to all 256 syllogisms. Only the known valid
syllogisms were found to be valid and all others are found to be invalid; thus the inference
procedure is both sound and complete.
The speadsheet was also used to analyse the effect of applying the four illegal patterns
(Fig 6.5-8) to result CPDs. Of the 239 invalid syllogisms, 112 (≈47%) were found

15
(specifically in 32, 32, 16 and 32 cases, one or more of the illegal patterns were applicable to
the Figure 1 to Figure 4 syllogisms, respectively).
Further, it is apparent from the analysis that in all invalid syllogisms the rules
applicable to some- or none-connectors in the conclusion is always violated, therefore it is
best to select either Rule-some or Rule-none as the first to apply, before Rule-no-info which
may hold in particular matches in otherwise invalid syllogisms.
5. Multi-premise syllogisms
5.1. Sentential Notation The inference Sy2 in section 2 is an example of a multi-premise syllogism, specifically a
sorite, in which the predicate of each proposition is the subject of the next. One way to
evaluate the validity of a sorite is to check that the first two propositions constitute a valid
standard syllogism and then to take its result (in the above terminology) as a new proposition
together with the third proposition. If this syllogism is valid, and there are more propositions,
its result is propagated on to the next proposition, and so forth, until the whole sequence of
propositions is exhausted. If the final result matches the conclusion then the overall sorite is
valid.
Extending classical syllogisms in verbal form to sorites trivially requires the addition
of further premises chained together with successive propositions sharing a common term;
such as the ‘diagrams’ of the first two premises of Sy2. To evaluate a sorite verbally by
incremental propagation of successive results requires the application of the fives rules
concerning how the quality and quantity of the premises relates to certain types of
conclusion, as given in section 2 above. Alternately, there are four rules for sorites, akin to
these five rules for standard syllogisms, that address what number and types of proposition
may occur for conclusions of certain quality and quantity properties:
Sor1. If a conclusion is negative, then one and only one of the premises must be
negative.
Sor2. If the conclusion is affirmative, all of the propositions must be affirmative.
Sor3. If the conclusion is universal, all of the premises must be universal.
Sor4. A particular conclusion calls for not more than one particular premise.
Note that the notion of distribution used in quality rules for standard syllogisms is no
longer invoked in these sorite rules. Although these rules are presented in various texts on

16
syllogistic logic, the author is yet to find a source that includes a simple compelling
explanation of why they hold.
5.2. Euler and Linear Diagrams Euler and Linear diagrams can readily represent sorites consisting only of a series of
universal affirmative (A) propositions, because their use of spatial-overlap admits just one
interpretation as each circle or line segment is successively introduced in a simple nested
fashion. For example, in Fig 1.2.A, imagine a circle for a new S term within the circle for R,
and so forth. However, Fig 3 and 4 show how multiple versions of the result diagrams had to
be drawn for 2 premise syllogisms, so propagating result diagrams through the series of
propositions in sorites may proliferate the number of diagrams with each successive step. It
should also be noted Lemon & Pratt [15] showed that logically consistent Linear diagrams
cannot be drawn in certain cases with larger numbers of sets, although these are not
straightforward syllogistic situations.
5.3. Venn Diagrams To model sorites with N premises in Venn diagrams one must construct a diagram with N
closed curves that shows all of the 2N zones required for all of the distinct subsets. Venn
drew diagrams with four sets using ellipses in a format with one degree of reflective
symmetry [22]. Venn diagrams for five sets may be drawn using ellipses with rotational
symmetry but not reflective symmetry. Six or more sets require convex curves but schemes
for their systematic construction exists, e.g. [7]. To evaluate a sorite the shading and x
placement rules used for standard syllogisms are again applied. To illustrate the complexity
of constructing and interpreting sorites with Venn diagrams, Fig 7 shows a five set diagram
drawn using the approach in [7], where R is the central circle, S is the dumbbell, and T the
cross. The hatching corresponds to the sorite: All P are Q (downward sloping), No Q are R
(upward sloping), All R are T (horizontal), All S are T (vertical) ⇒ No P are S. With the
larger number of contours applying the rules becomes substantially more difficult for various
reasons. First, the proliferation of overlapping regions requires greater cognitive effort to
ensure the shading and x placement are done correctly, simply because the greater number of
elements more heavily loads both the perceptual and working memory components of our
cognitive system. For instance, one might think that simply shading rather than hatching the
empty sets in Fig 7 would be a good strategy, but this makes difficult double-checking that
the correct regions have been correctly filled for particular premises. (Double-checking is

17
necessary as human error is more likely when cognitive load is high). Second, regions for the
same subset may not be contiguous; for example, the zones that constitute region R∩¬T
(horizontal hatching) in Fig 7 are not adjacent. This is true even in the Venn diagrams for
just four sets. Third, having zones delimited by concave as well as convex curves makes
finding sets, or interpreting set relations encoded by zones, more difficult than with Venn
diagrams consisting uniformly of ellipses. Although, finding the zone in Fig 7 for
P∩Q∩¬R∩T∩S that makes the inference invalid is not too hard (it should be shaded but is
not), in general such inferences could more difficult if we do not have the good foresight to
initially label the contours so that critical zones fall in the least convoluted par0st of the
diagram.
———— Fig 7 about here ————
5.4. CPD Fig 8.1-8.4 shows examples of CPDs for sorites with three propositions. As before, the result
diagram is simply a linear concatenation of the binary CPD for each premise, with the shared
terms connecting successive diagrams. The adjoined premises are to the left in each figure
and the conclusion is to the right. Valid sorites are shown for the four standard binary
relations as the conclusions.
To evaluate the validity of a sorite requires two straightforward generalizations of the
method for standard syllogisms. For two premise syllogism we considered the two paths
running between the matching nodes of the predicate and subject terms in the result diagram.
For a sorite we similarly consider all paths among the terms between the fixed ends of the
matching start and end terms in a result diagram. In Fig 8.1-8.4 the start and end nodes of
these paths, which are matched to some- or none-connectors in the conclusions, are indicated
by i and ii labels. For example, the conclusion’s top none-connector of Fig 8.1 has paths in
the result CPD beginning at P (i) and ending at S (ii), so the four the paths are:
‘– – –’, ‘\ / –’, ‘\ _ /’, ‘– \ /’.
In the way that paths between a particular assignments of P and S are considered for both
values M and ¬M in syllogisms, in sorites all the paths between a particular assignment of P
and S are considered for all combinations of values of middle terms; i.e., in Fig 8.1, these are
Q∩R, ¬Q∩R, ¬Q∩¬R and Q∩¬R.
The second generalization is to the CPD inference rules given above.
18
Rule-none’. For a none-connector in the conclusion-CPD, each matching path in the
result-CPD must have at least one none-connector and otherwise include only no-
info-connectors.
Rule-some’. For a some-connector in the conclusion: (1) one matching path in the result
CPD must consist of a some-connector and otherwise no-info-connectors; (2) the
other matching paths must consist only of no-info-connectors; (3) all the other
non-matching paths that run through the some-connector must include at least one
none-connector.
Rule-no-info’. For a no-info-connector in the conclusion either (a) all the matching paths
must consist only of no-info-connectors or (b) at least one path consists of just no-
info-connectors and the other paths must include a none-connector (along with
any other type of connector).
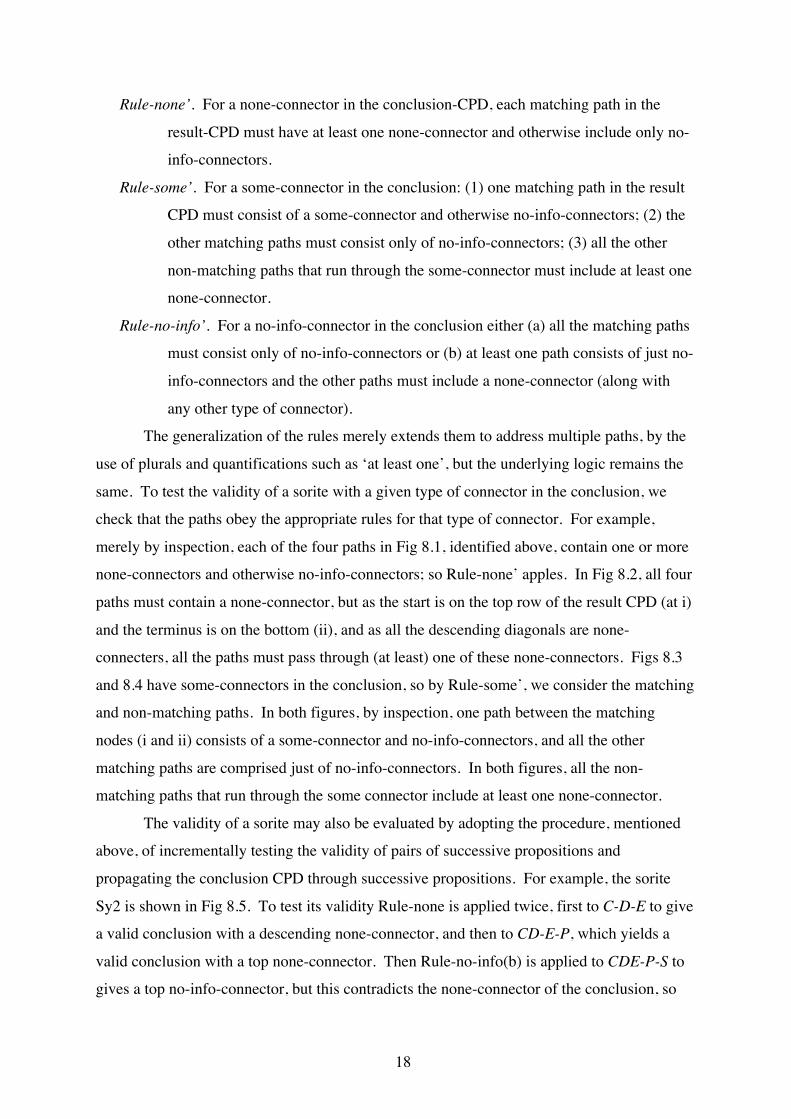
The generalization of the rules merely extends them to address multiple paths, by the
use of plurals and quantifications such as ‘at least one’, but the underlying logic remains the
same. To test the validity of a sorite with a given type of connector in the conclusion, we
check that the paths obey the appropriate rules for that type of connector. For example,
merely by inspection, each of the four paths in Fig 8.1, identified above, contain one or more
none-connectors and otherwise no-info-connectors; so Rule-none’ apples. In Fig 8.2, all four
paths must contain a none-connector, but as the start is on the top row of the result CPD (at i)
and the terminus is on the bottom (ii), and as all the descending diagonals are none-
connecters, all the paths must pass through (at least) one of these none-connectors. Figs 8.3
and 8.4 have some-connectors in the conclusion, so by Rule-some’, we consider the matching
and non-matching paths. In both figures, by inspection, one path between the matching
nodes (i and ii) consists of a some-connector and no-info-connectors, and all the other
matching paths are comprised just of no-info-connectors. In both figures, all the non-
matching paths that run through the some connector include at least one none-connector.
The validity of a sorite may also be evaluated by adopting the procedure, mentioned
above, of incrementally testing the validity of pairs of successive propositions and
propagating the conclusion CPD through successive propositions. For example, the sorite
Sy2 is shown in Fig 8.5. To test its validity Rule-none is applied twice, first to C-D-E to give
a valid conclusion with a descending none-connector, and then to CD-E-P, which yields a
valid conclusion with a top none-connector. Then Rule-no-info(b) is applied to CDE-P-S to
gives a top no-info-connector, but this contradicts the none-connector of the conclusion, so

19
Sy2 is invalid. Further, with CPDs this process need not begin with the first and second
premises but may be applied to any adjacent pair of binary CPDs. However, on first seeing
Fig 8.5, the sorite may be immediately judged as invalid, because Rule-none cannot be
applied because a some-connector occurs on some of the matching paths.
That completes the presentation of how each of the five notations may be used to
model sorites, and like the standard syllogisms, differences have been observed among the
notations, which provide our basis for examining the impact that different representational
schemes have on the semantic transparency of the notations.
6. Discussion The main purpose of this section is to compare the five notational systems in terms of their
relative semantic transparencies.
6.1 REEP design of CPDs As Categorical Pattern Diagrams have been introduced as a new representational system, let
us consider initially how they were originally created before making comparisons among all
the notations. The creation of CPDs was guided by the design principles of the
Representational Epistemic approach ([1]-[3], [5]), which in short aim to give semantic
transparency by suggesting that one: (a) identifies the inherent conceptual structure of the
target topic – the groups of concepts (laws, invariants and properties) that permeate the whole
topic; (b) devise distinct representational schemes to encode each set of concepts in a manner
that makes the group of concepts transparent and that distinguishes variants of the concepts
within the group; (c) combine the representational schemes into an overarching framework
that establishes connections among the schemes that mirrors the overarching relations that
exist among the groups of concepts. So, in the design of CPDs, the key insights were:
(a) Recognizing three core groups of concepts: (i) set membership status; (ii) orders of
terms within premises and orders of premises within syllogisms; (iii) relations between
sets.
(b) Representing those groups of concepts using distinct representational schemes: (i)
spatial location (high and low nodes); (ii) horizontal orientation and linear
concatenation of binary CPDs; (iii) the styles of connectors (some-, none-, no-info-
connectors).
(c) Integrating these formats within an overarching interpretive framework that reflects the
relations among these groups of concepts: (i & ii) the hierarchical structure of subsets

20
embedded within relations among premises is encoded by joining binary CPDs and
interpreting paths between the first and last terms as subsets; (i & iii) the positioning of
line segments and the allocation of styles to those line segments encodes the assignment
of membership status to relations among subsets.
The relative simplicity of the design of CPDs is due to the systematic matching of concepts to
representational schemes at multiple levels. It is contended that the apparent benefits of
CPDs arise from the semantic transparency achieved by encoding the knowledge of the
domain in the coherent representational system.
6.2 Encoding core concepts In previous REEP studies cognitive task analyses and empirical studies have been used to
compare novel representational systems with conventional notations, e,g., [1] and [2].
Although those methods are particularly rigorous and objective forms of investigation, they
are beyond the scope of this paper. Rather, the comparisons here will focus upon individual
core concepts in the hope that treating each concept in relative isolation will reduce the
opportunity for subjectivity to arise. Nevertheless, for a fair basis of comparison it is
important that the reader assumes that the users’ of notations have equal experience in them
all: in other words one should attempt, as far as it is feasible, not to allow personal expertise
in particular notations be a source of bias.
There are, of course, many ways in which the notion of efficacy may be interpreted,
but here it will be taken to mean how readily accessible concepts are from expressions of the
notations. To do this we may rely upon the well-established finding in cognitive science that
accessing a piece of information by a perceptual inference is often less demanding than
executing a sequence for mental inferences to arrive at the same information (e.g., [13], [23]).
It is already well known that verbal forms of syllogisms are difficult and humans may
translate verbal propositions into internal diagram-like mental representations [12]. Thus, the
five notations will be compared in terms of whether there are specific configurations of
graphical elements that directly encode particular core concepts and so enable the use of
perceptual inferences to readily access those concepts.
Representation of sets. All the notations have explicit representations for the given
sets: in the case of Euler and Venn Diagrams this is in the form of labelled circles; in Linear
diagrams it is labelled line segments; and, verbal proposition and CPDs have standalone
words or letters. One benefit of diagrammatic notations over sentential notations is that
locational indexing may be used to avoid the need to match symbols across parts of an

21
expression [13]. Venn diagrams and CPDs have this characteristic, because their result
diagrams always have just one token for each given set. As the verbal propositions always
includes multiple tokens for the same term, and as Euler and Linear diagrams sometimes
have duplicates of tokens (e.g., Fig 3.1.Res, Fig 3.2.Res), this means they are to varying
degrees at a disadvantage in term of the ease of access to information about sets.
Relations among sets or subsets. It necessary to reason about subsets when thinking
about syllogisms, for example when justifying inference rules. Obviously, in the verbal
notation, subsets may simply be written as required, either in words or as formulas, e.g.,
‘¬R∩T’. However, verbal premises do not explicitly identify the target subset(s) about which
information is definitely known. For instance, ‘All R are T’ refers to R and T but it is
necessary to infer that the critical subset here is ‘¬R∩T’. Similarly, premise diagrams in
Euler and Linear notations (Fig 1.2 & 1.4) do not explicitly identify such target subsets. The
proliferation of multiple result diagrams for some syllogisms (e.g., Figs 3 and 4, lines 1 and
4) may be viewed as a consequence of this: it is necessary to draw them in order (explicitly)
to cover all of the alternative relevant subsets. In contrast, all the subsets are present in a
Venn diagram, by definition, with the pattern of three interesting circles for standard
syllogisms providing a memorable, and easy to draw, framework for the shading and cross
placement rules. However, the ready access to specific subsets is more problematic for larger
numbers of given sets. As noted above, Venn diagrams for more than three sets are more
difficult to draw and identifying specific zones is not a simple perceptual operation. Paths
represent subsets in CPDs and may be identified perceptually in a result diagram for a small
number of given sets. Further, for CPDs with many sets it may be easier to identify target
paths than to find an equivalent zone in a Venn diagram, for at least three reasons. First, the
overall linear structure of a CPD result diagram is invariant with the number of sets, but as
the graphical structure of Venn diagrams varies an additional cognitive load is imposed by
the need to re-orientate oneself with respect to each Venn diagram, unless one chooses to
adopt a standard construction (as in [7]), but at the disadvantage of abandoning the familiar
canonical patterns for three and four sets. Second, the visual complexity of CPDs increases
linearly with the number of premises, whereas the visual complexity of Venn diagrams not
only increases more rapidly but it also involves some loss of useful symmetries. Finally, the
position of the ends of a connector, at a high or low node, immediately gives the subset’s
relation to that given set; whereas to establish the same information for a zone in a Venn
diagram requires tracing out the whole closed curve for the given set in order to judge
22
whether the zone is within it or not, which may be complicated by any local convexities of
the curve.
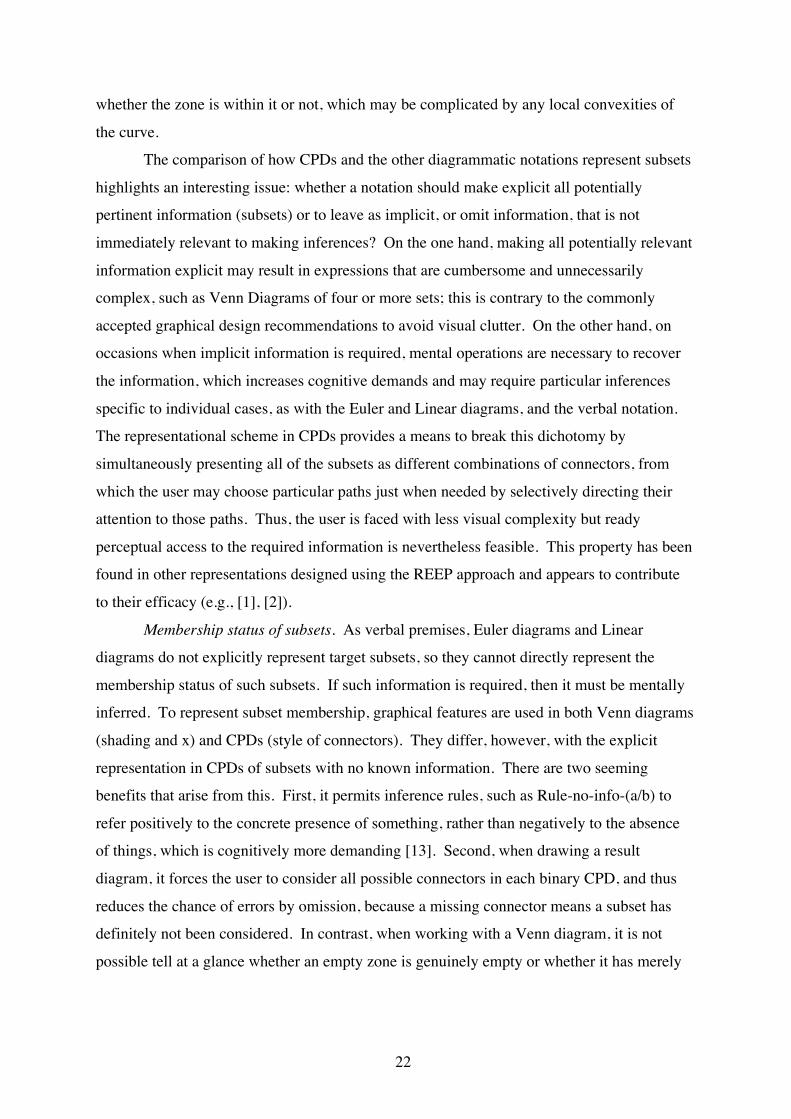
The comparison of how CPDs and the other diagrammatic notations represent subsets
highlights an interesting issue: whether a notation should make explicit all potentially
pertinent information (subsets) or to leave as implicit, or omit information, that is not
immediately relevant to making inferences? On the one hand, making all potentially relevant
information explicit may result in expressions that are cumbersome and unnecessarily
complex, such as Venn Diagrams of four or more sets; this is contrary to the commonly
accepted graphical design recommendations to avoid visual clutter. On the other hand, on
occasions when implicit information is required, mental operations are necessary to recover
the information, which increases cognitive demands and may require particular inferences
specific to individual cases, as with the Euler and Linear diagrams, and the verbal notation.
The representational scheme in CPDs provides a means to break this dichotomy by
simultaneously presenting all of the subsets as different combinations of connectors, from
which the user may choose particular paths just when needed by selectively directing their
attention to those paths. Thus, the user is faced with less visual complexity but ready
perceptual access to the required information is nevertheless feasible. This property has been
found in other representations designed using the REEP approach and appears to contribute
to their efficacy (e.g., [1], [2]).
Membership status of subsets. As verbal premises, Euler diagrams and Linear
diagrams do not explicitly represent target subsets, so they cannot directly represent the
membership status of such subsets. If such information is required, then it must be mentally
inferred. To represent subset membership, graphical features are used in both Venn diagrams
(shading and x) and CPDs (style of connectors). They differ, however, with the explicit
representation in CPDs of subsets with no known information. There are two seeming
benefits that arise from this. First, it permits inference rules, such as Rule-no-info-(a/b) to
refer positively to the concrete presence of something, rather than negatively to the absence
of things, which is cognitively more demanding [13]. Second, when drawing a result
diagram, it forces the user to consider all possible connectors in each binary CPD, and thus
reduces the chance of errors by omission, because a missing connector means a subset has
definitely not been considered. In contrast, when working with a Venn diagram, it is not
possible tell at a glance whether an empty zone is genuinely empty or whether it has merely

23
been neglected, which is a particular problem for complex Venn diagrams with disjoint
regions (see Fig 7, above).
Quality and quantity of propositions. Specific vocabulary clearly indicates the quality
and quantity properties of the verbal propositions. However, the other notations have
particular issues of their own (Fig 1). Euler and Linear diagrams are superior in their more
intuitive representation of the propositions than Venn diagrams and CPDs, because the latter
pair use empty subsets or existing members to, respectively, encode the positive A type
propositions and the negative O propositions (compare Figs 1.2.A/O and 1.4.A/O with Figs
1.3.A/O and 1.5.A/O). However, the graphical structure of Euler diagrams is potentially
misleading in its representation of I and O propositions, even though the diagrams appear
naturally to encode the verbal statements. I propositions are logically symmetrical (the order
of the terms may be reversed) but its Euler diagram is asymmetric (Fig 1.2.I), and the O
proposition is not symmetric but the Euler diagram is symmetric (Fig 1.2.O). Linear
diagrams, Venn diagrams and CPDs are better, because their visual form more accurately
encodes the underlying symmetry, or not, of the propositions. All four diagrammatic
notations appear equivalent in their consistent use of representational schemes for the
quantity property.
Fundamental relations of, and among, premises. Syllogisms and sorites constitute a
knowledge domain with substantial conceptual constraints, by definition. The four
conventional notations do not fully exploit these constraints, but the design of CPDs
specifically attempts to encode them, as suggested by the principles of the REEP design. One
concerns the role of the middle term in syllogisms, which is special because it occurs in both
premises and acts as conceptual fulcrum. It is always drawn in the middle in a CPD result
diagram for syllogisms and thereby allows the natural symmetries in the structure of
individual result diagrams, and between different result diagrams, to be manifest as
symmetrical configurations amenable to being recognised perceptually. Further, the
configurations of paths in the inference rules deliberately address alternative values of the
middle term. Similarly, CPD result diagrams for sorites are also arranged with the predicate
and subject terms to the far left and far right of the result CPD. The drawings of Venn
diagrams in Figs 2-4 also place the middle term in the centre, so this notation shares this
particular benefit with respect to standard syllogisms, but it disappears with sorites because
of the lack of reflective symmetry in Venn diagram for more than four sets. The middle term
is used as a co-referent in the composition of result diagrams in the Euler and Linear systems,

24
but its central role is not as obvious. Another source of structural constraints that CPDs most
fully exploit is the fact that each proposition has just a single subset about which definitive
information is known. This fact is made apparent by the shading or placement of the x in just
one subset in binary Venn diagrams, Fig 1.3. It is encoded in CPDs by the occurrence of just
one none- or one some-connector in each binary CPD. Yet a further constraint is that no
information is provided about the conjunction of the non-membership of both sets (e.g.,
¬R∩¬T), which CPDs encode by always having a no-info-connector on the bottom. In Venn
diagrams the zone outside all of the curves is empty.
The thoroughgoing exploitation of these three constraints together in CPDs has four
major consequences. First, it provides an invariant underlying graphical structure to all
CPDs, so that the spatial location of graphical objects is always associated with a particular
meaning, which facilitates perceptual access. Second, in turn, this means the inference
procedure does not vary with the particular type of syllogism being considered, in contrast to
the other diagrammatic notations; in Fig 2 to Fig 4, compare the variability of the diagrams
for Euler, Linear and Venn diagrams against the CPDs. Third, the fixed arrangement of
connectors provides a common and consistent basis for examining whether configurations of
paths satisfy the conditions of the rules. Fourth, the constraints define a small number of
rules and allow illegal patterns (Fig. 6.5-8) to fully cover all possible patterns of connectors
in CPD result diagrams. Further, ill-formed CPD result diagrams are readily spotted, because
each premise CPD must contain exactly one some- or none-connector, but not at the bottom.
In summary, for most of the core concepts individually, CPDs appear to provide
perceptual encodings that are as effective as any of the other notations, but more importantly
it does so for the majority of these concepts. In the next subsection we consider how these
encodings impacts different forms of semantic transparency.
6.3. Semantic transparency As noted in the introduction, the REEP approach claims that an effective notation will have
various forms of sematic transparency; three of which are the ability: (a) to integrate concepts
at different levels of abstraction in the knowledge domain; (b) to integrate concepts across the
different perspectives, or ontologies, that may be used to describe the domain; (c) to integrate
concepts at different scales of granularity within the domain. By integration we mean that
the different concepts in each ability can effectively support each other’s interpretation by
providing mutual contexts for comprehension. Building upon the comparisons of how the

25
notations encode the core concepts, these three aspects of semantic transparency will be
considered in turn.
6.3.1. Levels of abstraction
Levels of abstraction in this domain include, at the specific, concrete, end of the spectrum
particular examples of syllogisms and at the other abstract end there are general concepts that
speak of relations among classes of propositions or syllogisms. The verbal notation does not
integrate these levels of abstraction well, because there is little to connect specific syllogisms
and higher order terms, other than by making a series of verbal mental inferences. Thus,
there is a conceptual gulf between ideas in the verbal quantity and quality validity rules and
the details of specific examples of syllogisms. For example, the mere reading of a syllogism
does not tell us whether a particular term is distributed. Venn diagrams go someway to
integrating the level of abstraction by providing the uniform framework of subsets upon
which to apply the shading and x placement rules. The three intersecting circles provide a
basis to understand ideas such as why the shading operation has priority over the placement
of an x: an empty region implies that all its contained zones are empty, so no x may be drawn
in any of those zones. However, as noted above, this neat visual framework disappears with
sorites. Euler and Linear diagrams fall somewhere between Venn diagrams and verbal
propositions with to respect their integration of levels of abstraction, because they provide
some common graphical structures on which to hang certain concepts. However, as their
diagrams omit all but the given relation information, any extra conceptual content that could
be useful to span the levels of abstraction is absent, so must be filled in by mental inferences.
CPDs may integrate levels of abstraction well, because the structure of CPDs attempts
to directly encode the inherent conceptual structure of the domain, as described above, and
because the configurations in the definition of inference rules map directly to patterns in the
result diagrams. These configurations and patterns constitute a bridge between the levels.
Thus, for example, when reasoning about why an inference rule for syllogisms may be
generalised to sorites, in section 5.4, just a simple switch of attention is needed to move
between examining the shape and content of paths in the rules and the concrete details of the
constituent premises within a result CPD.
6.3.2. Granularity scales
Levels of granularity of concepts in this domain range from values of terms, to terms
themselves, propositions relating pairs of terms, sets of premises, standard syllogisms, and on
26
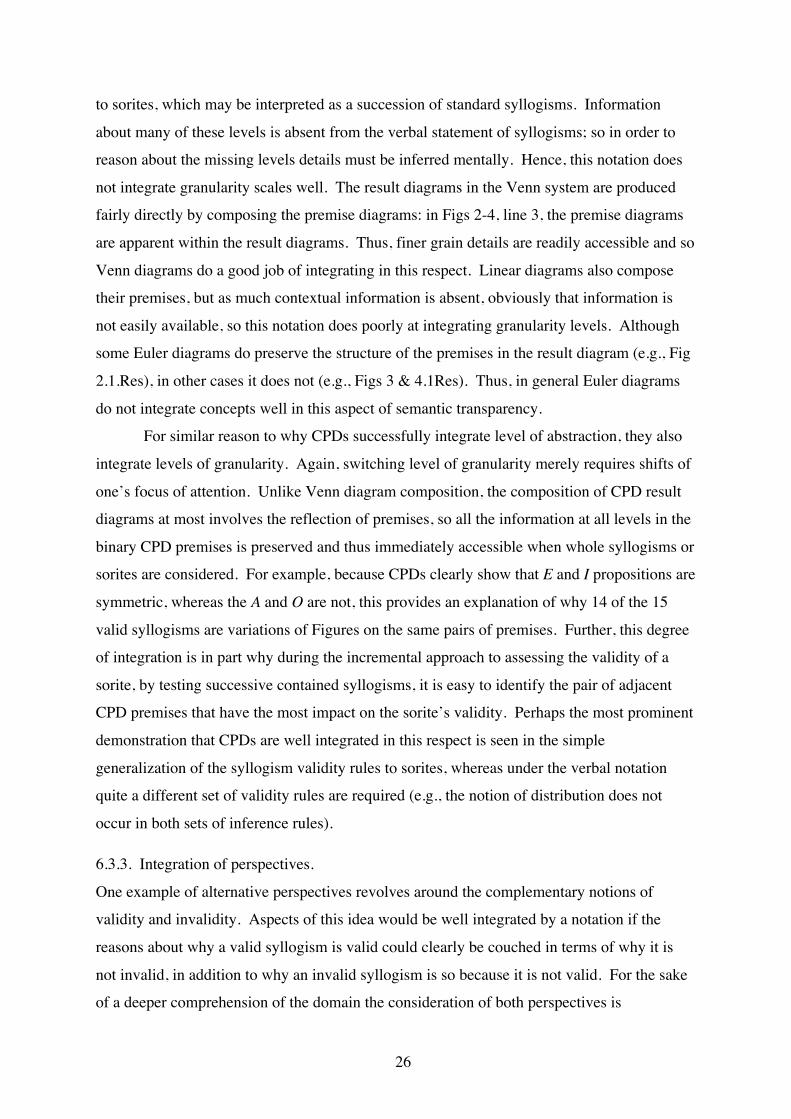
to sorites, which may be interpreted as a succession of standard syllogisms. Information
about many of these levels is absent from the verbal statement of syllogisms; so in order to
reason about the missing levels details must be inferred mentally. Hence, this notation does
not integrate granularity scales well. The result diagrams in the Venn system are produced
fairly directly by composing the premise diagrams: in Figs 2-4, line 3, the premise diagrams
are apparent within the result diagrams. Thus, finer grain details are readily accessible and so
Venn diagrams do a good job of integrating in this respect. Linear diagrams also compose
their premises, but as much contextual information is absent, obviously that information is
not easily available, so this notation does poorly at integrating granularity levels. Although
some Euler diagrams do preserve the structure of the premises in the result diagram (e.g., Fig
2.1.Res), in other cases it does not (e.g., Figs 3 & 4.1Res). Thus, in general Euler diagrams
do not integrate concepts well in this aspect of semantic transparency.
For similar reason to why CPDs successfully integrate level of abstraction, they also
integrate levels of granularity. Again, switching level of granularity merely requires shifts of
one’s focus of attention. Unlike Venn diagram composition, the composition of CPD result
diagrams at most involves the reflection of premises, so all the information at all levels in the
binary CPD premises is preserved and thus immediately accessible when whole syllogisms or
sorites are considered. For example, because CPDs clearly show that E and I propositions are
symmetric, whereas the A and O are not, this provides an explanation of why 14 of the 15
valid syllogisms are variations of Figures on the same pairs of premises. Further, this degree
of integration is in part why during the incremental approach to assessing the validity of a
sorite, by testing successive contained syllogisms, it is easy to identify the pair of adjacent
CPD premises that have the most impact on the sorite’s validity. Perhaps the most prominent
demonstration that CPDs are well integrated in this respect is seen in the simple
generalization of the syllogism validity rules to sorites, whereas under the verbal notation
quite a different set of validity rules are required (e.g., the notion of distribution does not
occur in both sets of inference rules).
6.3.3. Integration of perspectives.
One example of alternative perspectives revolves around the complementary notions of
validity and invalidity. Aspects of this idea would be well integrated by a notation if the
reasons about why a valid syllogism is valid could clearly be couched in terms of why it is
not invalid, in addition to why an invalid syllogism is so because it is not valid. For the sake
of a deeper comprehension of the domain the consideration of both perspectives is

27
worthwhile. For example, as just 15 of the 256 syllogisms are valid, showing that valid
inference rules do not apply does not directly increase our understanding of the general
nature of syllogisms. Although it should be feasible to present the alternative perspective,
typical presentations of validity rules in the conventional notations adopt the invalid is not-
valid perspective. The inclusion of the set of illegal patterns, Fig 6.5-8, is a natural
complement to the valid rules of inference, which allows CPDs to be used in the direct
examination of why many of syllogisms are invalid, for reason other than to failure of rules
that test for validity.
6.3.4. Summary, scope and limitations
The conventional notations do in some respects have some of the desirable aspects of
semantic transparency, but it is only the CPD system that largely satisfies them all. As a final
indication of the greater semantic transparency of CPDs, they provide a means to illustrate
the verbal rules for testing the validity of sorites stated above, Sor1-Sor4. Together Fig 8.1
and 8.3 encompass Sor1: if a conclusion is negative, then one and only one of the premises
must be negative (i.e, there is one E premise in Fig 8.1 and one O premise in Fig 8.2). Fig
8.2 and 8.4 encompass Sor 2: if the conclusion is affirmative, all of the propositions must be
affirmative (i.e., both Figs 8.1 and 8.2 contain just A or I premises). Fig 8.1 and 8.2
encompass Sor 3: if the conclusion is universal, all of the premises must be universal (i.e, all
premises are A or I). Fig 8.3 and 8.4 encompass Sor4: a particular conclusion calls for not
more than one particular premise (i.e, there is just one O or one I premise). Under the CPD
approach, Fig 8 neatly reveals how the four verbal rules interact in rows and columns of the
figures to yield valid sorites for the four types of conclusions. If the verbal rules are broken,
one can quickly see why in terms of broken CPD rules.
It should be noted that the scope of these claims are limited in two major respects.
First, the comparisons pertain to the particular representational schemes in the original
systems of Euler [9], Venn [22] and Linear diagrams [8]. The claims will need to be re-
evaluated when considering more recent variants of former two (e.g., [17]), because many of
these have attempted to adapt or even combine representational features across the notations
in order to improve the utility of the basic notation. It is beyond the scope of this paper to
consider the full range of existing notations in which syllogism may be expressed, but it is
nevertheless interesting that substantial differences were found in the ability of the notations
to provide perceptual access to the full range of concepts needed for understanding the target

28
domain, and that these differences exist even between notations whose primary
representational schemes are based on degree of spatial containment.
Second, the claims about the relative efficacy of the notations are made only with
respect to reasoning and understanding classical syllogisms and sorites. All the notations
presented here can express propositions and support inferences beyond the limited set
required of this domain. Considering how other relations may be encoded in the systems are
beyond the scope of this paper, but nevertheless substantive differences were found among
the systems in this relatively meagre domain, from which one might draw two implications.
First, it is interesting that such variations in the support provided for perceptual access to the
concepts of the domain were found, even through the domain was seemingly relatively
impoverished, so major differences in semantic transparency may occur even in alternative
notations for topics that one might consider to be relatively simple conceptually. Second,
even though this topic is relatively straightforward in logic terms – it is after all an
introductory topic for many students – it does have conceptual depth and richness that is
challenging to comprehend. How this contributes to what has been learned about the
Representational Epistemic approach, more generally, is taken up in the next section.
6.4. Representational epistemic implications The comparison of the five notations has shown how their different representational schemes
impacts their efficacy of encoding the core concepts of the domain and also with respect to
three aspects of semantic transparency. In terms of the overall effectiveness of the encoding
of the knowledge of the domain of syllogisms and sorites, it appears that CPDs may have a
general advantage over the other conventional notations, because most of the core concepts
of the domain are encoded as relatively straightforward diagrammatic configurations that are
readily accessible through perceptual inferences. The sentential encoding of concepts in the
verbal notation means that many concepts require series of mental inferences to access. The
conventional diagrammatic notations fair better, but they do not provide perceptual access to
all core ideas as easily as CPDs.
As the development of the CPDs was guided by the REEP approach, it is apparent
that their overall efficacy at encoding domain concepts lends some further support to the
general claims of the REEP approach and to the utility of its design principles. In previous
studies of novel representations designed under the REEP approach it was found that
notations with semantic transparency were also effective in computational cognitive terms, or
easier to use (e.g., [1, 2, 5]). It is an empirical question as to whether CPDs will be the most

29
efficacious of the five notational systems for people to reason and to learn about syllogism
and sorites, but on the basis of the detailed comparison here of the nature of the various
codifications of the domain, it is predicted the CPDs should be particularly effective.
Nevertheless, it should be noted this conclusion is based on the comparison of CPDs with
particular variants of Venn and Euler diagrams. Other variants of these notations exist,
which may address the limitations of the original notational systems chosen for this study.
A particular point that should be made about the REEP analysis presented here is that
it attempts to take in to account the full richness of the network of concepts on multiple levels
that comprises the knowledge domain. Under the REEP approach, the question of what
constitutes an effective encoding of a domain goes beyond considerations of how the obvious
domain objects and their relations are represented by graphical elements and their relations.
Rather the question extends to higher order concepts, supplementary notations and the myriad
relations among them, and then considers how they may be encoded in multiple interrelated
representational schemes. A key insight of the REEP approach is that a knowledge domain
may involve fundamental conceptual structures that often remain implicit, because they so
thoroughly permeate all the ideas of a domain, but it is the elicitation of those hidden core
structures that can most effectively be used as critical sources of constraints in the design of a
notational system.
The comparison also shows that some interesting and even substantial differences
between notations can arise even though they are diagrammatic, and more strikingly, even
though they use the same overall means to encode domain information. The Venn, Euler and
Linear diagrams all use the degree of containment of graphical elements, or relations among
them, to represent the same domain, but their efficacy at encoding of the core concepts is
certainly varied. An intriguing open question is whether it is possible to apply the insight
from the design of CPDs to modify one of the conventional notations to give a superior
notation that better encodes the fundamental conceptual structures of the domain but that also
exploits their more intuitive use of space to represent sets. The wealth of recent variations on
the themes of Venn and Euler diagrams provides a potentially fruitful place to begin, e.g.
[17].

30
Acknowledgements My thanks go to all the members of the Representational Systems Lab in the CALPS
Research Group in the Department of Informatics at the University of Sussex. I am
particularly indebted to three anonymous reviewers whose invaluable comments on earlier
drafts of the paper have not only improved the quality of the presentation and found
(fortunately correctable) technical flaws, but also revealed a greater degree of semantic
transparency in CPDs than I had originally perceived.
References [1] P. C-H. Cheng, Electrifying diagrams for learning: principles for effective
representational systems. Cognitive Science, 26(6) (2002) 685-736.
[2] P. C-H. Cheng, Probably good diagrams for learning: Representational epistemic re-
codification of probability theory Topics in Cognitive Science 3(3) (2011) 475-498.
[3] P. C-H. Cheng, Algebra Diagrams: A HANDi Introduction. In B. Plimmer & P. Cox
(Eds.), Proceedings of the 7th International Conference on the Theory and
Application of Diagrams: Springer Verlag, Berlin, 2012, pp. 178-192.
[4] P. C-H. Cheng, Visualizing Syllogisms: Category Pattern Diagrams versus Venn
Diagrams, in: P. Chapman, L. Micallef (Eds.), Euler Diagrams 2012: Proc. 3rd
International Workshop on Euler Diagrams, CEUR-WS.org, online http://ceur-
ws.org/Vol-854/paper3.pdf.
[5] P. C-H. Cheng, R. Barone, Representing complex problems: A representational epistemic
approach, in: D. H. Jonassen (Ed.), Learning to solve complex scientific problems,
Mahwah, N.J.: Lawrence Erlbaum Associates, 2007, pp. 97-130.
[6] I. M. Copi, C. Cohen, Introduction to Logic. Prentice-Hall, Upper Saddle River NJ, 1998.
[7] A. W. F. Edwards, Cogwheels of the mind: the story of Venn Diagrams. Baltimore, MD:
John Hopkins University Press, 2004.
[8] G. Englebretsen, Linear diagrams for syllogisms (with relations). Notre Dame Journal of
Formal Logic 33 (1992) 37-69.
[9] L. Euler, Lettres a une princesse d'Allemagne sur divers sujets de physique et de
philosophie (1761). Charpentier, 1843.
[10] J. Glasgow, N. H. Narayanan, B. Chandrasekaran, (Eds.), Diagrammatic Reasoning:
Cognitive and Computational Perspectives, AAAI Press, Menlo Park, CA, 1995.
[11] E.M. Hammer, Logic and Visual Information, CSLI publications, Stanford, CA, 1995.
31
[12] P. N. Johnson-Laird, Mental Models. Cambridge University Press, Cambridge, 1983.
[13] J. H. Larkin, H. A. Simon, Why a diagram is (sometimes) worth ten thousand words.
Cognitive Science 11, (1987) 65-99.
[14] E. J. Lemmon, Beginning Logic, Van Nostrand Reinhold, Wokingham, UK, 1965.
[15] O. Lemon, I. Pratt, On the insufficiency of linear diagrams for syllogisms. Notre Dame
Journal of Formal Logic 39 (1999) 573-580.
[16] K. Marriott, B. Meyer, Visual Language Theory, Springer-Verlag, New York, 1998.
[17] G. Stapleton, A Survey of Reasoning Systems Based on Euler Diagrams, Electronic
Notes in Theoretical Computer Science 134(1) (2005) 127-151.
[18] N. A. Stillings et al., (Eds.), Cognitive Science: An Introduction, MIT press, Cambridge
MA, 2nd, 1995.
[19] A. Shimojima, Derivative meaning in graphical representations, in: IEEE Symposium on
Visual Languages, IEEE Computer Society, Los Alamitos CA, (1999) 212-219.
[20] S.-J. Shin, The Logical Status of Diagrams. Cambridge University Press, Cambridge,
1995.
[21] N. Swoboda, G. Allwein, Heterogeneous Reasoning with Euler/Venn Diagrams
Containing Named Constants and FOL, Electronic Notes in Theoretical Computer
Science 134, (2005) 153-187.
[22] J. Venn, Symbolic Logic, 2nd ed., Burt Franklin, New York, 1971.
[23] J. Zhang, The nature of external representations in problem solving, Cognitive Science
21, (1997), 179-217.
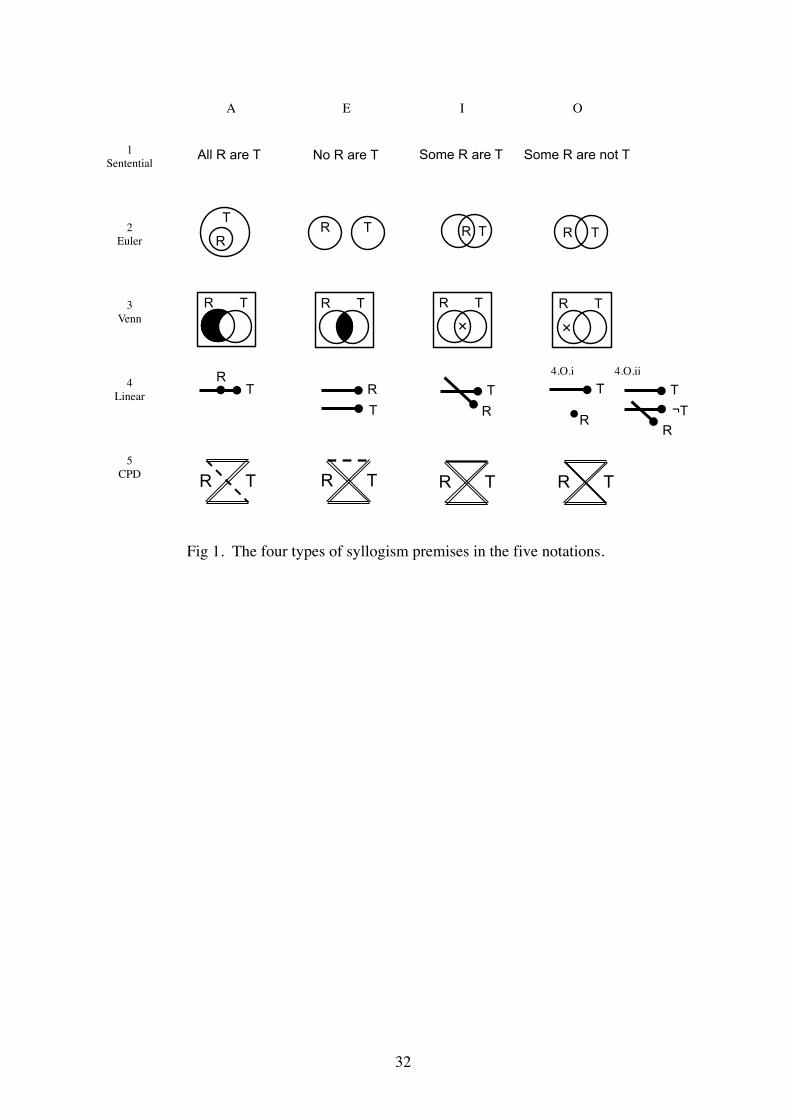
32
Fig 1. The four types of syllogism premises in the five notations.
R T R T R T R T
R T
!"R T
!"R T R T
T R
T R
R T
T ¬T
R •R
T
R
T R T R T R T
Some R are T All R are T No R are T Some R are not T
A! E! I! O!
1!Sentential !
2!Euler!
3!Venn!
4!Linear!
5!CPD!
4.O.i 4.O.ii!
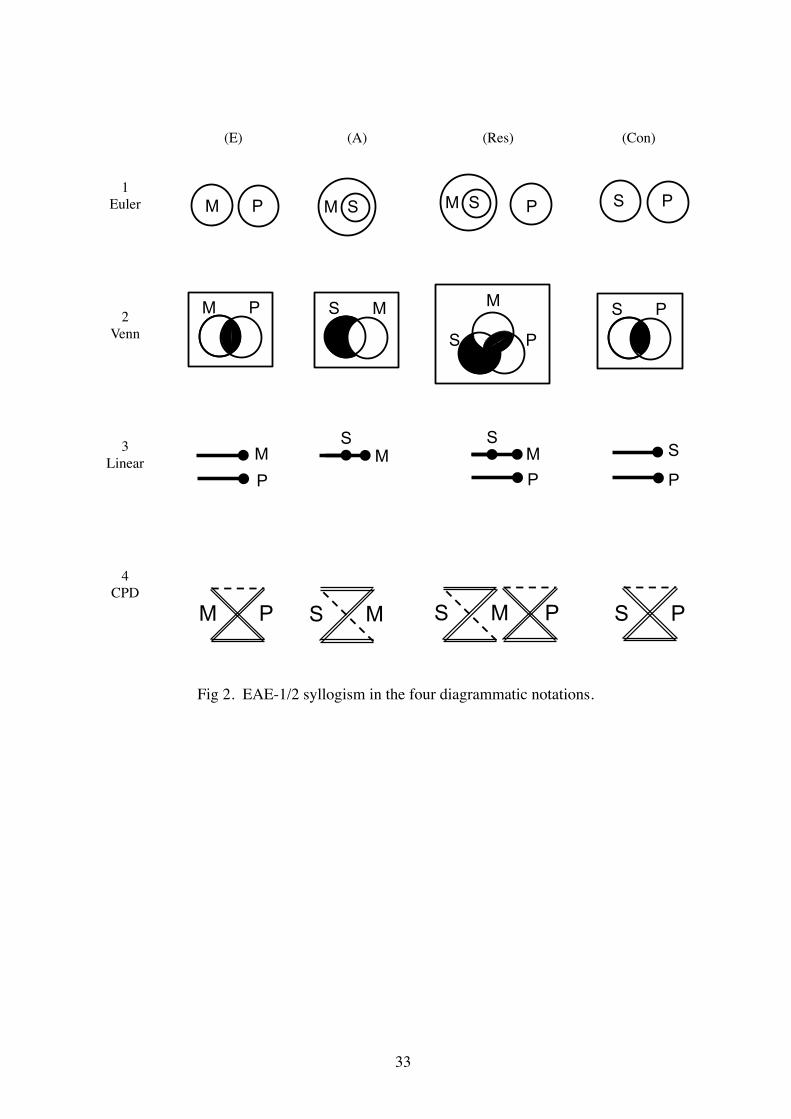
33
Fig 2. EAE-1/2 syllogism in the four diagrammatic notations.
S M M P S P
(E) (A) (Res) (Con)!
S M M P S P
SM M
P
M P S P M S
M
S P
M S P
P M
P
S
1!Euler!
2!Venn!
3!Linear!
4!CPD!
S
S M P

34
Fig 3. EIO-1/2/3/4 syllogism in the four diagrammatic notations.
M
S P S M
!"M P
!"S P
!"
S M M P S P
S M M
P
S M P
M P S P M S
P M S
P M S
P M S
S
P
(E) (I) (Res) (Con)!
1!Euler!
2!Venn!
3!Linear!
4!CPD!
S M P

35
Fig 4. III syllogism in the four diagrammatic notations.
M
S P S M
!"M P
!"S P
#"
M P S M
S M S
M P
S P M S
!" !"
M P P S M
S P M
S
M
P
M
P M
S
M P P S
M
P S
P S
M
P
S M
P S M
PS
S P
(I) (I) (Res) (Con)!
1!Euler!
2!Venn!
3!Linear!
4!CPD!
*! *!
S M P S P

36
Fig 5. Structure of Category Pattern Diagrams
S M P
S M P
S M P
S M P
M P
— P =
member
not member
member
not member
(1) (2) (3)
M
S P 1!
6!5! 2!
7!
3!
8!
4!
S M P
member
not member
(4) (5) 1 2 7 8
3 5 4 6
S, P; Top-triangle!
¬S, ¬P; Bottom-triangle!
S, ¬P; Descending-parallelogram!
¬S, P; Ascending-parallelogram!

37
Fig 6. Illustrations of CPD rules for valid inferences (1-4) and illegal patterns (5-8).
S M P ?
S P ⇒! ⇒!
⇒! ⇒!
(3) Rule-no-info (a)! (4) Rule-no-info (b)!
(1) Rule-none! (2) Rule-some!
S M P S P
S M P S P S M P S P
S M P S M P S M P S M P
Invalid patterns!(5) (6) (7) (8)!

38
Fig 7. A five set Venn diagram representing a sorite.
P
Q
R S
T

39
Fig 8. Five CPD sorites
C
!" !"
C S D E P S
#" $" #"
(1)!!!!!!(3)!
P
!" !"
P S Q R S
!" !"i!
ii!
P
!" $"
P S Q R S
!" !"i! ii!
P
!" !"
P S Q R S
%" !"i!
ii!
P
!" $"
P S Q R S
!" !"i! ii!
(2)!!!!!!(4)!
Sor1 ! ! ! ! ! ! ! ! !Sor2!
Sor3!!!!!Sor4!
(5)!