grade 3 unit 7: collecting and displaying data (7 weeks) … · · 2013-12-01grade 3 unit 7:...
TRANSCRIPT
Grade 3 Unit 7: Collecting and Displaying Data (7 Weeks) Stage 1 – Desired Results
Established Goals Unit Description Students will learn to estimate lengths to the nearest halves and fourths of an inch and record that information in bar graphs and line plots. This unit also prepares students for the multiplicative comparison problems of grade 4 by asking students “how many more” and “how many less” questions of scaled bar graphs. The Mathematical Practices should be evident throughout instruction and connected to the content addressed in this unit. Students should engage in mathematical tasks that provide an opportunity to connect content and practices. Common Core Learning Standards 3.MD.3 Draw a scaled picture graph and a scaled bar graph to represent a data set with several categories. Solve one-and two-step “how many more” and “how many less” problems using information presented in scaled bar graphs. For example, draw a bar graph in which each square in the bar graph might represent 5 pets. 3.MD.4 Generate measurement data by measuring lengths using rulers marked with halves and fourths of an inch. Show the data by making a line plot, where the horizontal scale is marked off in appropriate units: whole numbers, halves, or quarters.
Common Core Standards of Mathematical Practice 1. Make sense of problems and persevere in solving them. 2. Reason abstractly and quantitatively. 3. Construct viable arguments and critique the reasoning of others. 4. Model with mathematics. 5. Use appropriate tools strategically. 6. Attend to precision. 7. Look for and make use of structure. 8. Look for and express regularity in repeated reasoning.
ESL Language Standards Standard 1: 1.5: Formulate, ask, and respond to various question forma to obtain, clarify and extend information and meaning 1.7: Present information clearly in a variety of oral and written forms for different audiences and purpose related to all academic content areas. 1.13: Engage in collaborative activities through a variety of student groupings to read, gather, share, discuss interpret, analyze and present information. Standard 3: 3.4: Evaluate students’ own and other’s work, individually and collaboratively, on the basis of a variety of criteria. 3.7: Engage in collaborative activities through a variety of groupings to discuss, share, reflect on, develop, and express opinion and evaluations about a variety of experiences, ideas, and information. 4.2: Describe, read about, participate in or recommend a favorite activity, book, song, or other interest to various audiences.
Big Ideas Data Collection: Some questions can be answered by collecting and analyzing data, and the question to be answered determines the data that needs to be collected and how best to collect it. Data Representation: Data can be represented visually using tables, charts, and graphs. The type of data determines the best choice of visual representation.
Essential Questions A1. How can we collect and represent data? A2. How can we interpret and compare data? B1. What are the different ways we can represent data? B2. How does the type of data determine the way it is represented?
Content (Students will know….)
A. Data can be represented in a scaled pictograph and bar graph. (3.MD.3)
B. A line plot can be used to represent data collected from measuring objects. (3.MD.4)
Skills (Students will be able to…) A1. Create a picture graph and a bar graph showing a data set, using varied scales appropriate to the data set, and verbally defend the graph created. A2. Collect data through a survey in order to create a graph. A3. Compute, with repeated addition or multiplication, the totals shown in given categories on a bar graph A4. Solve two step problems (how many more, how many less) relating to a picture or bar graph A5. Convert data, such as tally marks, to numbers to show totals in each category A6. Use the scale given to accurately show data on the graph A7. Explain strategies for solving one- and two-step “how many more” and “how many less” problems, both verbally and in writing. B1. Demonstrate accurate measurement to the nearest half inch and quarter inch using a ruler B2. Collect a linear measurement data set and plot the data on a line plot marked with whole, half and quarter inches. B3. Generate data by measuring and create a line plot to display findings. B4. Explain both verbally and in writing, how to accurately measure to the nearest half-inch and/or quarter inch, and how to put measurement data on a line plot.
Terms/ Vocabulary Pictograph, bar graph, key, scale, x-axis, y-axis, data, bars, label, title, frequency table, line plot, chart, fewer, greater, how many more, how many less, compare, combine, represent, horizontal, vertical
Stage 2 – Assessment Evidence
Initial Task: Candy Sale Data Final Performance Task: Canned Food Drive
Other Evidence Teacher observation, conferencing, teacher designed assessment pieces, student work, exit slips, journal entries
Stage 3 – Learning Plan
Everyday Mathematics/Impact Mathematics Lessons – The following lessons may support some of the CCLS & essential questions outlined in this unit map:
3.MD.3: 1.4, 1.5, 1.10, 1.13, 4.10, 5.2, 7.8, 10.6, 10.7, 10.9, 11.1 3.MD.4: 1.5, 3.2, 3.3, 3.5, 3.9, 5.7, 8.8, 9.13, 10.7 Additional Resources: 3.MD.3 http://www.uen.org/core/displayLinks.do?courseNumber=5130&standardId=71234&objectiveId=71237 http://www.uen.org/Lessonplan/preview?LPid=14864
http://www.readtennessee.org/sites/www/Uploads/Examples/3.MD.B.3final.pdf http://www.readtennessee.org/sites/www/Uploads/Examples/3.MD.Cluster_Task_Bfinal.pdf http://www.readtennessee.org/math/teachers/k-3_common_core_math_standards/third_grade/measurement_data/3md3/3md3_lesson_plan.aspx 3.MD.4 http://www.uen.org/core/displayLinks.do?courseNumber=5130&standardId=71234&objectiveId=71238 http://www.uen.org/core/math/downloads/3MD4.pdf http://www.readtennessee.org/sites/www/Uploads/Examples/3.MD.B.4final.pdf http://www.readtennessee.org/sites/www/Uploads/Examples/3.MD.Cluster_Task_Bfinal.pdf http://www.readtennessee.org/math/teachers/k-3_common_core_math_standards/third_grade/measurement_data/3md4/3md4_lesson_plan.aspx
Name _______________________________ Date ______________________
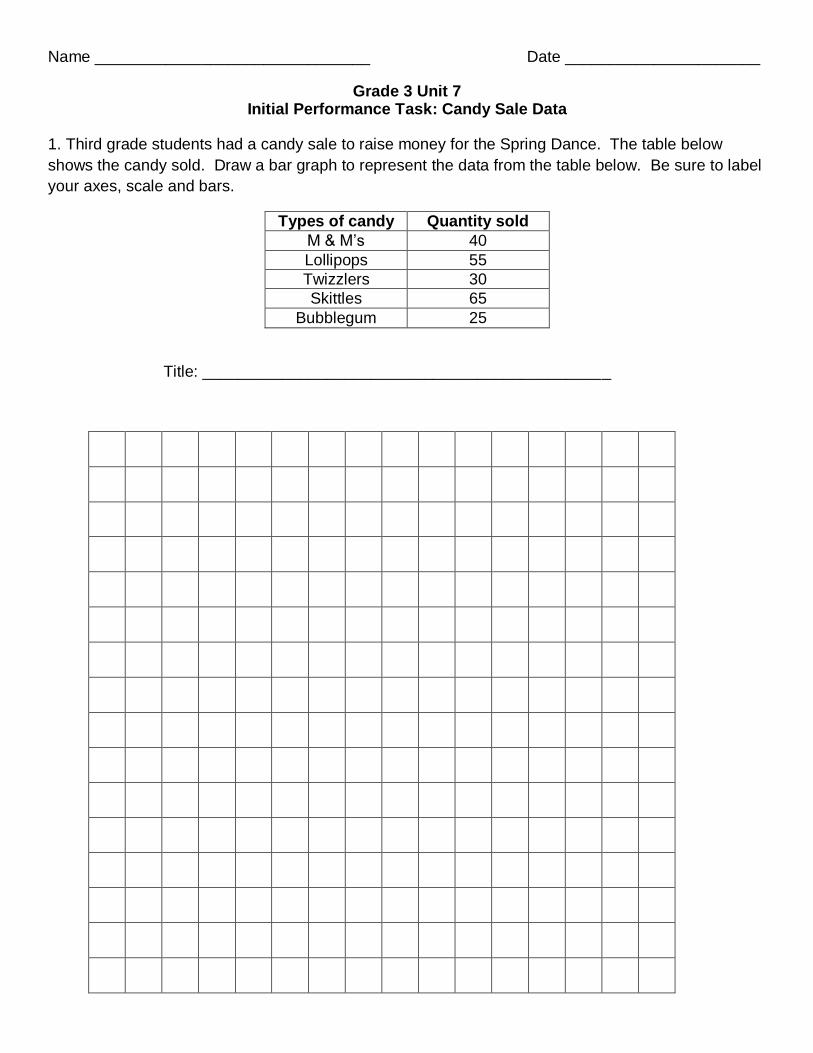
Grade 3 Unit 7 Initial Performance Task: Candy Sale Data
1. Third grade students had a candy sale to raise money for the Spring Dance. The table below
shows the candy sold. Draw a bar graph to represent the data from the table below. Be sure to label
your axes, scale and bars.
Types of candy Quantity sold
M & M’s 40
Lollipops 55
Twizzlers 30
Skittles 65
Bubblegum 25
Title: ______________________________________________
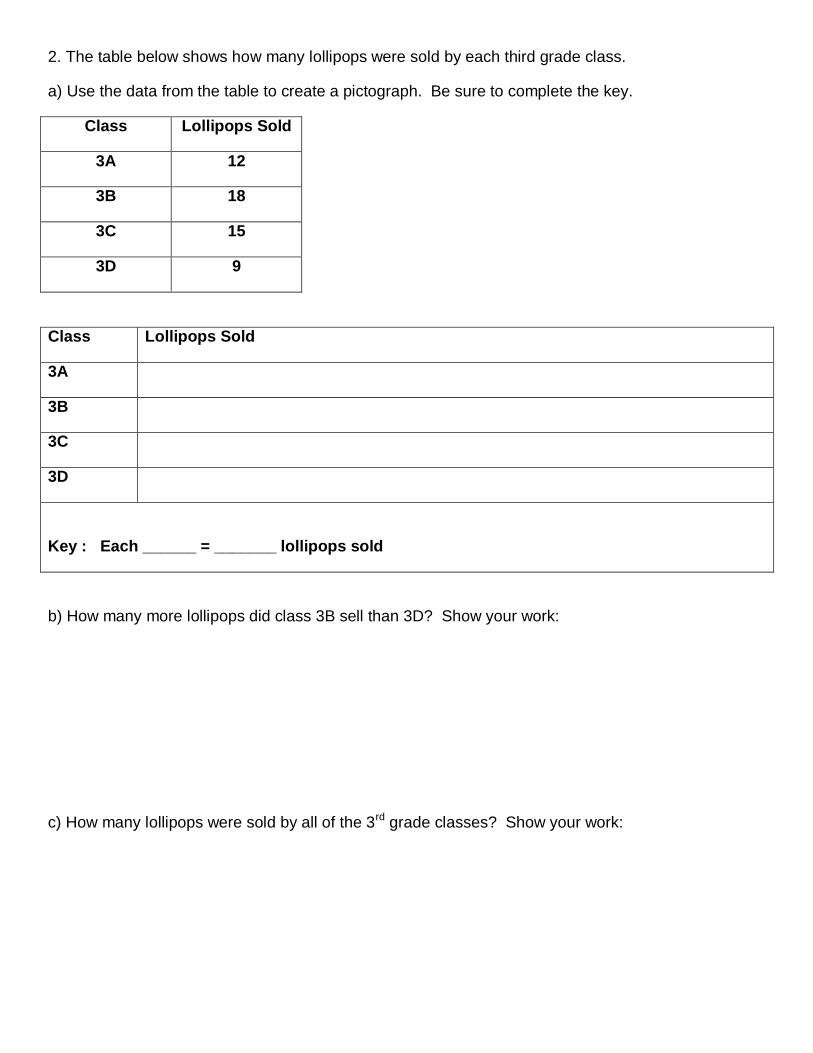
2. The table below shows how many lollipops were sold by each third grade class.
a) Use the data from the table to create a pictograph. Be sure to complete the key.
Class Lollipops Sold
3A 12
3B 18
3C 15
3D 9
Class Lollipops Sold
3A
3B
3C
3D
Key : Each ______ = _______ lollipops sold
b) How many more lollipops did class 3B sell than 3D? Show your work:
c) How many lollipops were sold by all of the 3rd grade classes? Show your work:
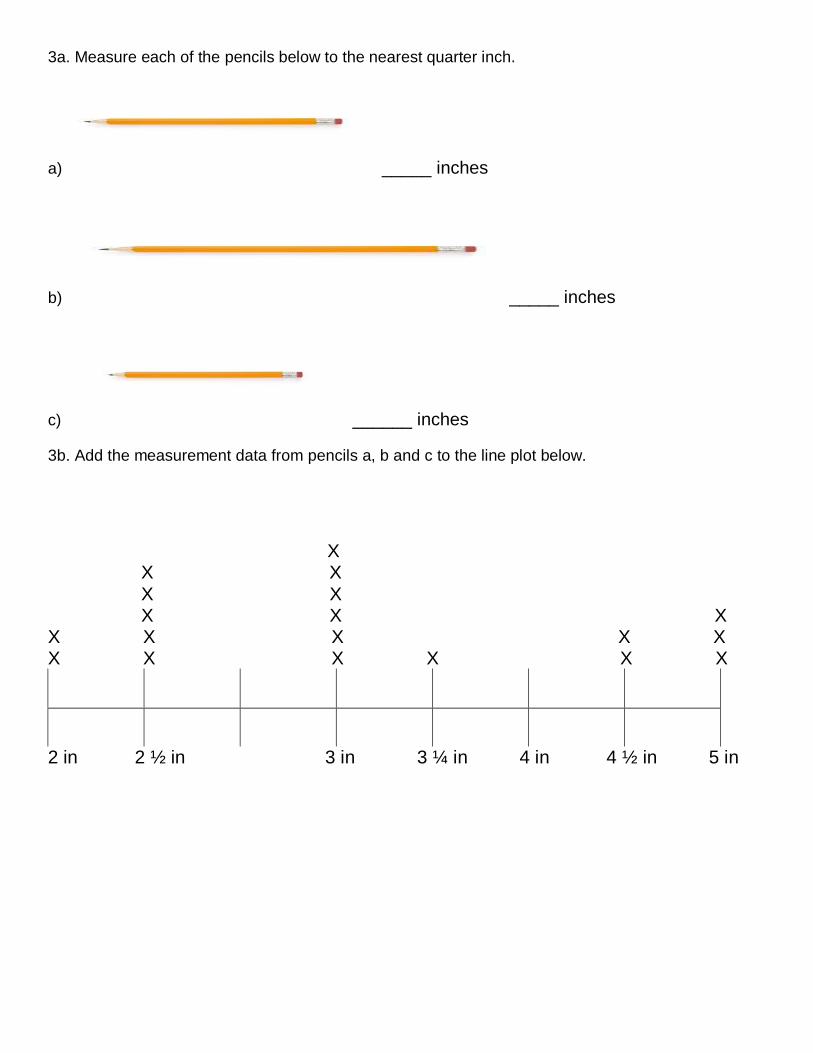
3a. Measure each of the pencils below to the nearest quarter inch.
a) _____ inches
b) _____ inches
c) ______ inches
3b. Add the measurement data from pencils a, b and c to the line plot below.
X X X X X X X X X X X X X X X X X X X
2 in 2 ½ in 3 in 3 ¼ in 4 in 4 ½ in 5 in
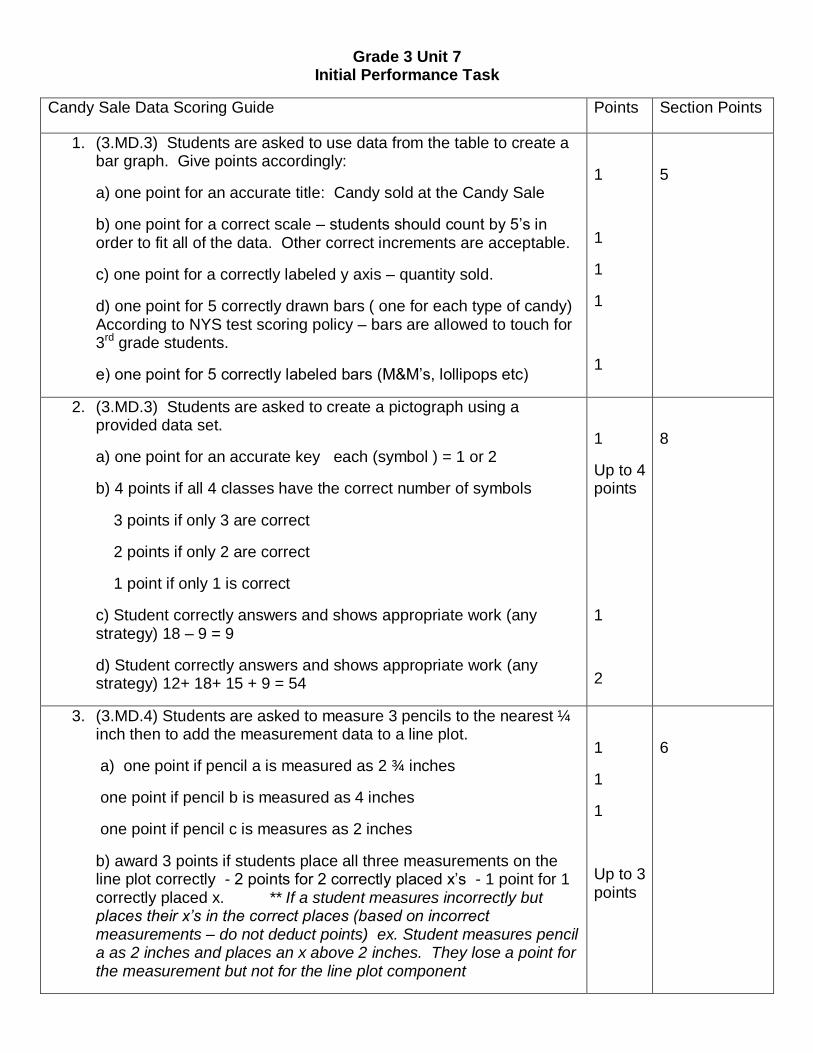
Grade 3 Unit 7 Initial Performance Task
Candy Sale Data Scoring Guide Points Section Points
1. (3.MD.3) Students are asked to use data from the table to create a bar graph. Give points accordingly:
a) one point for an accurate title: Candy sold at the Candy Sale
b) one point for a correct scale – students should count by 5’s in order to fit all of the data. Other correct increments are acceptable.
c) one point for a correctly labeled y axis – quantity sold.
d) one point for 5 correctly drawn bars ( one for each type of candy) According to NYS test scoring policy – bars are allowed to touch for 3rd grade students.
e) one point for 5 correctly labeled bars (M&M’s, lollipops etc)
1
1
1
1
1
5
2. (3.MD.3) Students are asked to create a pictograph using a provided data set.
a) one point for an accurate key each (symbol ) = 1 or 2
b) 4 points if all 4 classes have the correct number of symbols
3 points if only 3 are correct
2 points if only 2 are correct
1 point if only 1 is correct
c) Student correctly answers and shows appropriate work (any strategy) 18 – 9 = 9
d) Student correctly answers and shows appropriate work (any strategy) 12+ 18+ 15 + 9 = 54
1
Up to 4 points
1
2
8
3. (3.MD.4) Students are asked to measure 3 pencils to the nearest ¼ inch then to add the measurement data to a line plot.
a) one point if pencil a is measured as 2 ¾ inches
one point if pencil b is measured as 4 inches
one point if pencil c is measures as 2 inches
b) award 3 points if students place all three measurements on the line plot correctly - 2 points for 2 correctly placed x’s - 1 point for 1 correctly placed x. ** If a student measures incorrectly but places their x’s in the correct places (based on incorrect measurements – do not deduct points) ex. Student measures pencil a as 2 inches and places an x above 2 inches. They lose a point for the measurement but not for the line plot component
1
1
1
Up to 3 points
6
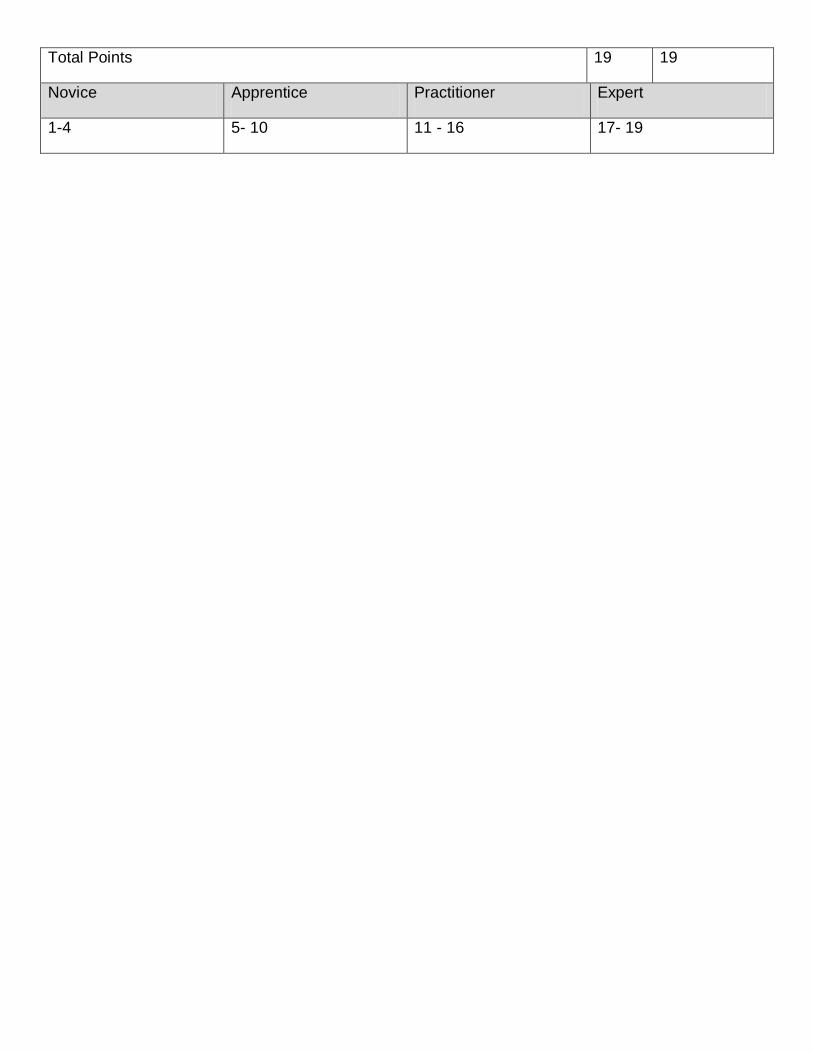
Total Points 19 19
Novice Apprentice Practitioner Expert
1-4 5- 10 11 - 16 17- 19
Name __________________________________________ Date ________________________
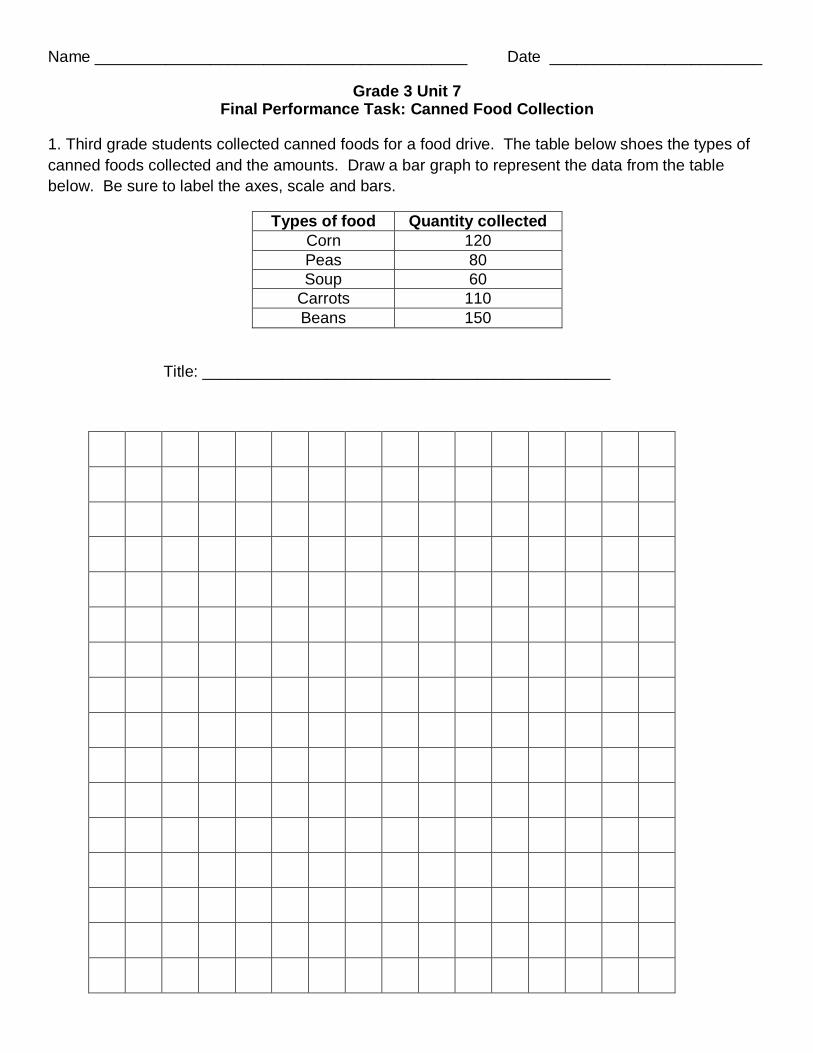
Grade 3 Unit 7 Final Performance Task: Canned Food Collection
1. Third grade students collected canned foods for a food drive. The table below shoes the types of
canned foods collected and the amounts. Draw a bar graph to represent the data from the table
below. Be sure to label the axes, scale and bars.
Types of food Quantity collected
Corn 120
Peas 80
Soup 60
Carrots 110
Beans 150
Title: ______________________________________________
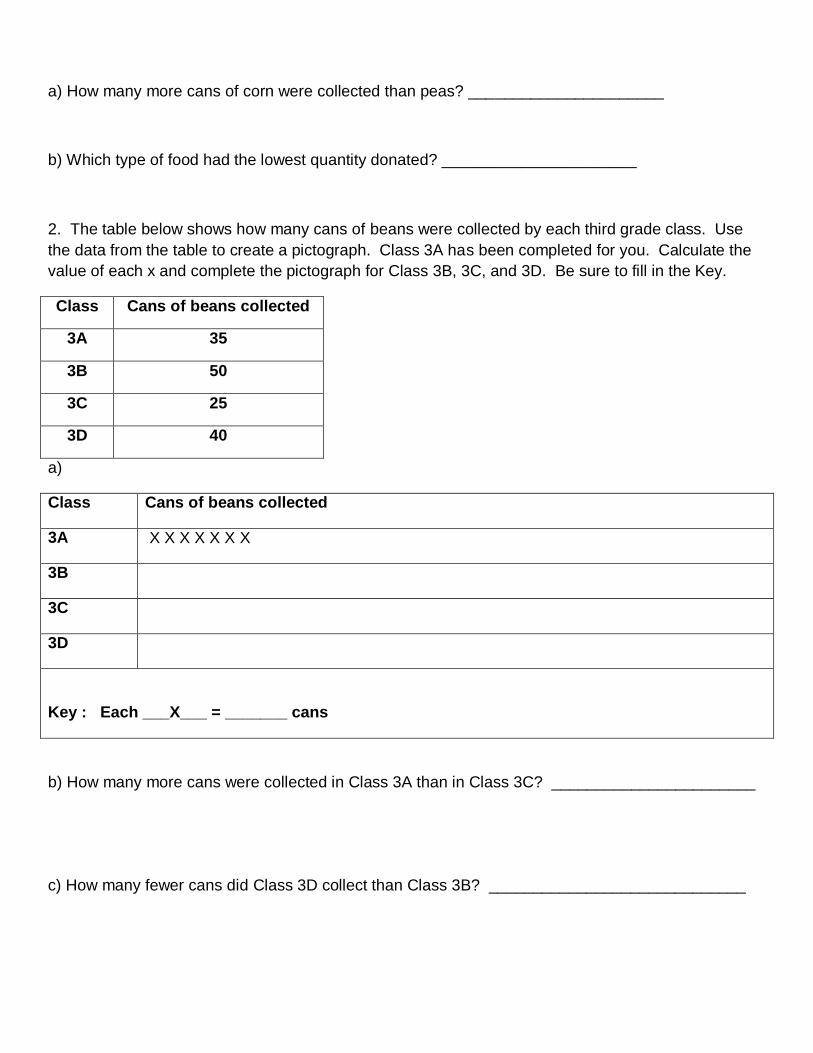
a) How many more cans of corn were collected than peas? ______________________
b) Which type of food had the lowest quantity donated? ______________________
2. The table below shows how many cans of beans were collected by each third grade class. Use
the data from the table to create a pictograph. Class 3A has been completed for you. Calculate the
value of each x and complete the pictograph for Class 3B, 3C, and 3D. Be sure to fill in the Key.
Class Cans of beans collected
3A 35
3B 50
3C 25
3D 40
a)
Class Cans of beans collected
3A X X X X X X X
3B
3C
3D
Key : Each ___X___ = _______ cans
b) How many more cans were collected in Class 3A than in Class 3C? _______________________
c) How many fewer cans did Class 3D collect than Class 3B? _____________________________
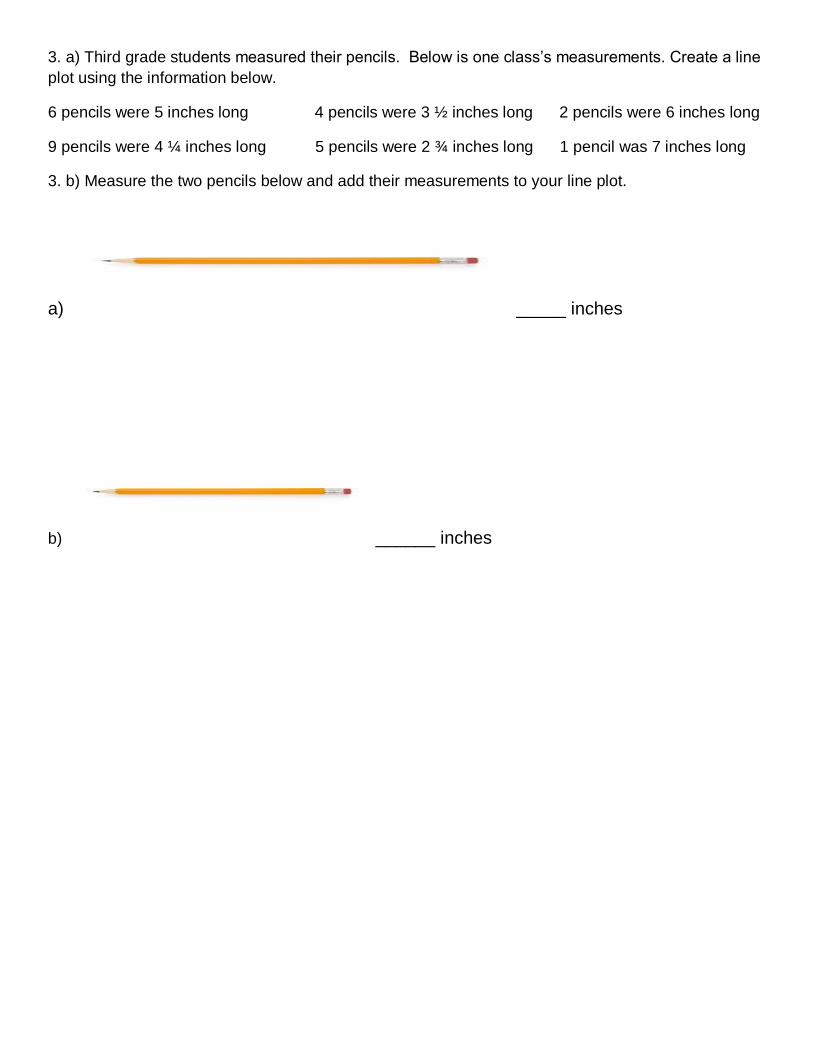
3. a) Third grade students measured their pencils. Below is one class’s measurements. Create a line
plot using the information below.
6 pencils were 5 inches long 4 pencils were 3 ½ inches long 2 pencils were 6 inches long
9 pencils were 4 ¼ inches long 5 pencils were 2 ¾ inches long 1 pencil was 7 inches long
3. b) Measure the two pencils below and add their measurements to your line plot.
a) _____ inches
b) ______ inches
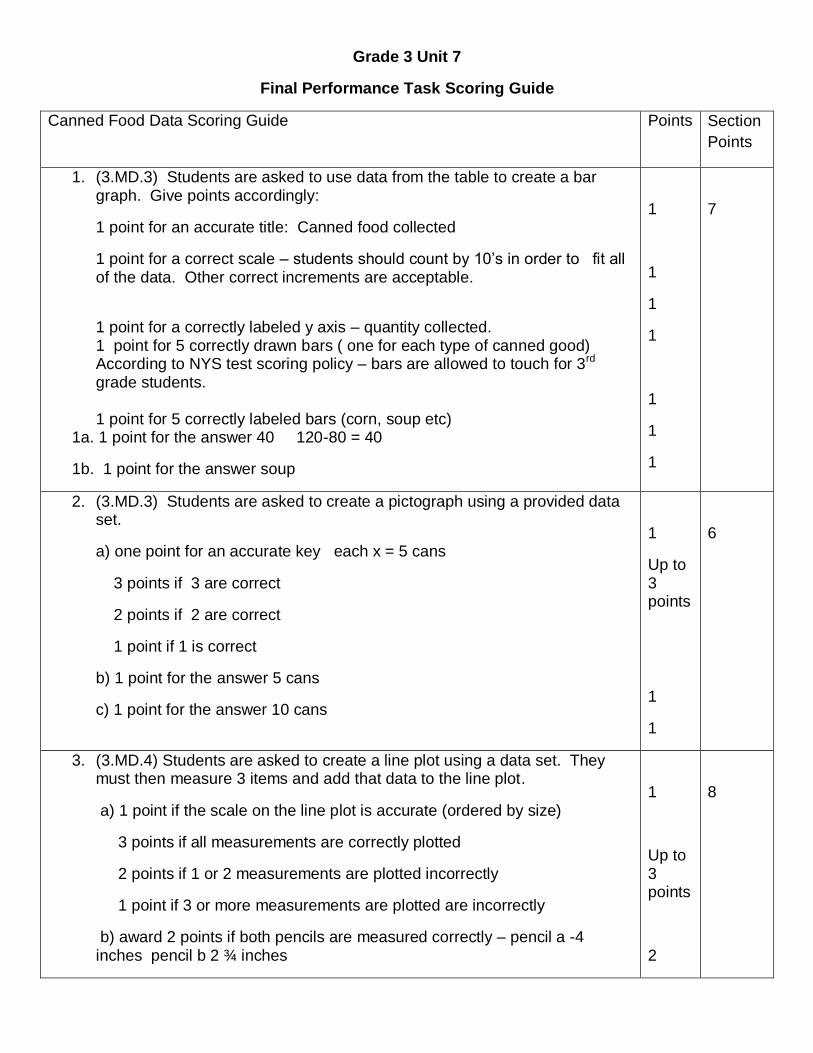
Grade 3 Unit 7
Final Performance Task Scoring Guide
Canned Food Data Scoring Guide Points Section
Points
1. (3.MD.3) Students are asked to use data from the table to create a bar graph. Give points accordingly:
1 point for an accurate title: Canned food collected
1 point for a correct scale – students should count by 10’s in order to fit all of the data. Other correct increments are acceptable.
1 point for a correctly labeled y axis – quantity collected. 1 point for 5 correctly drawn bars ( one for each type of canned good) According to NYS test scoring policy – bars are allowed to touch for 3rd grade students. 1 point for 5 correctly labeled bars (corn, soup etc)
1a. 1 point for the answer 40 120-80 = 40
1b. 1 point for the answer soup
1
1
1
1
1
1
1
7
2. (3.MD.3) Students are asked to create a pictograph using a provided data set.
a) one point for an accurate key each x = 5 cans
3 points if 3 are correct
2 points if 2 are correct
1 point if 1 is correct
b) 1 point for the answer 5 cans
c) 1 point for the answer 10 cans
1
Up to 3 points
1
1
6
3. (3.MD.4) Students are asked to create a line plot using a data set. They must then measure 3 items and add that data to the line plot.
a) 1 point if the scale on the line plot is accurate (ordered by size)
3 points if all measurements are correctly plotted
2 points if 1 or 2 measurements are plotted incorrectly
1 point if 3 or more measurements are plotted are incorrectly
b) award 2 points if both pencils are measured correctly – pencil a -4 inches pencil b 2 ¾ inches
1
Up to 3 points
2
8

award 2 points if both measurements are plotted correctly.
** If a student measures incorrectly but places their x’s in the correct places (based on incorrect measurements – do not deduct points) ex. Student measures pencil a as 2 inches and places an x above 2 inches. They lose a point for the measurement but not for the line plot component
2
Total Points 22
Novice Apprentice Practitioner Expert
1-6 7-12 13-17 18 – 22