gqg partners emerging markets equity fund · the advisors’ inner circle fund iii gqgpartners...
TRANSCRIPT

The Advisors’ Inner Circle Fund III
GQG Partners Emerging Markets Equity Fund
SEMI-ANNUAL REPORT JANUARY 31, 2018
Investment Adviser:GQG Partners LLC

THE ADVISORS’ INNER CIRCLE FUND III GQG PARTNERS EMERGINGMARKETS EQUITY FUNDJANUARY 31, 2018 (Unaudited)
TABLE OF CONTENTS
Letter to Shareholders ......................................................................................................1
Schedule of Investments....................................................................................................4
Statement of Assets and Liabilities ................................................................................ 10
Statement of Operations ................................................................................................ 11
Statements of Changes in Net Assets ............................................................................ 12
Financial Highlights ........................................................................................................ 13
Notes to Financial Statements ........................................................................................16
Disclosure of Fund Expenses .......................................................................................... 26
The Fund files its complete schedule of investments with the Securities andExchange Commission (“SEC”) for the first and third quarters of each fiscal year onForm N-Q within sixty days after period end. The Fund’s Form N-Q is available onthe SEC’s website at http://www.sec.gov, and may be reviewed and copied at theSEC’s Public Reference Room in Washington, DC. Information on the operation ofthe Public Reference Room may be obtained by calling 1-800-SEC-0330.
A description of the policies and procedures that the Fund uses to determine howto vote proxies relating to Fund securities, as well as information relating to how aFund voted proxies relating to fund securities during the most recent 12-monthperiod ended June 30, is available (i) without charge, upon request, bycalling 1-866-362-8333; and (ii) on the SEC’s website at http://www.sec.gov.

THE ADVISORS’ INNER CIRCLE FUND III GQG PARTNERS EMERGINGMARKETS EQUITY FUNDJANUARY 31, 2018 (Unaudited)
LETTER TO SHAREHOLDERS
Dear Shareholders:
The benchmark MSCI Emerging Markets Index posted solid gains over the 3- and 6-monthperiods ended January 31st. We’re pleased to have kept pace with the index over thoseperiods, and perhaps even a bit surprised. I say “surprised” because it is not uncommon formore momentum-oriented funds, which tend to lead the pack lower in bear markets, toperform best for the first 12-18 months of market recovery. Our quality-at-reasonable-priceapproach seeks the middle path of protecting in down markets and participating in upmarkets.
One observation we find interesting is that some of the large consumer staples stocks haveexperienced multiple expansion even as they were experiencing slower earnings growth. Weattribute this to these stocks – along with REITS and utilities – being viewed as bond proxiesby yield-hungry investors. For the most part we’ve avoided the bond proxies, which has nothelped over the past year or so. We feel we are in the early stages of recovery in emergingmarkets, especially looking at the credit cycle in some of the larger economies. We believethat the shares of low-growth companies bought as income vehicles don’t offer attractiveupside potential in a period of heightened economic activity and, in many markets, risinginterest rates.
The sharp rise in share prices in the 12 months ended January 31st was a direct result ofimproved earnings in markets around the world. Earnings estimates were adjusted upwardthrough much of the year as analysts digested the data coming in. Early into the new year,there’s ample reason to believe that 2018 will be another year of healthy economic activityaround the globe. While markets will undoubtedly face headwinds over the next 12 months,we expect corporate earnings to continue their ascent, reflecting growth in corporateinvestment and in consumer spending.
By definition, an active portfolio is overweight some sectors versus the benchmark andunderweight others. In discussing position size by sectors, I feel it’s important to stress thatwe build our portfolios one stock at a time, a fact that distinguishes us from ETFs that buystocks in order to gain “exposure” to some specific sector or factor (or country or region) –be it finance, tech, consumer staples, etc. in the case of sectors, or high-yield, low-volatility,low-P/E, etc. in the case of factors. Our positions reflect careful consideration of company-specific issues. We’re not buying exposure; we’re buying stocks.
We closed out 2017 notably overweight the Financials sector. Our largest holdings in thesector are, in order, Sberbank, PT Bank Central Asia and B3 SA – Brazil, Bolsa, Balcoã. I’d liketo discuss each of these to illustrate why it is that we believe stock-specific research addsvalue. One point to consider here is that we don’t expect these large positions to becorrelated in terms of earnings, which is an important consideration pertinent to portfolioconstruction; these companies have diversified earnings drivers.
1

THE ADVISORS’ INNER CIRCLE FUND III GQG PARTNERS EMERGINGMARKETS EQUITY FUNDJANUARY 31, 2018 (Unaudited)
Sberbank is by far the largest bank in Russia, with a greater-than-50% share of the mortgagemarket and greater-than-40% share in retail deposits and retail loans. If you’re engaged in afinancial transaction in Russia, chances are pretty good that Sberbank is somehow involved.This is an institution whose predecessors were established by the decree of the EmperorNikolas I in 1841, so it has deep roots and has survived through more than a century and ahalf of what could be termed some very interesting times. With Russia emerging this pastyear from a deep economic recession, 2017 earnings are estimated to have climbed by over20% and we look for double-digit growth over the next few years as the company gainsmarket share, cuts costs and extends its franchise. Sberbank is one of the world’s mostprofitable banks, with an estimated 2017 ROE of over 22%. It is investing heavily in digitaltechnology to lower costs, improve service and expand its product offerings.
Founded in 1955, PT Bank Central Asia (BCA) is a conservatively run and very well capitalizedIndonesian bank benefitting from an improving macro environment in Indonesia, partly areflection of stronger commodity pricing. All banks in Indonesia have benefitted not only fromthe improving economy, but also from regulatory reforms enacted since the currentgovernment took office in 2014. BCA also is benefitting, though, from its investments in digitalbanking services. The banks have one of the lowest cost deposit bases in Indonesia with nearly77% of deposits being current and savings accounts (CASA). Estimates call for low- tomid-teens earnings growth in 2017 – 2019 and a gradual increase in the dividend payout ratio,which stood at 24% in 2016. Yielding 1.0%, BCA trades at about 21x 2018 earnings.
B3 SA – Brazil, Bolsa, Balcoã (B3) is the sole securities, commodities and futures exchangeoperating in Brazil. It was formed through the March 2017 merger between BM&F Bovespa,an exchange, and Cetip, Latin America’s largest depository of fixed-income securities andBrazil’s largest private-asset clearing house. B3 has a well-diversified revenue stream and isdominant in its markets.
In early 2018, the markets have surged and then slumped, displaying a level of volatility notseen in years. The papers and the pundits are discussing the return of volatility in stock marketsthat have been suspiciously calm as they climbed higher over the past two years or so. Somepeople seem to have forgotten (or never learned) a key lesson for successful investment:volatility is a normal trait in healthy capital markets, something you’d expect in markets that areimpacted by macro events, micro events, fact and fiction, fear and greed. With the world’sdeveloped economies finally sloughing off the worst effects of the Great Financial Crisis at thesame time that two key emerging markets recover from punishing recession, I feel we arereturning to an environment in which real interest rates in growing economies are not kept atzero percent and in which large swings in stock prices are fairly common. I welcome this shift, asI believe it will allow active managers to add value through careful stock selection. As I look atour portfolio today, I am very comfortable with our holdings.
Rajiv JainChairman and Chief Investment OfficerGQG Partners LLCMarch 2018
2
THE ADVISORS’ INNER CIRCLE FUND III GQG PARTNERS EMERGINGMARKETS EQUITY FUNDJANUARY 31, 2018 (Unaudited)
The performance data quoted represents past performance. Past performance does notguarantee future results. Current performance of the portfolio may be lower or higher thanthe performance quoted. Performance data current to the most recent month-end may beobtained by calling +1 (866) 362-8333. The investment return and principal value of aninvestment will fluctuate so that an investor’s shares, when redeemed, may be worth moreor less than their original cost. Returns greater than one year are annualized. Performancemay reflect agreements to limit a Fund’s expenses, which would further reduceperformance if not in effect.
The material represents the manager’s assessment of the portfolio and market environmentat a specific point in time and should not be relied upon by the reader as research orinvestment advice regarding any stock. Neither this material nor any accompanying oralpresentation or remarks by a representative is intended to constitute a recommendation ofthe Fund or a determination of suitability.
Portfolio holdings are subject to change and should not be considered investment advice ora recommendation to buy securities.
There are risks involved with investing in mutual funds, including loss of principal. Inaddition to the normal risks involved with investing in mutual funds, including loss ofprincipal, investments in smaller companies typically exhibit higher volatility. Current andfuture holdings are subject to risk. The Fund invests in foreign securities, which will involvegreater volatility and political, economic, and currency risks and differences in accountingmethods. It also invests in emerging markets, which involve unique risks, such as exposureto economies less diverse and mature than the US or other more established foreignmarkets. Economic and political instability may cause larger price changes in emergingmarkets securities than other foreign securities. It is possible to lose money by investing insecurities. The Fund is nondiversified. Any Fund advised by GQG involves significant risksand is suitable only for those persons who can bear the economic risk of the complete lossof their investment. There can be no assurance that any fund will achieve its investmentobjectives.
Index returns are for illustrative purposes only and do not represent actual Fundperformance. Index performance returns do not reflect any management fees, transactioncosts or expenses. Indexes are unmanaged and one cannot invest directly in an index. Pastperformance does not guarantee future results.
Definition of the Comparative Index
MSCI Emerging Markets Index captures large and mid-cap representation across24 Emerging Markets countries. With 846 constituents, the index covers approximately 85%of the free float-adjusted market capitalization in each country.
3

THE ADVISORS’ INNER CIRCLE FUND III GQG PARTNERS EMERGINGMARKETS EQUITY FUNDJANUARY 31, 2018 (Unaudited)
SECTOR WEIGHTINGS†
35.4% Financials
32.1% Information Technology
2.3% Energy
2.7% Utilities
3.2% Materials
3.3% Telecommunication Services
8.3% Consumer Staples
4.2% Industrials
2.0% Health Care
6.5% Consumer Discretionary
† Percentages based on total investments.
SCHEDULE OF INVESTMENTS
COMMON STOCK — 89.7%
Shares Value
ARGENTINA — 3.2%Grupo Financiero Galicia ADR . . . . . . . . . . . . . . . . . . . . . . . . . . . . . . . . . . 118,382 $ 8,263,064Loma Negra Cia Industrial Argentina ADR * . . . . . . . . . . . . . . . . . . . . . 132,402 3,145,871MercadoLibre . . . . . . . . . . . . . . . . . . . . . . . . . . . . . . . . . . . . . . . . . . . . . . . . . . 23,255 9,002,010
20,410,945
BRAZIL — 5.0%Brasil Bolsa Balcao . . . . . . . . . . . . . . . . . . . . . . . . . . . . . . . . . . . . . . . . . . . . . 2,624,213 21,610,532Qualicorp . . . . . . . . . . . . . . . . . . . . . . . . . . . . . . . . . . . . . . . . . . . . . . . . . . . . . . 304,235 2,938,647Raia Drogasil . . . . . . . . . . . . . . . . . . . . . . . . . . . . . . . . . . . . . . . . . . . . . . . . . . . 220,931 5,889,959WEG . . . . . . . . . . . . . . . . . . . . . . . . . . . . . . . . . . . . . . . . . . . . . . . . . . . . . . . . . . . 242,386 1,813,906
32,253,044
CHINA — 23.7%51job ADR * . . . . . . . . . . . . . . . . . . . . . . . . . . . . . . . . . . . . . . . . . . . . . . . . . . . . 55,813 3,911,933Alibaba Group Holding ADR * . . . . . . . . . . . . . . . . . . . . . . . . . . . . . . . . . . 154,726 31,608,975Baidu ADR * . . . . . . . . . . . . . . . . . . . . . . . . . . . . . . . . . . . . . . . . . . . . . . . . . . . . 23,515 5,806,324China Resources Gas Group . . . . . . . . . . . . . . . . . . . . . . . . . . . . . . . . . . . . 1,016,860 3,347,735CITIC Securities, Cl H . . . . . . . . . . . . . . . . . . . . . . . . . . . . . . . . . . . . . . . . . . . 1,910,190 5,079,870
The accompanying notes are an integral part of the financial statements.
4

THE ADVISORS’ INNER CIRCLE FUND III GQG PARTNERS EMERGINGMARKETS EQUITY FUNDJANUARY 31, 2018 (Unaudited)
COMMON STOCK — continued
Shares Value
CHINA (continued)Geely Automobile Holdings . . . . . . . . . . . . . . . . . . . . . . . . . . . . . . . . . . . . 983,157 $ 3,148,787Industrial & Commercial Bank of China, Cl H . . . . . . . . . . . . . . . . . . . . 14,581,779 13,796,056JD.com ADR * . . . . . . . . . . . . . . . . . . . . . . . . . . . . . . . . . . . . . . . . . . . . . . . . . . 296,200 14,581,926Noah Holdings ADR * . . . . . . . . . . . . . . . . . . . . . . . . . . . . . . . . . . . . . . . . . . 126,123 6,231,738Ping An Insurance Group of China, Cl H . . . . . . . . . . . . . . . . . . . . . . . . . 1,694,316 20,070,240Tencent Holdings . . . . . . . . . . . . . . . . . . . . . . . . . . . . . . . . . . . . . . . . . . . . . . 707,595 41,941,206ZTO Express Cayman ADR * . . . . . . . . . . . . . . . . . . . . . . . . . . . . . . . . . . . . 189,536 2,996,564
152,521,354
HONG KONG — 4.0%AIA Group . . . . . . . . . . . . . . . . . . . . . . . . . . . . . . . . . . . . . . . . . . . . . . . . . . . . . . 1,953,272 16,732,092China Gas Holdings . . . . . . . . . . . . . . . . . . . . . . . . . . . . . . . . . . . . . . . . . . . . . 3,075,621 9,004,944
25,737,036
HUNGARY — 1.7%OTP Bank . . . . . . . . . . . . . . . . . . . . . . . . . . . . . . . . . . . . . . . . . . . . . . . . . . . . . . 144,088 6,711,760Richter Gedeon Nyrt . . . . . . . . . . . . . . . . . . . . . . . . . . . . . . . . . . . . . . . . . . . 187,382 4,838,672
11,550,432
INDIA — 7.7%HDFC Bank ADR . . . . . . . . . . . . . . . . . . . . . . . . . . . . . . . . . . . . . . . . . . . . . . . . 147,383 16,004,320Housing Development Finance . . . . . . . . . . . . . . . . . . . . . . . . . . . . . . . . . 644,670 19,828,515InterGlobe Aviation (A) . . . . . . . . . . . . . . . . . . . . . . . . . . . . . . . . . . . . . . . . . 387,738 7,406,517Reliance Industries . . . . . . . . . . . . . . . . . . . . . . . . . . . . . . . . . . . . . . . . . . . . . 420,639 6,357,491
49,596,843
INDONESIA — 9.0%Bank Central Asia . . . . . . . . . . . . . . . . . . . . . . . . . . . . . . . . . . . . . . . . . . . . . . 15,549,073 26,392,253Bank Rakyat Indonesia Persero . . . . . . . . . . . . . . . . . . . . . . . . . . . . . . . . . 38,656,907 10,683,090Sarana Menara Nusantara . . . . . . . . . . . . . . . . . . . . . . . . . . . . . . . . . . . . . 30,168,051 8,359,672Telekomunikasi Indonesia Persero . . . . . . . . . . . . . . . . . . . . . . . . . . . . . 40,921,573 12,195,323
57,630,338
The accompanying notes are an integral part of the financial statements.
5

THE ADVISORS’ INNER CIRCLE FUND III GQG PARTNERS EMERGINGMARKETS EQUITY FUNDJANUARY 31, 2018 (Unaudited)
COMMON STOCK — continued
Shares Value
MEXICO — 2.2%Grupo Aeroportuario del Pacifico, Cl B . . . . . . . . . . . . . . . . . . . . . . . . . 525,694 $ 5,518,924Grupo Aeroportuario del Sureste, Cl B . . . . . . . . . . . . . . . . . . . . . . . . . . 217,576 4,238,991Infraestructura Energetica Nova . . . . . . . . . . . . . . . . . . . . . . . . . . . . . . . . 891,565 4,654,314
14,412,229
NETHERLANDS — 3.3%ASML Holding . . . . . . . . . . . . . . . . . . . . . . . . . . . . . . . . . . . . . . . . . . . . . . . . . . 44,077 8,961,128Heineken . . . . . . . . . . . . . . . . . . . . . . . . . . . . . . . . . . . . . . . . . . . . . . . . . . . . . . 107,038 12,075,494
21,036,622
RUSSIA — 11.6%Alrosa PJSC . . . . . . . . . . . . . . . . . . . . . . . . . . . . . . . . . . . . . . . . . . . . . . . . . . . . 2,028,691 2,938,499MMC Norilsk Nickel PJSC . . . . . . . . . . . . . . . . . . . . . . . . . . . . . . . . . . . . . . . 40,123 8,277,569Rosneft Oil PJSC . . . . . . . . . . . . . . . . . . . . . . . . . . . . . . . . . . . . . . . . . . . . . . . . 1,271,225 7,753,928Sberbank of Russia PJSC . . . . . . . . . . . . . . . . . . . . . . . . . . . . . . . . . . . . . . . . 5,611,381 26,378,340Sberbank of Russia PJSC ADR ^ . . . . . . . . . . . . . . . . . . . . . . . . . . . . . . . . . 418,890 8,440,634Sberbank of Russia PJSC ADR ^ . . . . . . . . . . . . . . . . . . . . . . . . . . . . . . . . . 90,287 1,827,409Severstal PJSC . . . . . . . . . . . . . . . . . . . . . . . . . . . . . . . . . . . . . . . . . . . . . . . . . . 174,463 2,849,825Severstal PJSC GDR . . . . . . . . . . . . . . . . . . . . . . . . . . . . . . . . . . . . . . . . . . . . . 183,259 3,009,113TCS Group Holding GDR . . . . . . . . . . . . . . . . . . . . . . . . . . . . . . . . . . . . . . . . 29,833 650,360X5 Retail Group GDR * . . . . . . . . . . . . . . . . . . . . . . . . . . . . . . . . . . . . . . . . . 141,599 5,428,906Yandex, Cl A * . . . . . . . . . . . . . . . . . . . . . . . . . . . . . . . . . . . . . . . . . . . . . . . . . . 195,769 7,582,133
75,136,716
SOUTH AFRICA — 1.0%Discovery . . . . . . . . . . . . . . . . . . . . . . . . . . . . . . . . . . . . . . . . . . . . . . . . . . . . . . 444,436 6,320,077
SOUTH KOREA — 5.5%Samsung Electronics . . . . . . . . . . . . . . . . . . . . . . . . . . . . . . . . . . . . . . . . . . . 6,285 14,684,717Samsung Electronics GDR . . . . . . . . . . . . . . . . . . . . . . . . . . . . . . . . . . . . . . 17,397 20,598,048
35,282,765
The accompanying notes are an integral part of the financial statements.
6

THE ADVISORS’ INNER CIRCLE FUND III GQG PARTNERS EMERGINGMARKETS EQUITY FUNDJANUARY 31, 2018 (Unaudited)
COMMON STOCK — continued
Shares Value
TAIWAN — 3.1%Taiwan Semiconductor Manufacturing . . . . . . . . . . . . . . . . . . . . . . . . . 1,805,118 $ 15,793,350
Taiwan Semiconductor Manufacturing ADR . . . . . . . . . . . . . . . . . . . . 101,339 4,591,670
20,385,020
THAILAND — 3.0%CP ALL . . . . . . . . . . . . . . . . . . . . . . . . . . . . . . . . . . . . . . . . . . . . . . . . . . . . . . . . . 6,202,970 15,794,599
Kasikornbank NVDR . . . . . . . . . . . . . . . . . . . . . . . . . . . . . . . . . . . . . . . . . . . . 418,497 3,073,254
18,867,853
UNITED STATES — 5.7%Lam Research . . . . . . . . . . . . . . . . . . . . . . . . . . . . . . . . . . . . . . . . . . . . . . . . . . 55,336 10,597,951
NVIDIA . . . . . . . . . . . . . . . . . . . . . . . . . . . . . . . . . . . . . . . . . . . . . . . . . . . . . . . . . 72,515 17,824,187
Wynn Resorts . . . . . . . . . . . . . . . . . . . . . . . . . . . . . . . . . . . . . . . . . . . . . . . . . . 49,161 8,140,570
36,562,708
Total Common Stock(Cost $490,632,043) . . . . . . . . . . . . . . . . . . . . . . . . . . . . . . . . . . . . . . . . . 577,703,982
PARTICIPATION NOTES — 5.1%
CHINA — 5.1%Hangzhou Hikvision Digital Technology, Expires 8/29/2019 * . . . 1,467,294 9,215,573
Jiangsu Hengrui Medicine, Expires 9/5/2019 * . . . . . . . . . . . . . . . . . . 414,418 4,937,527
Kweichow Moutai, Expires 9/6/2019 * . . . . . . . . . . . . . . . . . . . . . . . . . 107,423 12,927,954
Macquarie Bank Hangzhou Hikvision Digitala, Expires8/26/2019 * . . . . . . . . . . . . . . . . . . . . . . . . . . . . . . . . . . . . . . . . . . . . . . . . . 138,111 867,428
Wuliangye Yibin, Expires 11/18/2019 * . . . . . . . . . . . . . . . . . . . . . . . . . 354,911 4,714,019
Total Participation Notes(Cost $26,849,219) . . . . . . . . . . . . . . . . . . . . . . . . . . . . . . . . . . . . . . . . . . 32,662,501
The accompanying notes are an integral part of the financial statements.
7

THE ADVISORS’ INNER CIRCLE FUND III GQG PARTNERS EMERGINGMARKETS EQUITY FUNDJANUARY 31, 2018 (Unaudited)
PREFERRED STOCK — 1.9%
Shares Value
BRAZIL — 1.9%Itau Unibanco Holding , 0.50%
(Cost $9,081,576) . . . . . . . . . . . . . . . . . . . . . . . . . . . . . . . . . . . . . . . . . . . . 739,234 $ 12,198,604
Total Investments — 96.7%(Cost $526,562,838) . . . . . . . . . . . . . . . . . . . . . . . . . . . . . . . . . . . . . . . . . $ 622,565,087
Percentages are based on Net Assets of $643,857,485.
* Non-income producing security.^ Trades on the London Stock Exchange and the U.S. OTC Markets.(A) Securities sold within terms of a private placement memorandum, exempt from
registration under Section 144A of the Securities Act of 1933, as amended, and may besold only to dealers in that program or other “accredited investors.” These securitieshave been determined to be liquid under guidelines established by the board ofTrustees.
ADR—American Depositary ReceiptCl —ClassGDR—Global Depositary ReceiptPJSC—Public Joint Stock Company
The following is a summary of the inputs used as of January 31, 2018 in valuing the Fund’sinvestments carried at value:
Investments in Securities Level 1 Level 2 Level 3 Total
Common StockArgentina $ 20,410,945 $ — $ — $ 20,410,945Brazil 32,253,044 — — 32,253,044China 152,521,354 — — 152,521,354Hong Kong 25,737,036 — — 25,737,036Hungary 11,550,432 — — 11,550,432India 49,596,843 — — 49,596,843Indonesia 57,630,338 — — 57,630,338Mexico 14,412,229 — — 14,412,229Netherlands 21,036,622 — — 21,036,622Russia 75,136,716 — — 75,136,716South Africa 6,320,077 — — 6,320,077South Korea 35,282,765 — — 35,282,765
The accompanying notes are an integral part of the financial statements.
8

THE ADVISORS’ INNER CIRCLE FUND III GQG PARTNERS EMERGINGMARKETS EQUITY FUNDJANUARY 31, 2018 (Unaudited)
Investments in Securities Level 1 Level 2 Level 3 Total
Taiwan $ 20,385,020 $ — $ — $ 20,385,020Thailand 18,867,853 — — 18,867,853United States 36,562,708 — — 36,562,708
Total Common Stock $ 577,703,982 $ — $ — 577,703,982
Participation NotesChina — 32,662,501 — 32,662,501
Total Participation
Notes — 32,662,501 — 32,662,501
Preferred Stock 12,198,604 — — 12,198,604
Total Investments in Securities $ 589,902,586 $ 32,662,501 $ — $ 622,565,087
For the period ended January 31, 2018, there were no transfers between levels, if any, arerecognized by the Fund at the end of the period.
The accompanying notes are an integral part of the financial statements.
9

THE ADVISORS’ INNER CIRCLE FUND III GQG PARTNERS EMERGINGMARKETS EQUITY FUNDJANUARY 31, 2018 (Unaudited)
STATEMENT OF ASSETS AND LIABILITIESAssets:
Investments, at Value (Cost $526,562,838) . . . . . . . . . . . . . . . . . . . . . . . . . . . . . . . . . . . . . . . . $ 622,565,087Foreign Currency, at Value (Cost $19,332) . . . . . . . . . . . . . . . . . . . . . . . . . . . . . . . . . . . . . . . . . 19,334Cash Equivalent . . . . . . . . . . . . . . . . . . . . . . . . . . . . . . . . . . . . . . . . . . . . . . . . . . . . . . . . . . . . . . . . . . . 21,533,823Receivable for Capital Shares Sold . . . . . . . . . . . . . . . . . . . . . . . . . . . . . . . . . . . . . . . . . . . . . . . . . 6,694,064Receivable for Investment Securities Sold . . . . . . . . . . . . . . . . . . . . . . . . . . . . . . . . . . . . . . . . . 6,406,823Dividend Receivable . . . . . . . . . . . . . . . . . . . . . . . . . . . . . . . . . . . . . . . . . . . . . . . . . . . . . . . . . . . . . . . 140,617Reclaim Receivable . . . . . . . . . . . . . . . . . . . . . . . . . . . . . . . . . . . . . . . . . . . . . . . . . . . . . . . . . . . . . . . . 776Other Prepaid Expenses . . . . . . . . . . . . . . . . . . . . . . . . . . . . . . . . . . . . . . . . . . . . . . . . . . . . . . . . . . . 29,202
Total Assets . . . . . . . . . . . . . . . . . . . . . . . . . . . . . . . . . . . . . . . . . . . . . . . . . . . . . . . . . . . . . . . . . . . . . . . . . 657,389,726
Liabilities:Payable for Investment Securities Purchased . . . . . . . . . . . . . . . . . . . . . . . . . . . . . . . . . . . . . . 12,428,269Accrued Foreign Capital Gains Tax . . . . . . . . . . . . . . . . . . . . . . . . . . . . . . . . . . . . . . . . . . . . . . . . . 514,664Payable to Investment Adviser . . . . . . . . . . . . . . . . . . . . . . . . . . . . . . . . . . . . . . . . . . . . . . . . . . . . 427,783Payable to Administrator . . . . . . . . . . . . . . . . . . . . . . . . . . . . . . . . . . . . . . . . . . . . . . . . . . . . . . . . . . 42,155Payable for Capital Shares Redeemed . . . . . . . . . . . . . . . . . . . . . . . . . . . . . . . . . . . . . . . . . . . . . 24,200Unrealized Loss on Foreign Spot Currency Contracts . . . . . . . . . . . . . . . . . . . . . . . . . . . . . . . 12,331Shareholder Servicing Fees Payable, Investor Shares . . . . . . . . . . . . . . . . . . . . . . . . . . . . . . 3,566Chief Compliance Officer Fees Payable . . . . . . . . . . . . . . . . . . . . . . . . . . . . . . . . . . . . . . . . . . . . 2,006Other Accrued Expenses and Other Payables . . . . . . . . . . . . . . . . . . . . . . . . . . . . . . . . . . . . . . 77,267
Total Liabilities . . . . . . . . . . . . . . . . . . . . . . . . . . . . . . . . . . . . . . . . . . . . . . . . . . . . . . . . . . . . . . . . . . . . . . 13,532,241
Net Assets . . . . . . . . . . . . . . . . . . . . . . . . . . . . . . . . . . . . . . . . . . . . . . . . . . . . . . . . . . . . . . . . . . . . . . . . . . . $ 643,857,485
Net Assets Consist of:Paid-in Capital . . . . . . . . . . . . . . . . . . . . . . . . . . . . . . . . . . . . . . . . . . . . . . . . . . . . . . . . . . . . . . . . . . . . $ 552,280,902Distribution in Excess of Net Investment Income . . . . . . . . . . . . . . . . . . . . . . . . . . . . . . . . . . (898,378)Accumulated Net Realized Loss on Investments and Foreign Currency
Transactions . . . . . . . . . . . . . . . . . . . . . . . . . . . . . . . . . . . . . . . . . . . . . . . . . . . . . . . . . . . . . . . . . . . . (3,037,853)Net Unrealized Appreciation on Investments . . . . . . . . . . . . . . . . . . . . . . . . . . . . . . . . . . . . . . 96,002,249Accrued Foreign Capital Gains Tax on Appreciated Securities . . . . . . . . . . . . . . . . . . . . . . (514,664)Net Unrealized Appreciation on Foreign Currency and Translation of Other Assets
and Liabilities Denominated in Foreign Currencies . . . . . . . . . . . . . . . . . . . . . . . . . . . . . . 25,229
Net Assets . . . . . . . . . . . . . . . . . . . . . . . . . . . . . . . . . . . . . . . . . . . . . . . . . . . . . . . . . . . . . . . . . . . . . . . . . . . $ 643,857,485
Investor Shares:Net Assets . . . . . . . . . . . . . . . . . . . . . . . . . . . . . . . . . . . . . . . . . . . . . . . . . . . . . . . . . . . . . . . . . . . . . . . . $ 10,471,381Outstanding Shares of beneficial interest (unlimited authorization — no par
value) . . . . . . . . . . . . . . . . . . . . . . . . . . . . . . . . . . . . . . . . . . . . . . . . . . . . . . . . . . . . . . . . . . . . . . . . . . 726,002Net Asset Value, Offering and Redemption Price Per Share . . . . . . . . . . . . . . . . . . . . . . . . $14.42
Institutional Shares:Net Assets . . . . . . . . . . . . . . . . . . . . . . . . . . . . . . . . . . . . . . . . . . . . . . . . . . . . . . . . . . . . . . . . . . . . . . . . $ 628,146,374Outstanding Shares of beneficial interest (unlimited authorization — no par
value) . . . . . . . . . . . . . . . . . . . . . . . . . . . . . . . . . . . . . . . . . . . . . . . . . . . . . . . . . . . . . . . . . . . . . . . . . . 43,442,530Net Asset Value, Offering and Redemption Price Per Share . . . . . . . . . . . . . . . . . . . . . . . . $14.46
R6 Shares:Net Assets . . . . . . . . . . . . . . . . . . . . . . . . . . . . . . . . . . . . . . . . . . . . . . . . . . . . . . . . . . . . . . . . . . . . . . . . $ 5,239,730Outstanding Shares of beneficial interest (unlimited authorization — no par
value) . . . . . . . . . . . . . . . . . . . . . . . . . . . . . . . . . . . . . . . . . . . . . . . . . . . . . . . . . . . . . . . . . . . . . . . . . . 362,368Net Asset Value, Offering and Redemption Price Per Share . . . . . . . . . . . . . . . . . . . . . . . . $14.46
The accompanying notes are an integral part of the financial statements.
10

THE ADVISORS’ INNER CIRCLE FUND III GQG PARTNERS EMERGINGMARKETS EQUITY FUNDFOR THE PERIOD ENDEDJANUARY 31, 2018 (Unaudited)
STATEMENT OF OPERATIONS
Investment Income:Dividends . . . . . . . . . . . . . . . . . . . . . . . . . . . . . . . . . . . . . . . . . . . . . . . . . . . . . . . . . . . . . . . . . . . . . . . . . . $ 1,912,485Less: Foreign Taxes Withheld . . . . . . . . . . . . . . . . . . . . . . . . . . . . . . . . . . . . . . . . . . . . . . . . . . . . . . . (203,023)
Total Investment Income . . . . . . . . . . . . . . . . . . . . . . . . . . . . . . . . . . . . . . . . . . . . . . . . . . . . . . . . . . . . . 1,709,462
Expenses:Investment Advisory Fees . . . . . . . . . . . . . . . . . . . . . . . . . . . . . . . . . . . . . . . . . . . . . . . . . . . . . . . . . . 1,918,931Administration Fees . . . . . . . . . . . . . . . . . . . . . . . . . . . . . . . . . . . . . . . . . . . . . . . . . . . . . . . . . . . . . . . . 187,888Trustees’ Fees . . . . . . . . . . . . . . . . . . . . . . . . . . . . . . . . . . . . . . . . . . . . . . . . . . . . . . . . . . . . . . . . . . . . . . 7,315Shareholder Serving Fees, Investor Shares . . . . . . . . . . . . . . . . . . . . . . . . . . . . . . . . . . . . . . . . . . 5,865Chief Compliance Officer Fees . . . . . . . . . . . . . . . . . . . . . . . . . . . . . . . . . . . . . . . . . . . . . . . . . . . . . . 2,942Custodian Fees . . . . . . . . . . . . . . . . . . . . . . . . . . . . . . . . . . . . . . . . . . . . . . . . . . . . . . . . . . . . . . . . . . . . . 67,253Transfer Agent Fees . . . . . . . . . . . . . . . . . . . . . . . . . . . . . . . . . . . . . . . . . . . . . . . . . . . . . . . . . . . . . . . . 47,035Offering Costs . . . . . . . . . . . . . . . . . . . . . . . . . . . . . . . . . . . . . . . . . . . . . . . . . . . . . . . . . . . . . . . . . . . . . . 43,046Registration and Filing Fees . . . . . . . . . . . . . . . . . . . . . . . . . . . . . . . . . . . . . . . . . . . . . . . . . . . . . . . . . 34,168Legal Fees . . . . . . . . . . . . . . . . . . . . . . . . . . . . . . . . . . . . . . . . . . . . . . . . . . . . . . . . . . . . . . . . . . . . . . . . . . 17,446Printing Fees . . . . . . . . . . . . . . . . . . . . . . . . . . . . . . . . . . . . . . . . . . . . . . . . . . . . . . . . . . . . . . . . . . . . . . . 12,939Audit Fees . . . . . . . . . . . . . . . . . . . . . . . . . . . . . . . . . . . . . . . . . . . . . . . . . . . . . . . . . . . . . . . . . . . . . . . . . . 12,157Other Expenses . . . . . . . . . . . . . . . . . . . . . . . . . . . . . . . . . . . . . . . . . . . . . . . . . . . . . . . . . . . . . . . . . . . . 13,554
Total Expenses . . . . . . . . . . . . . . . . . . . . . . . . . . . . . . . . . . . . . . . . . . . . . . . . . . . . . . . . . . . . . . . . . . . . . . . 2,370,539
Less:Waiver of Investment Advisory Fees . . . . . . . . . . . . . . . . . . . . . . . . . . . . . . . . . . . . . . . . . . . . . . . . (183,195)
Net Expenses . . . . . . . . . . . . . . . . . . . . . . . . . . . . . . . . . . . . . . . . . . . . . . . . . . . . . . . . . . . . . . . . . . . . . . . . . 2,187,344
Net Investment Loss . . . . . . . . . . . . . . . . . . . . . . . . . . . . . . . . . . . . . . . . . . . . . . . . . . . . . . . . . . . . . . . . . . (477,882)
Net Realized Loss on:Investments . . . . . . . . . . . . . . . . . . . . . . . . . . . . . . . . . . . . . . . . . . . . . . . . . . . . . . . . . . . . . . . . . . . . . . . . (1,594,707)Foreign Currency Transactions . . . . . . . . . . . . . . . . . . . . . . . . . . . . . . . . . . . . . . . . . . . . . . . . . . . . . . (33,061)
Net Realized Loss . . . . . . . . . . . . . . . . . . . . . . . . . . . . . . . . . . . . . . . . . . . . . . . . . . . . . . . . . . . . . . . . . . . . . (1,627,768)
Net Change in Unrealized Appreciation (Depreciation) on:Investments . . . . . . . . . . . . . . . . . . . . . . . . . . . . . . . . . . . . . . . . . . . . . . . . . . . . . . . . . . . . . . . . . . . . . . . . 81,934,365Accrued Foreign Capital Gains Tax on Appreciated Securities . . . . . . . . . . . . . . . . . . . . . . . (514,664)Foreign Currency Translation . . . . . . . . . . . . . . . . . . . . . . . . . . . . . . . . . . . . . . . . . . . . . . . . . . . . . . . 36,739
Net Change in Unrealized Appreciation (Depreciation) . . . . . . . . . . . . . . . . . . . . . . . . . . . . . . . 81,456,440
Net Realized and Unrealized Gain on Investments and Foreign CurrencyTransactions . . . . . . . . . . . . . . . . . . . . . . . . . . . . . . . . . . . . . . . . . . . . . . . . . . . . . . . . . . . . . . . . . . . . . . . 79,828,672
Net Increase in Net Assets Resulting from Operations . . . . . . . . . . . . . . . . . . . . . . . . . . . . . . . . $ 79,350,790
The accompanying notes are an integral part of the financial statements.
11

THE ADVISORS’ INNER CIRCLE FUND III GQG PARTNERS EMERGINGMARKETS EQUITY FUND
STATEMENT OF CHANGES IN NET ASSETSSix Months
EndedJanuary 31, 2018
(Unaudited)
PeriodEnded
July 31, 2017*
Operations:Net Investment Income/Loss . . . . . . . . . . . . . . . . . . . . . . . . . . . . . . . . . $ (477,882) $ 901,286Net Realized Loss on Investments and Foreign Currency
Transactions . . . . . . . . . . . . . . . . . . . . . . . . . . . . . . . . . . . . . . . . . . . . . . (1,627,768) (1,504,263)Net Change in Unrealized Appreciation on Investments,
accrued foreign capital gains tax on appreciate securitiesand Foreign Currency Translation . . . . . . . . . . . . . . . . . . . . . . . . . . 81,456,440 14,056,374
Net Increase in Net Assets Resulting From Operations . . . . . . 79,350,790 13,453,397
Dividends and Distributions from:Net Investment Income
Investor Shares . . . . . . . . . . . . . . . . . . . . . . . . . . . . . . . . . . . . . . . . . . . . (11,557) –Institutional Shares . . . . . . . . . . . . . . . . . . . . . . . . . . . . . . . . . . . . . . . . (1,215,032) –R6 Shares . . . . . . . . . . . . . . . . . . . . . . . . . . . . . . . . . . . . . . . . . . . . . . . . . (1,015) –
Total Dividends and Distributions . . . . . . . . . . . . . . . . . . . . . . . . . . . (1,227,604) –
Capital Share Transactions(1):Investor Shares
Issued . . . . . . . . . . . . . . . . . . . . . . . . . . . . . . . . . . . . . . . . . . . . . . . . . . . . . 7,655,356 1,975,203Reinvestment of Distributions . . . . . . . . . . . . . . . . . . . . . . . . . . . . . 11,205 –Redeemed . . . . . . . . . . . . . . . . . . . . . . . . . . . . . . . . . . . . . . . . . . . . . . . . (319,601) –
Net Investor Shares Transactions . . . . . . . . . . . . . . . . . . . . . . . . . . . . 7,346,960 1,975,203
Institutional SharesIssued . . . . . . . . . . . . . . . . . . . . . . . . . . . . . . . . . . . . . . . . . . . . . . . . . . . . . 353,338,798 190,409,952Reinvestment of Distributions . . . . . . . . . . . . . . . . . . . . . . . . . . . . . 496,879 –Redeemed . . . . . . . . . . . . . . . . . . . . . . . . . . . . . . . . . . . . . . . . . . . . . . . . (3,978,172) (2,427,695)
Net Institutional Shares Transactions . . . . . . . . . . . . . . . . . . . . . . . 349,857,505 187,982,257
R6 SharesIssued . . . . . . . . . . . . . . . . . . . . . . . . . . . . . . . . . . . . . . . . . . . . . . . . . . . . . 4,870,658 260,140Reinvestment of Distributions . . . . . . . . . . . . . . . . . . . . . . . . . . . . . 1,014 –Redeemed . . . . . . . . . . . . . . . . . . . . . . . . . . . . . . . . . . . . . . . . . . . . . . . . (12,835) –
Net R6 Shares Transactions . . . . . . . . . . . . . . . . . . . . . . . . . . . . . . . . . . 4,858,837 260,140
Net Increase in Net Assets From Capital ShareTransactions . . . . . . . . . . . . . . . . . . . . . . . . . . . . . . . . . . . . . . . . . . . . . . 362,063,302 190,217,600
Total Increase in Net Assets . . . . . . . . . . . . . . . . . . . . . . . . . . . . . . . . . 440,186,488 203,670,997
Net Assets:Beginning of Period . . . . . . . . . . . . . . . . . . . . . . . . . . . . . . . . . . . . . . . . . . 203,670,997 –
End of Period (including Undistributed/(Distributions inexcess of) Net Investment Income of $(898,378) and$807,108) . . . . . . . . . . . . . . . . . . . . . . . . . . . . . . . . . . . . . . . . . . . . . . . . . $ 643,857,485 $ 203,670,997
* The Fund commenced operations on December 28, 2016.(1) See Note 7 in Notes to Financial Statements.
The accompanying notes are an integral part of the financial statements.
12

THE ADVISORS’ INNER CIRCLE FUND III GQG PARTNERS EMERGINGMARKETS EQUITY FUND
FINANCIAL HIGHLIGHTS
Selected Per Share Data & RatiosFor a Share Outstanding
Throughout the Period
Investor Shares
Six MonthsEnded
January 31,2018
(Unaudited)
PeriodEnded
July 31,2017(1)
Net Asset Value, Beginning of Period . . . . . . . . . . . . . . . . . . . . . . . . . . . . . . . . . . . . . . . . . . . . . $ 12.14 $ 10.00
Income from Investment Operations:Net Investment Income (Loss)* . . . . . . . . . . . . . . . . . . . . . . . . . . . . . . . . . . . . . . . . . . . . . . . . (0.04) 0.12Net Realized and Unrealized Gain . . . . . . . . . . . . . . . . . . . . . . . . . . . . . . . . . . . . . . . . . . . . . . 2.34 2.02
Total from Investment Operations . . . . . . . . . . . . . . . . . . . . . . . . . . . . . . . . . . . . . . . . . . . . . . . . 2.30 2.14
Dividends and Distributions:Net Investment Income . . . . . . . . . . . . . . . . . . . . . . . . . . . . . . . . . . . . . . . . . . . . . . . . . . . . . . . . (0.02) –
Total Dividends and Distributions . . . . . . . . . . . . . . . . . . . . . . . . . . . . . . . . . . . . . . . . . . . . . . . . . (0.02) –
Net Asset Value, End of Period . . . . . . . . . . . . . . . . . . . . . . . . . . . . . . . . . . . . . . . . . . . . . . . . . . . $ 14.42 $ 12.14
Total Return† . . . . . . . . . . . . . . . . . . . . . . . . . . . . . . . . . . . . . . . . . . . . . . . . . . . . . . . . . . . . . . . . . . . . 18.99% 21.40%
Ratios and Supplemental DataNet Assets, End of Period (Thousands) . . . . . . . . . . . . . . . . . . . . . . . . . . . . . . . . . . . . . . . . . . . . $10,471,381 $2,123Ratio of Expenses to Average Net Assets . . . . . . . . . . . . . . . . . . . . . . . . . . . . . . . . . . . . . . . . . . 1.33%†† 1.33%††Ratio of Expenses to Average Net Assets (Excluding Waivers) . . . . . . . . . . . . . . . . . . . . . 1.42%†† 1.95%††Ratio of Net Investment Income (Loss) to Average Net Assets . . . . . . . . . . . . . . . . . . . . . (0.53)%†† 1.83%††Portfolio Turnover Rate . . . . . . . . . . . . . . . . . . . . . . . . . . . . . . . . . . . . . . . . . . . . . . . . . . . . . . . . . . 23%‡ 45%‡
* Per share calculations were performed using average shares for the period.† Total return is for the period indicated and has not been annualized. Returns shown do not reflect the deductions
of taxes that a shareholder would pay on Fund distributions or the redemption of Fund shares†† Annualized‡ Portfolio turnover is for the period indicated and has not been annualized.(1) The Fund commenced operations on December 28, 2016.
Amounts designated as “—” are either not applicable, $0 or have been rounded to $0.
The accompanying notes are an integral part of the financial statements.
13

THE ADVISORS’ INNER CIRCLE FUND III GQG PARTNERS EMERGINGMARKETS EQUITY FUND
FINANCIAL HIGHLIGHTS
Selected Per Share Data & RatiosFor a Share Outstanding
Throughout the Period
Institutional Shares
Six MonthsEnded
January 31,2018
(Unaudited)
PeriodEnded
July 31,2017(1)
Net Asset Value, Beginning of Period . . . . . . . . . . . . . . . . . . . . . . . . . . . . . . . . . . . . . . . . . . . . . $ 12.17 $ 10.00
Income from Investment Operations:Net Investment Income (Loss)* . . . . . . . . . . . . . . . . . . . . . . . . . . . . . . . . . . . . . . . . . . . . . . . . (0.02) 0.14Net Realized and Unrealized Gain . . . . . . . . . . . . . . . . . . . . . . . . . . . . . . . . . . . . . . . . . . . . . . 2.34 2.03
Total from Investment Operations . . . . . . . . . . . . . . . . . . . . . . . . . . . . . . . . . . . . . . . . . . . . . . . . 2.32 2.17
Dividends and Distributions:Net Investment Income . . . . . . . . . . . . . . . . . . . . . . . . . . . . . . . . . . . . . . . . . . . . . . . . . . . . . . . . (0.03) –
Total Dividends and Distributions . . . . . . . . . . . . . . . . . . . . . . . . . . . . . . . . . . . . . . . . . . . . . . . . . (0.03) –
Net Asset Value, End of Period . . . . . . . . . . . . . . . . . . . . . . . . . . . . . . . . . . . . . . . . . . . . . . . . . . . . $ 14.46 $ 12.17
Total Return† . . . . . . . . . . . . . . . . . . . . . . . . . . . . . . . . . . . . . . . . . . . . . . . . . . . . . . . . . . . . . . . . . . . . 19.11% 21.70%
Ratios and Supplemental DataNet Assets, End of Period (Thousands) . . . . . . . . . . . . . . . . . . . . . . . . . . . . . . . . . . . . . . . . . . . . $628,146,374 $201,233Ratio of Expenses to Average Net Assets . . . . . . . . . . . . . . . . . . . . . . . . . . . . . . . . . . . . . . . . . . 1.08%†† 1.08%††Ratio of Expenses to Average Net Assets (Excluding Waivers) . . . . . . . . . . . . . . . . . . . . . 1.17%†† 1.69%††Ratio of Net Investment Income (Loss) to Average Net Assets . . . . . . . . . . . . . . . . . . . . . (0.23)%†† 2.08%††Portfolio Turnover Rate . . . . . . . . . . . . . . . . . . . . . . . . . . . . . . . . . . . . . . . . . . . . . . . . . . . . . . . . . . . 23%‡ 45%‡
* Per share calculations were performed using average shares for the period.† Total return is for the period indicated and has not been annualized. Returns shown do not reflect the deductions
of taxes that a shareholder would pay on Fund distributions or the redemption of Fund shares†† Annualized‡ Portfolio turnover is for the period indicated and has not been annualized.(1) The Fund commenced operations on December 28, 2016.
Amounts designated as “—” are either not applicable, $0 or have been rounded to $0.
The accompanying notes are an integral part of the financial statements.
14

THE ADVISORS’ INNER CIRCLE FUND III GQG PARTNERS EMERGINGMARKETS EQUITY FUND
FINANCIAL HIGHLIGHTS
Selected Per Share Data & RatiosFor a Share Outstanding
R6 Shares
Six MonthsEnded
January 31,2018
(Unaudited)
PeriodEnded
July 31,2017(1)
Net Asset Value, Beginning of Period . . . . . . . . . . . . . . . . . . . . . . . . . . . . . . . . . . . . . . . . . . . . . . . $ 12.17 $ 10.00
Income from Investment Operations:Net Investment Income (Loss)* . . . . . . . . . . . . . . . . . . . . . . . . . . . . . . . . . . . . . . . . . . . . . . . . . . (0.03) 0.10Net Realized and Unrealized Gain . . . . . . . . . . . . . . . . . . . . . . . . . . . . . . . . . . . . . . . . . . . . . . . . 2.35 2.07
Total from Investment Operations . . . . . . . . . . . . . . . . . . . . . . . . . . . . . . . . . . . . . . . . . . . . . . . . . 2.32 2.17
Dividends and Distributions:Net Investment Income . . . . . . . . . . . . . . . . . . . . . . . . . . . . . . . . . . . . . . . . . . . . . . . . . . . . . . . . . (0.03) –
Total Dividends and Distributions . . . . . . . . . . . . . . . . . . . . . . . . . . . . . . . . . . . . . . . . . . . . . . . . . . (0.03) –
Net Asset Value, End of Period . . . . . . . . . . . . . . . . . . . . . . . . . . . . . . . . . . . . . . . . . . . . . . . . . . . . . $ 14.46 $ 12.17
Total Return† . . . . . . . . . . . . . . . . . . . . . . . . . . . . . . . . . . . . . . . . . . . . . . . . . . . . . . . . . . . . . . . . . . . . . . 19.11% 21.70%
Ratios and Supplemental DataNet Assets, End of Period (Thousands) . . . . . . . . . . . . . . . . . . . . . . . . . . . . . . . . . . . . . . . . . . . . . $5,239,730 $315Ratio of Expenses to Average Net Assets . . . . . . . . . . . . . . . . . . . . . . . . . . . . . . . . . . . . . . . . . . . 1.08%†† 1.08%††Ratio of Expenses to Average Net Assets (Excluding Waivers) . . . . . . . . . . . . . . . . . . . . . . . 1.17%†† 1.85%††Ratio of Net Investment Income (Loss) to Average Net Assets . . . . . . . . . . . . . . . . . . . . . . (0.52)%†† 1.53%††Portfolio Turnover Rate . . . . . . . . . . . . . . . . . . . . . . . . . . . . . . . . . . . . . . . . . . . . . . . . . . . . . . . . . . . . 23%‡ 45%‡
* Per share calculations were performed using average shares for the period.† Total return is for the period indicated and has not been annualized. Returns shown do not reflect the deductions
of taxes that a shareholder would pay on Fund distributions or the redemption of Fund shares†† Annualized‡ Portfolio turnover is for the period indicated and has not been annualized.(1) The Fund commenced operations on December 28, 2016.
Amounts designated as “—” are either not applicable, $0 or have been rounded to $0.
The accompanying notes are an integral part of the financial statements.
15

THE ADVISORS’ INNER CIRCLE FUND III GQG PARTNERS EMERGINGMARKETS EQUITY FUND
NOTES TO FINANCIAL STATEMENTS (Unaudited)
1. Organization:
The Advisors’ Inner Circle Fund III (the “Trust”) is organized as a Delaware statutory trustunder a Declaration of Trust dated December 4, 2013. The Trust is registered under theInvestment Company Act of 1940, as amended, as an open-end management investmentcompany with 17 funds. The financial statements herein are those of the GQG PartnersEmerging Markets Equity Fund (the “Fund”). The investment objective of the Fund is to seeklong-term capital appreciation. The Fund is classified as “non-diversified,” which means thatit may invest a larger percentage of its assets in a smaller number of issuers than a diversifiedfund. GQG Partners LLC serves as the Fund’s investment adviser (the “Adviser”). The Fundcurrently offers Investor Shares, Institutional Shares and R6 Shares. The Fund commencedoperations on December 28, 2016. The financial statements of the remaining funds of theTrust are presented separately. The assets of each fund are segregated, and a shareholder’sinterest is limited to the fund in which shares are held.
2. Significant Accounting Policies:
The following is a summary of the Significant Accounting Policies followed by the Fund.
Use of Estimates — The Fund is an investment company that applies the accountingand reporting guidance issued in Topic 946 by the U.S. Financial Accounting StandardsBoard. The preparation of financial statements in conformity with U.S. generallyaccepted accounting principles (“U.S. GAAP”) requires management to makeestimates and assumptions that affect the fair value of assets and liabilities anddisclosure of contingent assets and liabilities at the date of the financial statementsand the reported amounts of increases and decreases in net assets from operationsduring the reporting period. Actual results could differ from those estimates and suchdifferences could be material.
Security Valuation — Securities listed on a securities exchange, market or automatedquotation system for which quotations are readily available (except for securitiestraded on NASDAQ), including securities traded over the counter, are valued at thelast quoted sale price on an exchange or market (foreign or domestic) on which theyare traded or, if there is no such reported sale on the valuation date, at the mostrecent quoted bid price. For securities traded on NASDAQ, the NASDAQ official closingprice will be used. The prices for foreign securities are reported in local currency andconverted to U.S. dollars using currency exchange rates. Prices for most securities heldin the Fund are provided daily by recognized independent pricing agents. If a securityprice cannot be obtained from an independent, third-party pricing agent, the Fundseeks to obtain a bid price from at least one independent broker.
16

THE ADVISORS’ INNER CIRCLE FUND III GQG PARTNERS EMERGINGMARKETS EQUITY FUND
Securities for which market prices are not “readily available” are valued in accordancewith “Fair Value Procedures” established by the Fund’s Board of Trustees (the “Board”).The Fund’s Fair Value Procedures are implemented through a Fair Value Committee(the “Committee”) designated by the Board. Some of the more common reasons thatmay necessitate that a security be valued using Fair Value Procedures include: thesecurity’s trading has been halted or suspended; the security has been de-listed from anational exchange; the security’s primary trading market is temporarily closed at a timewhen under normal conditions it would be open; the security has not been traded foran extended period of time; the security’s primary pricing source is not able or willingto provide a price; or trading of the security is subject to local government imposedrestrictions. When a security is valued in accordance with the Fair Value Procedures,the Committee will determine the value after taking into consideration relevantinformation reasonably available to the Committee.
For securities that principally trade on a foreign market or exchange, a significant gapin time can exist between the time of a particular security’s last trade and the time atwhich the Fund calculates its net asset value. The closing prices of such securities mayno longer reflect their market value at the time the Fund calculates its net asset valueif an event that could materially affect the value of those securities (a “SignificantEvent”) has occurred between the time of the security’s last close and the time thatthe Fund calculates net asset value. A Significant Event may relate to a single issuer orto an entire market sector. If the Adviser of the Fund becomes aware of a SignificantEvent that has occurred with respect to a security or group of securities after theclosing of the exchange or market on which the security or securities principally trade,but before the time at which the Fund calculates its net asset value, it may requestthat a Committee meeting be called.
The Fund uses MarkIt Fair Value (“MarkIt”) as a third party fair valuation vendor.MarkIt provides a fair value for foreign securities in the Fund based on certain factorsand methodologies (involving, generally, tracking valuation correlations between theU.S. market and each non-U.S. security) applied by MarkIt in the event that there is amovement in the U.S. market that exceeds a specific threshold established by theCommittee. The Committee establishes a “confidence interval” which is used todetermine the level of correlation between the value of a foreign security andmovements in the U.S. market before a particular security is fair valued when thethreshold is exceeded. In the event that the threshold established by the Committee isexceeded on a specific day, the Fund values its non-U.S. securities that exceed theapplicable “confidence interval” based upon the fair values provided by MarkIt. Insuch event, it is not necessary to hold a Committee meeting. In the event that theAdviser believes that the fair values provided by MarkIt are not reliable, the Advisercontacts SEI Investments Global Funds Services (the “Administrator”) and may requestthat a meeting of the Committee be held.
17

THE ADVISORS’ INNER CIRCLE FUND III GQG PARTNERS EMERGINGMARKETS EQUITY FUND
If a local market in which the Fund own securities is closed for one or more days, theFund shall value all securities held in that corresponding currency based on the fairvalue prices provided by MarkIt using the predetermined confidence intervaldiscussed above.
In accordance with U.S. GAAP, the Fund discloses fair value of its investments in ahierarchy that prioritizes the inputs to valuation techniques used to measure the fairvalue. The objective of a fair value measurement is to determine the price that wouldbe received to sell an asset or paid to transfer a liability in an orderly transactionbetween market participants at the measurement date (an exit price). Accordingly, thefair value hierarchy gives the highest priority to quoted prices (unadjusted) in activemarkets for identical assets or liabilities (Level 1) and the lowest priority tounobservable inputs (Level 3). The three levels of the fair value hierarchy aredescribed below:
• Level 1 — Unadjusted quoted prices in active markets for identical, unrestrictedassets or liabilities that the Fund has the ability to access at the measurementdate;
• Level 2 — Other significant observable inputs (includes quoted prices for similarsecurities, interest rates, prepayment speeds, credit risk, referenced indices,quoted prices in inactive markets, adjusted quoted prices in active markets,adjusted quoted prices on foreign equity securities that were adjusted inaccordance with pricing procedures approved by the Board, etc.); and
• Level 3 — Prices, inputs or exotic modeling techniques which are bothsignificant to the fair value measurement and unobservable (supported by littleor no market activity).
Investments are classified within the level of the lowest significant input considered indetermining fair value. Investments classified within Level 3 whose fair valuemeasurement considers several inputs may include Level 1 or Level 2 inputs ascomponents of the overall fair value measurement.
For the period ended January 31, 2018, there have been no significant changes to theFund’s fair valuation methodology.
Federal Income Taxes — It is the Fund’s intention to qualify as a regulated investmentcompany for Federal income tax purposes by complying with the appropriateprovisions of Subchapter M of the Internal Revenue Code of 1986, as amended.Accordingly, no provisions for Federal income taxes have been made in the financialstatements.
The Fund evaluates tax positions taken or expected to be taken in the course ofpreparing the Fund’s tax returns to determine whether it is “more-likely than-not”
18

THE ADVISORS’ INNER CIRCLE FUND III GQG PARTNERS EMERGINGMARKETS EQUITY FUND
(i.e., greater than 50-percent) that each tax position will be sustained uponexamination by a taxing authority based on the technical merits of the position. Taxpositions not deemed to meet the more-likely-than-not threshold are recorded as atax benefit or expense in the current year. The Fund did not record any tax provisionin the current period. However, management’s conclusions regarding tax positionstaken may be subject to review and adjustment at a later date based on factorsincluding, but not limited to, examination by tax authorities (i.e., from commencementof operations, as applicable), on-going analysis of and changes to tax laws, regulationsand interpretations thereof.
As of and during the period ended January 31, 2018, the Fund did not have a liabilityfor any unrecognized tax benefits. The Fund recognizes interest and penalties, if any,related to unrecognized tax benefits as income tax expense in the Statement ofOperations. During the year, the Fund did not incur any significant interest or penalties.
Security Transactions and Investment Income — Security transactions are accountedfor on trade date. Costs used in determining realized gains and losses on the sale ofinvestment securities are based on the specific identification method. Dividendincome and expense are recorded on the ex-dividend date. Interest income isrecognized on the accrual basis from settlement date. Certain dividends from foreignsecurities will be recorded as soon as the Fund is informed of the dividend if suchinformation is obtained subsequent to the ex-dividend date.
Foreign Currency Translation — The books and records of the Fund are maintained inU.S. dollars. Investment securities and other assets and liabilities denominated in aforeign currency are translated into U.S. dollars on the date of valuation. The Funddoes not isolate that portion of realized or unrealized gains and losses resulting fromchanges in the foreign exchange rate from fluctuations arising from changes in themarket prices of the securities. These gains and losses are included in net realized andunrealized gains and losses on investments on the Statement of Operations. Netrealized and unrealized gains and losses on foreign currency transactions representnet foreign exchange gains or losses from foreign currency exchange contracts,disposition of foreign currencies, currency gains or losses realized between trade andsettlement dates on securities transactions and the difference between the amount ofthe investment income and foreign withholding taxes recorded on the Fund’s booksand the U.S. dollar equivalent of the amounts actually received or paid.
Investments in Real Estate Investment Trusts (“REITs”) — Dividend income from REITsis recorded based on the income included in distributions received from the REITinvestments using published REIT reclassifications, including some managementestimates when actual amounts are not available. Distributions received in excessof this estimated amount are recorded as a reduction of the cost of investmentsor reclassified to capital gains. The actual amounts of income,
19

THE ADVISORS’ INNER CIRCLE FUND III GQG PARTNERS EMERGINGMARKETS EQUITY FUND
return of capital, and capital gains are only determined by each REIT after its fiscalyear-end, and may differ from the estimated amounts.
Cash Equivalents — Idle cash may be swept into various money market sweepaccounts and is classified as cash equivalents on the Statements of Assets andLiabilities. The Fund maintains cash in bank deposit accounts which, at times, mayexceed United States federally insured limits. Amounts invested are available on thesame business day.
Expenses — Most expenses of the Trust can be directly attributed to a particular fund.Expenses which cannot be directly attributed to a particular fund are apportionedamong the funds of the Trust based on the number of funds and/or relative net assets.
Classes — Class specific expenses are borne by that class of shares. Income, realizedand unrealized gains (losses), and non-class specific expenses are allocated to therespective class on the basis of relative daily net assets.
Dividends and Distributions to Shareholders — The Fund distributes substantially all ofits net investment income annually. Any net realized capital gains are distributedannually. All distributions are recorded on ex-dividend date.
Deferred Offering Costs — Offering costs, including costs of printing initial prospectus,legal and registration fees, are amortized over twelve-months from inception of theFunds.
3. Transactions with Affiliates:
Certain officers of the Trust are also employees of SEI Investments Global Funds Services (the“Administrator”), a wholly owned subsidiary of SEI Investments Company, and/or SEIInvestments Distribution Co. (the “Distributor”). Such officers are paid no fees by the Trust,other than the Chief Compliance Officer (“CCO”) as described below, for serving as officers ofthe Trust.
The services provided by the (“CCO”) and his staff are paid for by the Trust as incurred. Theservices include regulatory oversight of the Trust’s Advisors and service providers as requiredby SEC regulations. The CCO’s services and fees have been approved by and are reviewed bythe Board.
4. Administration, Shareholder Servicing, Custodian and Transfer Agent Agreements:
The Fund and the Administrator are parties to an Administration Agreement under which theAdministrator provides administration services to the Fund. For these services, theAdministrator is paid an asset based fee, which will vary depending on the number of shareclasses and the average daily net assets of the Fund. For the period ended January 31, 2018,the Fund paid $187,888 for these services.
20

THE ADVISORS’ INNER CIRCLE FUND III GQG PARTNERS EMERGINGMARKETS EQUITY FUND
The Fund has adopted a Shareholder Servicing Plan (the “Plan”) that provides that the Fundmay pay financial intermediaries for shareholder services in an annual amount not to exceed0.25% based on the average daily net assets of the Fund’s Investor Shares. The services forwhich financial intermediaries are compensated may include record-keeping, transactionprocessing for shareholders’ accounts and other shareholder services.
Brown Brothers Harriman & Co. acts as custodian (the “Custodian”) for the Fund. TheCustodian plays no role in determining the investment policies of the Fund or whichsecurities are to be purchased or sold by the Fund.
DST Systems, Inc. serves as the transfer agent and dividend disbursing agent for the Fundunder a transfer agency agreement with the Trust.
5. Investment Advisory Agreement:
Under the terms of an investment advisory agreement, the Adviser provides investmentadvisory services to the Fund at a fee calculated at an annual rate of 0.95% of the Fund’saverage daily net assets. The Adviser has contractually agreed to reduce fees and reimburseexpenses to the extent necessary to keep total annual fund operating expenses after feereductions and/or expense reimbursements (excluding any class specific expenses, dividendand interest expenses on securities sold short, interest, taxes, acquired fund fee expensesand non-routine expenses) from exceeding 1.08% of the average daily net assets of each ofthe Fund’s share classes until November 30, 2018 (the “Contractual Expense Limit”). TheAdviser may recover all or a portion of its fee reductions or expense reimbursements, up tothe expense cap in place at the time the expenses were waived, within a three-year periodfrom the year in which it reduced its fee or reimbursed expenses if the Fund’s total annualfund operating expenses are below the Contractual Expense Limit. This agreement may beterminated by the Board for any reason at any time, or by the Adviser, upon ninety (90) days’prior written notice to the Trust, effective as of the close of business on November 30, 2018.As of January 31, 2018, the fees which were previously waived by the Adviser which may besubject to possible future reimbursement, up to the expense cap in place at the time theexpenses were waived, to the Adviser were $263,081 and $183,195 expiring in 2020 and2021, respectively.
6. Investment Transactions:
For the period ended January 31, 2018, the Fund made purchases of $460,622,944 and salesof $87,992,821 in investment securities other than long-term U.S. Government and short-term securities. There were no purchases or sales of long-term U.S. Government securities.
21

THE ADVISORS’ INNER CIRCLE FUND III GQG PARTNERS EMERGINGMARKETS EQUITY FUND
7 . Share Transactions
Six MonthsEnded
January 31,2018*
(Unaudited)
PeriodEnded
July 31,2017*
Investor SharesIssued . . . . . . . . . . . . . . . . . . . . . . . . . . . . . . . . . . . . . . . . . . . . . . . . . . . . . . . . . . . . . . . . . 567,081 174,850Reinvestment of Distributions . . . . . . . . . . . . . . . . . . . . . . . . . . . . . . . . . . . . . . . . . 848 –Redeemed . . . . . . . . . . . . . . . . . . . . . . . . . . . . . . . . . . . . . . . . . . . . . . . . . . . . . . . . . . . . . (16,777) –
Total Investor Shares Transactions . . . . . . . . . . . . . . . . . . . . . . . . . . . . . . . . . . . . . . . . 551,152 174,850
Institutional SharesIssued . . . . . . . . . . . . . . . . . . . . . . . . . . . . . . . . . . . . . . . . . . . . . . . . . . . . . . . . . . . . . . . . . 27,171,827 16,748,776Reinvestment of Distributions . . . . . . . . . . . . . . . . . . . . . . . . . . . . . . . . . . . . . . . . . 37,529 –Redeemed . . . . . . . . . . . . . . . . . . . . . . . . . . . . . . . . . . . . . . . . . . . . . . . . . . . . . . . . . . . . . (305,725) (209,877)
Total Institutional Shares Transactions . . . . . . . . . . . . . . . . . . . . . . . . . . . . . . . . . . . . 26,903,631 16,538,899
R6 SharesIssued . . . . . . . . . . . . . . . . . . . . . . . . . . . . . . . . . . . . . . . . . . . . . . . . . . . . . . . . . . . . . . . . . 337,323 25,843Reinvestment of Distributions . . . . . . . . . . . . . . . . . . . . . . . . . . . . . . . . . . . . . . . . . 77 –Redeemed . . . . . . . . . . . . . . . . . . . . . . . . . . . . . . . . . . . . . . . . . . . . . . . . . . . . . . . . . . . . . (875) –
Total R6 Shares Transactions . . . . . . . . . . . . . . . . . . . . . . . . . . . . . . . . . . . . . . . . . . . . . 336,525 25,843
Net Increase in Shares Outstanding From Share Transactions . . . . . . . . . . . . 27,791,308 16,739,592
* The Fund commenced operations on December 28, 2016
8. Federal Tax Information:
The amount and character of income and capital gain distributions to be paid, if any, aredetermined in accordance with Federal income tax regulations, which may differ from U.S.GAAP. As a result, net investment income (loss) and net realized gain (loss) on investmenttransactions for a reporting period may differ significantly from distributions during suchperiod. These book/tax differences may be temporary or permanent. To the extent thesedifferences are permanent in nature, they are charged or credited to undistributed netinvestment income (loss), accumulated net realized gain (loss) or paid-in capital, asappropriate, in the period that the differences arise.
22

THE ADVISORS’ INNER CIRCLE FUND III GQG PARTNERS EMERGINGMARKETS EQUITY FUND
As of July 31, 2017, the components of Distributable Earnings on a tax basis were asfollows:
Undistributed Ordinary Income . . . . . . . . . . . . . . . . . . . . . . . . . . . . . . . . . . . . . . . . . . . . . . . . . . . . . . . . . . . . . $ 1,227,505Short-Term Capital Loss Carryforwards . . . . . . . . . . . . . . . . . . . . . . . . . . . . . . . . . . . . . . . . . . . . . . . . . . . . . (991,284)Unrealized Appreciation . . . . . . . . . . . . . . . . . . . . . . . . . . . . . . . . . . . . . . . . . . . . . . . . . . . . . . . . . . . . . . . . . . . 13,178,695Other Temporary Differences . . . . . . . . . . . . . . . . . . . . . . . . . . . . . . . . . . . . . . . . . . . . . . . . . . . . . . . . . . . . . . . 38,481
Total Distributable Earnings . . . . . . . . . . . . . . . . . . . . . . . . . . . . . . . . . . . . . . . . . . . . . . . . . . . . . . . . . . . . . . . . $ 13,453,397
For Federal income tax purposes, capital losses may be carried forward and applied againstfuture capital gains. Net capital losses earned may be carried forward indefinitely and mustretain the character of the original loss.
For Federal income tax purposes the difference between Federal tax cost and book costprimarily relates to wash sales which cannot be used for Federal income tax purposes inthe current year and have been deferred for use in future years and passive foreigninvestment companies. The Federal tax cost and aggregate gross unrealized appreciationand depreciation for the investments held (excluding foreign currency) by the Fund atJanuary 31, 2018, were as follows:
Federal Tax Cost
AggregateGross
UnrealizedAppreciation
AggregateGross
UnrealizedDepreciation
NetUnrealized
Appreciation
$ 526,562,838 $ 99,739,090 $ (3,736,841) $ 96,002,249
9. Concentration of Risks:
As with all management investment companies, a shareholder of the Fund is subject to therisk that his or her investment could lose money. The Fund is subject to the principal risksnoted below, any of which may adversely affect the Fund’s net asset value (“NAV”) andability to meet its investment objective.
Equity Risk — Since it purchases equity securities, the Fund is subject to the risk that stockprices may fall over short or extended periods of time. Historically, the equity market hasmoved in cycles, and the value of the Fund’s securities may fluctuate from day to day.Individual companies may report poor results or be negatively affected by industry and/oreconomic trends and developments. The prices of securities issued by such companies maysuffer a decline in response. These factors contribute to price volatility, which is the principalrisk of investing in the Fund.
Foreign Company Risk — Investing in foreign companies, including direct investments andinvestments through depositary receipts, poses additional risks since political and economicevents unique to a country or region will affect those markets and their issuers. Theserisks will not necessarily affect the U.S. economy or similar issuers located
23

THE ADVISORS’ INNER CIRCLE FUND III GQG PARTNERS EMERGINGMARKETS EQUITY FUND
in the U.S. Securities of foreign companies may not be registered with the U.S. Securities andExchange Commission (the “SEC”) and foreign companies are generally not subject to theregulatory controls imposed on U.S. issuers and, as a consequence, there is generally lesspublicly available information about foreign securities than is available about domesticsecurities. Income from foreign securities owned by the Fund may be reduced by awithholding tax at the source, which tax would reduce income received from the securitiescomprising the portfolio. Foreign securities may also be more difficult to value than securitiesof U.S. issuers. While depositary receipts provide an alternative to directly purchasing theunderlying foreign securities in their respective national markets and currencies, investmentsin depositary receipts continue to be subject to many of the risks associated with investingdirectly in foreign securities.
Foreign Currency Risk — As a result of the Fund’s investments in securities denominated in,and/or receiving revenues in, foreign currencies, the Fund will be subject to currency risk.Currency risk is the risk that foreign currencies will decline in value relative to the U.S. dollaror, in the case of hedged positions, that the U.S. dollar will decline in value relative to thecurrency hedged. In either event, the dollar value of an investment in the Fund would beadversely affected.
The Fund is classified as “non-diversified,” which means it may invest a larger percentage ofits assets in a smaller number of issuers than a diversified fund. To the extent that the Fundinvests its assets in a smaller number of issuers, the Fund will be more susceptible tonegative events affecting those issuers than a diversified fund.
10. Concentration of Shareholders:
At January 31, 2018, the percentages held by shareholders for each Fund, which arecomprised of individual shareholders and omnibus accounts that are held on behalf ofvarious individual shareholders, each owning 10% or greater of the aggregate sharesoutstanding, was as follows:
No. ofShareholders
%Ownership
GQG Partners Emerging Markets Equity Fund, Institutional Shares 2 58%GQG Partners Emerging Markets Equity Fund, Investor Shares 2 76%GQG Partners Emerging Markets Equity Fund, R6 Shares 3 84%
11. Indemnifications:
In the normal course of business, the Fund enters into contracts that provide generalindemnifications. The Fund’s maximum exposure under these arrangements is dependenton future claims that may be made against the Fund and, therefore, cannot
24

THE ADVISORS’ INNER CIRCLE FUND III GQG PARTNERS EMERGINGMARKETS EQUITY FUND
be established; however, based on experience, the risk of loss from such claim is consideredremote.
12. Regulatory Matters
In October 2016, the U.S. Securities and Exchange Commission adopted new rules andamended existing rules (together, final rules) intended to modernize the reporting anddisclosure of information by registered investment companies. In part, the final rulesamended Regulation S-X and require standardized, enhanced disclosures about derivatives ininvestment company financial statements, as well as other amendments. As of August 1,2017, management has implemented the amendments to Regulation S-X, which did not havea material impact on the Fund’s financial statements and related disclosures or impact theFund’s net assets or results of operations.
13. Subsequent Events:
The Fund has evaluated the need for additional disclosures and/or adjustments resultingfrom subsequent events through the date the financial statements were issued. Based on thisevaluation, no additional disclosures and/or adjustments were required to the financialstatements as of January 31, 2018.
25
THE ADVISORS’ INNER CIRCLE FUND III GQG PARTNERS EMERGINGMARKETS EQUITY FUND
DISCLOSURE OF FUND EXPENSES (Unaudited)
All mutual funds have operating expenses. As a shareholder of a mutual fund, yourinvestment is affected by these ongoing costs, which include (among others) costs for Fundmanagement, administrative services, and shareholder reports like this one. It is importantfor you to understand the impact of these costs on your investment returns.
Operating expenses such as these are deducted from the mutual fund’s gross income anddirectly reduce your final investment return. These expenses are expressed as a percentageof the mutual fund’s average net assets; this percentage is known as the mutual fund’sexpense ratio.
The following examples use the expense ratio and are intended to help you understand theongoing costs (in dollars) of investing in your Fund and to compare these costs with those ofother mutual funds. The examples are based on an investment of $1,000 made at thebeginning of the period shown and held for the entire period from August 1, 2017 toJanuary 31, 2018).
The table on the next page illustrates your Fund’s costs in two ways:
• Actual Fund Return. This section helps you to estimate the actual expenses after feewaivers that your Fund incurred over the period. The “Expenses Paid During Period” columnshows the actual dollar expense cost incurred by a $1,000 investment in the Fund, and the“Ending Account Value” number is derived from deducting that expense cost from the Fund’sgross investment return.
You can use this information, together with the actual amount you invested in the Fund, toestimate the expenses you paid over that period. Simply divide your ending starting accountvalue by $1,000 to arrive at a ratio (for example, an $8,600 account value divided by$1,000 = 8.6), then multiply that ratio by the number shown for your Fund under “ExpensesPaid During Period.”
• Hypothetical 5% Return. This section helps you compare your Fund’s costs with those ofother mutual funds. It assumes that the Fund had an annual 5% return before expensesduring the year, but that the expense ratio (Column 3) for the period is unchanged. Thisexample is useful in making comparisons because the Securities and Exchange Commissionrequires all mutual funds to make this 5% calculation. You can assess your Fund’scomparative cost by comparing the hypothetical result for your Fund in the “Expense PaidDuring Period” column with those that appear in the same charts in the shareholder reportsfor other mutual funds.
26
THE ADVISORS’ INNER CIRCLE FUND III GQG PARTNERS EMERGINGMARKETS EQUITY FUND
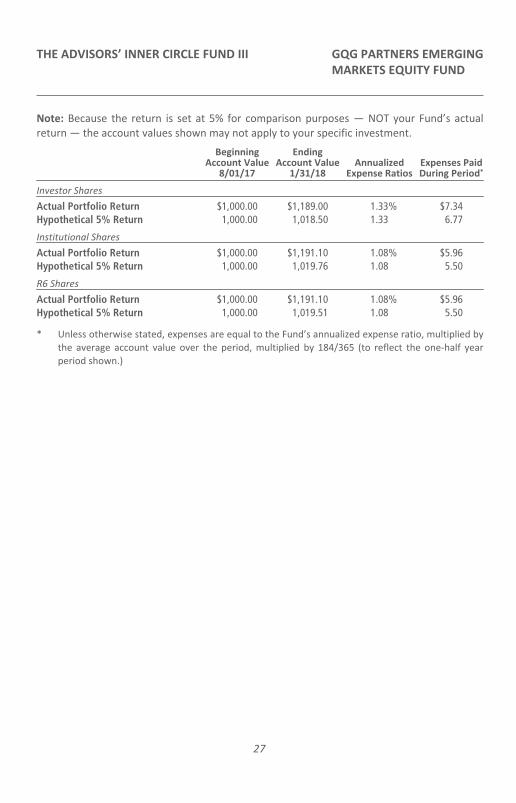
Note: Because the return is set at 5% for comparison purposes — NOT your Fund’s actualreturn — the account values shown may not apply to your specific investment.
BeginningAccount Value
8/01/17
EndingAccount Value
1/31/18Annualized
Expense RatiosExpenses PaidDuring Period*
Investor Shares
Actual Portfolio Return $1,000.00 $1,189.00 1.33% $7.34Hypothetical 5% Return 1,000.00 1,018.50 1.33 6.77
Institutional Shares
Actual Portfolio Return $1,000.00 $1,191.10 1.08% $5.96Hypothetical 5% Return 1,000.00 1,019.76 1.08 5.50
R6 Shares
Actual Portfolio Return $1,000.00 $1,191.10 1.08% $5.96Hypothetical 5% Return 1,000.00 1,019.51 1.08 5.50
* Unless otherwise stated, expenses are equal to the Fund’s annualized expense ratio, multiplied bythe average account value over the period, multiplied by 184/365 (to reflect the one-half yearperiod shown.)
27

NOTES

NOTES

GQG Partners Emerging Markets Equity FundP.O. Box 219009
Kansas City, MO 64121-90091-866-362-8333
Investment Adviser:GQG Partners LLC
350 East Las Olas Boulevard, Suite 1100Fort Lauderdale, Florida 33301
Administrator:SEI Investments Global Funds Services
One Freedom Valley DriveOaks, PA 19456
Distributor:SEI Investments Distribution Co.
One Freedom Valley DriveOaks, PA 19456
Legal Counsel:Morgan, Lewis & Bockius LLP
1701 Market StreetPhiladelphia, PA 19103
This information must be preceded or accompanied by a current prospectus forthe Fund described.
GQG-SA-001-0200