gpg 2012 post election
TRANSCRIPT

ELECTION 2012 Post-Election Analysis
ELECTION OVERVIEW
Landscape: Lead-Up To The Election
Presidential Results: What happened? Presidential Results: How did it happen?
Congressional Results: What happened?
Looking Ahead: What does this mean going forward?
1

TAKEAWAYS
Race was trending toward Obama leading in to Election Day
Growing economic optimism
Improving job approval numbers
Obama maintained 2008 coalition
Youth, Latino, African-American, Women (especially unmarried women) all turned out and supported Obama
Coalition supplemented by Midwest support cemented by auto-bailout
2

TAKEAWAYS
Organization won
Romney spent more on ads in all but one swing state
But Obama had more than twice as many field offices in each swing state
It was a very close election/ we are still largely an evenly divided country
Partisan Primaries cost Republicans
Moves perceptions of the party to the right, alienating key segments of voters
Costs Republicans winnable Senate seats for 2nd cycle in a row
3
LANDSCAPE Lead-Up To The Election

Source: Pollster.com Aggregate Data
OBAMA JUMPED AHEAD OF ROMNEY IN CLOSING DAYS
As of November 6, 2012: OBAMA 48.6% ROMNEY 47.6%
Romney Secures nomination
Conventions
Debates
Hurricane Sandy
5
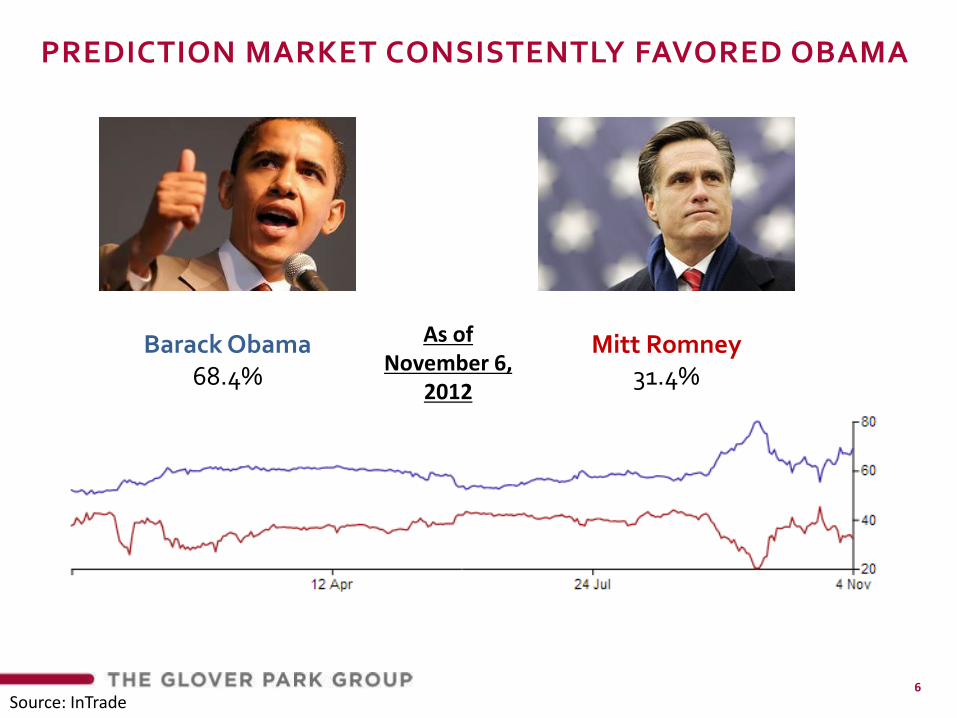
PREDICTION MARKET CONSISTENTLY FAVORED OBAMA
Source: InTrade
Mitt Romney 31.4%
Barack Obama 68.4%
As of November 6,
2012
6
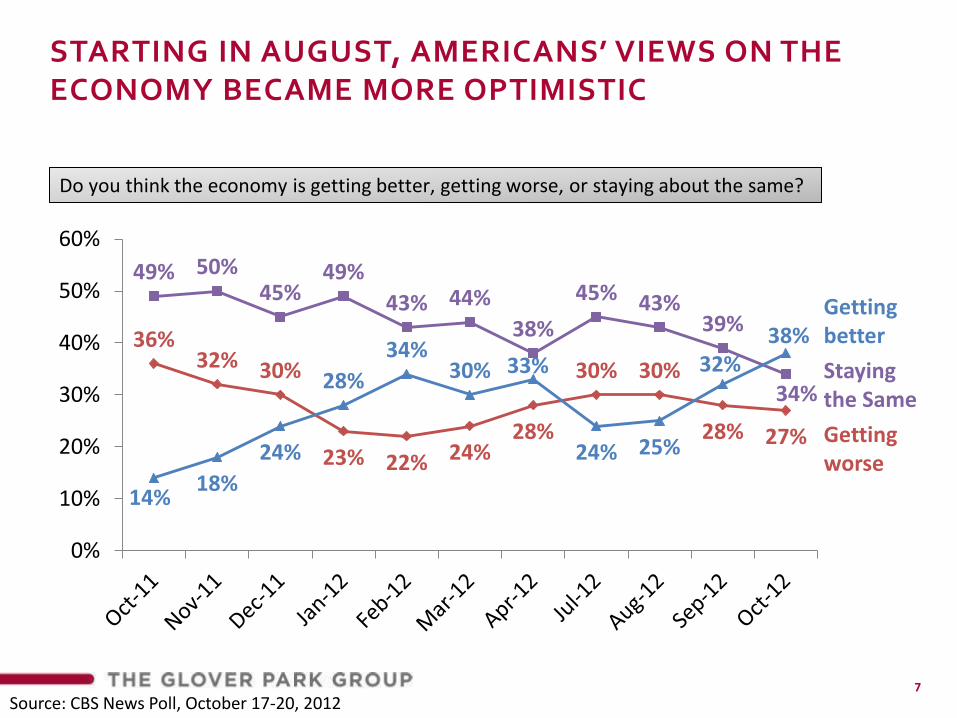
STARTING IN AUGUST, AMERICANS’ VIEWS ON THE ECONOMY BECAME MORE OPTIMISTIC
Source: CBS News Poll, October 17-20, 2012
Do you think the economy is getting better, getting worse, or staying about the same?
36% 32% 30%
23% 22% 24% 28%
30% 30%
28% 27%
49% 50% 45%
49%
43% 44%
38%
45% 43% 39%
34%
14% 18%
24%
28%
34% 30% 33%
24% 25%
32% 38%
0%
10%
20%
30%
40%
50%
60%
Staying the Same
Getting worse
Getting better
7

NUMBER WHO THOUGHT COUNTRY WAS ON THE WRONG TRACK TRENDED DOWN LEADING INTO THE ELECTION
Source: Pollster.com Aggregate Data
October 2004 %
Wrong Track 47
Right Direction 41
Nov 1996 %
Wrong Track 40
Right Direction 41
October 1992 %
Wrong Track 69
Right Direction 16
As of November 6, 2012
A Look Back
Source: NBC News/WSJ
Nov 2008 %
Wrong Track 76
Right Direction 11
October 2000 %
Wrong Track 32
Right Direction 48
Source: NBC News/WSJ
Source: NBC News/WSJ
Source: NBC News/WSJ
Source: NBC News/WSJ
WRONG TRACK 52.8%
RIGHT DIRECTION 41.5%
8

JOB APPROVAL RATINGS FOR INCUMBENT PRESIDENTS SEEKING RE-ELECTION
Source: Historical Gallup Poll Data
Presidential Job Approval January March June October
2012: Barack Obama 44% 46% 47% 50%
2004 George W. Bush 60% 49% 49% 50%
1996: Bill Clinton 42% 54% 58% 58%
1992: George H.W. Bush 46% 41% 37% 33%
1984: Ronald Reagan 52% 54% 55% 58%
1980: Jimmy Carter 56% 43% 32%
1976: Gerald Ford 56% 43% 32%
1972: Richard Nixon 49% 56% 59%
1964: Lyndon Johnson 77% 77% 74%
Selected dates, as available, in year of re-election
President’s in red lost re-election
9

UNEMPLOYMENT RATE DROPPED AS ELECTION APPROACHED, VARIED WIDELY IN SWING STATES
Source: Bureau of Labor Statistics, Jan 2009 – October 2012
2009 2010 2011 2012
7.8
9.5 10.0 9.9 9.8
9.0 9.0 8.3 8.1
7.8
7.9
0.0
2.0
4.0
6.0
8.0
10.0
12.0
Jan
Ap
r
Jul
Oct
Jan
Ap
r
Jul
Oct
Jan
Ap
r
Jul
Oct
Jan
Ap
r
July
Oct
State Unemployment Rate (Sept 2012)
National 7.8%
Nevada 11.8%
North Carolina 9.6%
Florida 8.7%
Colorado 8%
Wisconsin 7.3%
Ohio 7%
Virginia 5.9%
New Hampshire 5.7%
Iowa 5.2%
10

ECONOMIC CONCERNS DRIVE ELECTORAL AGENDA
Source: Gallup Poll, October 15-16, 2012
What do you think is the most important problem facing this country today?
32%
36%
25% 26%
30%
26% 25%
22% 25%
28%
23%
32%
26%
31% 30% 26%
31% 31% 31% 32% 31% 31% 29%
31%
29%
37%
13% 13% 16% 15% 16%
13% 12% 14%
12% 13% 15%
12% 12%
9% 6%
12%
8% 8% 9% 11%
9% 11%
7% 7% 10% 9%
0%
5%
10%
15%
20%
25%
30%
35%
40%
Oct2011
Nov2011
Dec2011
Jan2012
Feb2012
Mar2012
Apr2012
May2012
June2012
July2012
Aug2012
Sept2012
Oct2012
Unemployment Economy
Dissatisfaction with gov't Federal Budget Deficit
PROBLEM %
The economy 37
Unemployment 26
Federal budget deficit 12
Dissatisfaction with gov’t
9
Health care 7
Lack of money 5
Education 4
Foreign aid/Focus overseas
4
Ethical/moral/family decline
4
Results <4% not shown
11
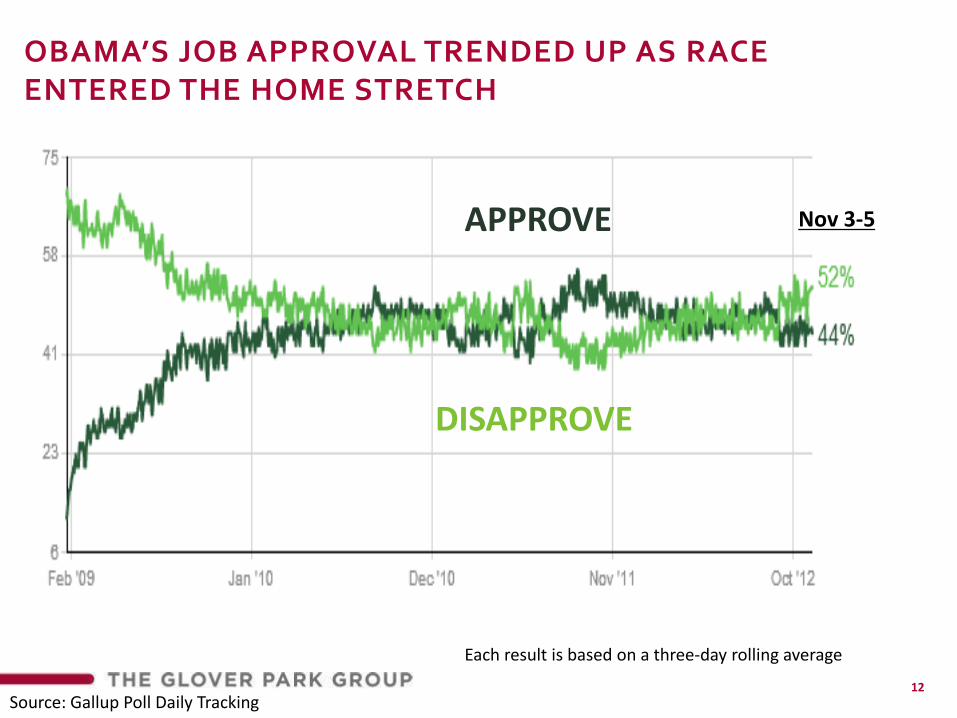
OBAMA’S JOB APPROVAL TRENDED UP AS RACE ENTERED THE HOME STRETCH
DISAPPROVE
APPROVE
Source: Gallup Poll Daily Tracking
Each result is based on a three-day rolling average
Nov 3-5
12

PRESIDENTIAL RESULTS What Happened?
OR
AK
KY
NM
MN
CO
GA
NC
NH
3 11
7
55 5
4 3
5
10 5
9
3
3
4
4
3
4
34
31
6
7
10
7
11
6
9 6 9 15
27
8 15
13
11
21 11
10 17
20 21
8 5
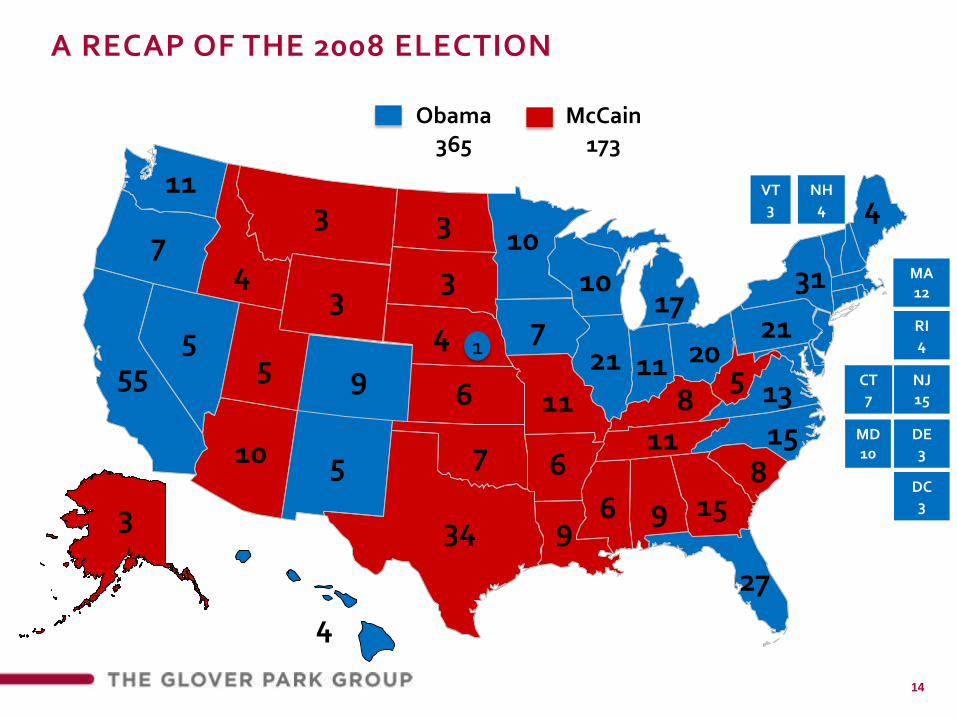
Obama 365
McCain 173
1
VT 3
RI 4
NJ 15
CT 7
DE 3
MD 10
DC 3
MA 12
NH 4
A RECAP OF THE 2008 ELECTION
14

Obama 332 Romney 206
2012 ELECTION RESULTS – OBAMA ONLY LOSES TWO STATES FROM 2008 MAP
OR
AK
KY
NM
MN
CO
GA
NC
NH
3 12
7
55 6
4 3
6
11 5
9
3
3
5
4
3
4
38
29
6
7
10
6
10
6
8 6 9 16
29
9 15
13
11
20 11
10 16
18 20
8 5
Party change from ‘08
VT 3
RI 4
NJ 15
CT 7
DE 3
MD 10
DC 3
MA 12
NH 4
Obama currently ahead in Florida, still counting absentee ballots 15

PRESIDENTIAL RESULTS How Did It Happen?

“THE ECONOMY” WAS #1 ISSUE AND SLIGHTLY FAVORED ROMNEY, BUT NOT ENOUGH FOR THE WIN
Source: 2012 Exit Polls
Economy 59% (+4R)
Health Care 18%
(+34R)
Federal Budget Deficit
15% (+51D)
Foreign Policy 5% (+23D)
17

BUT A DEEPER DIVE ON ECONOMIC MEASURES SHOWS ROMNEY ONLY OUTPERFORMS ON TAXES
Which ONE of these four is the biggest economic problem facing people like you?
Unemployment Rising Prices Taxes Housing Market
38%
+10D
37%
Tie
14%
+34R
8%
+31D
Source: 2012 Exit Polls 18

FEW ARE SEEING PROGRESS FINANCIALLY, BUSH STILL BLAMED FOR CURRENT ECONOMIC PROBLEMS
Source: CNN and MSNBC exit polls
Total Obama Romney
Better today 25% 84% 15%
Worse today 33% 18% 80%
About the same 41% 58% 40%
Obama wins among those who believe things are the same from four years ago.
Total Obama Romney
Barack Obama 38% 5% 94%
George W. Bush 53% 85% 12%
Compared to four years ago, is your family's financial situation:
Who is more to blame for current economic problems?
Voters still blame George Bush for current economic problems.
19

ROMNEY WINS ON NEARLY ALL TRAITS, YET OBAMA STILL WON ELECTION
Has a vision for the future 29%
Spread
+9R
Total
Shares my values 27% +13R
Cares about people like me 21% +63D
Is a strong leader 18% +23R
Source: 2012 Exit Polls 20

PRESIDENT OBAMA’S SUPPORT OF THE AUTO BAILOUT HELPED HIM IN CRITICAL SWING STATES
How do you feel about the federal government's aid to U.S. automakers?
Approve Approve Approve
62%
+53D
53% 60%
Source: 2012 Exit Polls
+59D +48D
Michigan Wisconsin Ohio
21

WHITE VOTE CONTINUES TO DECLINE AS % OF ELECTORATE
% of Electorate
2004 2008 2012
White 77% 74% 72%
Black 12% 13% 13%
Hispanic/Latino 8% 8% 10%
Source: 2004-2012 Exit Polls
Spread
2004 2008 2012
White +17R +12R +20R
Black +77D +91D +87D
Hispanic/Latino +9D +36D +44D
22
Hispanic vote growing
And trending toward Obama

LATINO TURNOUT UP TWO POINTS, SUPPORT FOR OBAMA STRENGTHENS FROM 2008
% of Electorate
2004 2008 2012
National 8 9 10
Colorado 8 13 11
Florida 15 14 16
Nevada 10 15 19
North Carolina 1 3 4
Ohio 3 4 3
Virginia 3 5 5
Wisconsin 2 3 4
The Latino vote grew, especially in Florida and Nevada
Obama’s margins increased – especially in Florida and Colorado
Spread
2004 2008 2012
National +9D +36D +44D
Colorado +38D +23D +49D
Florida +12R +15D +22D
Nevada +21D +54D +45D
North Carolina - - +31D
Ohio +30D - +16 D
Virginia - +31D +32 D
Wisconsin +4D - +37D
Source: 2004-2012 Exit Polls 23

SHIFT AWAY FROM OBAMA AMONG ALL AGE GROUPS EXCEPT 30-44 YEAR OLDS
% of Electorate
2004 2008 2012
18-29 17 18 19
30-44 29 29 27
45-64 30 37 38
65+ 24 16 16
Source: 2004-2012 Exit Polls
Spread
2004 2008 2012
18-29 +9D +34D +23D
30-44 +7R +6D +7D
45-64 +3R +1D +4R
65+ +8R +8R +12R
24

GENDER DIVIDE WIDENS TO 18 POINTS FROM 12 IN 2008
Source: 2004-2012 Exit Polls
+11 R
+1D
+7R
+3D
+13D +11D
Men
Women
2004 2008 2012
25

PARTISAN DIVIDE REMAINS STEADY FROM 2008
2004 2008 2012
Democrat 38% 39% 38%
Independent 26% 29% 29%
Republican 38% 32% 32%
Party Split Even D+7 D+6
Source: 2004-2012 Exit Polls 26

ROMNEY HAD CLEAR ADVANTAGE IN ADVERTISING…
Source: National Journal
$ millions
OBAMA ROMNEY Overall
Spending
Advantage Campaign
Outside
Spending Total Campaign
Outside
Spending Total
Colorado $29.8 $9.1 $38.3 $17.0 $24.5 $41.5 $3.1
Florida $66.7 $11.1 $77.7 $44.0 $60.3 $104.3 $26.6
Iowa $24.6 $4.0 $28.6 $16.5 $26.1 $42.6 $14.0
Nevada $22.2 $3.7 $25.8 $12.2 $20.2 $32.4 $6.6
New Hampshire $21.4 $.05 $21.5 $5.5 $11.9 $17.4 $4.2
North Carolina $24.2 $0 $24.2 $17.1 $28.1 $45.2 $21.0
Ohio $72.8 $18.9 $91.7 $43.2 $57.4 $100.6 $8.9
Virginia $52.9 $13.8 $66.8 $33.2 $49.3 $82.5 $15.7
Wisconsin $11.2 $3.6 $14.7 $7.7 $23.3 $31.0 $16.3
Barack Obama Total Spending: $389.3 million
Campaign Spending: $333.4 million PAC Spending: $64.2 million
Romney Swing State Advertising Spending Advantage +$108.2 million
Mitt Romney Total Spending: $497.5 million
Campaign Spending: $196.4 million PAC Spending: $301.0 million
27
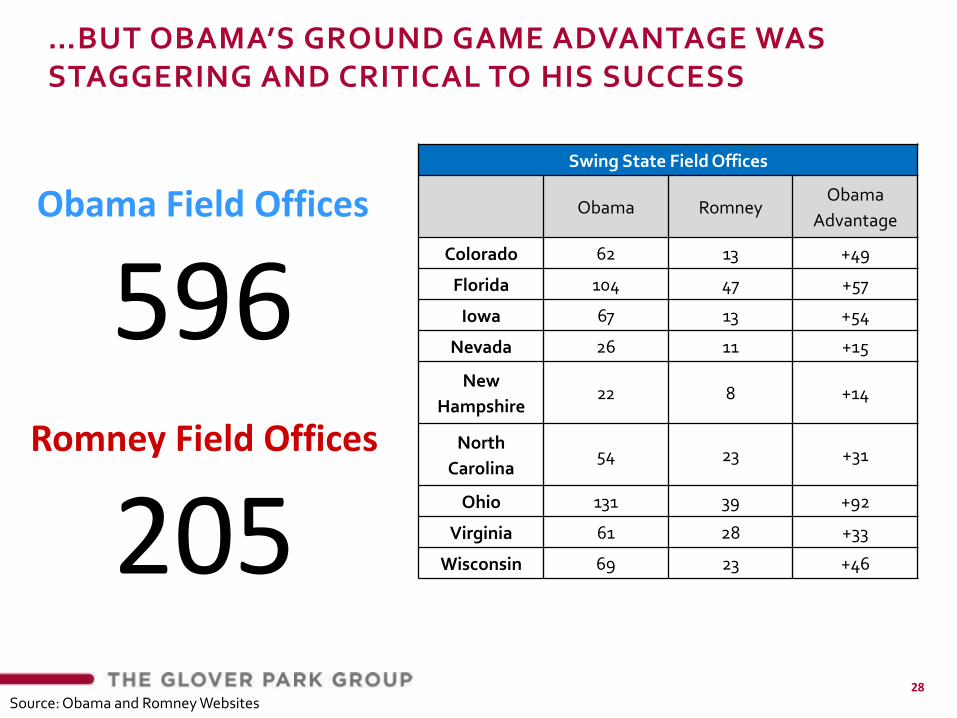
…BUT OBAMA’S GROUND GAME ADVANTAGE WAS STAGGERING AND CRITICAL TO HIS SUCCESS
Source: Obama and Romney Websites
Swing State Field Offices
Obama Romney Obama
Advantage
Colorado 62 13 +49
Florida 104 47 +57
Iowa 67 13 +54
Nevada 26 11 +15
New
Hampshire 22 8 +14
North
Carolina 54 23 +31
Ohio 131 39 +92
Virginia 61 28 +33
Wisconsin 69 23 +46
Romney Field Offices
205
Obama Field Offices
596
28

OBAMA’S VOTER CONTACT EFFORTS GREATLY EXCEEDED ROMNEY’S AND MAY HAVE PERSUADED LATE DECIDERS
Source: Obama and Romney Campaigns
Obama Campaign made
125 million
personal contacts*
Romney Campaign made
50 million
personal contacts**
**Since the spring *Since the last election
When did you finally decide for whom to vote in the presidential election?
% Spread
Just today 3 +7D
In the last few days 6 +5D
In October 11 +1D
In September 9 +8R
Before that 69 +7D
29
CONGRESSIONAL RESULTS What Happened?
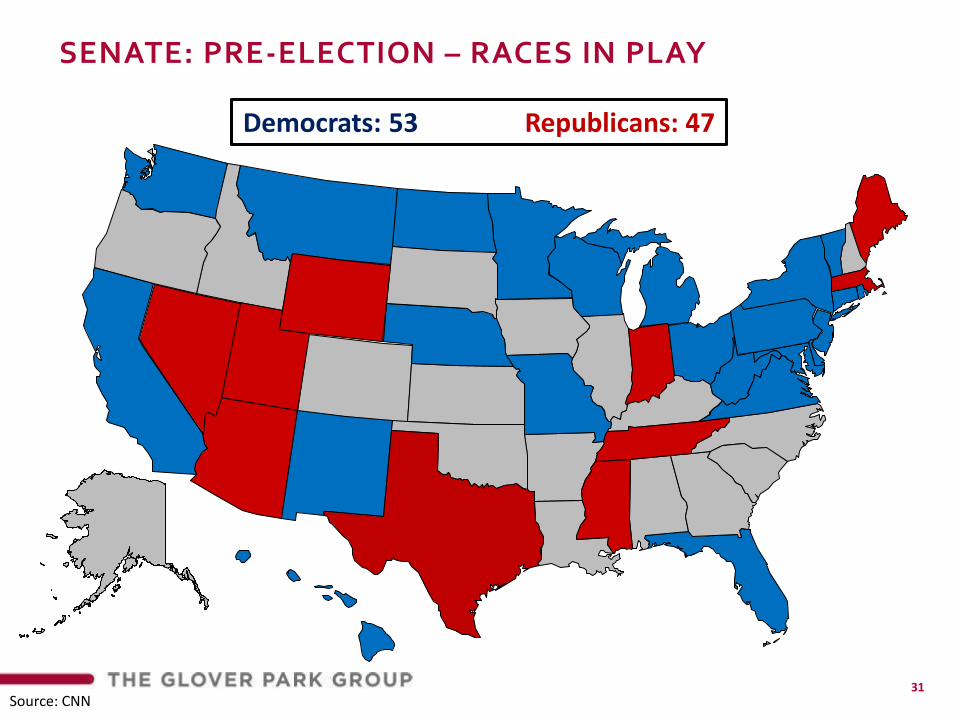
SENATE: PRE-ELECTION – RACES IN PLAY
Democrats: 53 Republicans: 47
OR
AK
KY
NM
MN
CO
GA
NC
Source: CNN 31

SENATE: POST-ELECTION – DEMS GAIN TWO SEATS
Democrats: 55 (+2) Republicans: 45 (-2)
OR
AK
KY
NM
MN
CO
GA
NC
NH
Warren(D): 53.7% Brown (R-i): 46.3%
King (D/I): 53.0% Summers (R): 30.6% Dill (D): 13.1%
Donelly (D): 49.9% Mourdock (R): 44.4%
Fischer(R): 58.2% Kerrey (D): 41.8%
Source: CNN 32

HOUSE OVERVIEW: NO MAJOR SHIFTS, POSSIBLE DEM PICKUP AS TEN RACES REMAIN UNDECIDED
Democrats Republicans
Pre-Election 256 179
Gains / Losses -64 +64
Results 192 (44%) 243 (56%)
2010
Source: CNN
Democrats Republicans
Pre-Election 193 242
Results 192 233
2012
10 Races Remain Undecided
33

LOOKING AHEAD What Does This Mean Going Forward?

HOT ISSUES FOR NEW CONGRESS
Obama Romney
EXPAND IT OR LEAVE IT AS IS (44%) 87% 11%
Expand it (26%) 92% 5%
Leave It As Is (18%) 80% 19%
REPEAL SOME OF IT OR ALL OF IT (49%) 15% 83%
Repeal some of it (24%) 27% 72%
Repeal all of it (25%) 3% 93%
2010 Health Care Law
Source: 2012 Exit Polls 35

HOT ISSUES FOR NEW CONGRESS
Obama Romney
Increase For All (13%) 52% 44%
Increase Only On Income Over $250K
(47%) 70% 29%
Not Increase Them For Anyone (35%)
23% 75%
Income Taxes
Obama Romney
Favors the Wealthy (55%) 71% 26%
Is Fair to Most Americans (39%)
22% 77%
U.S. Economic
System
Source: 2012 Exit Polls 36

HOT ISSUES FOR NEW CONGRESS
Obama Romney
Offered a chance to apply for legal
status (65%) 61% 37%
Deported to the country they came
from (28%) 24% 73%
Immigration
Should most illegal immigrants working in the United States be:
Source: 2012 Exit Polls 37
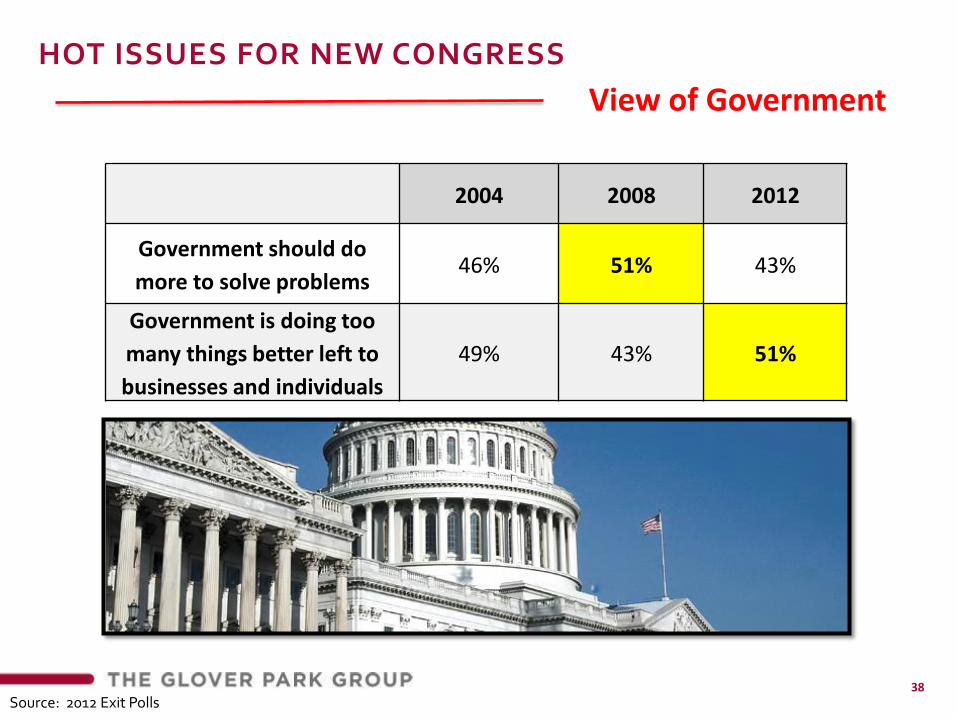
HOT ISSUES FOR NEW CONGRESS
View of Government
2004 2008 2012
Government should do
more to solve problems 46% 51% 43%
Government is doing too
many things better left to
businesses and individuals
49% 43% 51%
Source: 2012 Exit Polls 38

39
GPG Research
GPG has a full-scale internal research team offering the full complement of qualitative and quantitative public opinion research services. We use research to inform message development and communication strategy, as well as to help clients assess and monitor critical issues and track the effectiveness of strategic communication campaigns.
GPG has a deep experience conducting research about complex political topics with diverse audiences. We go beyond the standard Q&A, using innovative, projective techniques to uncover key insights. The result is actionable research that helps shape our clients’ messaging and strategy.
For more information about this presentation
or to find out more about GPG’s research capabilities contact:
Joel Johnson ([email protected]) or David Cantor ([email protected])

APPENDIX

2007-2008 OBAMA vs. MCCAIN HEAD TO HEAD
41

DOW JONES Over The Past Year
November 7, 2011 12,068.39
November 25, 2011 11,257.55
November 6, 2012 13,245.68
October 5, 2012 13,610.15
Source: Google Finance 42

DOW JONES Since Late January 2009
January 16, 2009 8,281.22
November 6, 2012 13,245.68
March 6, 2011 6,626.94
October 5, 2012 13,610.15
Source: Google Finance 43

YOUTH VOTE WAS KEY TO OBAMA’S WINNING STRATEGY
% of Electorate
2004 2008 2012
National 17 18 19
Colorado 15 14 16
Florida 17 15 15
Iowa 17 17 15
Nevada 16 17 17
New Hampshire 16 18 19
North Carolina 14 18 15
Ohio 21 17 17
Virginia 17 21 19
Wisconsin 20 21 21
Spread
2004 2008 2012
National +9D +34D +23D
Colorado +4 D - -
Florida +17 D +24D +35D
Iowa +7 D +25D +16D
Nevada +14 D +36D +38D
New Hampshire +14 D +24D +30D
North Carolina +13 D +48D +36D
Ohio +14 D +25D +29D
Virginia +8 D +21D +25D
Wisconsin +16 D +29D +24D
Source: 2004-2012 Exit Polls 44

AFRICAN AMERICAN VOTE OVERWHELMINGLY TO SUPPORT OBAMA, TURNOUT UP IN OHIO
% of Electorate
2004 2008 2012
National 11 13 13
Florida 12 13 13
Nevada 7 10 9
North Carolina 26 23 23
Ohio 10 11 15
Virginia 21 20 20
Wisconsin 5 5 7
Spread
2004 2008 2012
National +77D +91D +87D
Florida +73D +92D +91D
Nevada +73D +89D +82D
North Carolina +71D +90D +92D
Ohio +68D +95D +92D
Virginia +75D +84D +87D
Wisconsin +72D +82D +88D
Source: 2004-2012 Exit Polls 45

INDEPENDENTS SHIFTED TOWARD ROMNEY, BUT THE SHIFT WAS NOT LARGE ENOUGH
% of Electorate
2004 2008 2012
National 26 29 29
Colorado 33 39 38
Florida 23 29 33
Iowa 30 33 34
Nevada 26 32 34
New Hampshire 44 45 43
North Carolina 21 27 28
Ohio 25 30 31
Virginia 26 27 29
Wisconsin 27 29 32
Spread
2004 2008 2012
National +1D +8D +5R
Colorado +7D +10D +7R
Florida +16D +7D +1R
Iowa +8D +15D +14D
Nevada +12D +13D +8R
New Hampshire +14D +20D +7D
North Carolina +15R +21R +10R
Ohio +19D +8D +10R
Virginia +10R +1D +10R
Wisconsin +8D +19D +2D
Source: 2004-2012 Exit Polls 46

SENIORS VOTED MORE GOP AND TURNED OUT IN SIMILAR NUMBERS TO 2008, BUT THERE WERE SOME TURNOUT CHANGES WITHIN SWING STATES
% of Electorate
2004 2008 2012
National 16 16 16
Colorado 24 13 17
Florida 27 22 25
Iowa 28 18 26
Nevada 25 15 18
New Hampshire 20 14 15
North Carolina 22 16 22
Ohio 20 17 18
Virginia 19 11 14
Wisconsin 21 14 17
Spread
2004 2008 2012
National +5R +8R +11R
Colorado +13R +9R +14R
Florida +3R +8R +19R
Iowa +3D +1D Tie
Nevada Tie +13R +13R
New Hampshire +5D +13D +11D
North Carolina +11R +13R +24R
Ohio +17R +11R +11R
Virginia +2D + 7R +7R
Wisconsin +8D Tie +5R
Source: 2004-2012 Exit Polls 47

WHITE TURNOUT DOWN, SUPPORT FOR REPUBLICAN UP
% of Electorate
2004 2008 2012
National 77 74 72
Colorado 86 81 81
Florida 70 71 67
Iowa 96 91 93
Nevada 77 69 64
New Hampshire 95 94 93
North Carolina 71 72 70
Ohio 86 83 79
Virginia 72 70 70
Wisconsin 90 89 86
Spread
2004 2008 2012
National +17R +12R +20R
Colorado +15R +2D +11R
Florida +15R +14R +27R
Iowa +1R +4D +4D
Nevada +12R +8R +13R
New Hampshire +1D +10D +5D
North Carolina +46R +29R +32R
Ohio +12R +6R +15R
Virginia +36R +21R +23R
Wisconsin +5R +9D +4R
Source: 2004-2012 Exit Polls 48