government at a glance latin america and the caribbean 2017 · government at a glance latin america...
TRANSCRIPT
Country Fact Sheet
Government at a GlanceLatin America and the Caribbean 2017
The fall in copper price depressed public investment
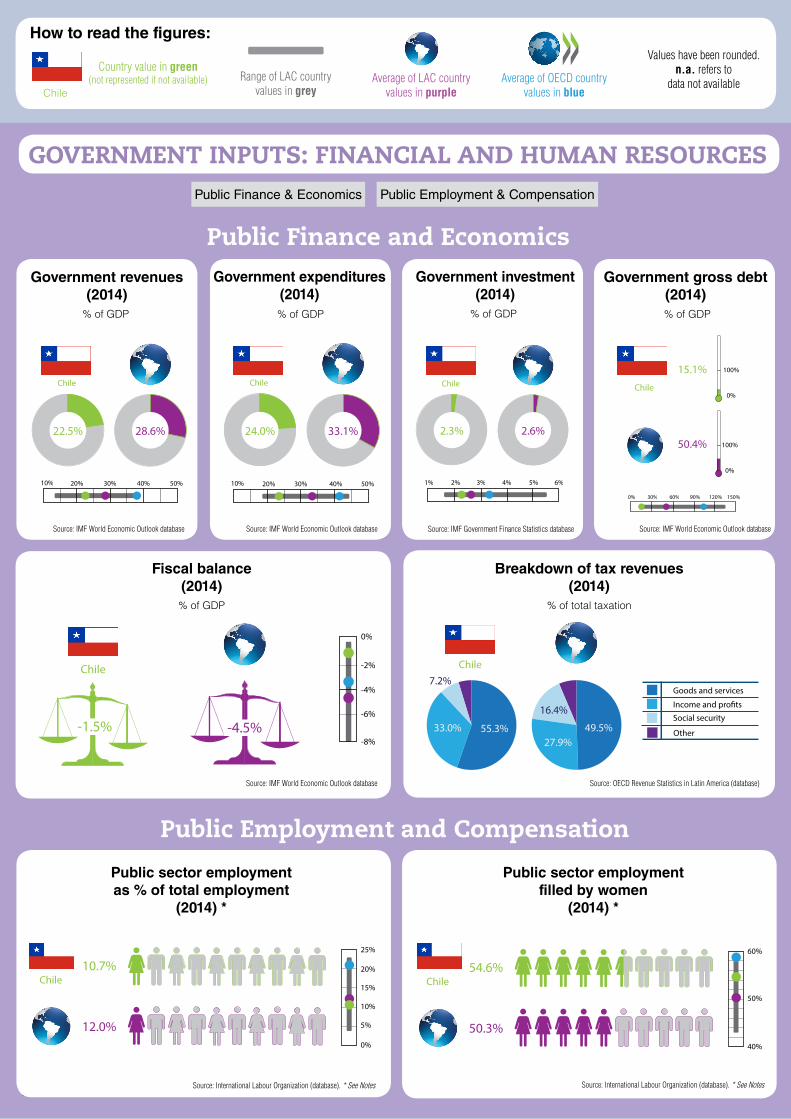
Chile is the largest copper exporter in the world and benefited from the latest commodity boom (2005 to 2010). More recently, as a result of lower copper prices, the share of revenues from non-renewable natural resources (NRNR) in total revenues decreased from 25.2% on average (2005-2009) to 14.4% (2010-2014). This had a negative impact on public investment, which accounted for 2.2% of GDP in 2014, down from 2.7% of GDP in 2009.
Chapter 2: Public finance and economics
2.13. Relative participation of revenues from non-renewable natural resources as a share of total revenues, 2000-04, 2005-09, 2010-142.22. Government investment as a percentage of GDP, 2007, 2009 and 2014
Chile’s HRM practices are the most developed in the LAC region
Chile scores highly on three out of five HRM composite indicators: compensation management (70/100), performance appraisal (73/100) and human resources planning (80/100). This achievement could be par-tially attributed to the implementation of the 2003 labour relations law, which strengthened the functions of the civil service agency, extended the application of competitive hiring processes and reinforced the use of evaluation instruments (such as institutional evaluation and a strategic management model for evaluation).
Chapter 6: Human Resources Management
6.1. HR planning in the public sector (2004, 2012-15)6.5. Performance appraisals (2004, 2012-15)6.7. Compensation management (2004, 2012-15)
Long term fiscal projections are prepared as part of the budgetary process
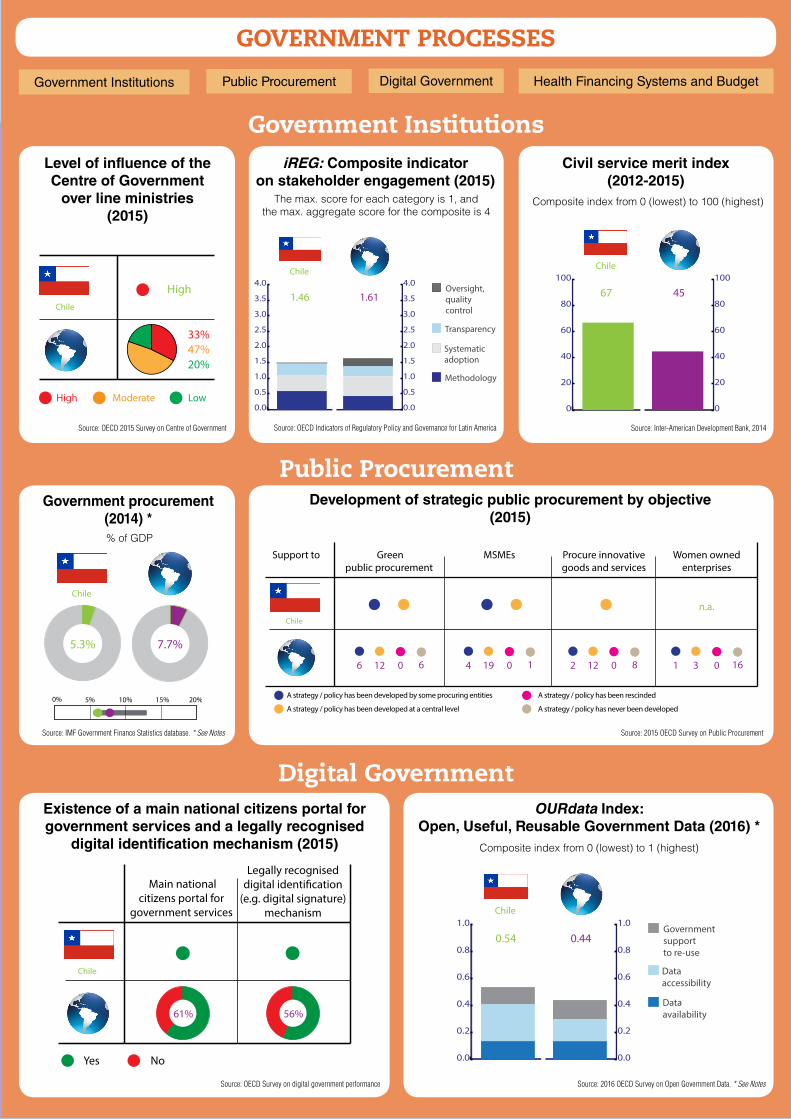
Chile is the only country in the region that publishes budgetary estimates for 11-30 years into the future. Long-term fiscal projections can contribute to the political discussion of a broader reform agenda. However, these projections are uncommon in the LAC region, where over 75% of countries produce estimates cover-ing a maximum of five years.
Chapter 5: Budget Practices and Procedures
5.10. Time span of long-term fiscal projections, 2013
Chile
Government revenues(2014)
Government expenditures(2014)
Government gross debt(2014)
% of GDP % of GDP % of GDP
Source: IMF World Economic Outlook database Source: IMF Government Finance Statistics database
G@G /dataG@G /data
-1.5%
Chile
-4.5%-8%
0%
-2%
-6%
-4%
Fiscal balance(2014)
% of GDP
Government investment(2014)
% of GDP
How to read the figures:
Chile
Country value in green (not represented if not available) Average of OECD country
values in blueRange of LAC country
values in grey
Public Finance & Economics Public Employment & Compensation
Public Finance and Economics
GOVERNMENT INPUTS: FINANCIAL AND HUMAN RESOURCES
Values have been rounded. n.a. refers to
data not availableAverage of LAC country values in purple
Breakdown of tax revenues(2014)
% of total taxation
Chile
55.3%33.0%
7.2%Goods and services
Income and pro�ts
Social security49.5%
27.9%
16.4%
Other
Source: OECD Revenue Statistics in Latin America (database)
Source: IMF World Economic Outlook database
33.1%
10% 20% 30% 40% 50%
24.0%
Chile
2.6%2.3%
Chile
1% 2% 3% 4% 5% 6%
Source: IMF World Economic Outlook database
15.1% 100%
0%
100%
0%
Chile
50.4%
60% 90% 120% 150%30%0%
50.3%
50%
40%
60%
54.6%Chile
Source: IMF World Economic Outlook database
Public Employment and Compensation
G@G /data
Public sector employment filled by women
(2014) *
Source: International Labour Organization (database). * See Notes
Public sector employmentas % of total employment
(2014) *
Source: International Labour Organization (database). * See Notes
12.0% 5%
0%
25%
10%
15%
20%10.7%Chile
10% 20% 30% 40% 50%
28.6%22.5%
Chile
GOVERNMENT PROCESSES
Government Institutions Public Procurement Digital Government
Digital Government
iREG: Composite indicatoron stakeholder engagement (2015)
Source: OECD Indicators of Regulatory Policy and Governance for Latin America
0.0
0.5
1.0
1.5
2.0
2.5
3.0
3.5
4.0
1.46
0.0
0.5
1.0
1.5
2.0
2.5
3.0
3.5
4.0
1.61
Chile
Methodology
Systematicadoption
Transparency
Oversight,qualitycontrol
0
20
40
60
80
100
67
0
20
40
60
80
100
45
Chile
Civil service merit index(2012-2015)
Source: Inter-American Development Bank, 2014
7.7%
0% 5% 10% 15% 20%
5.3%
Chile
Source: IMF Government Finance Statistics database. * See Notes
0.0
0.2
0.4
0.6
0.8
1.0
0.54
0.0
0.2
0.4
0.6
0.8
1.0
0.44
Chile
Dataavailability
Dataaccessibility
Governmentsupportto re-use
Main nationalcitizens portal for
government services
Legally recogniseddigital identi�cation
(e.g. digital signature)mechanism
61%
Yes
56%
No
Chile
Existence of a main national citizens portal forgovernment services and a legally recognised
digital identification mechanism (2015)
Source: OECD Survey on digital government performance
Health Financing Systems and Budget
The max. score for each category is 1, andthe max. aggregate score for the composite is 4
Composite index from 0 (lowest) to 100 (highest)
High Moderate Low
33%47%20%
HighChile
Level of influence of theCentre of Government
over line ministries(2015)
Government Institutions
Source: OECD 2015 Survey on Centre of Government
Development of strategic public procurement by objective(2015)
Public ProcurementGovernment procurement
(2014) *% of GDP
Source: 2015 OECD Survey on Public Procurement
OURdata Index:Open, Useful, Reusable Government Data (2016) *
Composite index from 0 (lowest) to 1 (highest)
Source: 2016 OECD Survey on Open Government Data. * See Notes
Greenpublic procurement
A strategy / policy has been developed by some procuring entities
A strategy / policy has been developed at a central level
MSMEs Procure innovativegoods and services
6 12 0
A strategy / policy has been rescinded
A strategy / policy has never been developed
6 4 19 0 1 2 12 0 8
Support to Women ownedenterprises
1 3 0 16
n.a.Chile

GOVERNMENT PROCESSES
Notes
OUTPUTS AND OUTCOMES
Chile
0.2
0.3
0.4
0.5
0.6Higher
inequality
Lowerinequality
Before After
0.56 0.53
taxes and transfers
Before After
0.52 0.50
taxes and transfers
0.2
0.3
0.4
0.5
0.6
Before After
0.47
0.29taxes and transfers
Higherinequality
Lowerinequality 0.2
0.3
0.4
0.5
0.6
Gini coefficient: Differences in income inequality pre and post-tax and government transfers (2012)
For more information on the data (including full methodology and figure notes) and to consult all other Country Fact Sheets: http://www.oecd.org/gov/government-at-a-glance-lac.htm
* Public sector employment as % of total employment and public sector employment filled by women data for Chile are for 2013. Costs of goods and services financed by general government are not included in government procurement because they are not accounted separately in the IMF Government Finance Statistics (database). OURdata index: Data for Chile are for 2014. Health care financing schemes: Chile has voluntary private and other health insurance schemes but coverage information is not available.
Indicator from 0 (low income concentration) to 100 (high income concentration)
Health Financing Systems And Budget FormulationHealth care financing schemes and percentage of population covered (2015) *
Source: 2015 OECD Survey of Budget Officials on Budgeting Practices for Health in LAC countries. * See Notes
0 20 40 60 80 100 0 20 40 60 80 100
63%39%
6%2%2%4%
76%
19%7%
Socialhealth insurance
Voluntaryprivate insurance
Government�nancing scheme
Chile
Compulsoryprivate insurance
Not coveredby any explicitarrangement
Other0%
n.a.n.a.
Source: OECD Income Distribution Database
Government at a Glance: Latin America and the Caribbean 2017 is the second edition of a joint publication between the Organization for Economic
Co-operation and Development (OECD) and the Inter-American Development Bank (IDB). It provides readers with a dashboard of key indicators to
inform policy making and benchmark specific interventions. The model is the OECD Government at a Glance, which is a fundamental reference,
backed by a well-established methodology for OECD member countries. Compared to the previous edition that had a special focus on Public
Financial Management and alongside with indicators on public finances and public employment this second version covers a wider range of public
management areas including the role and influence of the Centre of Government, Open Government and Open Data policies, Digital Government,
Regulatory Governance and practices for Budgeting in health systems.
Government at a Glance: Latin America and the Caribbean 2017
The Excel spreadsheets used to create the tables and figures in Government at a Glance: Latin America and the Caribbean 2017 are available via the Stat-Links provided throughout the publication: http://dx.doi.org/10.1787/9789264265554-en