goody research - research methods flaws
TRANSCRIPT

GooGoobyby
AK DhamijaAK Dhamija©©
ddyyff ResearchResearch
99--SepSep--090911

Agenda
Warm upSimpson’s ParadoxSix Ways to Misuse DataSix common misperceptions
about the meaning of "statistically significant"Smorgasbord of misused dataThe Assumptions consigned to oblivionFatal DisastersRoad AheadFinal CatastropheSummary
99--SepSep--0909Goofy ResearchGoofy Research22
Warm upSimpson’s ParadoxSix Ways to Misuse DataSix common misperceptions
about the meaning of "statistically significant"Smorgasbord of misused dataThe Assumptions consigned to oblivionFatal DisastersRoad AheadFinal CatastropheSummary

An engineer, a physicist, and a statistician were moosehunting in northern Canada. After a short walk throughthe marshes they spotted a HUGE moose 150 metresaway. The engineer raised his gun and fired at themoose. A puff of dust showed that the bullet landed 3metres to the right of the moose. The physicist,realizing that there was a substantial breeze that theengineer did not account for, aimed to the left of themoose and fired. The bullet landed 3 metres to the leftof the moose. The statistician jumped up and down andscreamed "We got him! We got him!"
Warm up
99--SepSep--0909Goofy ResearchGoofy Research33
An engineer, a physicist, and a statistician were moosehunting in northern Canada. After a short walk throughthe marshes they spotted a HUGE moose 150 metresaway. The engineer raised his gun and fired at themoose. A puff of dust showed that the bullet landed 3metres to the right of the moose. The physicist,realizing that there was a substantial breeze that theengineer did not account for, aimed to the left of themoose and fired. The bullet landed 3 metres to the leftof the moose. The statistician jumped up and down andscreamed "We got him! We got him!"
There are three kinds of lies:Lies, Damned Lies and ^Statistics
99--SepSep--0909Goofy ResearchGoofy Research44
Misused Statistics^
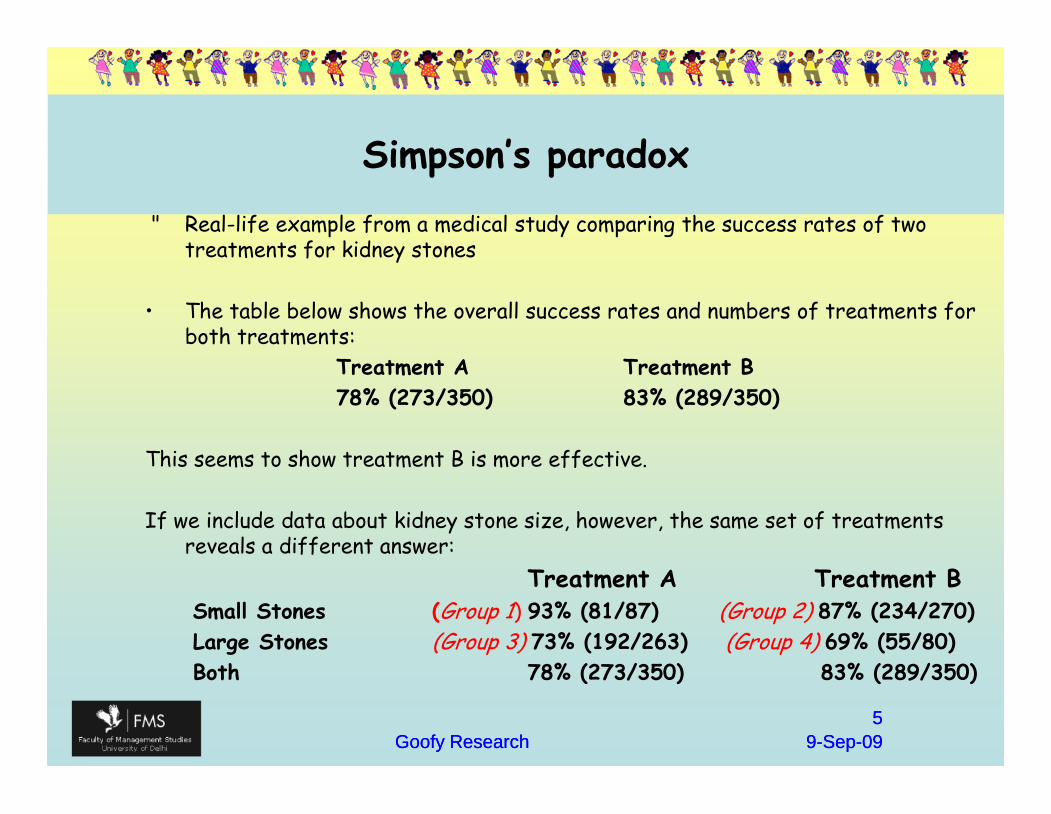
Simpson’s paradox• Real-life example from a medical study comparing the success rates of two
treatments for kidney stones
• The table below shows the overall success rates and numbers of treatments forboth treatments:
Treatment A Treatment B78% (273/350) 83% (289/350)
This seems to show treatment B is more effective.
If we include data about kidney stone size, however, the same set of treatmentsreveals a different answer:
Treatment A Treatment BSmall Stones (Group 1) 93% (81/87) (Group 2) 87% (234/270)Large Stones (Group 3) 73% (192/263) (Group 4) 69% (55/80)Both 78% (273/350) 83% (289/350)
99--SepSep--0909Goofy ResearchGoofy Research55
• Real-life example from a medical study comparing the success rates of twotreatments for kidney stones
• The table below shows the overall success rates and numbers of treatments forboth treatments:
Treatment A Treatment B78% (273/350) 83% (289/350)
This seems to show treatment B is more effective.
If we include data about kidney stone size, however, the same set of treatmentsreveals a different answer:
Treatment A Treatment BSmall Stones (Group 1) 93% (81/87) (Group 2) 87% (234/270)Large Stones (Group 3) 73% (192/263) (Group 4) 69% (55/80)Both 78% (273/350) 83% (289/350)
Simpson’s paradox
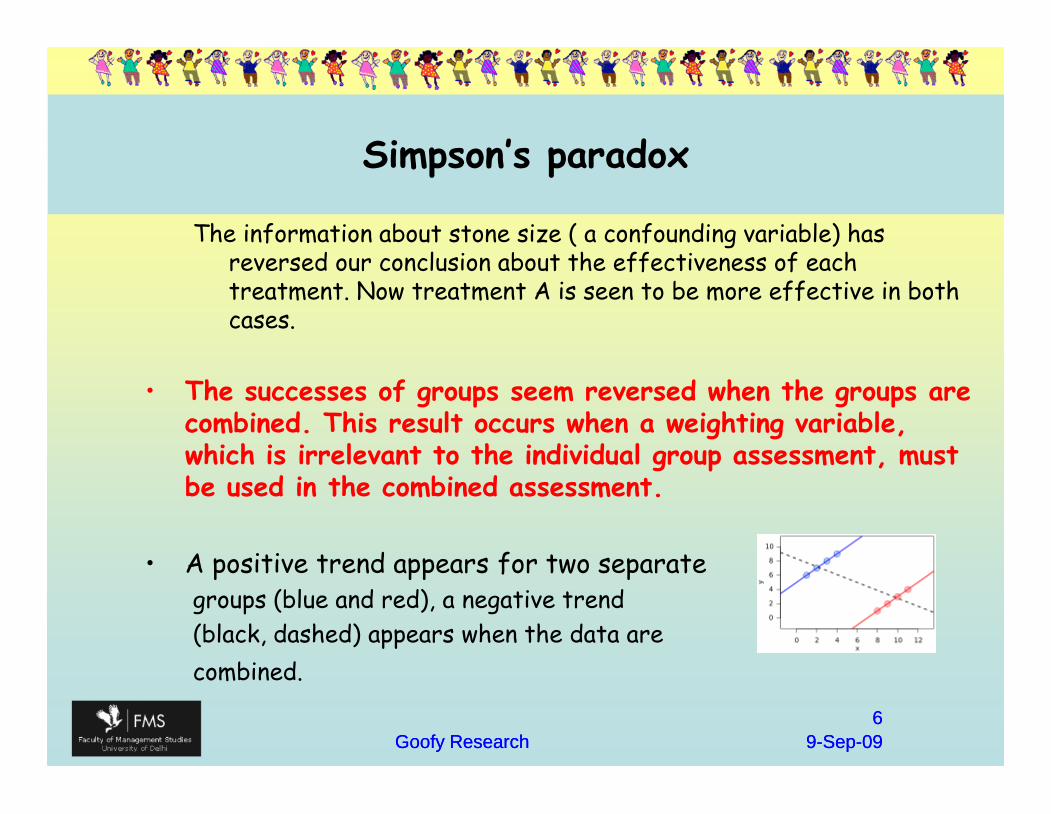
The information about stone size ( a confounding variable) hasreversed our conclusion about the effectiveness of eachtreatment. Now treatment A is seen to be more effective in bothcases.
• The successes of groups seem reversed when the groups arecombined. This result occurs when a weighting variable,which is irrelevant to the individual group assessment, mustbe used in the combined assessment.
• A positive trend appears for two separategroups (blue and red), a negative trend(black, dashed) appears when the data arecombined.
99--SepSep--0909Goofy ResearchGoofy Research66
The information about stone size ( a confounding variable) hasreversed our conclusion about the effectiveness of eachtreatment. Now treatment A is seen to be more effective in bothcases.
• The successes of groups seem reversed when the groups arecombined. This result occurs when a weighting variable,which is irrelevant to the individual group assessment, mustbe used in the combined assessment.
• A positive trend appears for two separategroups (blue and red), a negative trend(black, dashed) appears when the data arecombined.
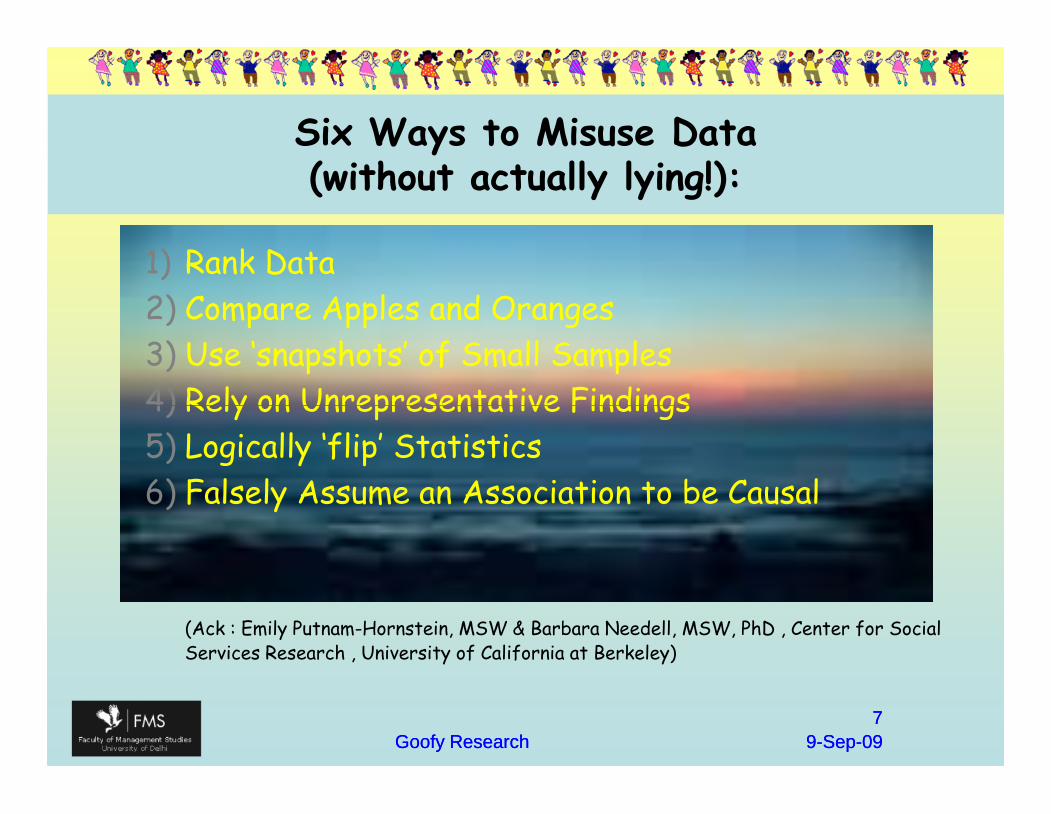
Six Ways to Misuse Data(without actually lying!):
1) Rank Data2) Compare Apples and Oranges3) Use ‘snapshots’ of Small Samples4) Rely on Unrepresentative Findings5) Logically ‘flip’ Statistics6) Falsely Assume an Association to be Causal
(Ack : Emily Putnam-Hornstein, MSW & Barbara Needell, MSW, PhD , Center for SocialServices Research , University of California at Berkeley)
99--SepSep--0909Goofy ResearchGoofy Research77
1) Rank Data2) Compare Apples and Oranges3) Use ‘snapshots’ of Small Samples4) Rely on Unrepresentative Findings5) Logically ‘flip’ Statistics6) Falsely Assume an Association to be Causal
(Ack : Emily Putnam-Hornstein, MSW & Barbara Needell, MSW, PhD , Center for SocialServices Research , University of California at Berkeley)
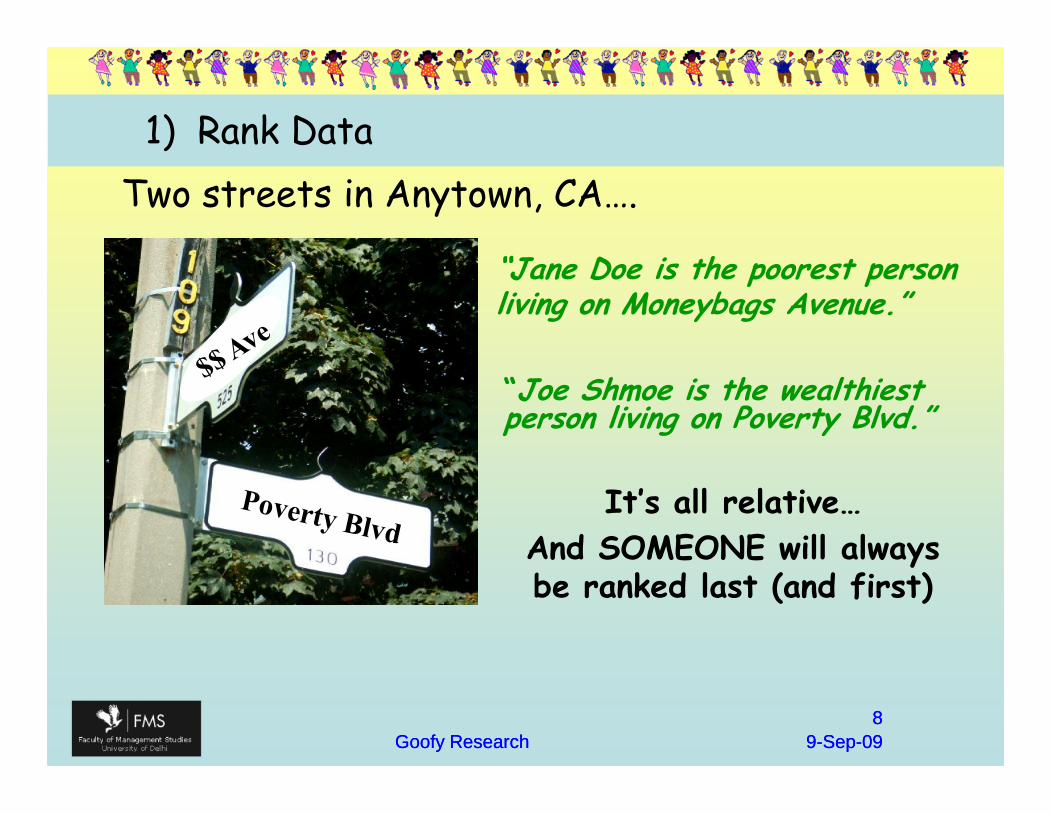
1) Rank DataTwo streets in Anytown, CA….
“Jane Doe is the poorest personliving on Moneybags Avenue.”
“Joe Shmoe is the wealthiestperson living on Poverty Blvd.”
99--SepSep--0909Goofy ResearchGoofy Research88
It’s all relative…And SOMEONE will alwaysbe ranked last (and first)
“Joe Shmoe is the wealthiestperson living on Poverty Blvd.”
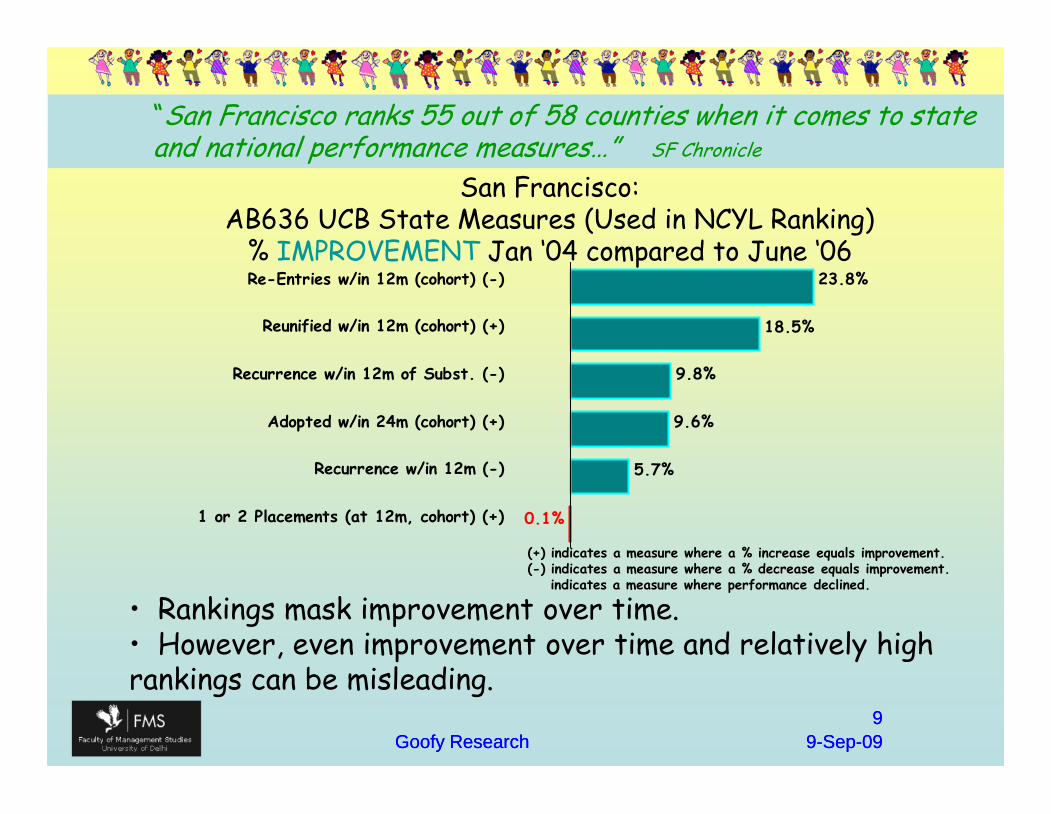
“San Francisco ranks 55 out of 58 counties when it comes to stateand national performance measures…” SF Chronicle
San Francisco:AB636 UCB State Measures (Used in NCYL Ranking)
% IMPROVEMENT Jan ‘04 compared to June ‘0623.8%
18.5%
9.8%
9.6%
5.7%
0.1%1 or 2 Placements (at 12m, cohort) (+)
Recurrence w/in 12m (-)
Adopted w/in 24m (cohort) (+)
Recurrence w/in 12m of Subst. (-)
Reunified w/in 12m (cohort) (+)
Re-Entries w/in 12m (cohort) (-)
99--SepSep--0909Goofy ResearchGoofy Research99
23.8%
18.5%
9.8%
9.6%
5.7%
0.1%1 or 2 Placements (at 12m, cohort) (+)
Recurrence w/in 12m (-)
Adopted w/in 24m (cohort) (+)
Recurrence w/in 12m of Subst. (-)
Reunified w/in 12m (cohort) (+)
Re-Entries w/in 12m (cohort) (-)
• Rankings mask improvement over time.• However, even improvement over time and relatively highrankings can be misleading.
(+) indicates a measure where a % increase equals improvement.(-) indicates a measure where a % decrease equals improvement.
indicates a measure where performance declined.
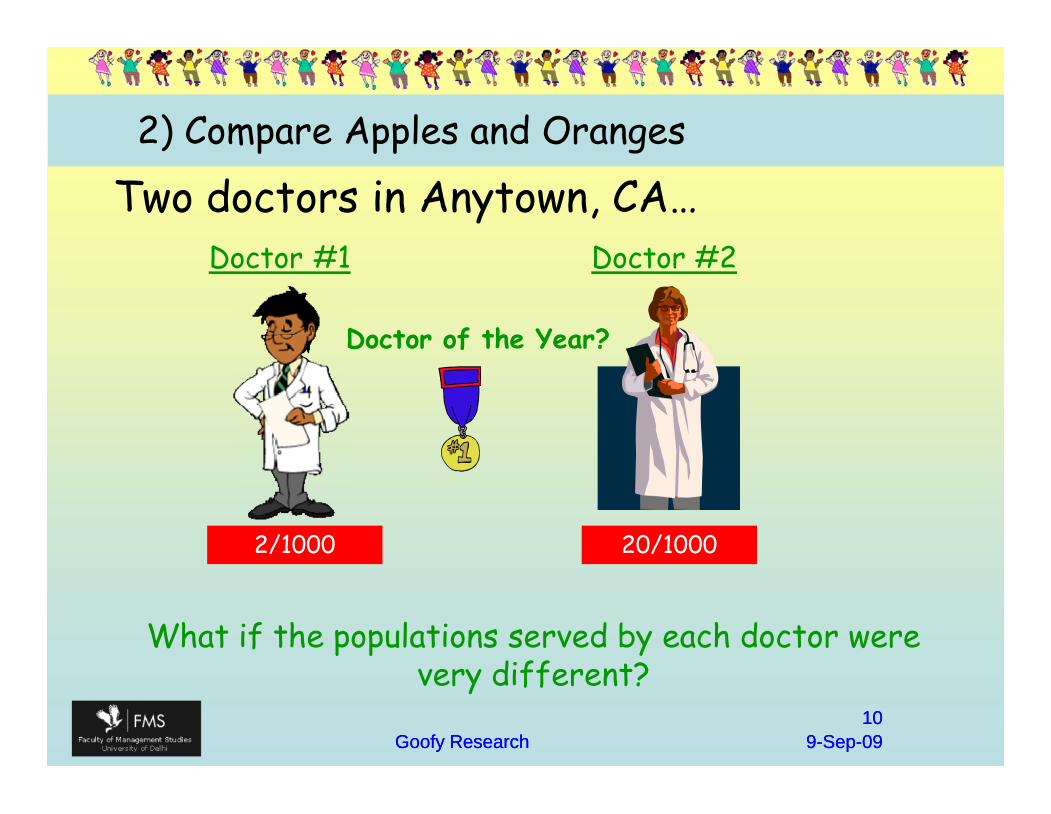
2) Compare Apples and Oranges
Two doctors in Anytown, CA…Doctor #1 Doctor #2
What if the populations served by each doctor werevery different?
Doctor of the Year?
99--SepSep--0909Goofy ResearchGoofy Research1010
Two doctors in Anytown, CA…Doctor #1 Doctor #2
What if the populations served by each doctor werevery different?
2/1000 20/1000
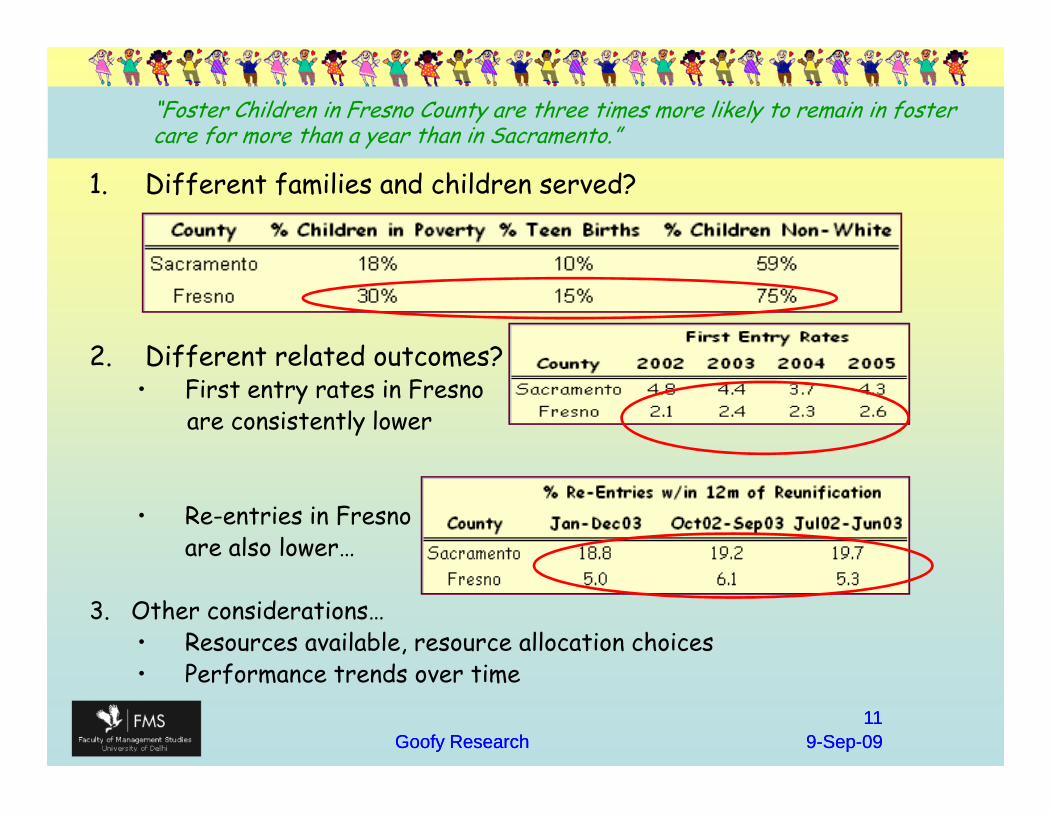
“Foster Children in Fresno County are three times more likely to remain in fostercare for more than a year than in Sacramento.”
1. Different families and children served?
2. Different related outcomes?• First entry rates in Fresno
are consistently lower
• Re-entries in Fresnoare also lower…
3. Other considerations…• Resources available, resource allocation choices• Performance trends over time
99--SepSep--0909Goofy ResearchGoofy Research1111
1. Different families and children served?
2. Different related outcomes?• First entry rates in Fresno
are consistently lower
• Re-entries in Fresnoare also lower…
3. Other considerations…• Resources available, resource allocation choices• Performance trends over time
Number of CrimesPeriod 1: 76Period 2: 51Period 3: 91Period 4: 76
3) Data snapshots…
No change.Average = 73.5
Crime in Anytown, CA…
99--SepSep--0909Goofy ResearchGoofy Research1212
Number of CrimesPeriod 1: 76Period 2: 51Period 3: 91Period 4: 76
Crime jumped by 49%!!No change.
Crime dropped by 16%
Average = 73.5
Abuse in Care Rate
Period 1: 1.80%Period 2: 1.64%Period 3: 0.84%Period 4: 0.00%
Responsible use of the data prevents us from making any of these claims(positive or negative).
The sample is too small; the time frame too limited.
“A foster child living in Napa County is in greater danger of being abused in fostercare than anywhere else in the Bay Area…”
100% improvement!
= 2/111
= 2/122= 1/119
99--SepSep--0909Goofy ResearchGoofy Research1313
Abuse in Care Rate
Period 1: 1.80%Period 2: 1.64%Period 3: 0.84%Period 4: 0.00%
Responsible use of the data prevents us from making any of these claims(positive or negative).
The sample is too small; the time frame too limited.
0 Children Abused!= 0
= 1/119
4) Unrepresentative findings…
Survey of people in Anytown, CA…
90% of respondents stated that theysupport using tax dollars to build a newfootball stadium.
The implication of the above finding is that there isoverwhelming support for the stadium…
But what if you were then told that respondents hadbeen sampled from a list of season football ticket
holders?99--SepSep--0909Goofy ResearchGoofy Research
1414
Survey of people in Anytown, CA…
90% of respondents stated that theysupport using tax dollars to build a newfootball stadium.
The implication of the above finding is that there isoverwhelming support for the stadium…
But what if you were then told that respondents hadbeen sampled from a list of season football ticket
holders?
“…in one recent large-scale study, about one-third of respondents reportedmaltreatment at the hands of their caregivers.” Oakland Tribune
Factually true?• Yes.
Misleading?• Yes.
– This was a survey of emancipated foster youth
– Emancipated youth represent a distinct subset of the fostercare population
– This “accurate” statistic misleads the reader to conclude thatone-third of foster children have been maltreated in care…
99--SepSep--0909Goofy ResearchGoofy Research1515
Factually true?• Yes.
Misleading?• Yes.
– This was a survey of emancipated foster youth
– Emancipated youth represent a distinct subset of the fostercare population
– This “accurate” statistic misleads the reader to conclude thatone-third of foster children have been maltreated in care…

5) Logical “Flipping”…
Headline in The Anytown Chronicle:
60% of violent crimes are committed by menwho did not graduate from high school.
“Flip”
60% of male high school drop-outs commitviolent crimes?
99--SepSep--0909Goofy ResearchGoofy Research1616
Headline in The Anytown Chronicle:
60% of violent crimes are committed by menwho did not graduate from high school.
“Flip”
60% of male high school drop-outs commitviolent crimes?
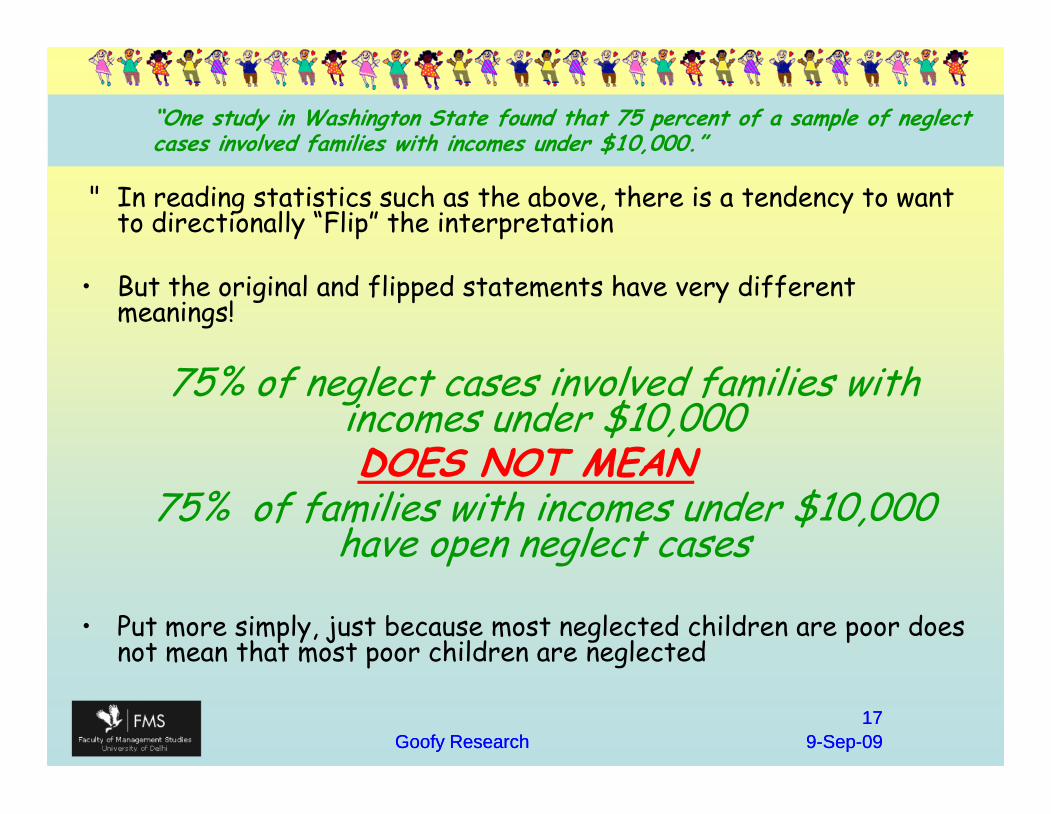
“One study in Washington State found that 75 percent of a sample of neglectcases involved families with incomes under $10,000.”
• In reading statistics such as the above, there is a tendency to wantto directionally “Flip” the interpretation
• But the original and flipped statements have very differentmeanings!
75% of neglect cases involved families withincomes under $10,000DOES NOT MEAN
75% of families with incomes under $10,000have open neglect cases
• Put more simply, just because most neglected children are poor doesnot mean that most poor children are neglected
99--SepSep--0909Goofy ResearchGoofy Research1717
• In reading statistics such as the above, there is a tendency to wantto directionally “Flip” the interpretation
• But the original and flipped statements have very differentmeanings!
75% of neglect cases involved families withincomes under $10,000DOES NOT MEAN
75% of families with incomes under $10,000have open neglect cases
• Put more simply, just because most neglected children are poor doesnot mean that most poor children are neglected
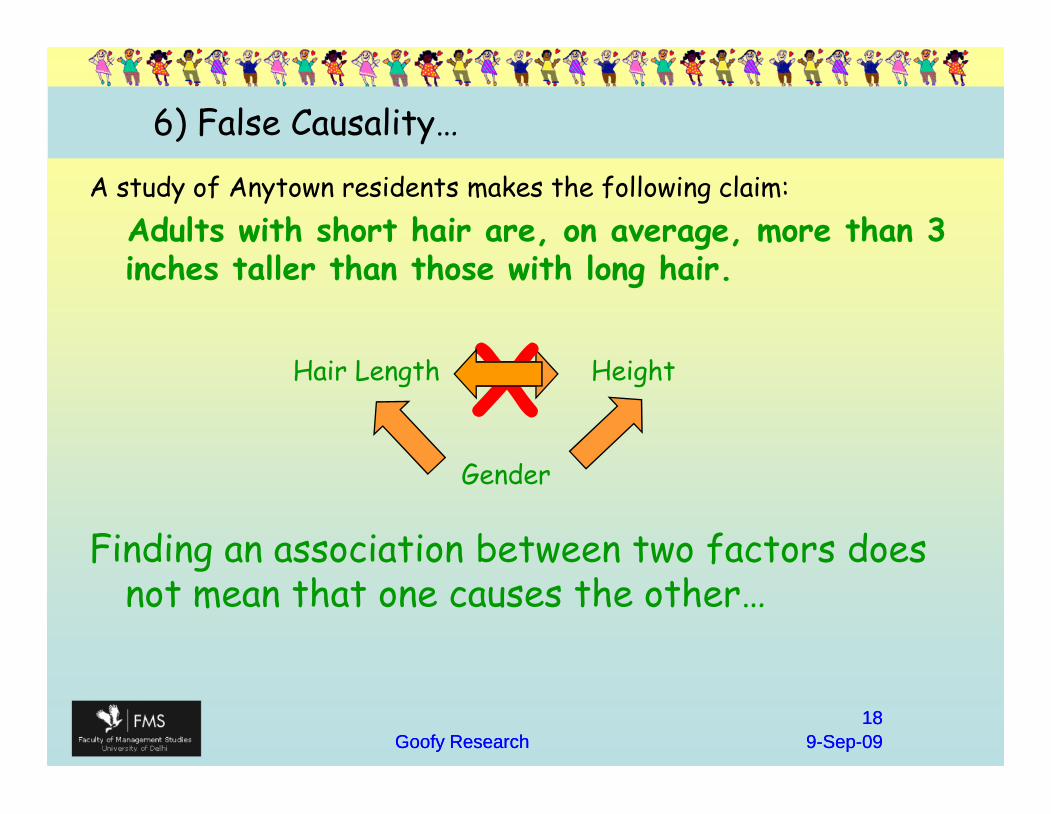
6) False Causality…
A study of Anytown residents makes the following claim:Adults with short hair are, on average, more than 3inches taller than those with long hair.
Finding an association between two factors doesnot mean that one causes the other…
Hair Length HeightX
99--SepSep--0909Goofy ResearchGoofy Research1818
A study of Anytown residents makes the following claim:Adults with short hair are, on average, more than 3inches taller than those with long hair.
Finding an association between two factors doesnot mean that one causes the other…
Gender
X
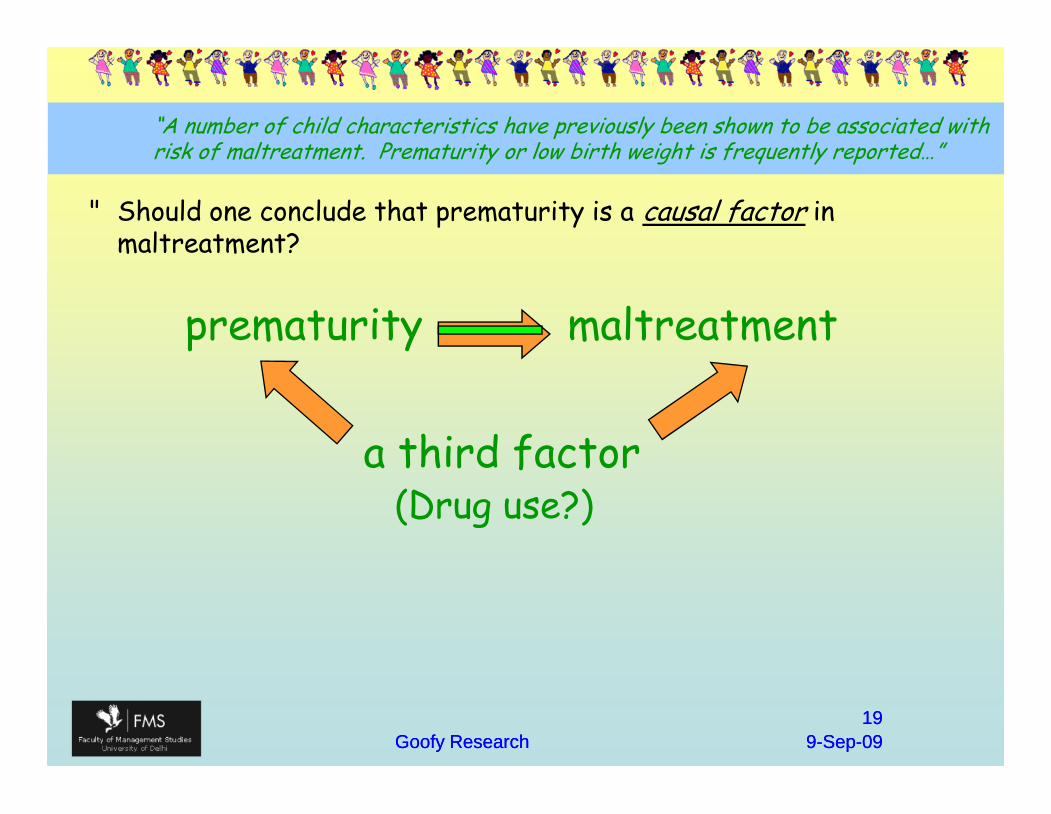
“A number of child characteristics have previously been shown to be associated withrisk of maltreatment. Prematurity or low birth weight is frequently reported…”
• Should one conclude that prematurity is a causal factor inmaltreatment?
prematurity maltreatment
99--SepSep--0909Goofy ResearchGoofy Research1919
(Drug use?)a third factor
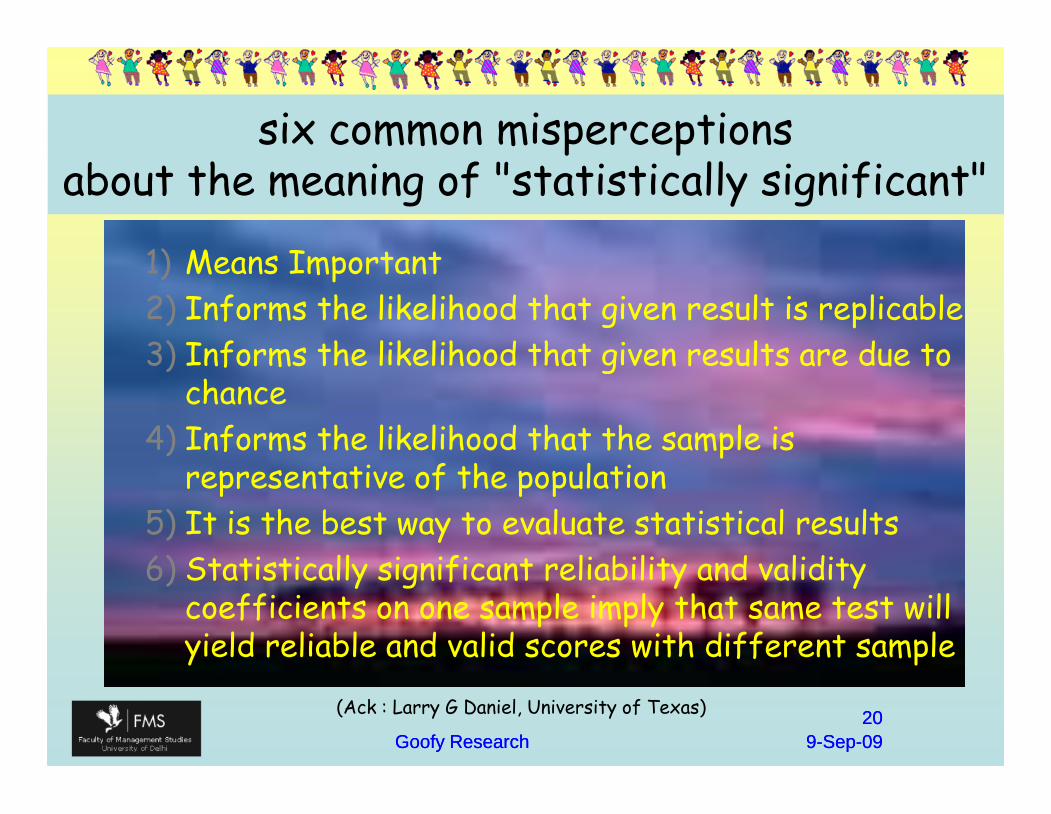
six common misperceptionsabout the meaning of "statistically significant"
1) Means Important2) Informs the likelihood that given result is replicable3) Informs the likelihood that given results are due to
chance4) Informs the likelihood that the sample is
representative of the population5) It is the best way to evaluate statistical results6) Statistically significant reliability and validity
coefficients on one sample imply that same test willyield reliable and valid scores with different sample
(Ack : Larry G Daniel, University of Texas)
99--SepSep--0909Goofy ResearchGoofy Research2020
1) Means Important2) Informs the likelihood that given result is replicable3) Informs the likelihood that given results are due to
chance4) Informs the likelihood that the sample is
representative of the population5) It is the best way to evaluate statistical results6) Statistically significant reliability and validity
coefficients on one sample imply that same test willyield reliable and valid scores with different sample
(Ack : Larry G Daniel, University of Texas)
Statistically significance means important
1) Difference may not be socially important2) What about effect size (difference of means , or
correlation coefficient)3) Even for fixed effect size , what about sample size
99--SepSep--0909Goofy ResearchGoofy Research2121
1) Difference may not be socially important2) What about effect size (difference of means , or
correlation coefficient)3) Even for fixed effect size , what about sample size
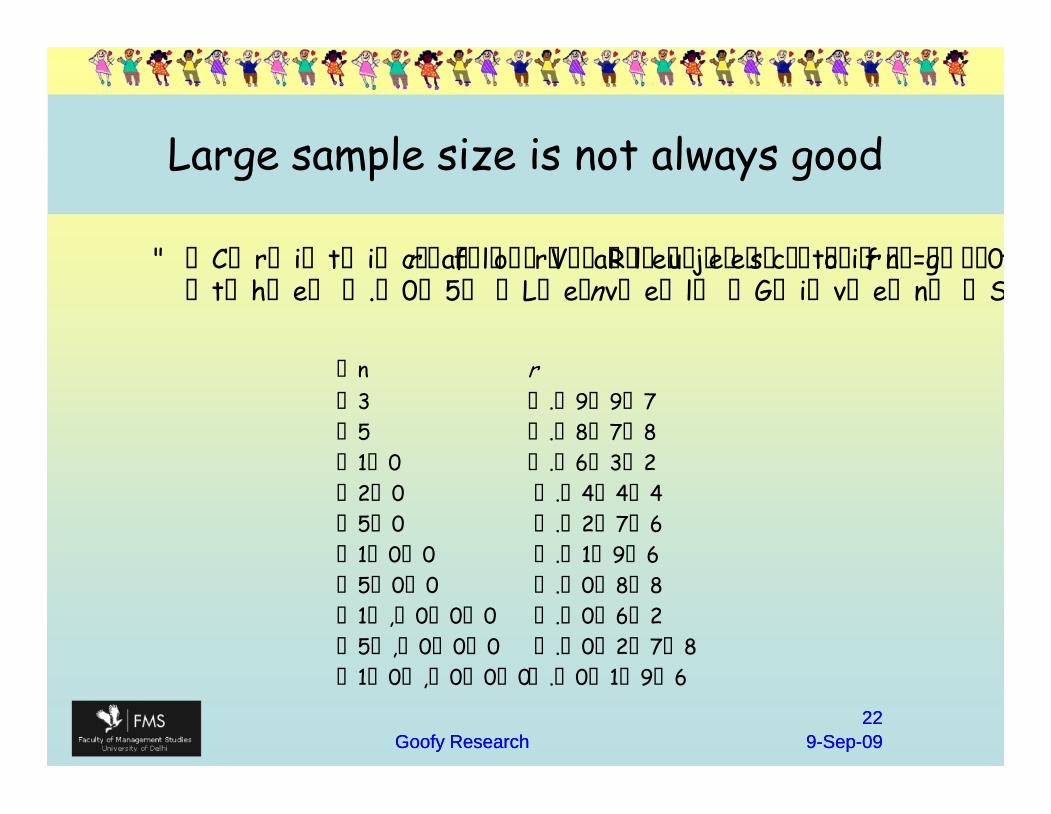
Large sample size is not always good
• Critical Values of r for Rejecting the Null Hypothesis (r = 0) atthe .05 Level Given Sample Size n
n r3 .9975 .87810 .63220 .44450 .276100 .196500 .0881,000 .0625,000 .027810,000 .0196
99--SepSep--0909Goofy ResearchGoofy Research2222
• Critical Values of r for Rejecting the Null Hypothesis (r = 0) atthe .05 Level Given Sample Size n
n r3 .9975 .87810 .63220 .44450 .276100 .196500 .0881,000 .0625,000 .027810,000 .0196
Statistically significance Informs thelikelihood that given result is replicable
Replication is at best (if at all) informed by Crossvalidation , Jackknifing, bootstrapping etc.
99--SepSep--0909Goofy ResearchGoofy Research2323
Statistically significance Informs thelikelihood that given results are due to
chance1. It provides the probability of a result occurring by chance in
the long run under the null hypothesis with random sampling .
2. It provides no basis for a conclusion about the probabilitythat a given result is attributable to chance.
3. r=.40 significant at 5% means there is 95% likelihood thatthe correlation in population is not zero assuming sample isrepresentative. However it would be inappropriate to conclude1) There is 95% likelihood that correlation is .40 in the population2) There is only a 5% likelihood that the result of that particular statistical
significance test is due to chance
99--SepSep--0909Goofy ResearchGoofy Research2424
1. It provides the probability of a result occurring by chance inthe long run under the null hypothesis with random sampling .
2. It provides no basis for a conclusion about the probabilitythat a given result is attributable to chance.
3. r=.40 significant at 5% means there is 95% likelihood thatthe correlation in population is not zero assuming sample isrepresentative. However it would be inappropriate to conclude1) There is 95% likelihood that correlation is .40 in the population2) There is only a 5% likelihood that the result of that particular statistical
significance test is due to chance
Statistically significance Informs thelikelihood that the sample is
representative of the population
1) The only way to estimate if a sample is representative isto carefully select the sample.
2) Statistical significance , however , means that “if thesample represents the population , how likely is theobtained results.”
99--SepSep--0909Goofy ResearchGoofy Research2525
1) The only way to estimate if a sample is representative isto carefully select the sample.
2) Statistical significance , however , means that “if thesample represents the population , how likely is theobtained results.”
Statistically significance is the best wayto evaluate statistical results
1. goes much beyond the importance misperception
2. Failure to report effect size (Researcher might simplyreport a breakdown of the dependent variable sum ofsquares from which an estimate of effect size could beestimated)
99--SepSep--0909Goofy ResearchGoofy Research2626
1. goes much beyond the importance misperception
2. Failure to report effect size (Researcher might simplyreport a breakdown of the dependent variable sum ofsquares from which an estimate of effect size could beestimated)
Statistically significance and test scorecharacteristics: Reliability and Validity
1. Validity and Reliability are characteristics of test scores or testdata. However contemporary scholarly language (e.g. “the test isreliable”,, “the test is valid”) often erroneously implies that theseare characteristics of tests themselves. Statistical tests of thesecoefficients are nonsensical, as it depends on size of sample.
2. Since reliability and validity coefficients are sample specific,statistical significance tests do not offer any promise of thegeneralizabiity of these coefficients to other samples.
99--SepSep--0909Goofy ResearchGoofy Research2727
1. Validity and Reliability are characteristics of test scores or testdata. However contemporary scholarly language (e.g. “the test isreliable”,, “the test is valid”) often erroneously implies that theseare characteristics of tests themselves. Statistical tests of thesecoefficients are nonsensical, as it depends on size of sample.
2. Since reliability and validity coefficients are sample specific,statistical significance tests do not offer any promise of thegeneralizabiity of these coefficients to other samples.
Statistically significance
Simply indicates the probability that the nullhypothesis is true in the population.
99--SepSep--0909Goofy ResearchGoofy Research2828
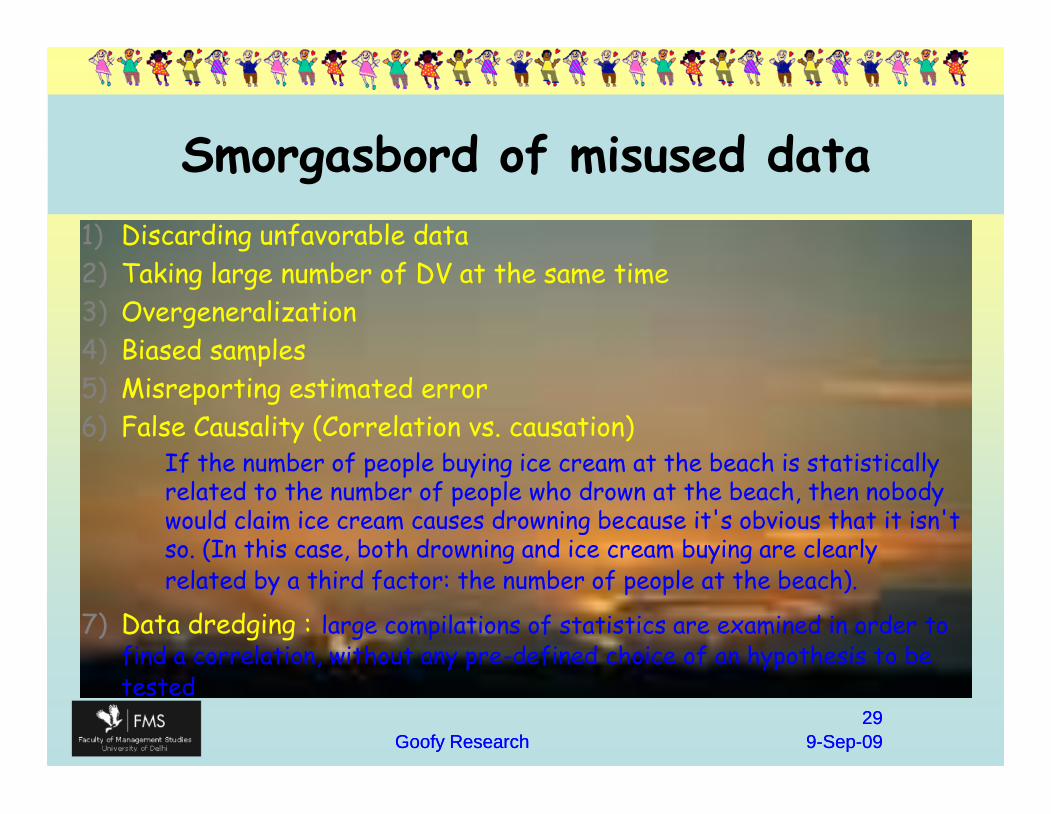
Smorgasbord of misused data1) Discarding unfavorable data2) Taking large number of DV at the same time3) Overgeneralization4) Biased samples5) Misreporting estimated error6) False Causality (Correlation vs. causation)
If the number of people buying ice cream at the beach is statisticallyrelated to the number of people who drown at the beach, then nobodywould claim ice cream causes drowning because it's obvious that it isn'tso. (In this case, both drowning and ice cream buying are clearlyrelated by a third factor: the number of people at the beach).
7) Data dredging : large compilations of statistics are examined in order tofind a correlation, without any pre-defined choice of an hypothesis to betested
99--SepSep--0909Goofy ResearchGoofy Research2929
1) Discarding unfavorable data2) Taking large number of DV at the same time3) Overgeneralization4) Biased samples5) Misreporting estimated error6) False Causality (Correlation vs. causation)
If the number of people buying ice cream at the beach is statisticallyrelated to the number of people who drown at the beach, then nobodywould claim ice cream causes drowning because it's obvious that it isn'tso. (In this case, both drowning and ice cream buying are clearlyrelated by a third factor: the number of people at the beach).
7) Data dredging : large compilations of statistics are examined in order tofind a correlation, without any pre-defined choice of an hypothesis to betested
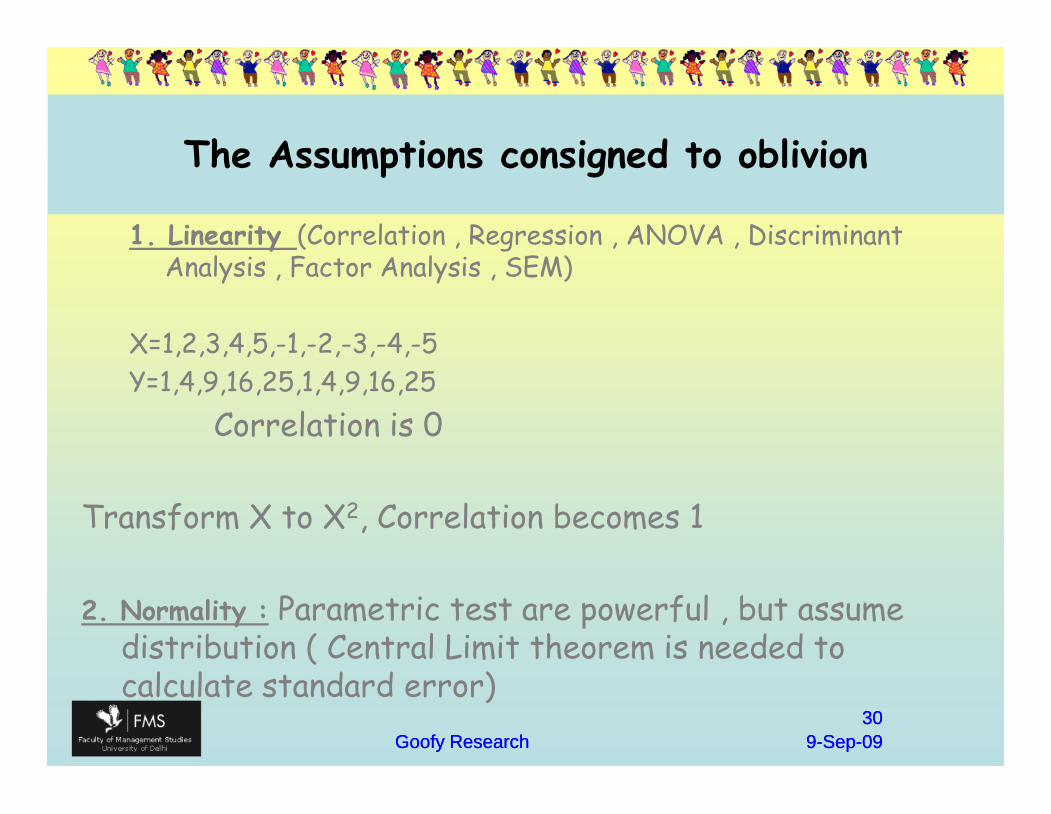
The Assumptions consigned to oblivion
1. Linearity (Correlation , Regression , ANOVA , DiscriminantAnalysis , Factor Analysis , SEM)
X=1,2,3,4,5,-1,-2,-3,-4,-5Y=1,4,9,16,25,1,4,9,16,25
Correlation is 0
Transform X to X2, Correlation becomes 1
2. Normality : Parametric test are powerful , but assumedistribution ( Central Limit theorem is needed tocalculate standard error)
99--SepSep--0909Goofy ResearchGoofy Research3030
1. Linearity (Correlation , Regression , ANOVA , DiscriminantAnalysis , Factor Analysis , SEM)
X=1,2,3,4,5,-1,-2,-3,-4,-5Y=1,4,9,16,25,1,4,9,16,25
Correlation is 0
Transform X to X2, Correlation becomes 1
2. Normality : Parametric test are powerful , but assumedistribution ( Central Limit theorem is needed tocalculate standard error)
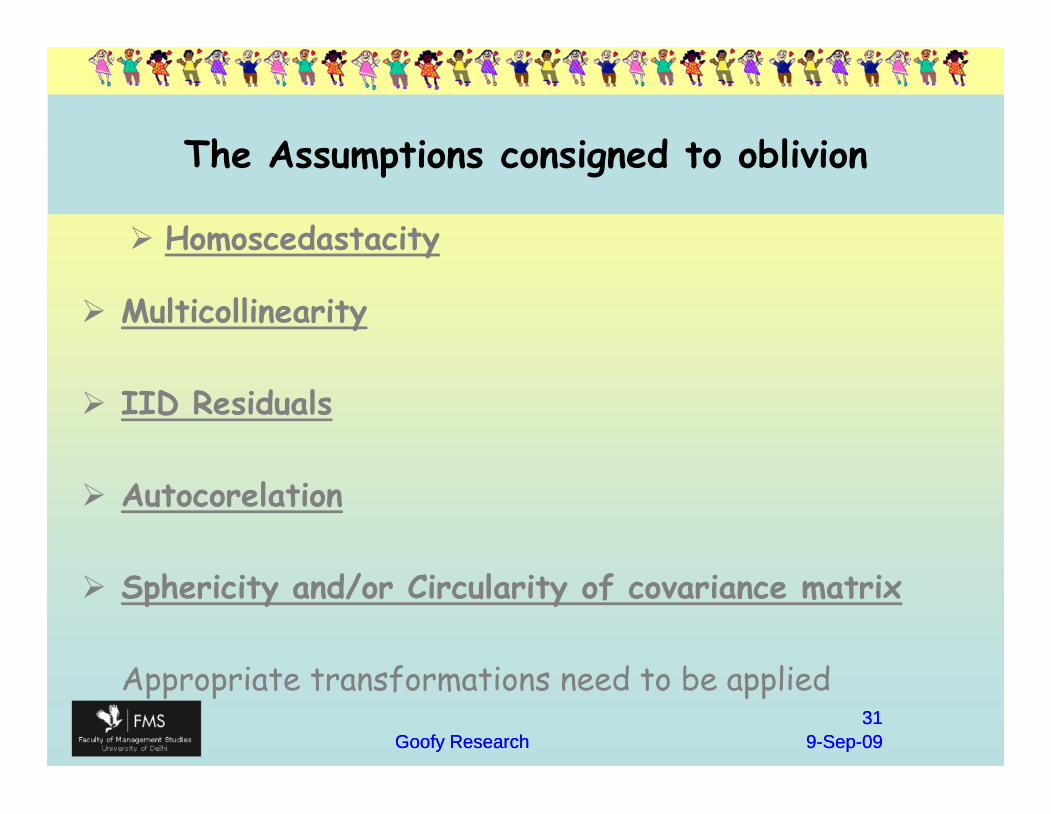
The Assumptions consigned to oblivion
Homoscedastacity
Multicollinearity
IID Residuals
Autocorelation
Sphericity and/or Circularity of covariance matrix
Appropriate transformations need to be applied
99--SepSep--0909Goofy ResearchGoofy Research3131
Homoscedastacity
Multicollinearity
IID Residuals
Autocorelation
Sphericity and/or Circularity of covariance matrix
Appropriate transformations need to be applied
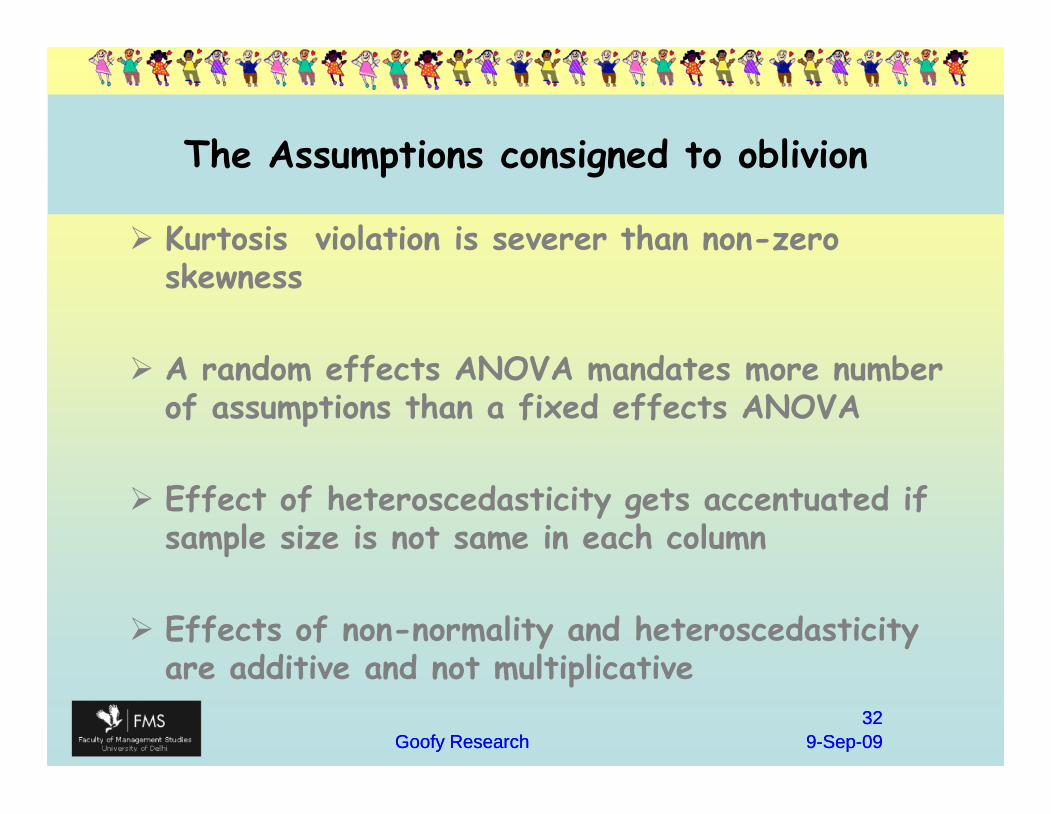
The Assumptions consigned to oblivion
Kurtosis violation is severer than non-zeroskewness
A random effects ANOVA mandates more numberof assumptions than a fixed effects ANOVA
Effect of heteroscedasticity gets accentuated ifsample size is not same in each column
Effects of non-normality and heteroscedasticityare additive and not multiplicative
99--SepSep--0909Goofy ResearchGoofy Research3232
Kurtosis violation is severer than non-zeroskewness
A random effects ANOVA mandates more numberof assumptions than a fixed effects ANOVA
Effect of heteroscedasticity gets accentuated ifsample size is not same in each column
Effects of non-normality and heteroscedasticityare additive and not multiplicative
Fatal disastersAccepting the Null Hypothesis
Turning around to the other side in 1-tail tests
Failure to apportion the interaction effect variance ,if it is not found significant
Failure to adjust for covariates
Two Group designs are faulty in most cases
Failure to acknowledge that KP correlation uses simple correlation andStepwise Regression uses Part Correlation
99--SepSep--0909Goofy ResearchGoofy Research3333
Accepting the Null Hypothesis
Turning around to the other side in 1-tail tests
Failure to apportion the interaction effect variance ,if it is not found significant
Failure to adjust for covariates
Two Group designs are faulty in most cases
Failure to acknowledge that KP correlation uses simple correlation andStepwise Regression uses Part Correlation
Fatal disastersFailure to use appropriate correlation for correlation matrix in analyses
like Factor Analysis etc.
Failure to use transformations before setting to use less powerful non-parametric tests.
Failure to “know your data approach”Examining the dataMissing Value AnalysisOutlier Analysis
Failure to use appropriate sample size
Failure to use Model parsimony
99--SepSep--0909Goofy ResearchGoofy Research3434
Failure to use appropriate correlation for correlation matrix in analyseslike Factor Analysis etc.
Failure to use transformations before setting to use less powerful non-parametric tests.
Failure to “know your data approach”Examining the dataMissing Value AnalysisOutlier Analysis
Failure to use appropriate sample size
Failure to use Model parsimony
Fatal disastersErrors in prediction are not measure of failure
but a diagnostic tool
Failure to impregnate the design with powerfulelements( Blocking etc.)
Failure to validate results : Objective is populationand not sample
Failure to use WLS,MLE instead of OLS whereverneeded (in case OLS doesn’t give BLUE)
People simple take arbitrary α (.05 or .01) and simple ignore β
Attenuation of ρ in Concurrent validation
99--SepSep--0909Goofy ResearchGoofy Research3535
Errors in prediction are not measure of failurebut a diagnostic tool
Failure to impregnate the design with powerfulelements( Blocking etc.)
Failure to validate results : Objective is populationand not sample
Failure to use WLS,MLE instead of OLS whereverneeded (in case OLS doesn’t give BLUE)
People simple take arbitrary α (.05 or .01) and simple ignore β
Attenuation of ρ in Concurrent validation
Road AheadUse IRT appropriately
• 1PL , 2PL , 3PL and Normal Ogive Models (0-1 data)• Partial Credit , Generalized Partial Credit , Graded Response ,
Nominal Response Models (Polytomous data)• Multidimensional Logistic Models (0-1 data)
Computer Adaptive Test is not same as Computer Administered Test /Computerized Tests
• The examinee's ability level relative to a norm group can be iteratively estimatedduring the testing process and items can be selected based on the current abilityestimate to maximize the information . The examinees will receive few items that arevery easy or very hard for them.
• This tailored item selection can result in reduced standard errors and greaterprecision with only a handful of properly selected items.
99--SepSep--0909Goofy ResearchGoofy Research3636
Use IRT appropriately
• 1PL , 2PL , 3PL and Normal Ogive Models (0-1 data)• Partial Credit , Generalized Partial Credit , Graded Response ,
Nominal Response Models (Polytomous data)• Multidimensional Logistic Models (0-1 data)
Computer Adaptive Test is not same as Computer Administered Test /Computerized Tests
• The examinee's ability level relative to a norm group can be iteratively estimatedduring the testing process and items can be selected based on the current abilityestimate to maximize the information . The examinees will receive few items that arevery easy or very hard for them.
• This tailored item selection can result in reduced standard errors and greaterprecision with only a handful of properly selected items.
Road AheadIncorporate Taguchi method designs (TQM)
use of orthogonal arrays in fractional factorial designs for efficient handling of desiredmain and interaction effects in line with quadratic loss function
Incorporate response surface methods designscontinuous feasible factor levels
Irregular response surface optimization
99--SepSep--0909Goofy ResearchGoofy Research3737
Incorporate Taguchi method designs (TQM)use of orthogonal arrays in fractional factorial designs for efficient handling of desiredmain and interaction effects in line with quadratic loss function
Incorporate response surface methods designscontinuous feasible factor levels
Irregular response surface optimization
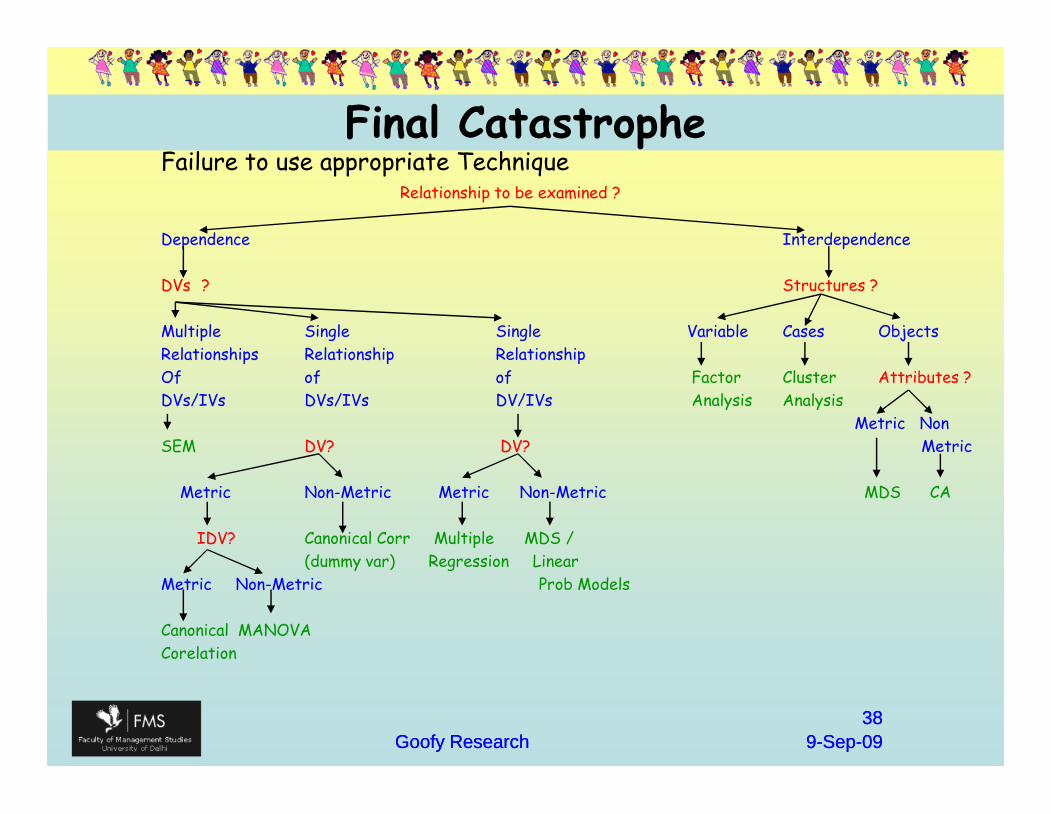
Final CatastropheFailure to use appropriate Technique
Relationship to be examined ?
Dependence Interdependence
DVs ? Structures ?
Multiple Single Single Variable Cases ObjectsRelationships Relationship RelationshipOf of of Factor Cluster Attributes ?DVs/IVs DVs/IVs DV/IVs Analysis Analysis
Metric NonSEM DV? DV? Metric
Metric Non-Metric Metric Non-Metric MDS CA
IDV? Canonical Corr Multiple MDS /(dummy var) Regression Linear
Metric Non-Metric Prob Models
Canonical MANOVACorelation
99--SepSep--0909Goofy ResearchGoofy Research3838
Failure to use appropriate TechniqueRelationship to be examined ?
Dependence Interdependence
DVs ? Structures ?
Multiple Single Single Variable Cases ObjectsRelationships Relationship RelationshipOf of of Factor Cluster Attributes ?DVs/IVs DVs/IVs DV/IVs Analysis Analysis
Metric NonSEM DV? DV? Metric
Metric Non-Metric Metric Non-Metric MDS CA
IDV? Canonical Corr Multiple MDS /(dummy var) Regression Linear
Metric Non-Metric Prob Models
Canonical MANOVACorelation
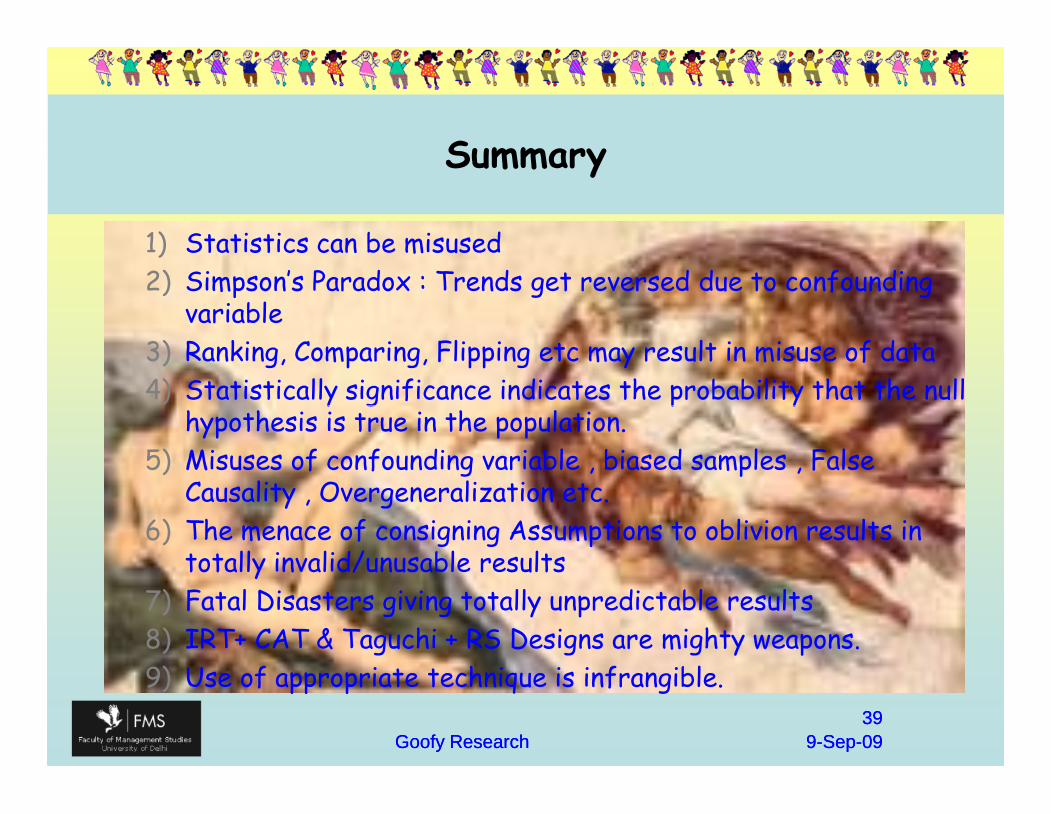
Summary
1) Statistics can be misused2) Simpson’s Paradox : Trends get reversed due to confounding
variable3) Ranking, Comparing, Flipping etc may result in misuse of data4) Statistically significance indicates the probability that the null
hypothesis is true in the population.5) Misuses of confounding variable , biased samples , False
Causality , Overgeneralization etc.6) The menace of consigning Assumptions to oblivion results in
totally invalid/unusable results7) Fatal Disasters giving totally unpredictable results8) IRT+ CAT & Taguchi + RS Designs are mighty weapons.9) Use of appropriate technique is infrangible.
99--SepSep--0909Goofy ResearchGoofy Research3939
1) Statistics can be misused2) Simpson’s Paradox : Trends get reversed due to confounding
variable3) Ranking, Comparing, Flipping etc may result in misuse of data4) Statistically significance indicates the probability that the null
hypothesis is true in the population.5) Misuses of confounding variable , biased samples , False
Causality , Overgeneralization etc.6) The menace of consigning Assumptions to oblivion results in
totally invalid/unusable results7) Fatal Disasters giving totally unpredictable results8) IRT+ CAT & Taguchi + RS Designs are mighty weapons.9) Use of appropriate technique is infrangible.

Q & A
99--SepSep--0909Goofy ResearchGoofy Research4040

99--SepSep--0909Goofy ResearchGoofy Research4141
Thank YouHappy Researching