golder article
TRANSCRIPT
SLOPE STABILITY ANALYSIS FOR OPEN PITS José L. Carvalho Golder Associates Ltd., Mississauga, CANADA
1.0 INTRODUCTION
In the process of wall design for open pits, a number of steps and levels of analyses are required, from
local bench design to overall stability of the walls, to evaluation of the design performance and
calibration of parameters through back-analysis. This process requires the use of a variety of methods
of analysis and software ranging from limit equilibrium methods to more involved numerical analyses
such as distinct elements, which can capture detailed geology and handle mixed failure modes. It is
the aim of this article to present the common methods used in the design and analysis of the different
components of the open pit wall design process.
It should be understood that before one gets to the design and analysis stage a considerable amount of
field work must already have taken place to provide the necessary data. This data gathering and
interpretation process is extremely important and its quality and thoroughness is usually responsible
for the success of the design. Some of the more important aspects of this preliminary work are as
follows.
• Regional geology, regional faulting and emplacement of the ore are important factors and
usually define the different lithological and structural domains in the pit.
• Hydrogeology and understanding of the groundwater flow regime impact overall stability.
• Structural mapping of the different domains and rock types control both bench design and
overall stability. This includes both joint sets as well as major features such as dykes, faults,
contacts, etc.
• Identification of alteration zones within the pit is important. Alteration affects rock strength,
therefore, different alterations within the same rock type should be grouped separately.
• Laboratory testing of the different rock types with the results grouped by alteration for each
rock type.
2.0 BENCH DESIGN
Bench design is usually based on structural data and continuum analyses are seldom used to assess
bench stability. At this local level, planar and wedge analyses combined with probabilistic methods
are the most common method of design. One such technique is termed Cumulative Frequency
Analysis (CFA). In the case of planar failure analysis, it consists of calculating the potential for each
measured joint to slide into the pit within a pre-determined daylighting window, typically 50º to 60º
wide (25º to 30º on either side of the normal to the wall) and plotting the cumulative frequency of
failed planes against the face angle. In the wedge analysis case, it consists of intersecting all joints of
each identified joint set with all joints of other identified sets and calculating the potential for each
generated wedge to slide into the pit within a pre-determined daylighting window, typically 90º wide
(45º on either side of the normal to the wall) and plotting the cumulative frequency of failed wedges
against the face angle. In open pit mining, it is accepted to trade off some failures for steeper bench
face angles, without compromising safety, since it is more economical to deal with regular clean-ups
than to have higher stripping ratios. This is generally referred to as a “managed” approach to slope
design. A design reliability of 80% is generally accepted in open pit design, which means allowing
20% of all wedges actually to fail. The accepted failure level determines the design bench angle. In
the following example, DIPS is used to interpret the structural data and identify the joint sets for the
plane/wedge analysis in the domain and rock type of interest. The DIPS file is then imported into the
analysis program and planar and wedge analyses performed based on joint frictional strength data and
a target factor of safety input by the user.
Planar Analysis
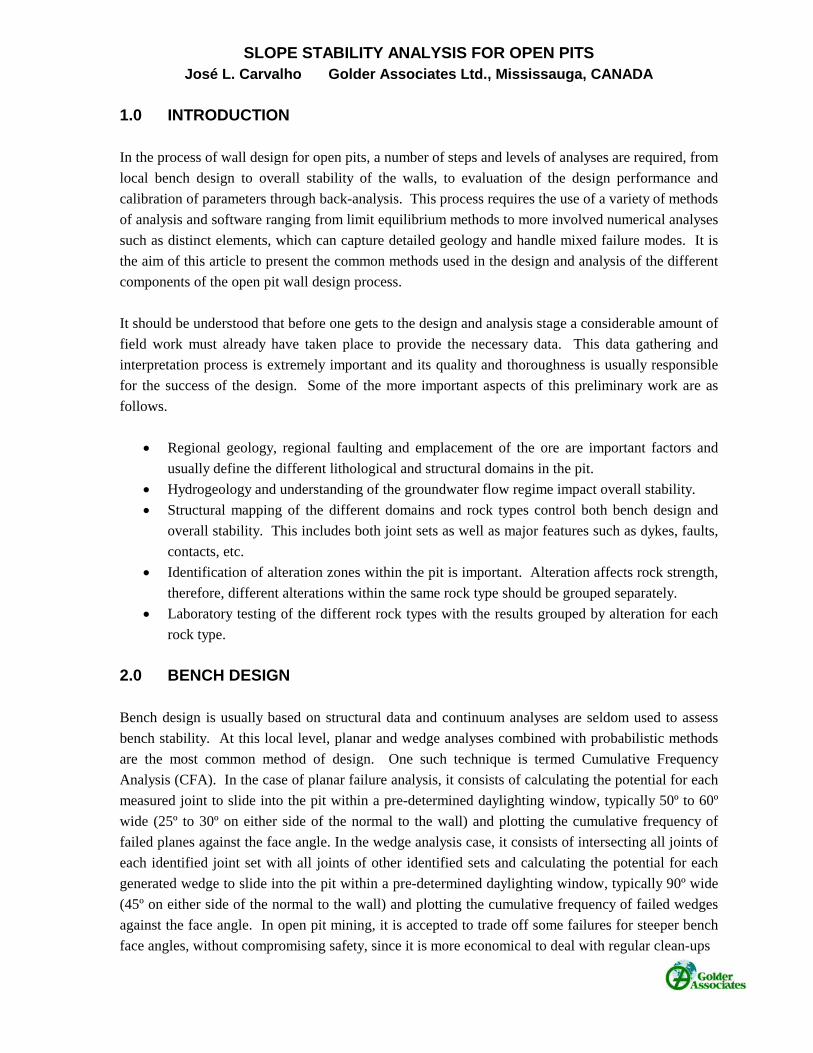
Figure 1 shows the input parameters for the planar analysis and Figure 2 shows the stereo plots for all
poles in the DIPS file and the poles within the daylighting window.
Figure 1 – Parameters for the planar analysis
In this particular case, the planar analysis was performed for a wall direction of 315º , a kinematic
window size of 60º, the angle of friction for the joints was assumed to be 35º and the target factor of
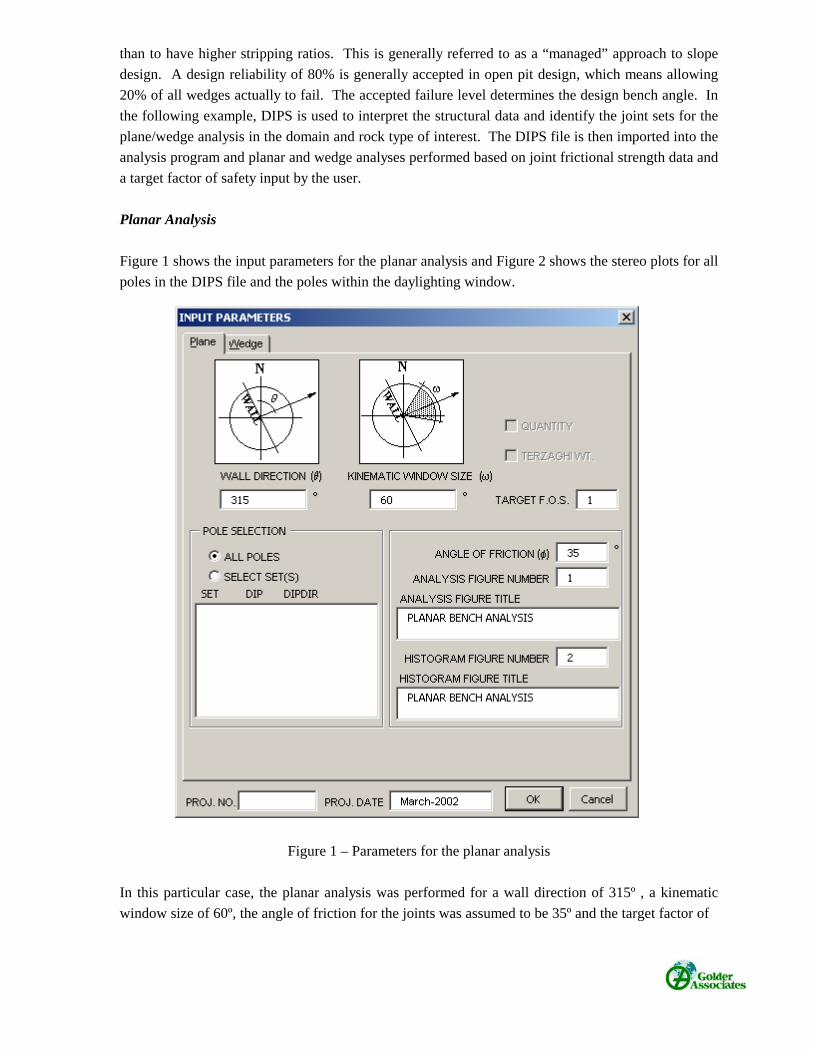
safety was 1. The stereo plots show that 88 of the 90 joints in the kinematic window (98% of the
joints) are steeper than the friction angle and have the potential to slide, depending on the face angle.
Figure 2 – Stereo plots showing the direction of the pit wall, the kinematic window and the poles of
the field mapped joints.
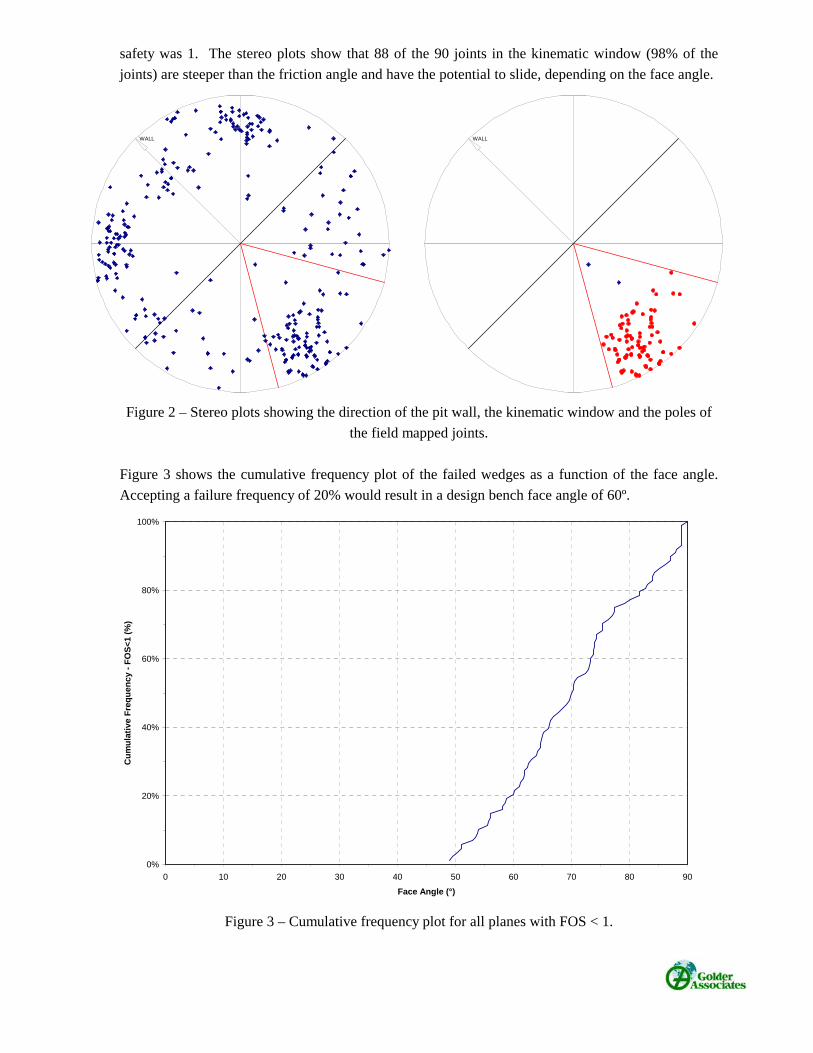
Figure 3 shows the cumulative frequency plot of the failed wedges as a function of the face angle.
Accepting a failure frequency of 20% would result in a design bench face angle of 60º.
Figure 3 – Cumulative frequency plot for all planes with FOS < 1.
WALLWALL
0%
20%
40%
60%
80%
100%
0 10 20 30 40 50 60 70 80 90
Face Angle (°)
Cu
mu
lati
ve F
req
uen
cy -
FO
S<1
(%
)
Wedge Analysis
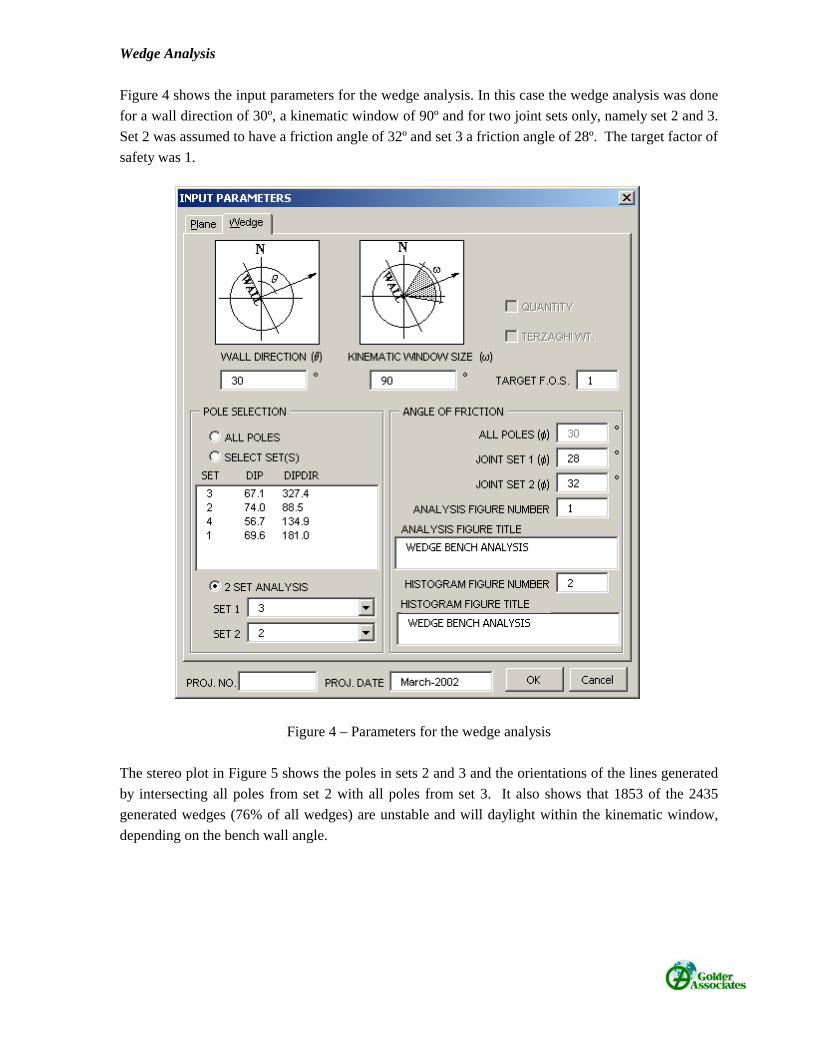
Figure 4 shows the input parameters for the wedge analysis. In this case the wedge analysis was done
for a wall direction of 30º, a kinematic window of 90º and for two joint sets only, namely set 2 and 3.
Set 2 was assumed to have a friction angle of 32º and set 3 a friction angle of 28º. The target factor of
safety was 1.
Figure 4 – Parameters for the wedge analysis
The stereo plot in Figure 5 shows the poles in sets 2 and 3 and the orientations of the lines generated
by intersecting all poles from set 2 with all poles from set 3. It also shows that 1853 of the 2435
generated wedges (76% of all wedges) are unstable and will daylight within the kinematic window,
depending on the bench wall angle.
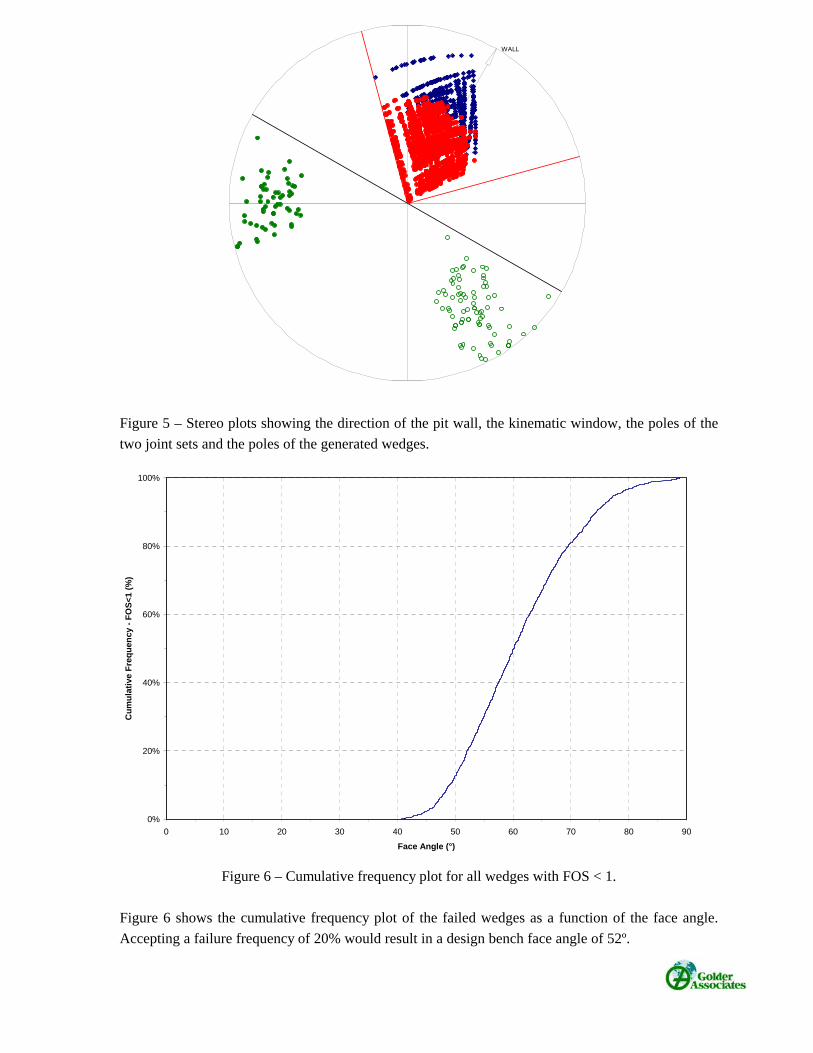
Figure 5 – Stereo plots showing the direction of the pit wall, the kinematic window, the poles of the
two joint sets and the poles of the generated wedges.
Figure 6 – Cumulative frequency plot for all wedges with FOS < 1.
Figure 6 shows the cumulative frequency plot of the failed wedges as a function of the face angle.
Accepting a failure frequency of 20% would result in a design bench face angle of 52º.
WALL
0%
20%
40%
60%
80%
100%
0 10 20 30 40 50 60 70 80 90
Face Angle (°)
Cu
mu
lati
ve F
req
uen
cy -
FO
S<1
(%
)
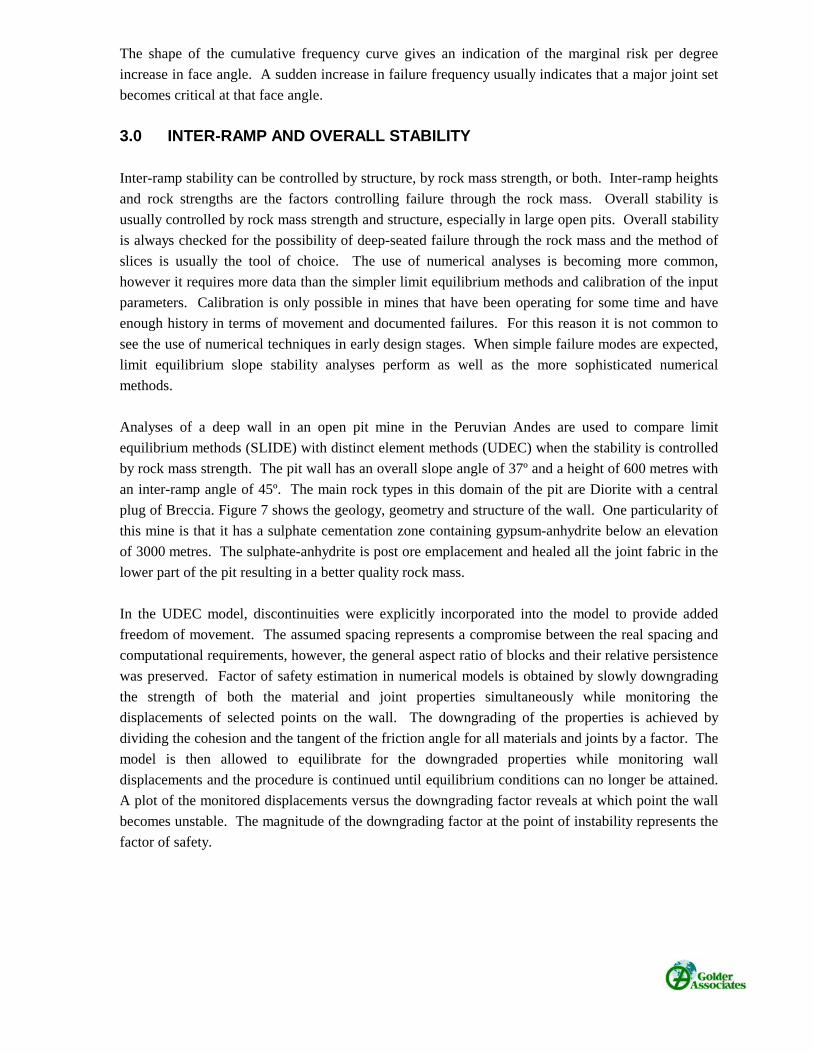
The shape of the cumulative frequency curve gives an indication of the marginal risk per degree
increase in face angle. A sudden increase in failure frequency usually indicates that a major joint set
becomes critical at that face angle.
3.0 INTER-RAMP AND OVERALL STABILITY
Inter-ramp stability can be controlled by structure, by rock mass strength, or both. Inter-ramp heights
and rock strengths are the factors controlling failure through the rock mass. Overall stability is
usually controlled by rock mass strength and structure, especially in large open pits. Overall stability
is always checked for the possibility of deep-seated failure through the rock mass and the method of
slices is usually the tool of choice. The use of numerical analyses is becoming more common,
however it requires more data than the simpler limit equilibrium methods and calibration of the input
parameters. Calibration is only possible in mines that have been operating for some time and have
enough history in terms of movement and documented failures. For this reason it is not common to
see the use of numerical techniques in early design stages. When simple failure modes are expected,
limit equilibrium slope stability analyses perform as well as the more sophisticated numerical
methods.
Analyses of a deep wall in an open pit mine in the Peruvian Andes are used to compare limit
equilibrium methods (SLIDE) with distinct element methods (UDEC) when the stability is controlled
by rock mass strength. The pit wall has an overall slope angle of 37º and a height of 600 metres with
an inter-ramp angle of 45º. The main rock types in this domain of the pit are Diorite with a central
plug of Breccia. Figure 7 shows the geology, geometry and structure of the wall. One particularity of
this mine is that it has a sulphate cementation zone containing gypsum-anhydrite below an elevation
of 3000 metres. The sulphate-anhydrite is post ore emplacement and healed all the joint fabric in the
lower part of the pit resulting in a better quality rock mass.
In the UDEC model, discontinuities were explicitly incorporated into the model to provide added
freedom of movement. The assumed spacing represents a compromise between the real spacing and
computational requirements, however, the general aspect ratio of blocks and their relative persistence
was preserved. Factor of safety estimation in numerical models is obtained by slowly downgrading
the strength of both the material and joint properties simultaneously while monitoring the
displacements of selected points on the wall. The downgrading of the properties is achieved by
dividing the cohesion and the tangent of the friction angle for all materials and joints by a factor. The
model is then allowed to equilibrate for the downgraded properties while monitoring wall
displacements and the procedure is continued until equilibrium conditions can no longer be attained.
A plot of the monitored displacements versus the downgrading factor reveals at which point the wall
becomes unstable. The magnitude of the downgrading factor at the point of instability represents the
factor of safety.
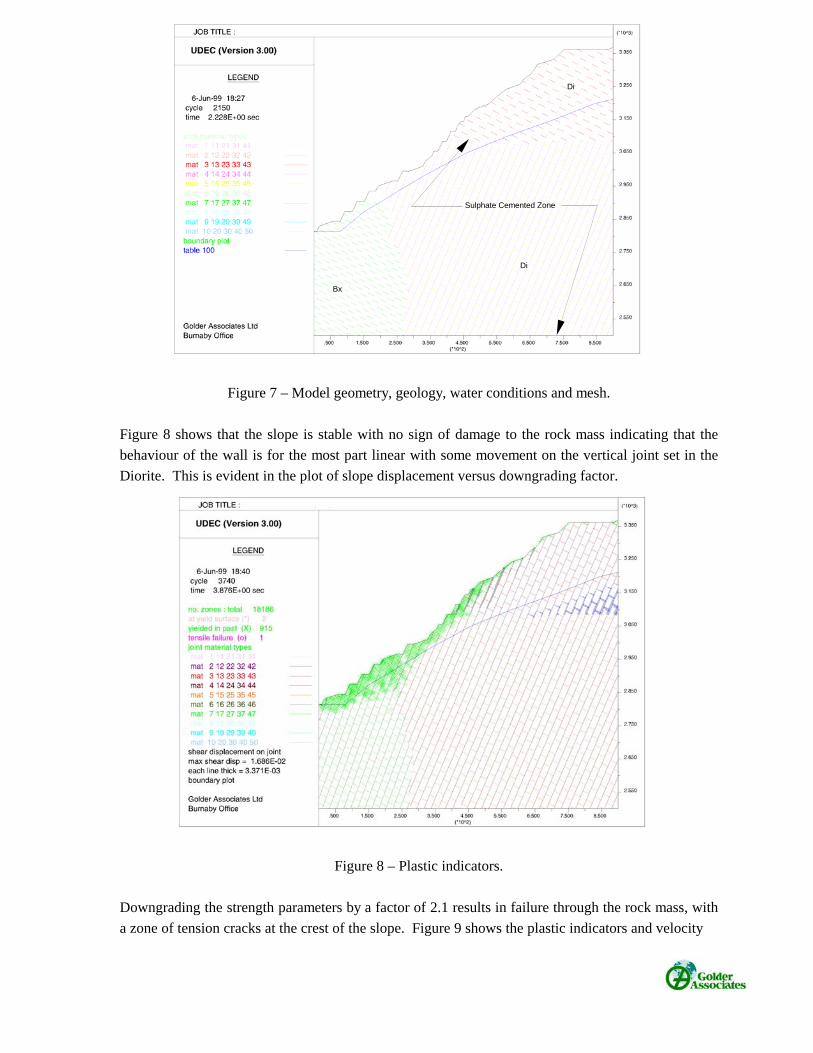
Figure 7 – Model geometry, geology, water conditions and mesh.
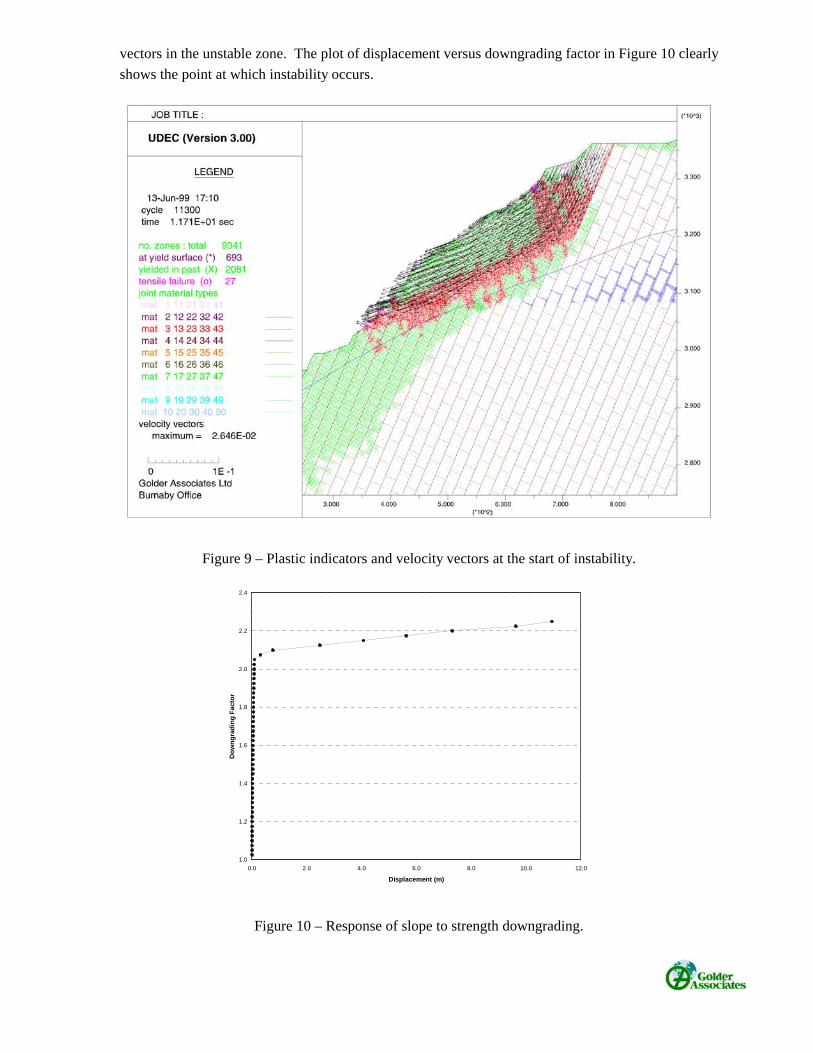
Figure 8 shows that the slope is stable with no sign of damage to the rock mass indicating that the
behaviour of the wall is for the most part linear with some movement on the vertical joint set in the
Diorite. This is evident in the plot of slope displacement versus downgrading factor.
Figure 8 – Plastic indicators.
Downgrading the strength parameters by a factor of 2.1 results in failure through the rock mass, with
a zone of tension cracks at the crest of the slope. Figure 9 shows the plastic indicators and velocity
Di
Di
Bx
Sulphate Cemented Zone
vectors in the unstable zone. The plot of displacement versus downgrading factor in Figure 10 clearly
shows the point at which instability occurs.
Figure 9 – Plastic indicators and velocity vectors at the start of instability.
Figure 10 – Response of slope to strength downgrading.
1.0
1.2
1.4
1.6
1.8
2.0
2.2
2.4
0.0 2.0 4.0 6.0 8.0 10.0 12.0
Displacement (m)
Do
wn
gra
din
g F
acto
r
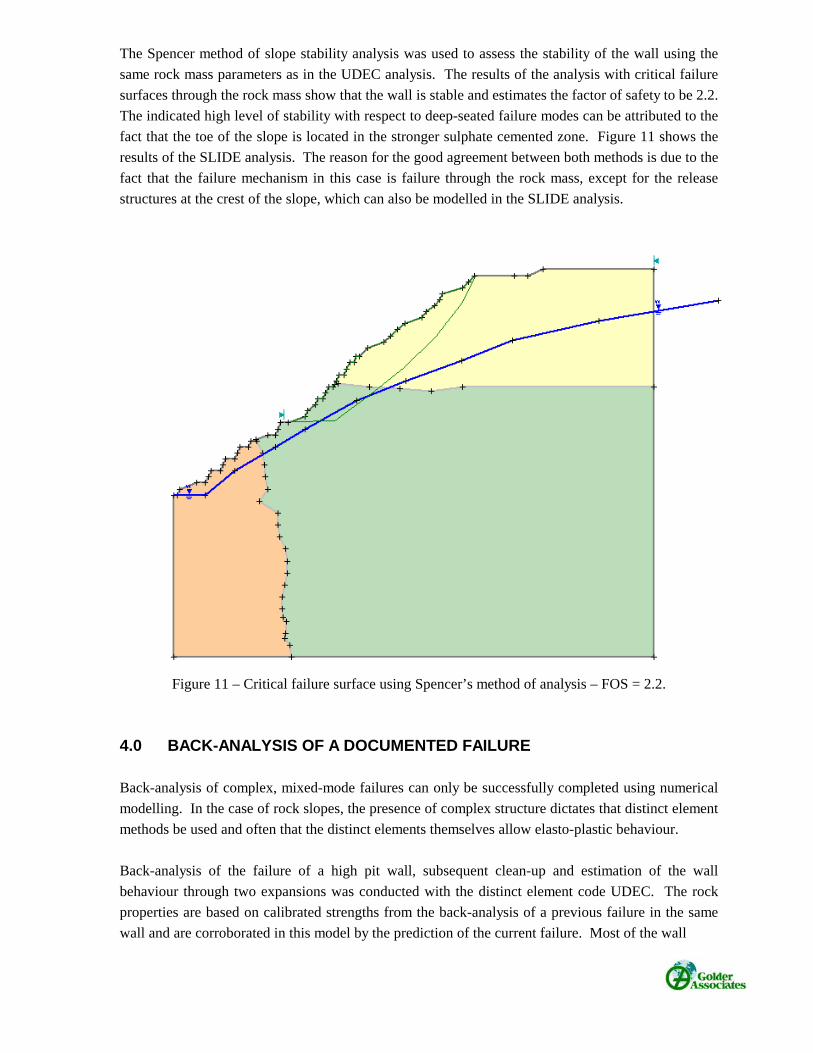
The Spencer method of slope stability analysis was used to assess the stability of the wall using the
same rock mass parameters as in the UDEC analysis. The results of the analysis with critical failure
surfaces through the rock mass show that the wall is stable and estimates the factor of safety to be 2.2.
The indicated high level of stability with respect to deep-seated failure modes can be attributed to the
fact that the toe of the slope is located in the stronger sulphate cemented zone. Figure 11 shows the
results of the SLIDE analysis. The reason for the good agreement between both methods is due to the
fact that the failure mechanism in this case is failure through the rock mass, except for the release
structures at the crest of the slope, which can also be modelled in the SLIDE analysis.
Figure 11 – Critical failure surface using Spencer’s method of analysis – FOS = 2.2.
4.0 BACK-ANALYSIS OF A DOCUMENTED FAILURE
Back-analysis of complex, mixed-mode failures can only be successfully completed using numerical
modelling. In the case of rock slopes, the presence of complex structure dictates that distinct element
methods be used and often that the distinct elements themselves allow elasto-plastic behaviour.
Back-analysis of the failure of a high pit wall, subsequent clean-up and estimation of the wall
behaviour through two expansions was conducted with the distinct element code UDEC. The rock
properties are based on calibrated strengths from the back-analysis of a previous failure in the same
wall and are corroborated in this model by the prediction of the current failure. Most of the wall
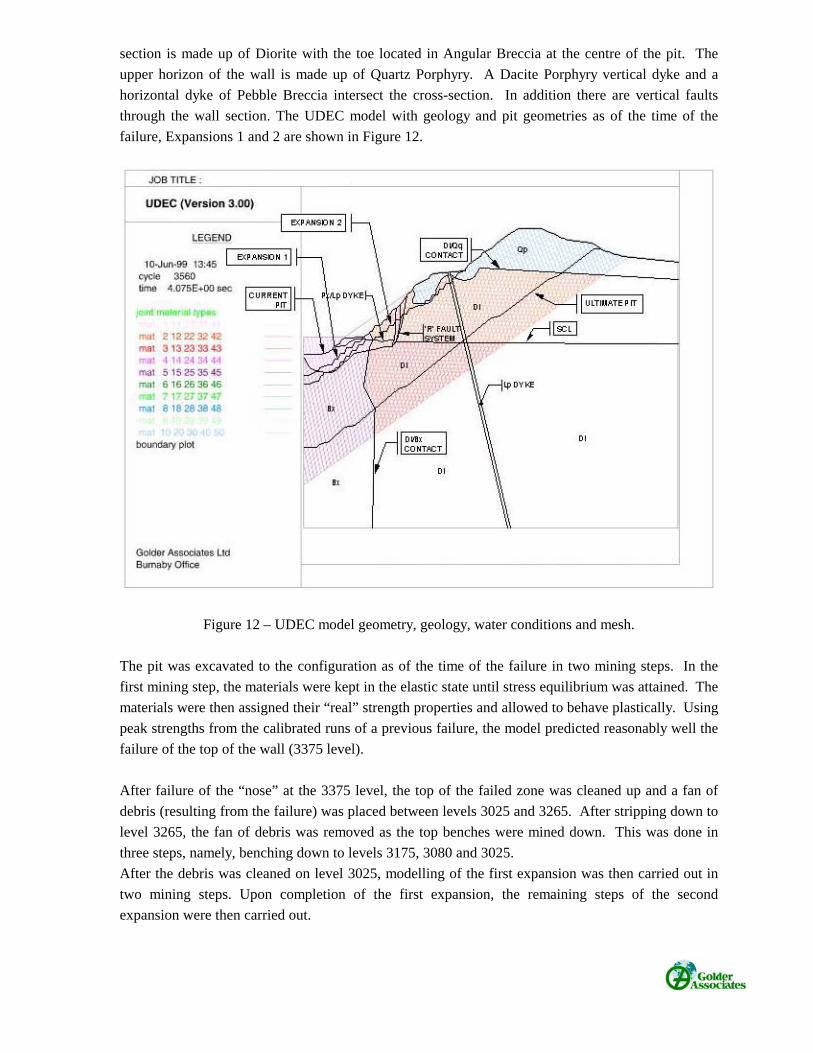
section is made up of Diorite with the toe located in Angular Breccia at the centre of the pit. The
upper horizon of the wall is made up of Quartz Porphyry. A Dacite Porphyry vertical dyke and a
horizontal dyke of Pebble Breccia intersect the cross-section. In addition there are vertical faults
through the wall section. The UDEC model with geology and pit geometries as of the time of the
failure, Expansions 1 and 2 are shown in Figure 12.
Figure 12 – UDEC model geometry, geology, water conditions and mesh.
The pit was excavated to the configuration as of the time of the failure in two mining steps. In the
first mining step, the materials were kept in the elastic state until stress equilibrium was attained. The
materials were then assigned their “real” strength properties and allowed to behave plastically. Using
peak strengths from the calibrated runs of a previous failure, the model predicted reasonably well the
failure of the top of the wall (3375 level).
After failure of the “nose” at the 3375 level, the top of the failed zone was cleaned up and a fan of
debris (resulting from the failure) was placed between levels 3025 and 3265. After stripping down to
level 3265, the fan of debris was removed as the top benches were mined down. This was done in
three steps, namely, benching down to levels 3175, 3080 and 3025.
After the debris was cleaned on level 3025, modelling of the first expansion was then carried out in
two mining steps. Upon completion of the first expansion, the remaining steps of the second
expansion were then carried out.
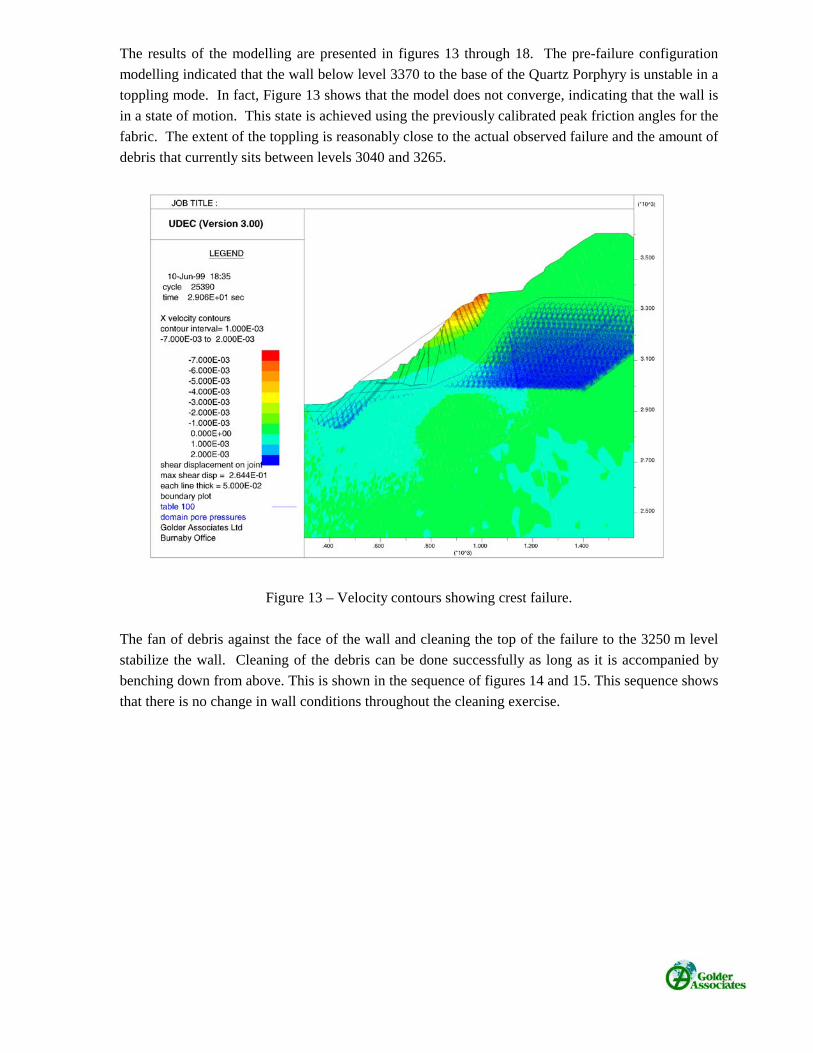
The results of the modelling are presented in figures 13 through 18. The pre-failure configuration
modelling indicated that the wall below level 3370 to the base of the Quartz Porphyry is unstable in a
toppling mode. In fact, Figure 13 shows that the model does not converge, indicating that the wall is
in a state of motion. This state is achieved using the previously calibrated peak friction angles for the
fabric. The extent of the toppling is reasonably close to the actual observed failure and the amount of
debris that currently sits between levels 3040 and 3265.
Figure 13 – Velocity contours showing crest failure.
The fan of debris against the face of the wall and cleaning the top of the failure to the 3250 m level
stabilize the wall. Cleaning of the debris can be done successfully as long as it is accompanied by
benching down from above. This is shown in the sequence of figures 14 and 15. This sequence shows
that there is no change in wall conditions throughout the cleaning exercise.
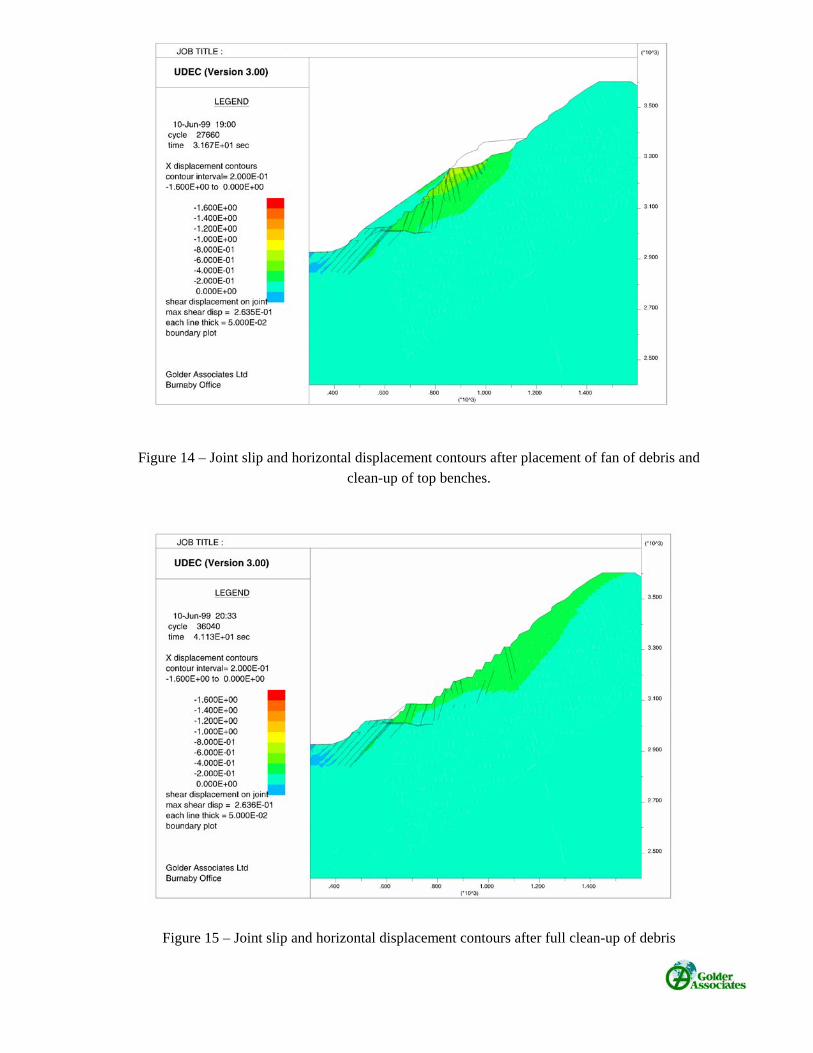
Figure 14 – Joint slip and horizontal displacement contours after placement of fan of debris and clean-up of top benches.
Figure 15 – Joint slip and horizontal displacement contours after full clean-up of debris
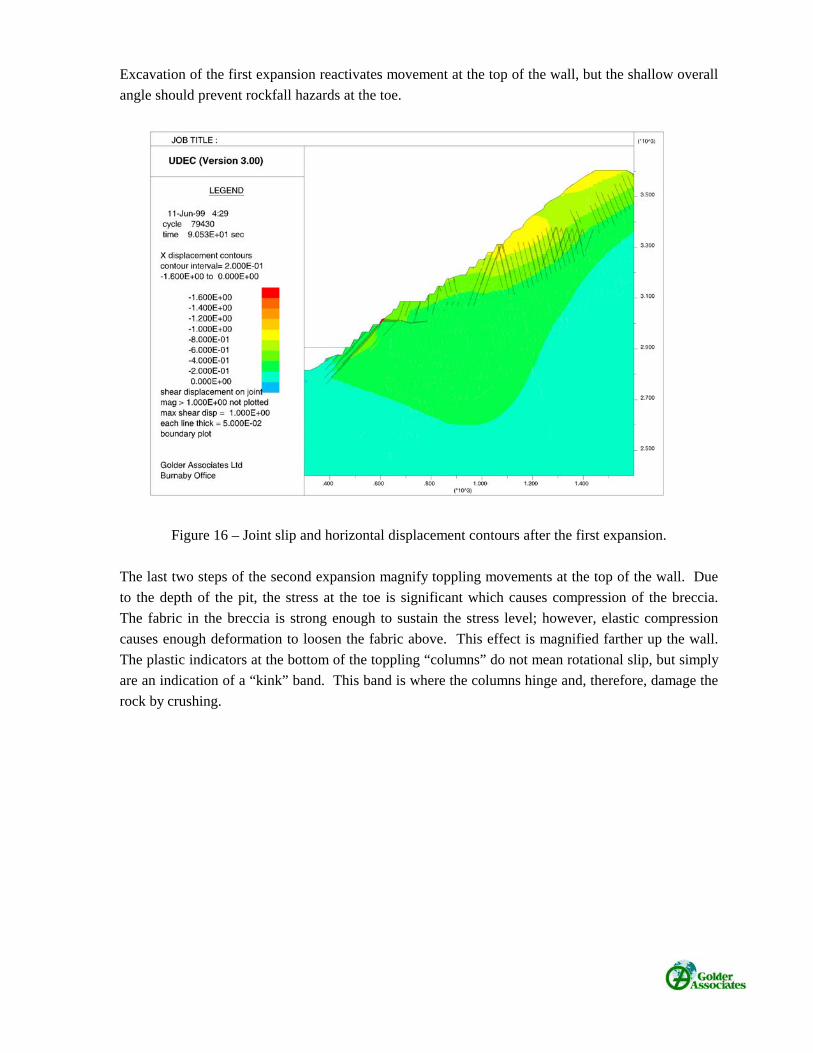
Excavation of the first expansion reactivates movement at the top of the wall, but the shallow overall
angle should prevent rockfall hazards at the toe.
Figure 16 – Joint slip and horizontal displacement contours after the first expansion.
The last two steps of the second expansion magnify toppling movements at the top of the wall. Due
to the depth of the pit, the stress at the toe is significant which causes compression of the breccia.
The fabric in the breccia is strong enough to sustain the stress level; however, elastic compression
causes enough deformation to loosen the fabric above. This effect is magnified farther up the wall.
The plastic indicators at the bottom of the toppling “columns” do not mean rotational slip, but simply
are an indication of a “kink” band. This band is where the columns hinge and, therefore, damage the
rock by crushing.
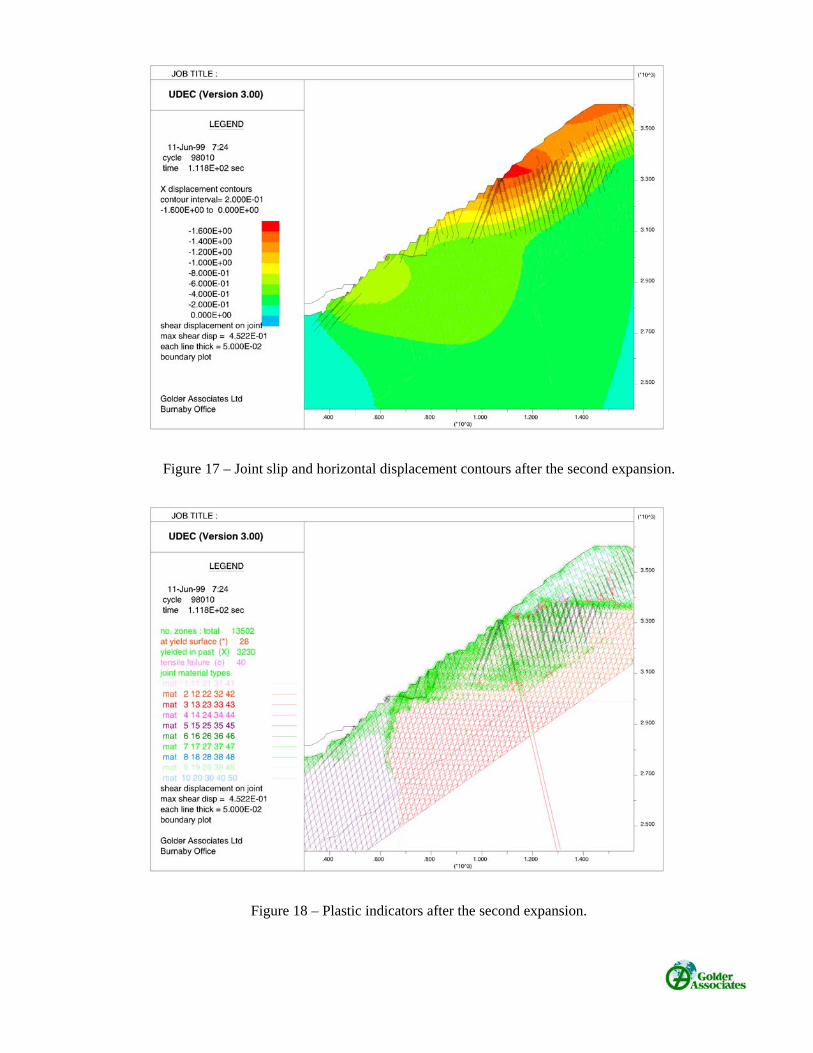
Figure 17 – Joint slip and horizontal displacement contours after the second expansion.
Figure 18 – Plastic indicators after the second expansion.

5.0 CLOSING REMARKS
In the few examples presented in this article it has been shown that there is a place for both the simple
and the more sophisticated methods of analyses when dealing with open pit stability. While a
reasonable cross-section of the different methods was presented, by no means does it exhaust the
available tools. For instance, the last example showed a toppling situation analysed with a numerical
approach, however, there are limit equilibrium tools that deal with toppling specifically and it can
even be handled at the stereonet level. What the simpler methods cannot do is to reveal the triggers
for such behaviour, therefore, they tend to be used more at the preliminary design stages. In addition,
three-dimensional modelling is becoming more common, especially when dealing with back-analysis
of complex geology and geometry. These three-dimensional tools are available both for limit
equilibrium methods as well as for continuum and distinct elements. Three-dimensional analysis are
usually costly not only because the problems require more computational time but interpretation of
the results becomes more involved and the parameter calibration process is more difficult.