globalization, structural change, and economic...
TRANSCRIPT

Globalization, structural change, and economic
growth
Dani RodrikApril 2011
Based on a paper with the title “Globalization, Structural Change, and Productivity Growth,” authored jointly with Margaret McMillan (IFPRI). I acknowledge financial support from IFPRI and a joint IL-WTO project on "Making Globalization Socially Sustainable."

Productivity growth through structural change
Importance of mis-allocation Recent work focuses on within-industry
misallocation Older tradition of dual-economy models focused
on broad structural change This work reminiscent of that older tradition and
complements more disaggregated research

Productivity gaps are large in developing countries

Productivity gaps diminish over the course of development
MWI
ETH
ZMBGHA
KEN
SEN
NGA
BOL
IND
CHN
PHLIDN
BRAPER
THA
COL
CRI
VEN
MEXTURCHLARG
MYSKOR
MUS
ZAF
DNKTWN
ESP
UKM
JPN
SWEITA
NLD
FRA
SGP
HKG
USA
-.35
-.3-.2
5-.2
-.15
Com
pone
nt p
lus
resi
dual
7 8 9 10 11lnlabprod05
Relationship between inter-sectoral productivity gaps and income levels

Growth requires both new activities and ongoing structural change
050
100
7 8 9 10 11ln_sumlprod
In %, = (agr_lprod_kppp00/non_agr_lprod_kppp00)*100 Fitted values
196019611962
19631964
19651966
1967196819691970
1971
19721973
19741975
197619771978
197919801981
198219831984198519861987
1988198919901991199219931994
1995199619971998
199920002001
200220032004
2005
1950 19541955
1956195719581959
19601961
1962196319641965196619671968
1969197019711972
19731974197519761977
1978
197919801981
1982
19831984
19851986
198719881989
1990
1991
19921993
1994
1995
199619971998
199920002001
2002
2003
2004
2005
19601961196219631964
196519661967196819691970197119721973197419751976197719781979
1980198119821983
1984198519861987
1988
19891990199119921993
19941995199619971998
1999200020012002200320042005
2040
6080
100
In %
, = (a
gr_l
prod
_kpp
p00/
non_
agr_
lpro
d_kp
pp00
7 8 9 10 11ln_sumlprod
IND FRAPER
Relationship between economy-wide labor productivity (horizontal axis) and the ratio of agricultural productivity to non-agricultural productivity (percent, vertical axis)

Data sources
Start from Groningen Growth and Development Center (GGDC) data base, which provides employment and real valued added statistics for 27 countries disaggregated into 10 sectors (Timmer and de Vries, 2007; 2009)– We converted local currency value added at 2000 prices to dollars using 2000
PPP exchange rates.
Complement with data from national sources for 11 additional countries (China, Turkey, and several African countries)
For the most part, VA comes from national income accounts, while level and structure of employment come from population censuses (and other household surveys)– Since employment data are not based on labor force or industrial surveys (save
for extrapolation purposes), coverage of informal sector should be less problematic than otherwise
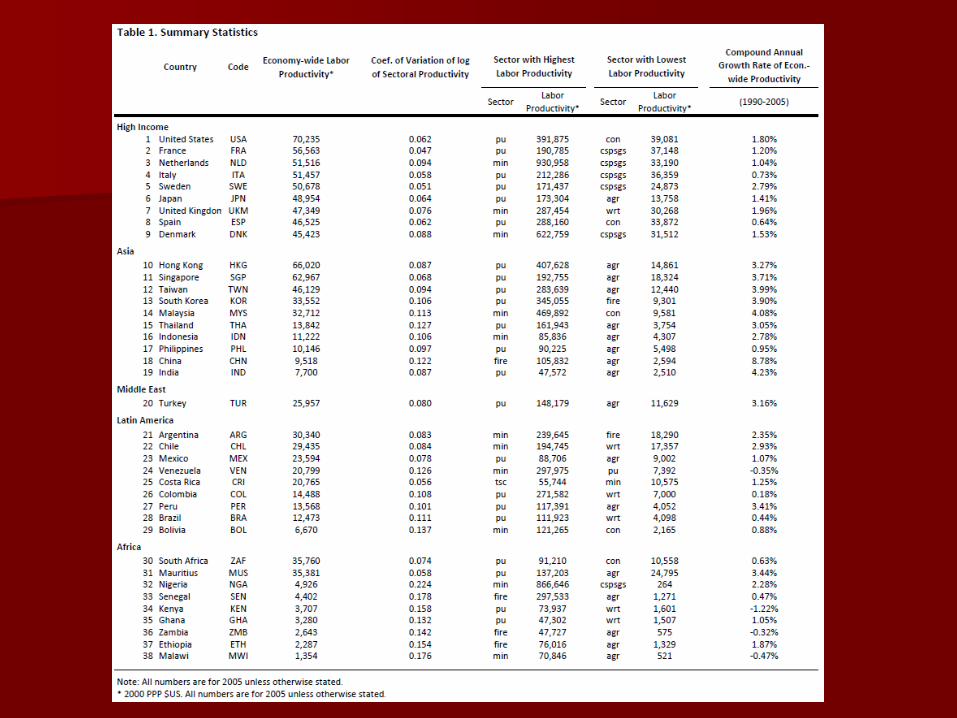
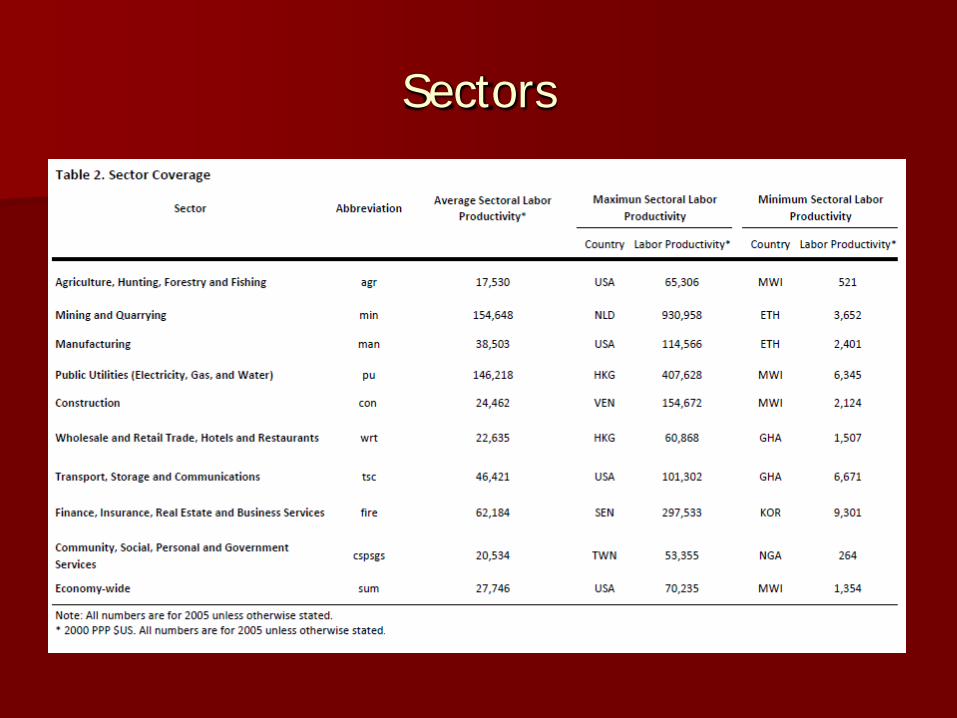
Sectors

Decomposing labor productivity growth
∑∑==
− ∆+∆=∆ni
tititini
ktit yyY ,,,, θθ
within structural change
Y refers to aggregate labor productivity, y is sectoral labor productivity, θis employment share, Δ is the first-difference operator, i indexes sectors, t -k and t stand for initial and final years.
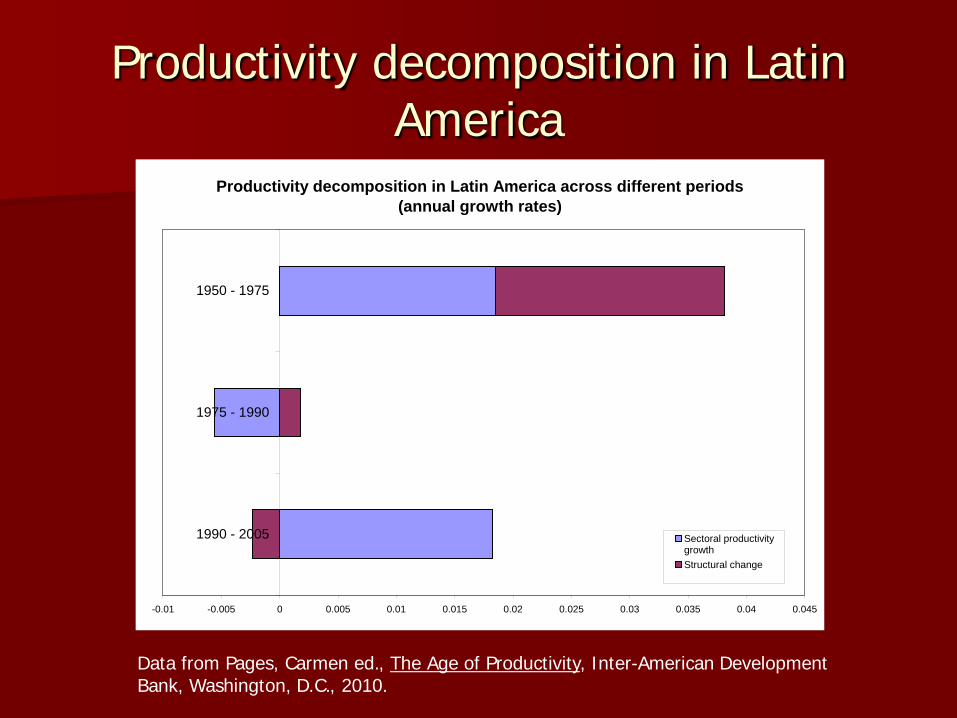
Productivity decomposition in Latin America
Productivity decomposition in Latin America across different periods(annual growth rates)
-0.01 -0.005 0 0.005 0.01 0.015 0.02 0.025 0.03 0.035 0.04 0.045
1990 - 2005
1975 - 1990
1950 - 1975
Sectoral productivitygrowthStructural change
Data from Pages, Carmen ed., The Age of Productivity, Inter-American Development Bank, Washington, D.C., 2010.

… and across regions
-0.02 -0.01 0 0.01 0.02 0.03 0.04 0.05
HI
ASIA
AFRICA
LAC
within
structural
Decomposition of productivity growth by country group, 1990-2005
Productivity growth within sectors
Productivity growth due to structural change
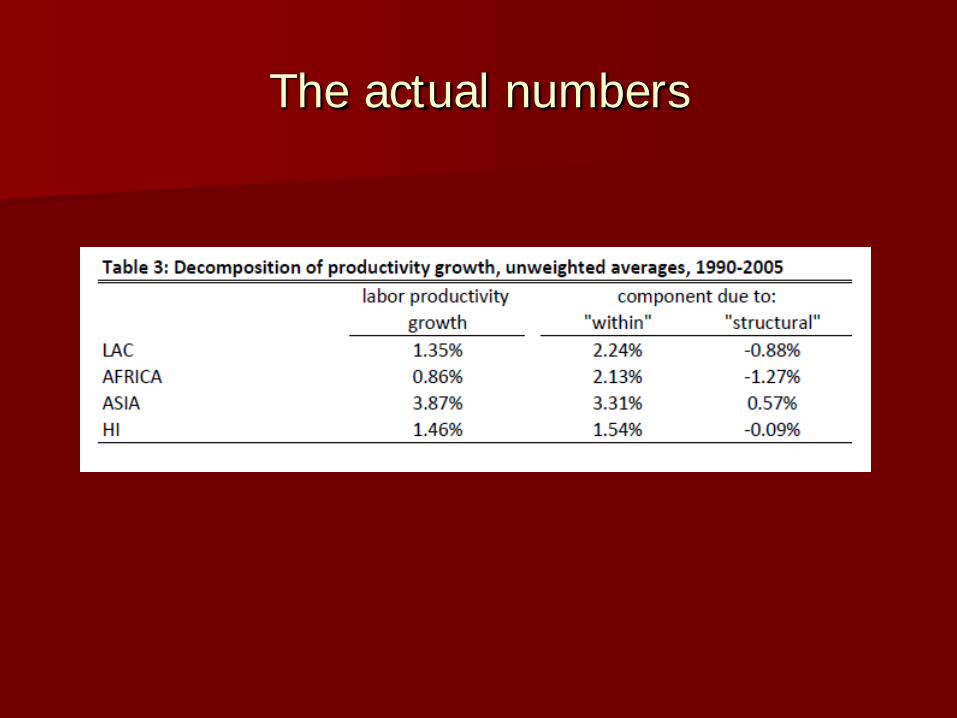
The actual numbers
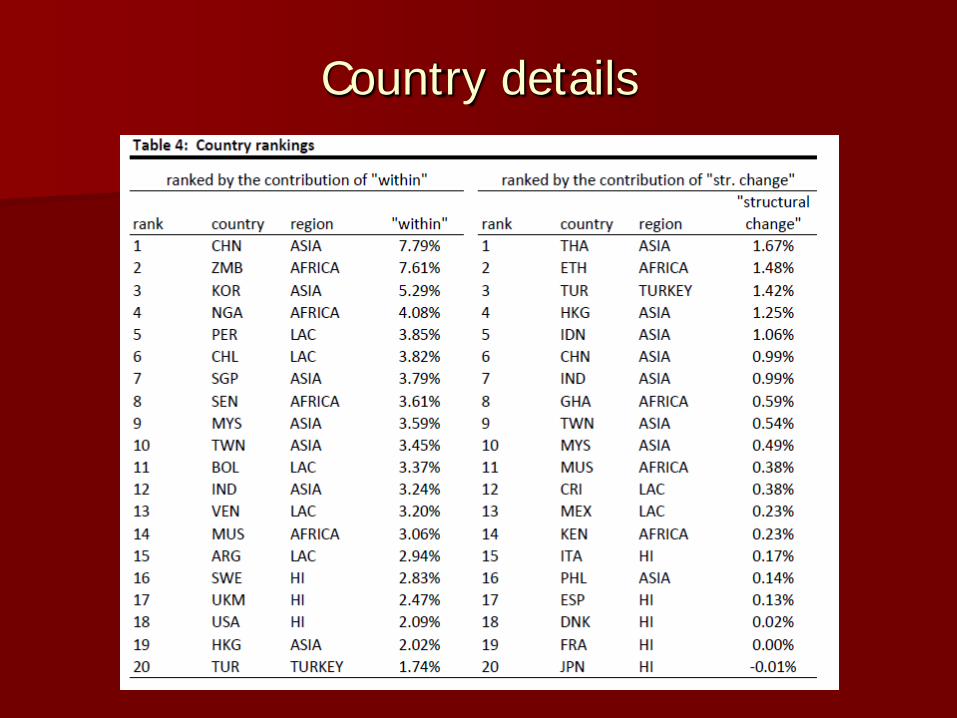
Country details
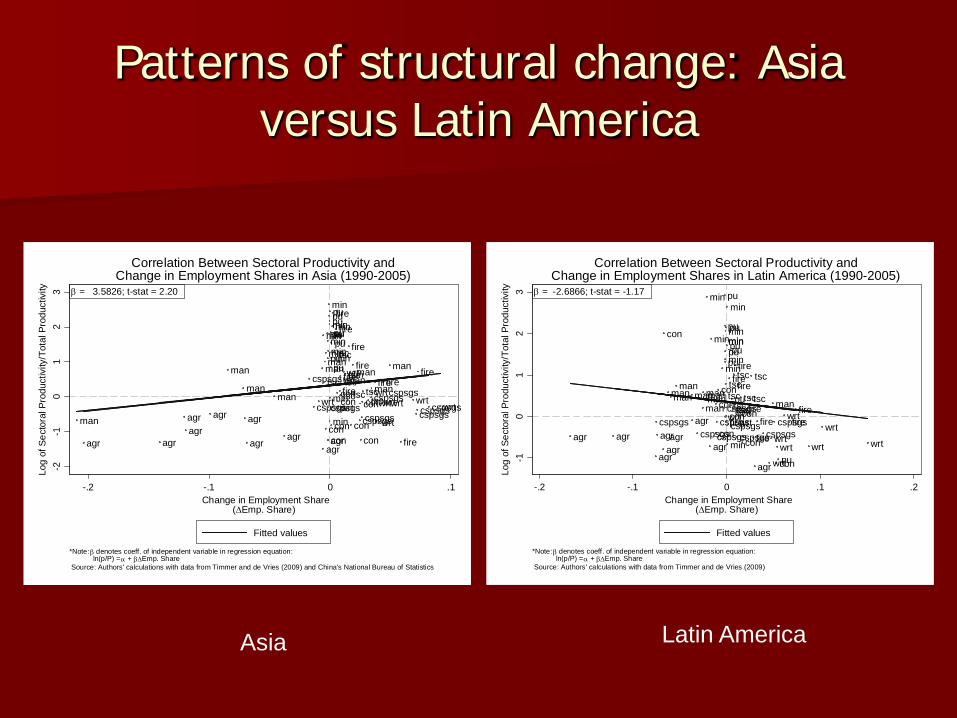
Patterns of structural change: Asia versus Latin America
agr con
cspsgsfire
man
min
pu
tsc
wrtagr
con
cspsgs
fire
man
min
pu
tsc
wrtagr
con
cspsgs
fire
man
minpu
tsc
wrt
agr
con
cspsgs
fireman
minpu
tsc
wrtagr
concspsgsfireman
min
pu
tsc
wrtagr concspsgs
fire
man
min
pu
tsc
wrt
agrcon
cspsgs fireman
minputsc
wrt
agr
con
cspsgs
fireman
minpu
tsc
wrt
agr
con
cspsgsfire
man
min
pu
tsc
wrt
-10
12
3Lo
g of
Sec
tora
l Pro
duct
ivity
/Tot
al P
rodu
ctiv
ity
-.2 -.1 0 .1 .2Change in Employment Share
(∆Emp. Share)
Fitted values
*Note: β denotes coeff. of independent variable in regression equation: ln(p/P) = α + β∆Emp. ShareSource: Authors' calculations with data from Timmer and de Vries (2009)
β = -2.6866; t-stat = -1.17
Correlation Between Sectoral Productivity andChange in Employment Shares in Latin America (1990-2005)
agr
con cspsgs
fire
man
minpu
tscwrt
agr
con
cspsgs
fire
man
min
pu
tsc wrt
agr
concspsgs
fire
man
min
pu
tsc wrt
agr
concspsgs
fire
man
min
pu
tsc
wrt
agr
con
cspsgs
fire
man
min
pu
tsc
wrtagr
con
cspsgs
fire
man
min
pu
tsc
wrtagr
concspsgs
fireman
min
pu
tscwrt
agrcon cspsgs
fireman
min
pu
tscwrt
agr
con
cspsgsfire
man
minpu
tsc
wrt
agr con
cspsgsfire
man
min
pu
tsc
wrt
-2-1
01
23
Log
of S
ecto
ral P
rodu
ctiv
ity/T
otal
Pro
duct
ivity
-.2 -.1 0 .1Change in Employment Share
(∆Emp. Share)
Fitted values
*Note: β denotes coeff. of independent variable in regression equation: ln(p/P) = α + β∆Emp. ShareSource: Authors' calculations with data from Timmer and de Vries (2009) and China's National Bureau of Statistics
β = 3.5826; t-stat = 2.20
Correlation Between Sectoral Productivity andChange in Employment Shares in Asia (1990-2005)
Asia Latin America
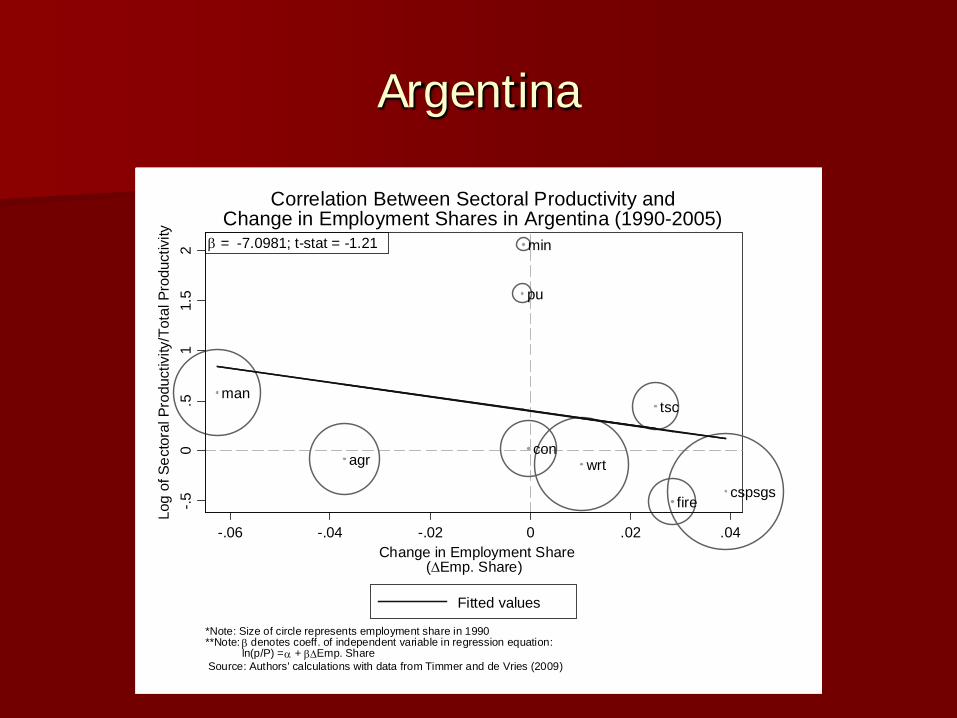
Argentina
agrcon
cspsgsfire
man
min
pu
tsc
wrt
-.50
.51
1.5
2Lo
g of
Sec
tora
l Pro
duct
ivity
/Tot
al P
rodu
ctiv
ity
-.06 -.04 -.02 0 .02 .04Change in Employment Share
(∆Emp. Share)
Fitted values
*Note: Size of circle represents employment share in 1990**Note: β denotes coeff. of independent variable in regression equation: ln(p/P) = α + β∆Emp. ShareSource: Authors' calculations with data from Timmer and de Vries (2009)
β = -7.0981; t-stat = -1.21
Correlation Between Sectoral Productivity andChange in Employment Shares in Argentina (1990-2005)

Brazil
agr
con
cspsgs
fire
man
min
pu
tsc
wrt-10
12
Log
of S
ecto
ral P
rodu
ctiv
ity/T
otal
Pro
duct
ivity
-.1 -.05 0 .05Change in Employment Share
(∆Emp. Share)
Fitted values
*Note: Size of circle represents employment share in 1990**Note: β denotes coeff. of independent variable in regression equation: ln(p/P) = α + β∆Emp. ShareSource: Authors' calculations with data from Timmer and de Vries (2009)
β = -2.2102; t-stat = -0.17
Correlation Between Sectoral Productivity andChange in Employment Shares in Brazil (1990-2005)
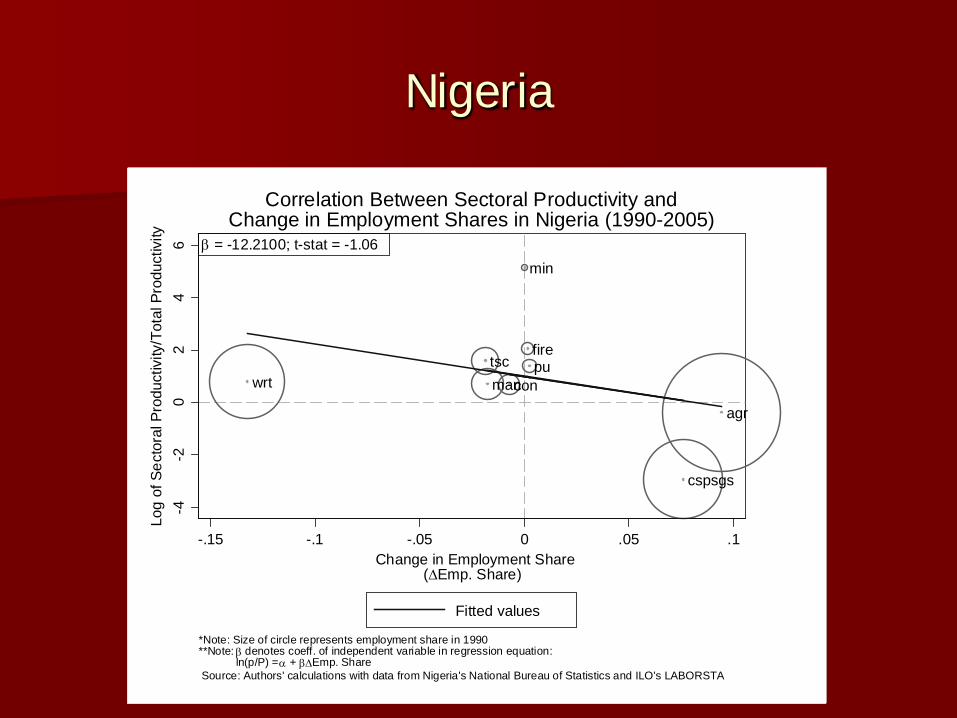
Nigeria
agr
con
cspsgs
fire
man
min
putscwrt
-4-2
02
46
Log
of S
ecto
ral P
rodu
ctiv
ity/T
otal
Pro
duct
ivity
-.15 -.1 -.05 0 .05 .1Change in Employment Share
(∆Emp. Share)
Fitted values
*Note: Size of circle represents employment share in 1990**Note: β denotes coeff. of independent variable in regression equation: ln(p/P) = α + β∆Emp. ShareSource: Authors' calculations with data from Nigeria's National Bureau of Statistics and ILO's LABORSTA
β = -12.2100; t-stat = -1.06
Correlation Between Sectoral Productivity andChange in Employment Shares in Nigeria (1990-2005)

Zambia
agr
con
cspsgs
fire
man
min pu
tscwrt
-2-1
01
23
Log
of S
ecto
ral P
rodu
ctiv
ity/T
otal
Pro
duct
ivity
-.1 0 .1 .2Change in Employment Share
(∆Emp. Share)
Fitted values
*Note: Size of circle represents employment share in 1990**Note: β denotes coeff. of independent variable in regression equation: ln(p/P) = α + β∆Emp. ShareSource: Authors' calculations with data from CSO, Bank of Zambia, and ILO's KILM
β = -10.9531; t-stat = -3.25
Correlation Between Sectoral Productivity andChange in Employment Shares in Zambia (1990-2005)

India
agr
concspsgs
fire
man
min
pu
tsc
wrt
-10
12
Log
of S
ecto
ral P
rodu
ctiv
ity/T
otal
Pro
duct
ivity
-.04 -.02 0 .02Change in Employment Share
(∆Emp. Share)
Fitted values
*Note: Size of circle represents employment share in 1990**Note: β denotes coeff. of independent variable in regression equation: ln(p/P) = α + β∆Emp. ShareSource: Authors' calculations with data from Timmer and de Vries (2009)
β = 35.2372; t-stat = 2.97
Correlation Between Sectoral Productivity andChange in Employment Shares in India (1990-2005)

Thailand
agr
con
cspsgsfire
man
minpu
tsc
wrt
-10
12
3Lo
g of
Sec
tora
l Pro
duct
ivity
/Tot
al P
rodu
ctiv
ity
-.2 -.1 0 .1Change in Employment Share
(∆Emp. Share)
Fitted values
*Note: Size of circle represents employment share in 1990**Note: β denotes coeff. of independent variable in regression equation: ln(p/P) = α + β∆Emp. ShareSource: Authors' calculations with data from Timmer and de Vries (2009)
β = 5.1686; t-stat = 1.27
Correlation Between Sectoral Productivity andChange in Employment Shares in Thailand (1990-2005)

What’s going on? Some possibilities:
Some countries have more “surplus labor” in agriculture than others
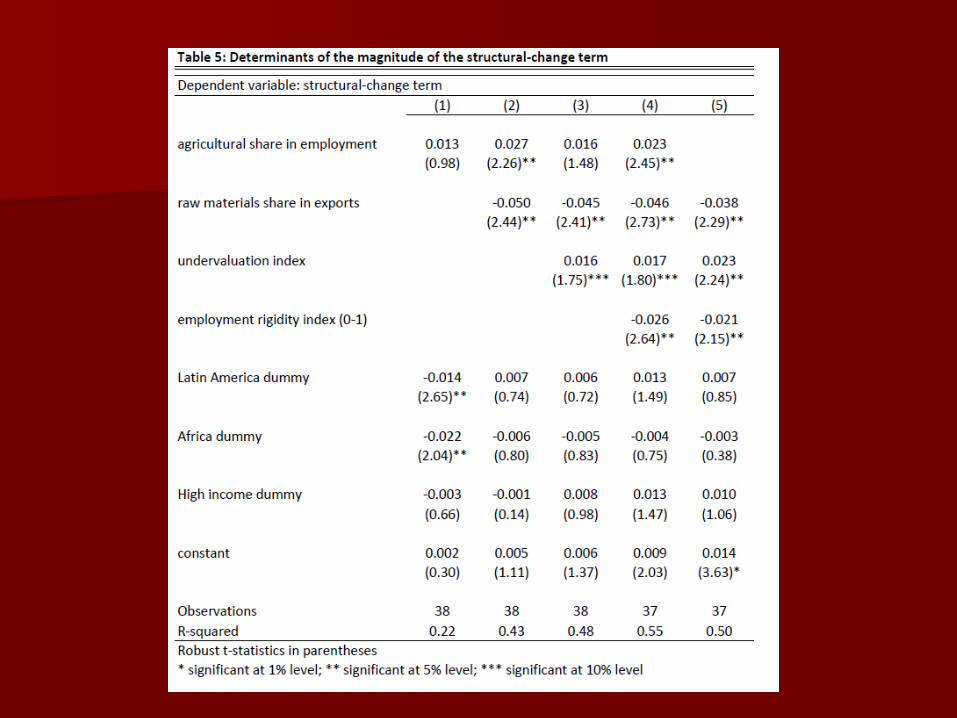
Role of comparative advantage: primary products versus manufactures
Labor market rigidity: large hiring/firing costs may prevent employment growth in dynamic sectors
Trade/industrial/currency policies have:– Not encouraged new tradable activities sufficiently– Exposed tradables to import competition too early
and excessively

Large reservoir of “excess labor” helps, but only conditionally
SGP
HKG
USAUKMSWENLD
DNKFRAITAJPNESP
ARG
TWN
VEN
ZAFMUS
KORCHL
MEXBRA
MYSCRI
COLPER
BOL
PHL
TUR
NGA
IDN
ZMB
CHN
THA
GHA
SEN
IND
KEN
MWI
ETH
-.08
-.06
-.04
-.02
0.0
2C
ompo
nent
plu
s re
sidu
al
0 .2 .4 .6 .8 1Labor share of agriculture, 1990
SGP
HKG
USAUKM
SWE
NLD
DNK
FRA
ITA
JPN
ESPARG
VEN
ZAFMUS
KOR
CHL
MEX
BRAMYS
CRI
COL
PER
BOLPHL
TURNGA
IDN
ZMB
CHN
THA
GHA
SEN
IND
KEN
MWIETH
-.04
-.02
0.0
2.0
4C
ompo
nent
plu
s re
sidu
al0 .2 .4 .6 .8 1
Labor share of agriculture, 1990
Association between the initial labor share in agriculture and the contribution of structural change to growth
unconditional conditional
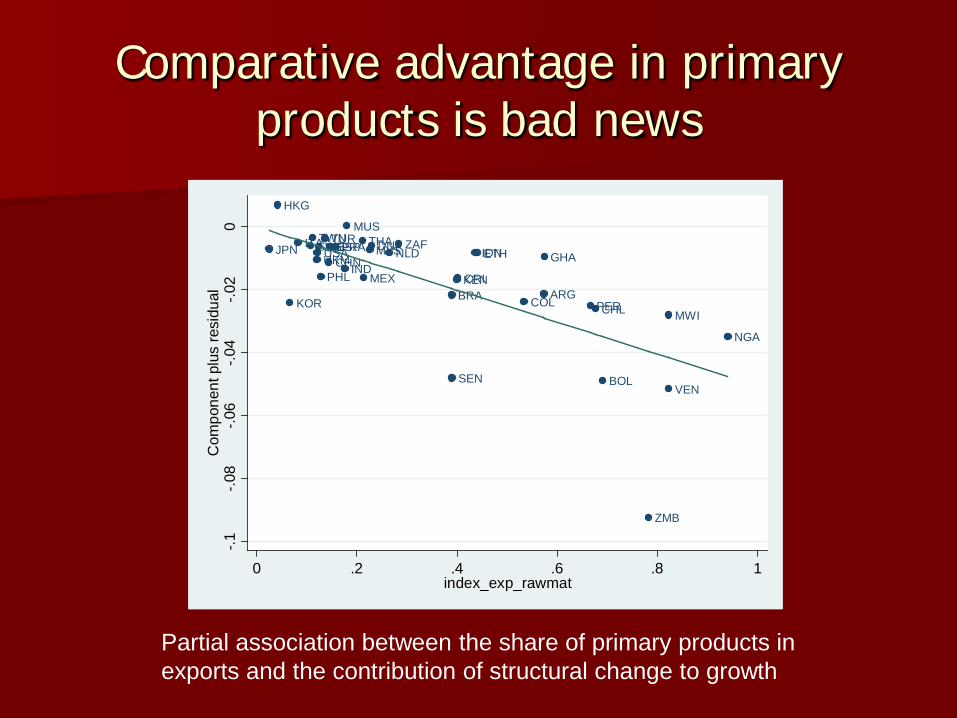
Comparative advantage in primary products is bad news
JPN
HKG
KOR
ITASWETWN
UKMUSASGP
PHL
TUR
CHNESPFRA
IND
MUSTHA
MEX
MYSDNKNLDZAF
BRA
SEN
KENCRI
IDNETH
COLARG
GHA
PERCHL
BOL
ZMB
MWI
VEN
NGA
-.1-.0
8-.0
6-.0
4-.0
20
Com
pone
nt p
lus
resi
dual
0 .2 .4 .6 .8 1index_exp_rawmat
Partial association between the share of primary products in exports and the contribution of structural change to growth

But policy can clearly help: currency undervaluation
JPN
DNK
SWE
NLDFRA
UKMITA
NGA
ESPUSA
ZMB
MEX
TWNSGP
KOR
HKGTURPERARG
SEN
VEN
BRA
CRIZAF
BOL
KEN
GHA
CHL
MWI
MYSCOL
THA
ETH
PHL
CHN
IDN
IND
MUS
-.06
-.04
-.02
0.0
2C
ompo
nent
plu
s re
sidu
al
-1 -.5 0 .5 1underval
Partial association between an index of currency “undervaluation” and the contribution of structural change to growth

But policy can clearly help: labor market rigidity
Partial association between an index of labor market rigidity and the contribution of structural change to growth
HKG
USA
SGP DNK
NGA
UKM
MYS
COL
THA
JPN
KENMUSCHL
MWI
ARG
ZMB
GHA
ETH
PHLINDCHN
ZAFTUR
SWE
KOR
ITA
PER
CRI
IDN
MEX
NLD
BRAESP
FRA
SEN
VEN
BOL
-.06
-.04
-.02
0.0
2C
ompo
nent
plu
s re
sidu
al
0 .2 .4 .6 .8Employment rigidity index (0=less rigid, 1=more rigid)
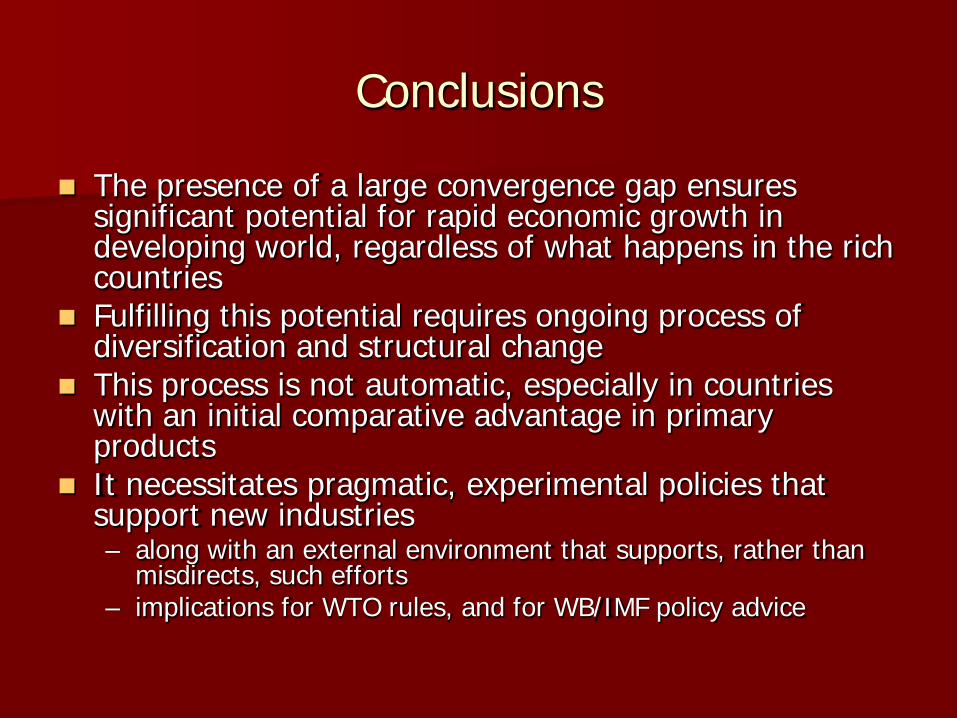
Conclusions
The presence of a large convergence gap ensures significant potential for rapid economic growth in developing world, regardless of what happens in the rich countries
Fulfilling this potential requires ongoing process of diversification and structural change
This process is not automatic, especially in countries with an initial comparative advantage in primary products
It necessitates pragmatic, experimental policies that support new industries– along with an external environment that supports, rather than
misdirects, such efforts – implications for WTO rules, and for WB/IMF policy advice