globalization and logistics: basics - exercises - case studies
TRANSCRIPT
Springer Texts in Business and Economics
Logistics
Harald GleissnerJ. Christian Femerling
Basics – Exercises – Case Studies

Springer Texts in Business and Economics
For further volumes:http://www.springer.com/series/10099

ThiS is a FM Blank Page
Harald Gleissner • J. Christian Femerling
Logistics
Basics – Exercises – Case Studies
Harald GleissnerBerlin School of Economics and LawBerlinGermany
J. Christian FemerlingInvesta Holding GmbHEschbornGermany
ISSN 2192-4333 ISSN 2192-4341 (electronic)ISBN 978-3-319-01768-6 ISBN 978-3-319-01769-3 (eBook)DOI 10.1007/978-3-319-01769-3Springer Cham Heidelberg New York Dordrecht London
Library of Congress Control Number: 2013956625
# Springer International Publishing Switzerland 2013
This work is subject to copyright. All rights are reserved by the Publisher, whether the whole or part
of the material is concerned, specifically the rights of translation, reprinting, reuse of illustrations,
recitation, broadcasting, reproduction on microfilms or in any other physical way, and transmission or
information storage and retrieval, electronic adaptation, computer software, or by similar or dissimilar
methodology now known or hereafter developed. Exempted from this legal reservation are brief excerpts
in connection with reviews or scholarly analysis or material supplied specifically for the purpose of being
entered and executed on a computer system, for exclusive use by the purchaser of the work. Duplication
of this publication or parts thereof is permitted only under the provisions of the Copyright Law of the
Publisher’s location, in its current version, and permission for use must always be obtained from
Springer. Permissions for use may be obtained through RightsLink at the Copyright Clearance Center.
Violations are liable to prosecution under the respective Copyright Law.
The use of general descriptive names, registered names, trademarks, service marks, etc. in this
publication does not imply, even in the absence of a specific statement, that such names are exempt
from the relevant protective laws and regulations and therefore free for general use.
While the advice and information in this book are believed to be true and accurate at the date of
publication, neither the authors nor the editors nor the publisher can accept any legal responsibility for
any errors or omissions that may be made. The publisher makes no warranty, express or implied, with
respect to the material contained herein.
Printed on acid-free paper
Springer is part of Springer Science+Business Media (www.springer.com)
Translation from the German language edition: Logistik by Harald Gleißner and J. ChristianFemerling Copyright# 2012 Springer Gabler Springer Gabler is a part of Springer Science +Business Media All Rights Reserved
Preface
Globalization and Logistics are closely connected, just as Globalization and Aca-
demic Lecturing are. This poses new challenges in studying Logistics and makes
textbooks in English an important tool in college and university curricula that deal
with transportation, logistics, and supply chain management.
The idea of offering a textbook in two languages was conceived after the success
of the first volume of Logistik: Grundlagen – Ubungen – Fallbeispiele, published in2008. At that time, it was an early textbook primarily intended for students enrolled
in bachelor degree programs in Logistics, and was extremely well received among
academics and industry experts. Based on their own teaching experience, the
authors later decided to prepare an English edition of the book to support interna-
tional academic environments.
In 2012, Gleissner and Femerling published a second edited volume in German,
expanded by two additional chapters, “Logistics Infrastructure” and “Logistics and
Finance,” which are also included in this English edition. In comparison to the
German edition, the bibliography of this edition contains additional references
concerning relevant US and British literature.
The goal of the book is to present basic logistics concepts and principles in a
format that is useful for students as well as practitioners dealing with logistic issues
for the first time.
The chapters therefore will help readers by providing:
¢ Learning objectives at the beginning of each chapter
¢ In-depth case studies
¢ Corporate applications in the industry
¢ End-of-chapter questions
¢ Chapter-specific references
¢ Chapter-specific recommendations for further reading
For application and further information, readers are advised to consult Gleissnerand Moller: Case Studies in Logistics from 2011.
We owe considerable thanks to all companies involved for their cooperation in
providing insights into their business in the form of examples and case studies. We
also wish to thank our publisher for encouraging us to pen the English edition of this
book. Our special thanks for finishing the book in English go to Patrick Speckamp
v

(London, UK), Ralph G. Kauffman (Houston, Texas, US), Vin Nguyen Truc (Perth,
Australia), Claudia Wittmann (Berlin, Germany), and last but not least Anja
Foerster and Stefan Baier (Berlin, Germany) for much-appreciated editing work.
It was a pleasure working with all of them.
Berlin, Germany Harald A. Gleissner und J. Christian Femerling
May 2013
vi Preface

Abbreviations
AG Aktiengesellschaft ¼ Public Limited Company (PLC)
AGV Automated Guided Vehicle Systems
ANSI American National Standards Institute
APS Advanced Planning and Scheduling Systems
ARA Antwerp-Rotterdam-Amsterdam Range
B2B Business to Business
B2C Business to Customer
BASF Badische Anilin- & Soda-Fabrik
BMG Baugruppen- und Modulfertigung GmbH
BMW Bayrische Motorenwerke
BSC Balanced Score Card
BSHG Bosch und Siemens Hausgerate GmbH
bt Billion Ton
CD Cross Docking
CEN Comite Europeen Normalisation
CEP Courier, Express, Parcel
CIF Cost, Insurance, Freight
CMI Co Managed Inventory
CPFR Collaborative Planning Forecasting Replenishment
CRM Customer Relationship Management
CRP Continuous Replenishment Programs
CW Central Warehouse
DB Deutsche Bahn
DCF Discounted Cash Flow
DCM Demand Chain Management
DDP Delivered Duty Paid
DIN e. V. German Institute for Standardization
DIY Do It Yourself
DOS Days of Stock
DP Desktop Purchasing
DPWN Deutsche Post World Net
DTD Document Type Definition
DW Distribution Warehouse
E-Commerce Electronic Commerce
vii

E-Procurement Electronic Procurement
E-Purchasing Electronic Purchasing
E-Sales Electronic Sales
EAN European Article Number
ECR Efficient Consumer Response
EDC European Distribution Centers
EDI Electronic Data Interchange
EDIFACT Electronic Data Interchange for Administration, Commerce and
Transport
EDP Electronic Data Processing
ELA European Logistics Association
EPC Electronic Product Code
ERMTS European Railway Transport Management System
ERP Enterprise Resource Planning System
EU European Union
EWI European Economic Institute
EXW EX Works
FeFo First EXPIRED-FIRST OUT
FiFo First In-First Out
FOB Free On Board
FRG Federal Republic of Germany
ft Feet
FUL Full Truck Load transport
GDP Gross Domestic Product
GLN Global Location Number
Glonass Globalnaja Nawigazionnaja Sputnikowaja Sistema
GmbH Gesellschaft mit beschrankter Haftung ¼ Limited Company
(Ltd)
GPS Global Positioning System
GRAI Global Returnable Asset Identifier
GSM Global System for Mobile Communication
GSM-R Global System for Mobile Communication Railways
GTIN Global Trade Item Number
ha Hektare
HGB Handelsgesetzbuch¼ German Commercial Code
HP Hewlett Packard
HR Human Resource
IATA International Air Transport Association
INCOTERMS International Commercial Terms
ICAO International Civil Aviation Organization
ID Identification
IP Internet Protocol
ISDN Integrated Service Digital Network
ISO International Standards Organization
IT Information Technology
viii Abbreviations
JIS Just in Sequence
JIT Just in Time
Kg Kilogram
Km Kilometer
KPI Key Performance Indicator
L x W x H Length � Wide � High
LANs Local Area Networks
LiFo Last In-First Out
LPG Liquid Petroleum Gas
LTL Less Than Truck Load Transport
m Meter
MFS Material Flow System
MRP I Material Requirements Planning
MRP II Manufacturing Resource Planning
NVOCC Non-Vessel-Operating Common Carriers
OBU On-Board (Computer) Unit
OCR Optical Character Reading
ODETTE Organization for Data Exchange by Tele Transmission in Europe
OEM Original Equipment Manufacturer
p.a. per anno
PC Personal Computer
PLC Programmable Logic Controller
PLU Product-Lookup
pm Past
PPS Production Planning Systems
PU Polyurethane
PW Production Warehouse
QR Quick Response
R&D Research & Development
RDT Remote Data Transmission
RFID Radio Frequency Identification
ROI Return on Investment
RoRo Roll-On/Roll-Off
RW Regional Warehouse
SCE Supply Chain Execution
SCD Supply Chain Design
SCM Supply Chain Management
SCP Supply Chain Planning
SEDAS Standardregelungen einheitlicher Datenaustauschsysteme –
Standard Regulations of Uniform Data Exchange Systems
SPC Special Purpose Company
SSCC Serial Shipping Container Code
t Ton
Abbreviations ix
TEU Twenty Foot Equivalent Unit
TFL Thiel Fashion Lifestyle
Tkm Ton kilometer
TUV Technischer Uberwachungsverein
TV Television
UMTS Universal Mobile Telecommunication System
UPC Universal Product Code
US United States
USA United States of America
VDA German Association of the Automotive Industry
VMI Vendor Managed Inventory
VPN Virtual Private Network
VW Volkswagen
WANs Wide Area Networks
WC3 World Wide Web Consortium for Standardization of www-
Technologies
WMS Warehouse Management System
WOTIF Work On Time In Full
WTO World Trade Organization
XML Extensible Markup Language
XSL Extensible Style Sheet Language
x Abbreviations
Contents
1 Introduction . . . . . . . . . . . . . . . . . . . . . . . . . . . . . . . . . . . . . . . . . . . 1
2 The Principles of Logistics . . . . . . . . . . . . . . . . . . . . . . . . . . . . . . . . 3
2.1 Definitions and Significance of Logistics . . . . . . . . . . . . . . . . . . . 4
2.2 Logistical System of Services . . . . . . . . . . . . . . . . . . . . . . . . . . . 7
2.3 Agents and Elements of Logistics . . . . . . . . . . . . . . . . . . . . . . . . 10
2.4 Distinction between Procurement Logistics, Production Logistics
and Distribution Logistics . . . . . . . . . . . . . . . . . . . . . . . . . . . . . 12
2.5 Service Level . . . . . . . . . . . . . . . . . . . . . . . . . . . . . . . . . . . . . . 14
Additional Literature . . . . . . . . . . . . . . . . . . . . . . . . . . . . . . . . . . . . . 18
3 Logistics Systems . . . . . . . . . . . . . . . . . . . . . . . . . . . . . . . . . . . . . . . 19
3.1 Logistics and Corporate Strategy . . . . . . . . . . . . . . . . . . . . . . . . 20
3.2 Supply Chains and Networks . . . . . . . . . . . . . . . . . . . . . . . . . . . 21
3.3 Management of Logistics Systems . . . . . . . . . . . . . . . . . . . . . . . 24
3.3.1 Basic Management Systems . . . . . . . . . . . . . . . . . . . . . . 24
3.3.2 System Leadership . . . . . . . . . . . . . . . . . . . . . . . . . . . . . 26
3.4 Organizational Variables in Logistics Systems . . . . . . . . . . . . . . 26
3.4.1 Organizational and Operational Structures of Logistics . . . 26
3.4.2 Inter-Organizational Optimization Through Supply Chain
Management . . . . . . . . . . . . . . . . . . . . . . . . . . . . . . . . . . 31
3.4.3 Intra-Organizational Behavior and Changed Staff
Requirements . . . . . . . . . . . . . . . . . . . . . . . . . . . . . . . . . 33
Additional Literature . . . . . . . . . . . . . . . . . . . . . . . . . . . . . . . . . . . . . 35
4 Logistical Infrastructure . . . . . . . . . . . . . . . . . . . . . . . . . . . . . . . . . 37
4.1 Basic Terminology, Types and Functions . . . . . . . . . . . . . . . . . . 38
4.2 Transport Infrastructure and Suprastructure . . . . . . . . . . . . . . . . . 39
4.2.1 Transport Routes and Transport Networks . . . . . . . . . . . . 39
4.2.2 Airports . . . . . . . . . . . . . . . . . . . . . . . . . . . . . . . . . . . . . 40
4.2.3 Sea Ports and Inland Ports . . . . . . . . . . . . . . . . . . . . . . . . 41
4.2.4 Rail Stations and Railroad Systems . . . . . . . . . . . . . . . . . 42
4.2.5 Terminals and Transshipment Facilities . . . . . . . . . . . . . . 43
xi
4.2.6 Logistics Real Estate, Logistics Parks,
and Freight Villages . . . . . . . . . . . . . . . . . . . . . . . . . . . . 47
4.3 Information Infrastructure and Communication Infrastructure . . . 49
4.3.1 Telecommunication Infrastructure . . . . . . . . . . . . . . . . . . 49
4.3.2 Satellite Systems and Satellite Navigation . . . . . . . . . . . . 51
Additional Literature . . . . . . . . . . . . . . . . . . . . . . . . . . . . . . . . . . . . . 52
5 Transport Systems and Logistics Services . . . . . . . . . . . . . . . . . . . . 53
5.1 Transport Basics . . . . . . . . . . . . . . . . . . . . . . . . . . . . . . . . . . . . 54
5.2 Significance and Development . . . . . . . . . . . . . . . . . . . . . . . . . . 54
5.3 Modes of Transport and Transport Technologies . . . . . . . . . . . . . 56
5.3.1 Transport Value and Transport Affinity . . . . . . . . . . . . . . 56
5.3.2 Road Freight Transport . . . . . . . . . . . . . . . . . . . . . . . . . . 58
5.3.3 Rail Freight Transport . . . . . . . . . . . . . . . . . . . . . . . . . . . 60
5.3.4 Sea Freight Transport . . . . . . . . . . . . . . . . . . . . . . . . . . . 65
5.3.5 Inland Waterway Transport . . . . . . . . . . . . . . . . . . . . . . . 69
5.3.6 Air Freight Transport . . . . . . . . . . . . . . . . . . . . . . . . . . . 73
5.3.7 Pipeline Transport . . . . . . . . . . . . . . . . . . . . . . . . . . . . . 75
5.4 Transport Systems and Means of Transport . . . . . . . . . . . . . . . . . 78
5.4.1 Transport Chain . . . . . . . . . . . . . . . . . . . . . . . . . . . . . . . 78
5.4.2 Means of Transport . . . . . . . . . . . . . . . . . . . . . . . . . . . . . 80
5.5 Logistics Service Providers . . . . . . . . . . . . . . . . . . . . . . . . . . . . 87
5.5.1 Carriers and Forwarders . . . . . . . . . . . . . . . . . . . . . . . . . 87
5.5.2 Courier, Express, Parcel and Mail Service Providers . . . . . 89
5.5.3 Systems Service Providers and Contract
Logistics Providers . . . . . . . . . . . . . . . . . . . . . . . . . . . . . 91
Additional Literature . . . . . . . . . . . . . . . . . . . . . . . . . . . . . . . . . . . . . 94
6 Warehousing, Handling, and Picking Systems . . . . . . . . . . . . . . . . . 95
6.1 Warehousing Basics . . . . . . . . . . . . . . . . . . . . . . . . . . . . . . . . . . 96
6.2 Storage Facilities . . . . . . . . . . . . . . . . . . . . . . . . . . . . . . . . . . . . 97
6.2.1 Static Storage Systems . . . . . . . . . . . . . . . . . . . . . . . . . . 98
6.2.2 Dynamic Storage Systems . . . . . . . . . . . . . . . . . . . . . . . . 101
6.3 Conveyors . . . . . . . . . . . . . . . . . . . . . . . . . . . . . . . . . . . . . . . . . 105
6.3.1 Discontinuous Conveyors . . . . . . . . . . . . . . . . . . . . . . . . 106
6.3.2 Continuous Conveyors . . . . . . . . . . . . . . . . . . . . . . . . . . 112
6.3.3 Sorters . . . . . . . . . . . . . . . . . . . . . . . . . . . . . . . . . . . . . . 117
6.4 Packages, Loading Units, and Load Carriers . . . . . . . . . . . . . . . . 119
6.5 Picking and Handling . . . . . . . . . . . . . . . . . . . . . . . . . . . . . . . . . 123
6.5.1 Picking . . . . . . . . . . . . . . . . . . . . . . . . . . . . . . . . . . . . . 123
6.5.2 Handling . . . . . . . . . . . . . . . . . . . . . . . . . . . . . . . . . . . . 127
6.6 Warehouse Organization . . . . . . . . . . . . . . . . . . . . . . . . . . . . . . 128
Additional Literature . . . . . . . . . . . . . . . . . . . . . . . . . . . . . . . . . . . . . 137
xii Contents
7 Inventory, Stock and Provisioning Management . . . . . . . . . . . . . . . 139
7.1 Inventory Basics . . . . . . . . . . . . . . . . . . . . . . . . . . . . . . . . . . . . 140
7.1.1 Contents and Objectives . . . . . . . . . . . . . . . . . . . . . . . . . 140
7.1.2 Determination of Requirements . . . . . . . . . . . . . . . . . . . . 140
7.1.3 Functions of Inventory . . . . . . . . . . . . . . . . . . . . . . . . . . 141
7.1.4 Inventory Cost . . . . . . . . . . . . . . . . . . . . . . . . . . . . . . . . 142
7.2 Inventory Planning and Management . . . . . . . . . . . . . . . . . . . . . 145
7.2.1 Disposition Procedures . . . . . . . . . . . . . . . . . . . . . . . . . . 145
7.2.2 Warehousing Strategies . . . . . . . . . . . . . . . . . . . . . . . . . . 146
7.2.3 Safety Stocks . . . . . . . . . . . . . . . . . . . . . . . . . . . . . . . . . 148
7.3 Provisioning of Goods . . . . . . . . . . . . . . . . . . . . . . . . . . . . . . . . 149
7.3.1 Individual Procurement and Bulk Procurement . . . . . . . . . 149
7.3.2 Production Synchronized Provisioning . . . . . . . . . . . . . . . 149
7.3.3 Just-In-Time Concepts . . . . . . . . . . . . . . . . . . . . . . . . . . 149
7.3.4 Goods Receiving Functions . . . . . . . . . . . . . . . . . . . . . . . 151
7.4 Transport, Warehouse, and Location Concepts . . . . . . . . . . . . . . 152
7.4.1 Regional Freight Carrier Concept . . . . . . . . . . . . . . . . . . 152
7.4.2 External Provisioning Warehouse . . . . . . . . . . . . . . . . . . 153
7.4.3 Supplier Settlements and Supplier Parks . . . . . . . . . . . . . 154
7.5 Cooperation Concepts of Inventory and Provisioning
Management . . . . . . . . . . . . . . . . . . . . . . . . . . . . . . . . . . . . . . . 155
7.5.1 Efficient Consumer Response . . . . . . . . . . . . . . . . . . . . . 155
7.5.2 Vendor Managed Inventory . . . . . . . . . . . . . . . . . . . . . . . 157
7.5.3 Collaborative Planning, Forecasting and Replenishment . . . 158
Additional Literature . . . . . . . . . . . . . . . . . . . . . . . . . . . . . . . . . . . . . 160
8 Logistics Network Planning . . . . . . . . . . . . . . . . . . . . . . . . . . . . . . . 161
8.1 Strategic Network Planning . . . . . . . . . . . . . . . . . . . . . . . . . . . . 162
8.2 Overview Logistics Networks . . . . . . . . . . . . . . . . . . . . . . . . . . . 163
8.2.1 Representation of Logistics Networks . . . . . . . . . . . . . . . 163
8.2.2 Domains of Decision Making in the Network Design . . . . 164
8.2.3 Structures of Logistics Networks . . . . . . . . . . . . . . . . . . . 164
8.3 Warehouse Networks . . . . . . . . . . . . . . . . . . . . . . . . . . . . . . . . . 165
8.3.1 Warehouse Network Planning . . . . . . . . . . . . . . . . . . . . . 165
8.3.2 Degree of Centralization . . . . . . . . . . . . . . . . . . . . . . . . . 166
8.3.3 Capacity Planning . . . . . . . . . . . . . . . . . . . . . . . . . . . . . . 169
8.3.4 Layout Planning . . . . . . . . . . . . . . . . . . . . . . . . . . . . . . . 170
8.4 Transport Networks . . . . . . . . . . . . . . . . . . . . . . . . . . . . . . . . . . 171
8.4.1 Transport Network Planning . . . . . . . . . . . . . . . . . . . . . . 171
8.4.2 Transport Network Configurations . . . . . . . . . . . . . . . . . . 172
8.4.3 Transport Consolidation . . . . . . . . . . . . . . . . . . . . . . . . . 176
8.4.4 Transport Logistics Concepts . . . . . . . . . . . . . . . . . . . . . 182
8.5 Outsourcing, Tendering and Placing of Transport and Logistics
Services . . . . . . . . . . . . . . . . . . . . . . . . . . . . . . . . . . . . . . . . . . 184
Additional Literature . . . . . . . . . . . . . . . . . . . . . . . . . . . . . . . . . . . . . 188
Contents xiii
9 IT in Logistics . . . . . . . . . . . . . . . . . . . . . . . . . . . . . . . . . . . . . . . . . 189
9.1 Electronic Data Transmission . . . . . . . . . . . . . . . . . . . . . . . . . . . 190
9.1.1 Communication Standards . . . . . . . . . . . . . . . . . . . . . . . . 190
9.1.2 Identification Standards . . . . . . . . . . . . . . . . . . . . . . . . . . 197
9.2 Identification Technology . . . . . . . . . . . . . . . . . . . . . . . . . . . . . . 198
9.3 Stock Management and Warehouse Control . . . . . . . . . . . . . . . . 204
9.3.1 Classification of IT in the Fields of Inventory
and Warehousing . . . . . . . . . . . . . . . . . . . . . . . . . . . . . . 204
9.3.2 ERP Systems . . . . . . . . . . . . . . . . . . . . . . . . . . . . . . . . . 205
9.3.3 Warehouse Management Systems . . . . . . . . . . . . . . . . . . 207
9.3.4 Material Flow Systems and Lower-Level Control
Systems . . . . . . . . . . . . . . . . . . . . . . . . . . . . . . . . . . . . . 208
9.4 Transport Planning and Controlling . . . . . . . . . . . . . . . . . . . . . . 209
9.5 Strategic and Operative Planning Systems . . . . . . . . . . . . . . . . . . 212
9.5.1 Site and Network Planning . . . . . . . . . . . . . . . . . . . . . . . 212
9.5.2 E-procurement . . . . . . . . . . . . . . . . . . . . . . . . . . . . . . . . 213
9.5.3 Enterprise Resource Planning . . . . . . . . . . . . . . . . . . . . . 214
9.5.4 Supply Chain Planning . . . . . . . . . . . . . . . . . . . . . . . . . . 215
Additional Literature . . . . . . . . . . . . . . . . . . . . . . . . . . . . . . . . . . . . . 223
10 Investment and Financing in Logistics . . . . . . . . . . . . . . . . . . . . . . 225
10.1 The Basics . . . . . . . . . . . . . . . . . . . . . . . . . . . . . . . . . . . . . . . 226
10.1.1 Managing Capital Requirement, Origin of Capital
and Capital Utilization . . . . . . . . . . . . . . . . . . . . . . . . 226
10.1.2 Managing Fixed Assets and Current Assets . . . . . . . . . 228
10.1.3 Financial Supply Chain Concept . . . . . . . . . . . . . . . . 230
10.2 Financing Deliveries of Goods and Inventory . . . . . . . . . . . . . 233
10.2.1 Overdraft Facilities and Supplier’s Credit . . . . . . . . . . 233
10.2.2 Factoring, Forfaiting, Cash Forwarding . . . . . . . . . . . 234
10.2.3 Inventory Management and Off-Balance
Sheet Inventory Financing . . . . . . . . . . . . . . . . . . . . . 236
10.3 Financing of Logistics Real Estate . . . . . . . . . . . . . . . . . . . . . 237
10.3.1 Self Financing and External Financing . . . . . . . . . . . . 237
10.3.2 Rent and Leasing . . . . . . . . . . . . . . . . . . . . . . . . . . . 238
10.4 Financing of Logistics Movables . . . . . . . . . . . . . . . . . . . . . . 239
10.4.1 Internal and External Financing . . . . . . . . . . . . . . . . . 239
10.4.2 Leasing . . . . . . . . . . . . . . . . . . . . . . . . . . . . . . . . . . . 240
10.4.3 Build-Operate-Transfer Models . . . . . . . . . . . . . . . . . 241
Additional Literature . . . . . . . . . . . . . . . . . . . . . . . . . . . . . . . . . . . . 243
11 Logistics Controlling . . . . . . . . . . . . . . . . . . . . . . . . . . . . . . . . . . . 245
11.1 Conceptual Basics . . . . . . . . . . . . . . . . . . . . . . . . . . . . . . . . . 246
11.2 Logistical Costs and Performance Accounting . . . . . . . . . . . . . 249
11.3 Key Figure Systems . . . . . . . . . . . . . . . . . . . . . . . . . . . . . . . . 252
xiv Contents
11.4 Further Controlling Concepts . . . . . . . . . . . . . . . . . . . . . . . . . 261
11.4.1 Process Cost Accounting . . . . . . . . . . . . . . . . . . . . . . 261
11.4.2 Supply Chain Controlling . . . . . . . . . . . . . . . . . . . . . 262
11.5 Costs and Cost Effects; Performance and Performance
Effects . . . . . . . . . . . . . . . . . . . . . . . . . . . . . . . . . . . . . . . . . . 262
Additional Literature . . . . . . . . . . . . . . . . . . . . . . . . . . . . . . . . . . . . 265
12 Business Models and Industry Solutions . . . . . . . . . . . . . . . . . . . . . 267
12.1 Business Models . . . . . . . . . . . . . . . . . . . . . . . . . . . . . . . . . . 268
12.2 Logistical Industry Solutions . . . . . . . . . . . . . . . . . . . . . . . . . 268
12.2.1 Industry Solutions in Manufacturing . . . . . . . . . . . . . . 268
12.2.2 Industry Solutions in Trade . . . . . . . . . . . . . . . . . . . . 273
12.2.3 Industry Solutions in the Service Sector . . . . . . . . . . . 276
12.2.4 Industry Solutions in E-Business . . . . . . . . . . . . . . . . 277
12.3 International and Global Business Models . . . . . . . . . . . . . . . . 279
12.4 Development of Logistics Services Offers . . . . . . . . . . . . . . . . 281
Additional Literature . . . . . . . . . . . . . . . . . . . . . . . . . . . . . . . . . . . . 283
13 Outline Solutions to Case Studies . . . . . . . . . . . . . . . . . . . . . . . . . . 285
13.1 Solution to Case Study 6-1 . . . . . . . . . . . . . . . . . . . . . . . . . . . 285
13.2 Solution to Case Study 6-2 . . . . . . . . . . . . . . . . . . . . . . . . . . . 286
13.3 Solution to Case Study 6-6 . . . . . . . . . . . . . . . . . . . . . . . . . . . 286
13.4 Solution to Case Study 8-2 . . . . . . . . . . . . . . . . . . . . . . . . . . . 286
13.5 Solution to Case Study 8-5 . . . . . . . . . . . . . . . . . . . . . . . . . . . 286
13.5.1 Selective Inventory . . . . . . . . . . . . . . . . . . . . . . . . . . 286
13.5.2 Regional Warehouses . . . . . . . . . . . . . . . . . . . . . . . . 287
13.5.3 C Articles Management . . . . . . . . . . . . . . . . . . . . . . . 287
13.5.4 Direct Supply . . . . . . . . . . . . . . . . . . . . . . . . . . . . . . 287
13.6 Solution to Case Study 11-2 . . . . . . . . . . . . . . . . . . . . . . . . . . 289
Erratum to: Logistics Systems . . . . . . . . . . . . . . . . . . . . . . . . . . . . . . . . E1
Bibliography . . . . . . . . . . . . . . . . . . . . . . . . . . . . . . . . . . . . . . . . . . . . . 293
Index . . . . . . . . . . . . . . . . . . . . . . . . . . . . . . . . . . . . . . . . . . . . . . . . . . . 303
Contents xv

ThiS is a FM Blank Page

List of Figures
Fig. 1.1 Logistics and its branches . . . . . . . . . . . . . . . . . . . . . . . . . . . . . . . . . . . . . . . . . . 2
Fig. 2.1 Elements of logistics tasks . . . . . . . . . . . . . . . . . . . . . . . . . . . . . . . . . . . . . . . . . 5
Fig. 2.2 Logistical problems and solutions . . . . . . . . . . . . . . . . . . . . . . . . . . . . . . . . . 5
Fig. 2.3 Changes in the understanding of logistics . . . . . . . . . . . . . . . . . . . . . . . . 6
Fig. 2.4 System of logistical services . . . . . . . . . . . . . . . . . . . . . . . . . . . . . . . . . . . . . . . 8
Fig. 2.5 Elements of logistics . . . . . . . . . . . . . . . . . . . . . . . . . . . . . . . . . . . . . . . . . . . . . . . . 11
Fig. 2.6 Functional distinctions of logistics . . . . . . . . . . . . . . . . . . . . . . . . . . . . . . . . 13
Fig. 2.7 Differentiation of business enterprise . . . . . . . . . . . . . . . . . . . . . . . . . . . . . 14
Fig. 2.8 Determinants of the logistical service level . . . . . . . . . . . . . . . . . . . . . . 15
Fig. 3.1 Model of a logistics chain (supply chain) . . . . . . . . . . . . . . . . . . . . . . . . 21
Fig. 3.2 Model of a complex logistics network . . . . . . . . . . . . . . . . . . . . . . . . . . . . 22
Fig. 3.3 Model of a detergent supply chain . . . . . . . . . . . . . . . . . . . . . . . . . . . . . . . . 24
Fig. 3.4 Determining elements of logistics organization structures . . . . . . 27
Fig. 3.5 Organization and supply chain . . . . . . . . . . . . . . . . . . . . . . . . . . . . . . . . . . . . 28
Fig. 3.6 Logistical organization models . . . . . . . . . . . . . . . . . . . . . . . . . . . . . . . . . . . . 29
Fig. 4.1 Schematic outline of Berlin’s airport ‘Willy Brandt’ . . . . . . . . . . . . 41
Fig. 4.2 Rail infrastructure . . . . . . . . . . . . . . . . . . . . . . . . . . . . . . . . . . . . . . . . . . . . . . . . . . . 43
Fig. 4.3 Layout of a container terminal . . . . . . . . . . . . . . . . . . . . . . . . . . . . . . . . . . . . . 45
Fig. 4.4 Schematic layout of a door-to-door logistics chain . . . . . . . . . . . . . . 46
Fig. 5.1 Tonnage transported according to transport modes
in Germany . . . . . . . . . . . . . . . . . . . . . . . . . . . . . . . . . . . . . . . . . . . . . . . . . . . . . . . . . . 57
Fig. 5.2 Tonne-kilometer performance according to modes of
transport in Germany . . . . . . . . . . . . . . . . . . . . . . . . . . . . . . . . . . . . . . . . . . . . . . . 57
Fig. 5.3 Tonne-kilometer performance according to market
share in 2011 in Germany . . . . . . . . . . . . . . . . . . . . . . . . . . . . . . . . . . . . . . . . . . 58
Fig. 5.4 Distinguishing characteristics of road freight transport . . . . . . . . . 59
Fig. 5.5 Market players in rail freight transport . . . . . . . . . . . . . . . . . . . . . . . . . . . 61
Fig. 5.6 Group structure of the Deutsche Bahn AG . . . . . . . . . . . . . . . . . . . . . . . 62
Fig. 5.7 Rail freight transport products . . . . . . . . . . . . . . . . . . . . . . . . . . . . . . . . . . . . . 62
Fig. 5.8 Railroad transport network of BASF Schwarzheide GmbH . . . . 65
Fig. 5.9 Most important forms of inland waterway transport . . . . . . . . . . . . 70
Fig. 5.10 Network of North European inland waterways . . . . . . . . . . . . . . . . . . 72
Fig. 5.11 Pipeline network and refineries in Germany . . . . . . . . . . . . . . . . . . . . . 77
Fig. 5.12 Pre-carriage, main carriage and on-carriage . . . . . . . . . . . . . . . . . . . . . . 78
xvii

Fig. 5.13 Setup of transport chains . . . . . . . . . . . . . . . . . . . . . . . . . . . . . . . . . . . . . . . . . . 79
Fig. 5.14 Transport means in road freight transport . . . . . . . . . . . . . . . . . . . . . . . 81
Fig. 5.15 Railway wagons . . . . . . . . . . . . . . . . . . . . . . . . . . . . . . . . . . . . . . . . . . . . . . . . . . . 83
Fig. 5.16 Ship generations in container transport . . . . . . . . . . . . . . . . . . . . . . . . . . 84
Fig. 5.17 Transport means of inland waterway transport . . . . . . . . . . . . . . . . . 84
Fig. 5.18 Airplane types . . . . . . . . . . . . . . . . . . . . . . . . . . . . . . . . . . . . . . . . . . . . . . . . . . . . . . 85
Fig. 5.19 Air freight containers . . . . . . . . . . . . . . . . . . . . . . . . . . . . . . . . . . . . . . . . . . . . . . 86
Fig. 5.20 Loading profiles of all-cargo planes . . . . . . . . . . . . . . . . . . . . . . . . . . . . . 86
Fig. 5.21 Competition matrix: forwarder/integrator . . . . . . . . . . . . . . . . . . . . . . . 90
Fig. 5.22 Air and road network of TNT Express . . . . . . . . . . . . . . . . . . . . . . . . . . 92
Fig. 6.1 Block storage figure . . . . . . . . . . . . . . . . . . . . . . . . . . . . . . . . . . . . . . . . . . . . . . . 98
Fig. 6.2 Pallet rack . . . . . . . . . . . . . . . . . . . . . . . . . . . . . . . . . . . . . . . . . . . . . . . . . . . . . . . . . . 99
Fig. 6.3 Drive-in rack and drive-through rack . . . . . . . . . . . . . . . . . . . . . . . . . . . . 100
Fig. 6.4 Bay shelf . . . . . . . . . . . . . . . . . . . . . . . . . . . . . . . . . . . . . . . . . . . . . . . . . . . . . . . . . . . 101
Fig. 6.5 Cantilever shelf . . . . . . . . . . . . . . . . . . . . . . . . . . . . . . . . . . . . . . . . . . . . . . . . . . . . 101
Fig. 6.6 Live storage shelf . . . . . . . . . . . . . . . . . . . . . . . . . . . . . . . . . . . . . . . . . . . . . . . . . . 102
Fig. 6.7 Push-back shelf . . . . . . . . . . . . . . . . . . . . . . . . . . . . . . . . . . . . . . . . . . . . . . . . . . . . 102
Fig. 6.8 Vertical carousel . . . . . . . . . . . . . . . . . . . . . . . . . . . . . . . . . . . . . . . . . . . . . . . . . . . 103
Fig. 6.9 Horizontal carousel . . . . . . . . . . . . . . . . . . . . . . . . . . . . . . . . . . . . . . . . . . . . . . . . 104
Fig. 6.10 Slide shelves . . . . . . . . . . . . . . . . . . . . . . . . . . . . . . . . . . . . . . . . . . . . . . . . . . . . . . . 104
Fig. 6.11 Manual lift truck . . . . . . . . . . . . . . . . . . . . . . . . . . . . . . . . . . . . . . . . . . . . . . . . . . . 106
Fig. 6.12 Lift pallet truck . . . . . . . . . . . . . . . . . . . . . . . . . . . . . . . . . . . . . . . . . . . . . . . . . . . . 106
Fig. 6.13 Counterbalance forklift or frontload truck . . . . . . . . . . . . . . . . . . . . . . 107
Fig. 6.14 Reach truck . . . . . . . . . . . . . . . . . . . . . . . . . . . . . . . . . . . . . . . . . . . . . . . . . . . . . . . . . 108
Fig. 6.15 Narrow aisle truck . . . . . . . . . . . . . . . . . . . . . . . . . . . . . . . . . . . . . . . . . . . . . . . . . 109
Fig. 6.16 Stacker crane . . . . . . . . . . . . . . . . . . . . . . . . . . . . . . . . . . . . . . . . . . . . . . . . . . . . . . . 109
Fig. 6.17 Automated Guided Vehicle (AGV) . . . . . . . . . . . . . . . . . . . . . . . . . . . . . . 109
Fig. 6.18 Comparison of common conveyors . . . . . . . . . . . . . . . . . . . . . . . . . . . . . . 110
Fig. 6.19 Roller conveyor . . . . . . . . . . . . . . . . . . . . . . . . . . . . . . . . . . . . . . . . . . . . . . . . . . . . 112
Fig. 6.20 Chain conveyor . . . . . . . . . . . . . . . . . . . . . . . . . . . . . . . . . . . . . . . . . . . . . . . . . . . . 113
Fig. 6.21 Belt conveyor . . . . . . . . . . . . . . . . . . . . . . . . . . . . . . . . . . . . . . . . . . . . . . . . . . . . . . 113
Fig. 6.22 Circular conveyor . . . . . . . . . . . . . . . . . . . . . . . . . . . . . . . . . . . . . . . . . . . . . . . . . . 114
Fig. 6.23 Electric pallet ground conveyor . . . . . . . . . . . . . . . . . . . . . . . . . . . . . . . . . . 115
Fig. 6.24 Floor-mounted drag chain conveyor at the Dachser
logistics center in Berlin/Brandenburg . . . . . . . . . . . . . . . . . . . . . . . . . . 116
Fig. 6.25 Tilt-tray sorter . . . . . . . . . . . . . . . . . . . . . . . . . . . . . . . . . . . . . . . . . . . . . . . . . . . . . . 117
Fig. 6.26 Crossbelt sorter . . . . . . . . . . . . . . . . . . . . . . . . . . . . . . . . . . . . . . . . . . . . . . . . . . . . 118
Fig. 6.27 Sliding sorter or slat sorter . . . . . . . . . . . . . . . . . . . . . . . . . . . . . . . . . . . . . . . . 118
Fig. 6.28 Transition from feeding belt to tilt-tray sorter . . . . . . . . . . . . . . . . . . 119
Fig. 6.29 Euro pallet . . . . . . . . . . . . . . . . . . . . . . . . . . . . . . . . . . . . . . . . . . . . . . . . . . . . . . . . . . 121
Fig. 6.30 Wire-mesh pallet . . . . . . . . . . . . . . . . . . . . . . . . . . . . . . . . . . . . . . . . . . . . . . . . . . . 121
Fig. 6.31 Single-stage, one-dimensional picking with manual
withdrawal and centralized handover . . . . . . . . . . . . . . . . . . . . . . . . . . . . 125
Fig. 6.32 Static provisioning, one-dimensional movement,
manual withdrawal and decentralized handover . . . . . . . . . . . . . . . . 125
xviii List of Figures
Fig. 6.33 Static provisioning, two-dimensional movement, manual
withdrawal and centralized handover . . . . . . . . . . . . . . . . . . . . . . . . . . . . 126
Fig. 6.34 Dynamic provisioning, one-dimensional movement,
manual withdrawal and decentralized handover . . . . . . . . . . . . . . . . 127
Fig. 6.35 Loading and un-loading of trucks with and without the
use of ramps . . . . . . . . . . . . . . . . . . . . . . . . . . . . . . . . . . . . . . . . . . . . . . . . . . . . . . . . 129
Fig. 6.36 Gate system . . . . . . . . . . . . . . . . . . . . . . . . . . . . . . . . . . . . . . . . . . . . . . . . . . . . . . . . 130
Fig. 6.37 Possible goods receiving (ingoing) – goods issuing
(outgoing) layouts . . . . . . . . . . . . . . . . . . . . . . . . . . . . . . . . . . . . . . . . . . . . . . . . . 130
Fig. 6.38 Warehouse layout Gebr. Heinemann, KG .. . . . . . . . . . . . . . . . . . . . . . 133
Fig. 7.1 Distinction of types of material demand . . . . . . . . . . . . . . . . . . . . . . . . 141
Fig. 7.2 Warehousing strategies and order policies of the t-q policy . . . 146
Fig. 7.3 Warehousing strategies and order policies of the t-S policy . . . . 147
Fig. 7.4 Warehousing strategies and order policies of the s-q policy . . . . 147
Fig. 7.5 Warehousing strategies and order policies of the s-S policy . . . . 148
Fig. 7.6 Factory premises at smart France . . . . . . . . . . . . . . . . . . . . . . . . . . . . . . . . 154
Fig. 7.7 ECR overview . . . . . . . . . . . . . . . . . . . . . . . . . . . . . . . . . . . . . . . . . . . . . . . . . . . . . 157
Fig. 7.8 CPFR process model . . . . . . . . . . . . . . . . . . . . . . . . . . . . . . . . . . . . . . . . . . . . . . 158
Fig. 8.1 Goal conflict in logistics performance . . . . . . . . . . . . . . . . . . . . . . . . . . . 162
Fig. 8.2 Representation of a network for the flow of goods . . . . . . . . . . . . . 165
Fig. 8.3 Number and degree of centralization of distribution systems . . . 166
Fig. 8.4 Concept of selective warehousing . . . . . . . . . . . . . . . . . . . . . . . . . . . . . . . 167
Fig. 8.5 Logistics network BSHG . . . . . . . . . . . . . . . . . . . . . . . . . . . . . . . . . . . . . . . . . 169
Fig. 8.6 Forms of net structures . . . . . . . . . . . . . . . . . . . . . . . . . . . . . . . . . . . . . . . . . . . . 172
Fig. 8.7 Net configuration: grid . . . . . . . . . . . . . . . . . . . . . . . . . . . . . . . . . . . . . . . . . . . . 173
Fig. 8.8 Net configuration: hub-and-spoke . . . . . . . . . . . . . . . . . . . . . . . . . . . . . . . . 173
Fig. 8.9 Combinations of grid and hub-and-spoke nets . . . . . . . . . . . . . . . . . . 174
Fig. 8.10 Load and consignee acquisition . . . . . . . . . . . . . . . . . . . . . . . . . . . . . . . . . . 177
Fig. 8.11 Ordinary delivery versus delivery with multi-pick concepts . . . . 178
Fig. 8.12 The cross-docking principle . . . . . . . . . . . . . . . . . . . . . . . . . . . . . . . . . . . . . . 179
Fig. 8.13 Cross-docking variants in the METRO Group Logistics
system .. . . . . . . . . . . . . . . . . . . . . . . . . . . . . . . . . . . . . . . . . . . . . . . . . . . . . . . . . . . . . . 181
Fig. 8.14 Existing distribution structure . . . . . . . . . . . . . . . . . . . . . . . . . . . . . . . . . . . . 186
Fig. 9.1 The EDI principle . . . . . . . . . . . . . . . . . . . . . . . . . . . . . . . . . . . . . . . . . . . . . . . . . 191
Fig. 9.2 Information flow in logistics with EANCOM® standards . . . . . 194
Fig. 9.3 Information flow in the distribution of goods with
EANCOM® standards . . . . . . . . . . . . . . . . . . . . . . . . . . . . . . . . . . . . . . . . . . . . 198
Fig. 9.4 Mechanical reading in automatic data acquisition . . . . . . . . . . . . . 199
Fig. 9.5 Characters for optical recognition . . . . . . . . . . . . . . . . . . . . . . . . . . . . . . . . 199
Fig. 9.6 EAN barcodes for individual items . . . . . . . . . . . . . . . . . . . . . . . . . . . . . . 200
Fig. 9.7 EAN-128 as SSCC .. . . . . . . . . . . . . . . . . . . . . . . . . . . . . . . . . . . . . . . . . . . . . . . 201
Fig. 9.8 EAN-128 transport label – concrete example of SSCC . . . . . . . . 201
Fig. 9.9 2-D codes for postage and train tickets . . . . . . . . . . . . . . . . . . . . . . . . . . 202
Fig. 9.10 Logic of the RFID data flow .. . . . . . . . . . . . . . . . . . . . . . . . . . . . . . . . . . . . . 203
Fig. 9.11 Transponder (smart label) . . . . . . . . . . . . . . . . . . . . . . . . . . . . . . . . . . . . . . . . . 203
List of Figures xix
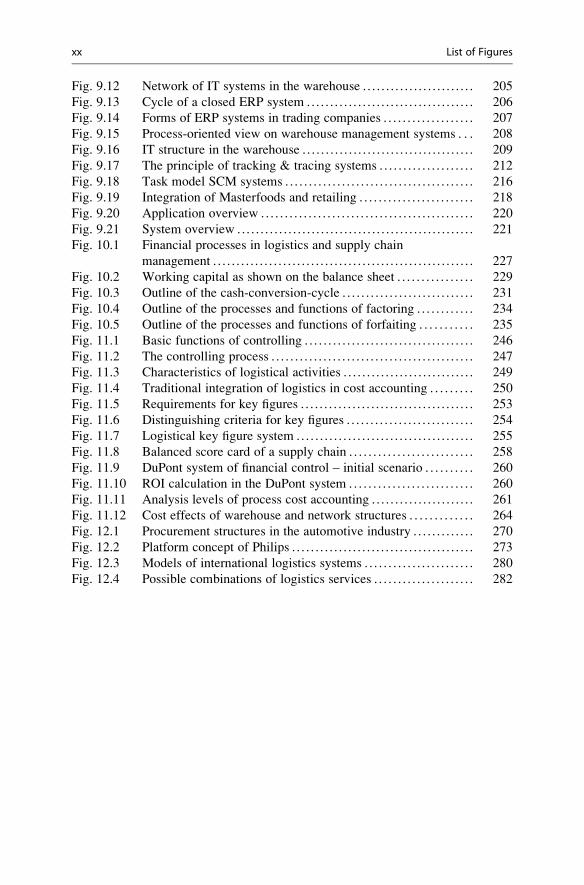
Fig. 9.12 Network of IT systems in the warehouse . . . . . . . . . . . . . . . . . . . . . . . . 205
Fig. 9.13 Cycle of a closed ERP system . . . . . . . . . . . . . . . . . . . . . . . . . . . . . . . . . . . . 206
Fig. 9.14 Forms of ERP systems in trading companies . . . . . . . . . . . . . . . . . . . 207
Fig. 9.15 Process-oriented view on warehouse management systems . . . 208
Fig. 9.16 IT structure in the warehouse . . . . . . . . . . . . . . . . . . . . . . . . . . . . . . . . . . . . . 209
Fig. 9.17 The principle of tracking & tracing systems . . . . . . . . . . . . . . . . . . . . 212
Fig. 9.18 Task model SCM systems . . . . . . . . . . . . . . . . . . . . . . . . . . . . . . . . . . . . . . . . 216
Fig. 9.19 Integration of Masterfoods and retailing . . . . . . . . . . . . . . . . . . . . . . . . 218
Fig. 9.20 Application overview . . . . . . . . . . . . . . . . . . . . . . . . . . . . . . . . . . . . . . . . . . . . . 220
Fig. 9.21 System overview . . . . . . . . . . . . . . . . . . . . . . . . . . . . . . . . . . . . . . . . . . . . . . . . . . . 221
Fig. 10.1 Financial processes in logistics and supply chain
management . . . . . . . . . . . . . . . . . . . . . . . . . . . . . . . . . . . . . . . . . . . . . . . . . . . . . . . . 227
Fig. 10.2 Working capital as shown on the balance sheet . . . . . . . . . . . . . . . . 229
Fig. 10.3 Outline of the cash-conversion-cycle . . . . . . . . . . . . . . . . . . . . . . . . . . . . 231
Fig. 10.4 Outline of the processes and functions of factoring . . . . . . . . . . . . 234
Fig. 10.5 Outline of the processes and functions of forfaiting . . . . . . . . . . . 235
Fig. 11.1 Basic functions of controlling . . . . . . . . . . . . . . . . . . . . . . . . . . . . . . . . . . . . 246
Fig. 11.2 The controlling process . . . . . . . . . . . . . . . . . . . . . . . . . . . . . . . . . . . . . . . . . . . 247
Fig. 11.3 Characteristics of logistical activities . . . . . . . . . . . . . . . . . . . . . . . . . . . . 249
Fig. 11.4 Traditional integration of logistics in cost accounting . . . . . . . . . 250
Fig. 11.5 Requirements for key figures . . . . . . . . . . . . . . . . . . . . . . . . . . . . . . . . . . . . . 253
Fig. 11.6 Distinguishing criteria for key figures . . . . . . . . . . . . . . . . . . . . . . . . . . . 254
Fig. 11.7 Logistical key figure system . . . . . . . . . . . . . . . . . . . . . . . . . . . . . . . . . . . . . . 255
Fig. 11.8 Balanced score card of a supply chain . . . . . . . . . . . . . . . . . . . . . . . . . . 258
Fig. 11.9 DuPont system of financial control – initial scenario . . . . . . . . . . 260
Fig. 11.10 ROI calculation in the DuPont system . . . . . . . . . . . . . . . . . . . . . . . . . . 260
Fig. 11.11 Analysis levels of process cost accounting . . . . . . . . . . . . . . . . . . . . . . 261
Fig. 11.12 Cost effects of warehouse and network structures . . . . . . . . . . . . . 264
Fig. 12.1 Procurement structures in the automotive industry . . . . . . . . . . . . . 270
Fig. 12.2 Platform concept of Philips . . . . . . . . . . . . . . . . . . . . . . . . . . . . . . . . . . . . . . . 273
Fig. 12.3 Models of international logistics systems . . . . . . . . . . . . . . . . . . . . . . . 280
Fig. 12.4 Possible combinations of logistics services . . . . . . . . . . . . . . . . . . . . . 282
xx List of Figures
List of Tables
Table 4.1 Location and object requirements of logistics real estate . . . . . 49
Table 5.1 Important characteristics of road freight transport . . . . . . . . . . . . . 59
Table 5.2 Important characteristics of rail freight transport . . . . . . . . . . . . . . 61
Table 5.3 Important characteristics of sea freight transport . . . . . . . . . . . . . . 65
Table 5.4 The world’s largest container ports, 2010–2012 . . . . . . . . . . . . . . . 67
Table 5.5 Most important characteristics of inland waterway
transport . . . . . . . . . . . . . . . . . . . . . . . . . . . . . . . . . . . . . . . . . . . . . . . . . . . . . . . . . . . 71
Table 5.6 Important characteristics of air freight transport . . . . . . . . . . . . . . . 74
Table 5.7 Important characteristics of pipeline transport . . . . . . . . . . . . . . . . . 76
Table 5.8 Important characteristics of combined transport . . . . . . . . . . . . . . . 79
Table 5.9 Wagon types of DB Schenker Rail Deutschland AG . . . . . . . . . 82
Table 5.10 Service areas and service focus of forwarders . . . . . . . . . . . . . . . . . 88
Table 5.11 The most important integrators and their turnover in 2010 . . . 91
Table 6.1 Basic principles of picking systems . . . . . . . . . . . . . . . . . . . . . . . . . . . . . 124
Table 7.1 Ranking according to yearly requirement . . . . . . . . . . . . . . . . . . . . . . 143
Table 7.2 ABC class list . . . . . . . . . . . . . . . . . . . . . . . . . . . . . . . . . . . . . . . . . . . . . . . . . . . . . 144
Table 8.1 Basic elements of transport nets . . . . . . . . . . . . . . . . . . . . . . . . . . . . . . . . . 171
Table 8.2 Consolidation concepts . . . . . . . . . . . . . . . . . . . . . . . . . . . . . . . . . . . . . . . . . . . 178
Table 9.1 EDIFACT message types and their areas of use . . . . . . . . . . . . . . . 193
Table 9.2 Advantages and disadvantages of EDI . . . . . . . . . . . . . . . . . . . . . . . . . 195
Table 9.3 Comparison data exchange formats XML and
EDIFACT/EANCOM .. . . . . . . . . . . . . . . . . . . . . . . . . . . . . . . . . . . . . . . . . . . 196
Table 9.4 Advantages and disadvantages of barcodes . . . . . . . . . . . . . . . . . . . . 202
Table 9.5 Advantages and disadvantages of RFID technology . . . . . . . . . . 204
Table 9.6 Determinants of route planning and scheduling . . . . . . . . . . . . . . . 210
Table 9.7 Potential advantages of route planning . . . . . . . . . . . . . . . . . . . . . . . . . 211
Table 11.1 Basic scheme of logistics costs . . . . . . . . . . . . . . . . . . . . . . . . . . . . . . . . . . 251
Table 11.2 Portion of logistics costs, compared by sectors . . . . . . . . . . . . . . . . 251
xxi
Introduction 1
The structure of this book is oriented towards the componential functions of
logistics. The logistical task spectrum is characterized by a great degree of variety
and dissimilarity. This is due firstly to logistics’ roles, functioning within both
overall economic as well as business processes, in all value-added steps from the
processing of raw materials to the end‐user. The persons concerned with these
value‐added steps are suppliers, manufacturers, producers, and service providers
but even wholesalers and retailers whose goal is to satisfy the demands and wishes
of their customers. Secondly, complexity arises due to dynamics that are simulta-
neously a result of business activities and promoted by logistics. In doing so,
logistics finds itself constantly seeking a balance within the competing fields of
performance, cost, and quality.
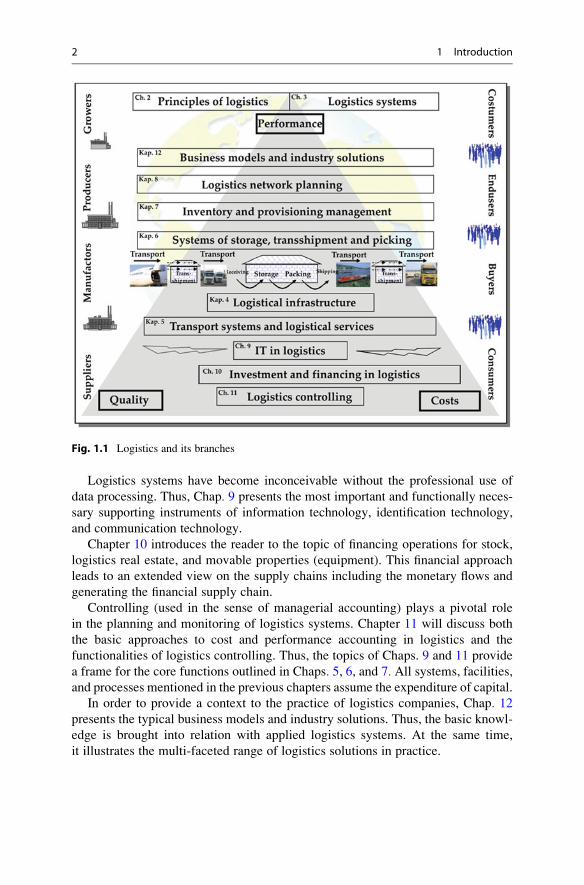
Figure 1.1 positions the individual topics addressed in this book into the broader
context of the functions of logistics.
Chapter 2 lays the groundwork for the range of logistical concepts. The ensuing
Chap. 3 puts this basic knowledge into a topical context, thereby illustrating the
broad range of application of logistics currently used in the economy. Both chapters
are a prerequisite for the study of logistics; therefore, they are placed above the
tripartite model of performance, cost, and quality.
As logistics needs its own specific infrastructure, Chap. 4 presents logistical infra-
structure facilities. In addition to the familiar traffic infra-and traffic suprastructure,
this chapter also discusses other logistically significant facilities; namely, logistics
real estate and structures of information and communication networks.
Chapter 5 about transport services and logistics services, Chap. 6 about
warehousing, transshipment and picking, as well as Chap. 7 about inventory and
provisioning management give a detailed account of the logistical core functions
and therefore assume a central role in this book. They constitute the most essential
body of knowledge for any future logistics expert.
Chapter 8 deals with logistics network planning. In particular, basic decision-
making processes and possible structures of warehousing networks and transporta-
tion networks are addressed.
H. Gleissner and J.C. Femerling, Logistics, Springer Texts in Business and Economics,
DOI 10.1007/978-3-319-01769-3_1, # Springer International Publishing Switzerland 2013
1
Logistics systems have become inconceivable without the professional use of
data processing. Thus, Chap. 9 presents the most important and functionally neces-
sary supporting instruments of information technology, identification technology,
and communication technology.
Chapter 10 introduces the reader to the topic of financing operations for stock,
logistics real estate, and movable properties (equipment). This financial approach
leads to an extended view on the supply chains including the monetary flows and
generating the financial supply chain.
Controlling (used in the sense of managerial accounting) plays a pivotal role
in the planning and monitoring of logistics systems. Chapter 11 will discuss both
the basic approaches to cost and performance accounting in logistics and the
functionalities of logistics controlling. Thus, the topics of Chaps. 9 and 11 provide
a frame for the core functions outlined in Chaps. 5, 6, and 7. All systems, facilities,
and processes mentioned in the previous chapters assume the expenditure of capital.
In order to provide a context to the practice of logistics companies, Chap. 12presents the typical business models and industry solutions. Thus, the basic knowl-
edge is brought into relation with applied logistics systems. At the same time,
it illustrates the multi-faceted range of logistics solutions in practice.
Fig. 1.1 Logistics and its branches
2 1 Introduction
The Principles of Logistics 2
Learning Objectives
As the field of logistics has undergone rapid developments both in scientific
research and commercial practice, a multitude of new contents, point of views,
and terminologies exists. The key aspects are explained in this chapter. The focus
is on the development which has seen the transition of logistics from being
perceived in a purely functional way to the modern view of management-
oriented, holistic supply chain management. Subsequently, the individual levels
of logistics, the involved agents, institutions and their key activities will be
discussed. In this way, the readers are introduced to logistic actions and decisions,
enabling them to identify with logistical issues by applying the most current
understanding of logistics.
Keywords
¢ Basic definitions of logistics
¢ Significance of logistics in the context of general business administration
¢ Classification and differentiation of logistics in the economic process
¢ The logistical system of performance with its components and key activities
¢ Agents and key elements of logistics in the national economic context
¢ Distinction between the terms procurement logistics, production logistics, and
distribution logistics, and their basic decision fields
¢ Delivery policy as the basis for cost and price calculation
H. Gleissner and J.C. Femerling, Logistics, Springer Texts in Business and Economics,
DOI 10.1007/978-3-319-01769-3_2, # Springer International Publishing Switzerland 2013
3

2.1 Definitions and Significance of Logistics
In a world which increasingly relies on the division of labor and fragmentation of
work flows, goods and commodities need to be transported from their place of
origin to their place of consumption or place of use. The span time between the
production and the utilization of goods has to be bridged. This is also true for both
the people and the information involved in the fragmented work flow and which are
available in different locations and at different times within the system. The tasks
and activities associated with this within the economic process were first systemati-
cally subsumed under the term logistics in mid-twentieth century. Initially, the term
emerged in a military context since military systems are characterized by their
tendency for concised classification.
The European Committee for Standardization CEN (Comite Europeen
Normalisation) defines logistics as1:
¢ “. . . the planning, execution and control
¢ Of the movement and placement of people and/or goods and
¢ Of the supporting activities related to such movement and placement, within an
system organized to achieve specific objectives.”
Here, the term system is to be understood as a dynamic unit of interconnected
elements and subsystems, connected with each other in specific relations. These
elements and subsystems form the system structure and – by virtue of their
interaction with each other – result in the system behavior. The defining character-
istic of a system is its orderliness.2
The purpose of logistics is to plan, organize, coordinate, and implement the
bridging of the dimensions of time and space within a system. Logistics is thus one
of the most important functions of the economy. This ranges from the procurement
of raw materials to their processing and to the delivery of the goods to the end-user.
The central tasks of logistics can be graphically described by the so-called
seven R’s, as depicted in Fig. 2.1. There are not any clear-cut definitions as to
what constitutes right. The right thing to do always individually results from the
particular elements involved in the logistical task, i.e. from the products, the
quantity, the spatial relations, the customer requirements etc.
In the course of the development of modern business studies, the notion of
logistics in the context of the production and distribution of goods has changed
significantly since its emergence in the mid-1950s. In 1955, the article Note on theFormulation of the Theory on Logistics by Morgenstern was published, in which
logistical approaches were transferred from military contexts to the field of business
studies for the first time.3 As time went on, logistics developed from serving a
simple, unidimensional operational support function to being a networked,
1 European Logistics Association (ELA) (2005), p. 54.2 Cf. Greschner (1996), p. 9 and Jirasek (1977), p. 17 et seq.3 Cf. Morgenstern (1955), p. 129 et seq.
4 2 The Principles of Logistics

multidimensional process that spans all value-added steps and aims to optimize
holistic and complex operational and economic activities. This change of logistical
understanding now comprises the entire sequence of activities depicted in Fig. 2.1,
Fig. 2.1 Elements of logistics tasks
(Cf. Klaus 2002, p. 11; Pfohl 1972, p. 28 et seq.; Junemann 1989, p. 18)
Fig. 2.2 Logistical problems and solutions (Cf. Klaus 2002, p. 30)
2.1 Definitions and Significance of Logistics 5
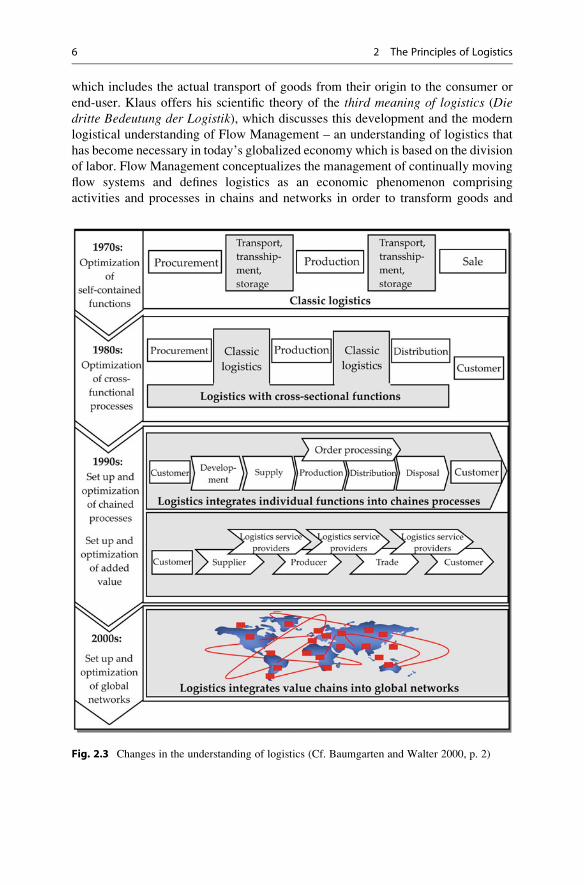
which includes the actual transport of goods from their origin to the consumer or
end-user. Klaus offers his scientific theory of the third meaning of logistics (Diedritte Bedeutung der Logistik), which discusses this development and the modern
logistical understanding of Flow Management – an understanding of logistics that
has become necessary in today’s globalized economy which is based on the division
of labor. Flow Management conceptualizes the management of continually moving
flow systems and defines logistics as an economic phenomenon comprising
activities and processes in chains and networks in order to transform goods and
Fig. 2.3 Changes in the understanding of logistics (Cf. Baumgarten and Walter 2000, p. 2)
6 2 The Principles of Logistics
the information pertinent to them.4 According to this practice-oriented explanation,
logistics is characterized by the following operational goal clusters:
¢ Cost reduction of the logistics process in particular and of the total process in
general
¢ Increase of the adaptability of the logistics system to changes in demand and
environment
¢ Value enhancement of the logistical objects (goods) through or during the
logistics process
By assigning properties to logistics that increase the value of the goods, many
courses of action open up for logistics in a macroeconomic context. Thus, modern
business management understands logistics as a performance component which is
relevant for success. The identified goal clusters can also be seen as standard
problems of the logistical task accomplishment. The following possible solutions
to these problems can be offered (see Fig. 2.2).
The change in the understanding of logistics over time is illustrated in Fig. 2.3.
It proceeds from the original, rather simplistic view of transporting, handling,warehousing with its emphasis on the physical aspect of the logistical task and
moves on to the current, management-oriented view of integrated value chains.
2.2 Logistical System of Services
Based on the preceding chapter’s definitions of logistics, the services that logistics
renders will be more specifically defined in the following.
The logistical system of services features a wide range of system components,
which are illustrated in Fig. 2.4. The core services of logistics, such as order
processing, storage and transport, are directly supported by the logistical information
services and the additional services necessary for the logistics process. In practice,
the element of transshipment is rarely dealt with separately since it is usually closely
connected to storage and transport. The core element of order processing is some-
what virtual in nature but constitutes an indispensable element for the initiation and
monitoring of logistics processes. It is the order processing which gives logistics its
dynamic character. Order processing comprises the processing and monitoring of the
order data from the time of order until the arrival of the goods at the customer’s site
and of the return of the shipment documents. Inmany cases this includes the initiation
of invoicing processes, e.g. by simultaneously delivering the invoice together with
the goods.
The core element of storage denotes the warehousing of goods, which have
mostly been produced for an anonymous market to offset the quantitative and
chronological divergence of production (supply) and sales (demand). It has to be
noted at this point that the functions of picking and packing, which are closely
4 Cf. Klaus (2002), p. 26 et seq.
2.2 Logistical System of Services 7
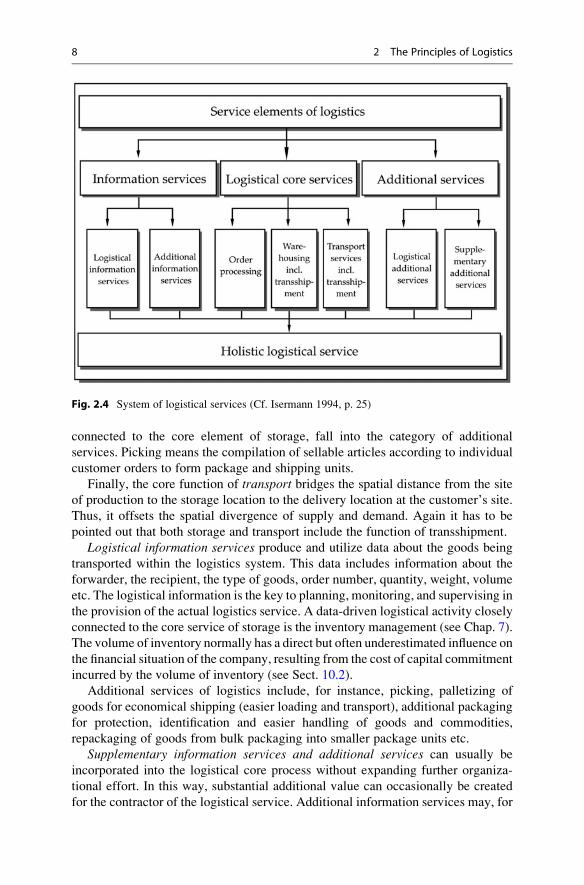
connected to the core element of storage, fall into the category of additional
services. Picking means the compilation of sellable articles according to individual
customer orders to form package and shipping units.
Finally, the core function of transport bridges the spatial distance from the site
of production to the storage location to the delivery location at the customer’s site.
Thus, it offsets the spatial divergence of supply and demand. Again it has to be
pointed out that both storage and transport include the function of transshipment.
Logistical information services produce and utilize data about the goods being
transported within the logistics system. This data includes information about the
forwarder, the recipient, the type of goods, order number, quantity, weight, volume
etc. The logistical information is the key to planning, monitoring, and supervising in
the provision of the actual logistics service. A data-driven logistical activity closely
connected to the core service of storage is the inventory management (see Chap. 7).
The volume of inventory normally has a direct but often underestimated influence on
the financial situation of the company, resulting from the cost of capital commitment
incurred by the volume of inventory (see Sect. 10.2).
Additional services of logistics include, for instance, picking, palletizing of
goods for economical shipping (easier loading and transport), additional packaging
for protection, identification and easier handling of goods and commodities,
repackaging of goods from bulk packaging into smaller package units etc.
Supplementary information services and additional services can usually be
incorporated into the logistical core process without expanding further organiza-
tional effort. In this way, substantial additional value can occasionally be created
for the contractor of the logistical service. Additional information services may, for
Fig. 2.4 System of logistical services (Cf. Isermann 1994, p. 25)
8 2 The Principles of Logistics

example, refer to additional information about the goods such as prices, quantity
discounts, and cash discounts. They may also refer to obvious facts regarding the
customer’s commercial situation or, for instance, regarding the number of residents,
size of the backyard or location of the private property.
Information of this kind can later be analyzed for marketing purposes. Addi-
tional services also comprise promotional or advertising packaging of goods.
Additional services can be rendered at any given location, i.e. not only at the
forwarder’s site but also, as it is often the case in the automobile sector, directly
at the contractor’s site or at a third-party site in transit of the goods between origin
and destination.
The ensuing case studies aim to illustrate the logistical system of services.
Case Study 2.1: Motor Scooter Assembly
The forwarding agency Wackler has been commissioned with the logistic
operations of a DIY superstore chain. Wackler provides its client with additional
services. They import motor scooters from a Chinese manufacturer for the DIY
superstore chain. The content of the shipment is communicated to Germany via
data transmission upon dispatch at the port in Hong Kong [logistical informationservice]. Themotor scooters are disassembled into their components, then shipped
to the port of Rotterdam and subsequently taken by truck to theWackler location inGoppingen [logistical core service]. First, the boxes containing the components
are stored there [logistical core service] before they are successively assembled by
a specially formed and trained team of Wackler employees [additional service].Having been technically inspected and certified by the TUV (German Association
for Technical Inspection), the motor scooters are packed for transport [additionalservice] and sent to the individual DIY stores [logistical core service].
Case Study 2.2: Module Assembly
BMG (a module assembly company) is a fully owned subsidiary of the logistics
provider Schnellecke. BMG has been entrusted by Volkswagen Braunschweig
with the assembly of the modules Subframe and Cornermodule, pertaining to thecar models Golf and Passat, for Volkswagen Sachsen Ltd. in Zwickau [addi-tional service]. The service provider is also responsible for the disposition and
storage of the primary material [logistical core service] and for the delivery of
the assembled modules to the assembly line [logistical core service]. The
assembly and delivery for each particular production sequence is carried out
according to the logistics planning of Volkswagen Sachsen Ltd.
Case Study 2.3: Price Tags and Textile Finishing
Apart from logistical core services (administrative transaction, storage, handling,
transport), the logistics service provider Thiel Fashion Lifestyle (TFL) offers a
broad spectrum of additional fashion services in the field of textile procurement,
2.2 Logistical System of Services 9
production and distribution logistics. This includes, for instance, all types of
picking, price tagging, labeling, and textile finishing.
Upon pickup at the production site (e.g. in Middle Eastern Europe), TFL
forwards the finished goods of its clients Hugo Boss and Gery Weber to its
logistics center in Macedonia [logistical core service]. The client conveys all
information relating to the order to TFL beforehand via remote data transmission
(RDT). TFL then logistically processes this information [logistical informationservice]. Among the additional services is the finishing of the hanging garments.
Specially trained staffmembers check the quality of the textiles. Subsequently, the
garments are finished using a tunnel finishing system. First, the hanging garments
are dampened, then stretched and finally dried. After the textiles have been
finished and are ready for sale, they are packed into special hanging cartons,
which is to ensure crease-free and undamaged transport of the goods [additionalservice].
Another additional service offered by TFL is the labeling of the goods.
Besides price tags, TFL additionally fits the garments with anti-theft tags.
Depending on the customer requirements, the order-related picking is followed
either by the storage of the goods, the transport to the customer’s central
warehouse, or the transport to the point of sale by means of TFL’s comprehen-
sive European network [logistical core service].
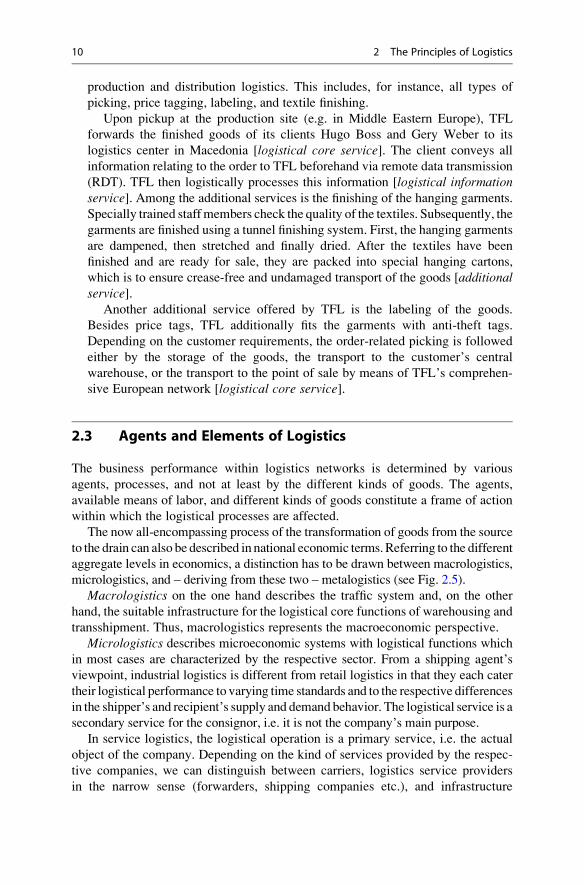
2.3 Agents and Elements of Logistics
The business performance within logistics networks is determined by various
agents, processes, and not at least by the different kinds of goods. The agents,
available means of labor, and different kinds of goods constitute a frame of action
within which the logistical processes are affected.
The now all-encompassing process of the transformation of goods from the source
to the drain can also be described in national economic terms.Referring to the different
aggregate levels in economics, a distinction has to be drawn between macrologistics,
micrologistics, and – deriving from these two – metalogistics (see Fig. 2.5).
Macrologistics on the one hand describes the traffic system and, on the other
hand, the suitable infrastructure for the logistical core functions of warehousing and
transshipment. Thus, macrologistics represents the macroeconomic perspective.
Micrologistics describes microeconomic systems with logistical functions which
in most cases are characterized by the respective sector. From a shipping agent’s
viewpoint, industrial logistics is different from retail logistics in that they each cater
their logistical performance to varying time standards and to the respective differences
in the shipper’s and recipient’s supply and demand behavior. The logistical service is a
secondary service for the consignor, i.e. it is not the company’s main purpose.
In service logistics, the logistical operation is a primary service, i.e. the actual
object of the company. Depending on the kind of services provided by the respec-
tive companies, we can distinguish between carriers, logistics service providers
in the narrow sense (forwarders, shipping companies etc.), and infrastructure
10 2 The Principles of Logistics
Fig. 2.5 Elements of logistics (Cf. Pfohl 1990, p. 14 and Ihde 2001, p. 134 et seq)
2.3 Agents and Elements of Logistics 11
providers (warehousing service providers). Furthermore, societal or social systems
such as hospital logistics or public waste disposal can be subsumed under the term
micrologistics.
Metalogistics describes every kind of institutional or functional cooperation
between independent organizations withinmicrologistics in order to enable logistical
performance. These cooperations may be established, for instance, between indus-
trial and commercial companies to facilitate the joint organization of warehousing
and the supply of final customers, between logistics service providers to build up a
nation-wide distribution network covering all regions, or between different traffic
carriers (railway, inland vessel, road, air traffic).5
Thus, logistical processes can always be categorized according to individual
elements pertinent to the systematization components ofmacrologistics, metalogistics,
and micrologistics.
2.4 Distinction between Procurement Logistics, ProductionLogistics and Distribution Logistics
Following the functional distinctions of logistics and the transport and sector-specific
categorization of logistics, we shall now consider the functional distinctions of
logistics systems according to the phases of the flow of goods. This ranges from the
supply of goods to the disposal or recycling of waste. The range of these functions,
with reference to conventional producers, is depicted in Fig. 2.6.
As it is the case in many areas of operational organization, the distinction
between the tasks and their definitions as well as the assignment of functions
(order processing, warehousing, transport) to certain forms of organization (inven-
tory management, procurement logistics, production logistics, distribution logistics,
or logistics) is very difficult and only possible in highly general terms. In opera-
tional practice, the individual functions are diversely assigned within the organiza-
tional structures of the companies.
The basic task areas of business enterprise are shown in detail in Fig. 2.7.
Procurement logistics is concerned with the organization and the physical
processes involved in the transport and supply of the input factors for the corporate
process. This applies both to industrial companies and trading companies.
The procurement process aims to ensure the economic supply of the materials or
commodities which are to be processed. In practice, the purchase with its market-
oriented and contracting tasks is either subsumed under the term procurement (see
Fig. 2.7) or is given its own business function. Manufacturing companies often refer
to this phase in the flow of goods as materials management (see Fig. 2.6). However,
5 Cf. Pfohl (2010), p. 14 et seq.
12 2 The Principles of Logistics
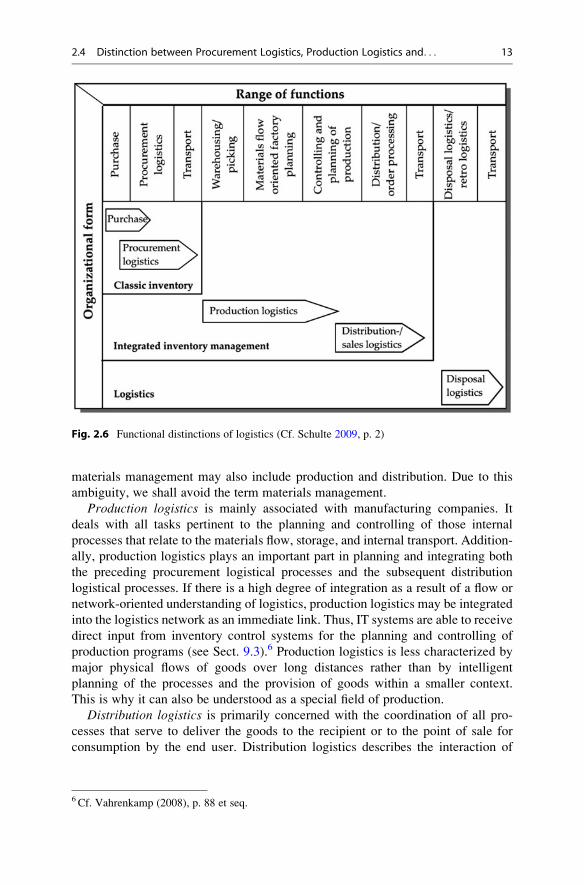
materials management may also include production and distribution. Due to this
ambiguity, we shall avoid the term materials management.
Production logistics is mainly associated with manufacturing companies. It
deals with all tasks pertinent to the planning and controlling of those internal
processes that relate to the materials flow, storage, and internal transport. Addition-
ally, production logistics plays an important part in planning and integrating both
the preceding procurement logistical processes and the subsequent distribution
logistical processes. If there is a high degree of integration as a result of a flow or
network-oriented understanding of logistics, production logistics may be integrated
into the logistics network as an immediate link. Thus, IT systems are able to receive
direct input from inventory control systems for the planning and controlling of
production programs (see Sect. 9.3).6 Production logistics is less characterized by
major physical flows of goods over long distances rather than by intelligent
planning of the processes and the provision of goods within a smaller context.
This is why it can also be understood as a special field of production.
Distribution logistics is primarily concerned with the coordination of all pro-
cesses that serve to deliver the goods to the recipient or to the point of sale for
consumption by the end user. Distribution logistics describes the interaction of
Fig. 2.6 Functional distinctions of logistics (Cf. Schulte 2009, p. 2)
6 Cf. Vahrenkamp (2008), p. 88 et seq.
2.4 Distinction between Procurement Logistics, Production Logistics and. . . 13
transport and storage processes within logistics systems for the distribution of a
company’s goods. Since the distribution process includes all elements of the
logistical performance spectrum in a variety of ways (see Fig. 2.4), it will be
given special emphasis in the following.
2.5 Service Level
The elements of logistical business performance were outlined in Sect. 2.2. In order
to determine the extent and quality of business performance, we need to define a
service level. An operationalized service level allows for the measurability of
the service provided and also serves as a basis for the cost and price calculation.
The individual determinants of the service level are illustrated in Fig. 2.8.
Fig. 2.7 Differentiation of business enterprise (Cf. Schulte 2009, p. 267)
14 2 The Principles of Logistics
The service level is not an arbitrary variable. It should be defined as part of a
logistical service offer for a specific group of goods and clients.
The service level and the features of the delivery service are not solely deter-
mined by customer requirements. Factors such as service levels of competitors,
capabilities of the company including earning power (contribution margin) of the
objects (goods and commodities), and the extent of the value to be added by
logistics should also be taken into consideration. A further distinction has to be
drawn between regular service and emergency service.
Fig. 2.8 Determinants of the logistical service level (Cf. Pfohl 1972, p. 177 et seq)
2.5 Service Level 15

In many cases, however, the service level is determined by the goods themselves.
A prime example of this is food logistics, where commodities need to be moved
quickly within the logistics networks so that they reach the final customer fresh.
Case Study 2.4: Service Level Components in Mail Order Business
Many mail order companies offer their customers a diversified delivery service.
The regular delivery time is 2–3 working days. This case study shows one typical
delivery service of a full range assortment mail order company offered on the
German market.
Other additional offers tailored to customer
requirements affect the delivery time and flexibility. In
their catalog and on their webpage, the example company
labeled their individual service offers with the symbols
next to the text on this page. As regards the delivery time
they offer a 24 h delivery service.From Monday to Thursday, they guarantee next day delivery if the customer
orders by 12 noon. If the order is placed by 12 noon on a Friday, delivery will be
effected the following Monday. Orders which are placed between Friday 12
noon and Sunday inclusively are delivered on Tuesday. This applies to articles
that are delivered in postal parcels. Similar conditions apply for bulky articles,
such as fridges or TV sets, which are delivered by forwarding
agencies.
Furthermore, the mail order company offers an evening deliveryservice in many ZIP-code areas, which guarantees the delivery of
major articles by a forwarder fromMonday to Friday between 5 pm
and 9 pm if the customer orders by phone or online [delivery time
and flexibility].For many articles the customer may state a preferred delivery
day. Depending on the article, delivery is then effected from the
3rd or 5th day onwards after placing the order online or on the
phone.
A preferred delivery day between Monday and Friday may be
stipulated for articles which are sent by mail. It is not possible,
however, to request a certain time for the delivery [delivery time
and flexibility].
Neckermann also offers a disposal and assembly service. If a
new device or furniture has been ordered, the customer may
request the disposal of the old device or furniture byNeckermann
upon delivery [flexible delivery].
The delivery of tumble dryers, washing machines, dishwashers,
fridges, and freezers includes unpacking, removal of lock fasteners,
and installation. Furniture may be assembled on request.
By means of checks during picking and before the packing of
customer parcels and by using padding material, a high standard of delivery
quality is ensured. Articles which are delivered by forwarders receive special
16 2 The Principles of Logistics
repackaging to protect them from damage [delivery features]. In this case,
delivery to the customer is ensured by a pre-announcement via telephone
(advising). The availability of the articles [readiness to deliver] is maximized
by issuing test catalogs prior to the publication of a new catalog, timely obser-
vation of customers’ ordering behavior during a particular catalog season, and
evaluating the ordering behavior of previous catalog seasons.
2.5 Service Level 17

Review Questions
1. What kind of problems does logistics deal with?
2. Describe the development of the understanding of logistics up to Klaus’
third meaning of logistics.3. Describe the 7-r-approach of the modern understanding of logistics.
4. Distinguish between macrologistics and micrologistics.
5. Give a concrete example for each element of metalogistics and explain its
connection to macrologistics or micrologistics, respectively.
6. Dinstinguish between procurement logistics, production logistics, and dis-
tribution logistics.
7. What are agents in logistics? Give examples.
8. What may influence each element of the service level?
9. How can the right service level for a product or company be found?
10. What is the difference between inventory management and procurement
logistics?
Additional Literature
Beckmann, K. (2007). Logistik. Rinteln: Merkur-Verl.
Bloomberg, D. J., Lemay, S., & Hanna, J. B. (2002). Logistics. Upper Saddle River: Prentice-Hall.Coyle, J. J., Langley, C. J., Gibson, C. H., & Novack, R. (2013). Supply chain management: A
logistics perspective (9th ed.). Mason: South-Western College Publishing.
Eichler, B. (2003). Beschaffungsmarketing und -logistik. Herne: NWB-Verlag.
Gudehus, T. (2005). Logistik-Grundlagen, Strategien, Anwendungen (3rd ed.). Berlin: Springer.
Ihde, G. B. (2001). Transport, Verkehr, Logistik (3rd ed.). Munchen: Vahlen.
Klaus, P. (2002).Die dritte Bedeutung der Logistik – Beitrage zur Evolution logistischen Denkens.Hamburg: Deutscher Verkehrs-Verlag.
Lambert, D. M., & Burduroglu, R. (2000). Measuring and selling the value of logistics. Interna-tional Journal of Logistics Management, 11(1), 27–50.
Murphy, P. R., & Wood, D. F. (2010). Contemporary logistics (10th ed.). Upper Saddle River:
Prentice-Hall.
Pfohl, H. C. (2004). Logistikmanagement (2nd ed.). Berlin: Springer.
Rumenapp, T. (2002). Strategische Konfigurationen von Logistikunternehmen, Ansatze zurkonsistenten Ausrichtung in den Dimensionen Strategie, Struktur und Umwelt. Wiesbaden:
Univ.-Verl.
Rutner, J. M., & Langley, C. J. (2000). Logistics value: Definition, process, and measurement.
International Journal of Logistics Management, 11(2), 73–82.Schulte, C. (2009). Logistik – Wege zur Optimierung der Supply Chain (5th ed.). Munchen:
Vahlen.
Vahrenkamp, R. (2007). Logistik-management und strategien (6th ed.). Munchen: Oldenbourg.
18 2 The Principles of Logistics

Logistics Systems 3
Learning Objectives
Logistics is characterized by thinking in processes, value chains, and networks.
It includes parameters such as performance, quality, value, and cost. At the end
of this chapter the reader will have gained an understanding of the basic
components and organization variables of the logistics systems.
Apart from the technical and economic aspects, which increasingly have an
impact on the efficiency of the logistics systems, it is important to discuss the
fundamentals and functions of a company’s internal and external logistics
structures, and how the relationship with their agents is managed. In this way
the reader will obtain information on competencies that goes beyond the scope
of basic logistics knowledge.
Keywords
¢ Logistics and corporate strategy
¢ Basic structures of the logistics systems
¢ Logistical chains, networks, and processes
¢ Demand and supply chain
¢ Agents and elements of logistics
¢ Organization of logistics
¢ Relationship management in supply chains
Please note the Erratum to this chapter at the end of the book
H. Gleissner and J.C. Femerling, Logistics, Springer Texts in Business and Economics,
DOI 10.1007/978-3-319-01769-3_3, # Springer International Publishing Switzerland 2013
19
3.1 Logistics and Corporate Strategy
Logistics is both a competitive tool and a means of rationalization. Thus, logistical
services may generate separate opportunities to develop strategic competitive
advantages. On the other hand, the efficient organization of the logistics systems
allows for the development of rationalization potential, which, in turn, may give a
company a sustainable competitive advantage.
The two basic approaches of competitive strategies are cost leadership and differ-entiation. Moreover, another strategy called focus scope is frequently employed.
The focus scope strategy is the niche strategy dependent on a company’s strategic
orientation (cost leadership or differentiation) and the scope of the targeted market.1
These basic strategies differ from one another according to what kind of com-
petitive advantage is desired and according to the scope of the targeted competition
field. The strategies of cost leadership and differentiation target the entire market of
a particular business area. The focus scope strategy, however, is aimed at individual
market segments.
Comprehensive cost leadership pursues the goal of consistent cost orientation
across all business functions. Cost leadership is primarily based on a large market
share, on the basis of which economies of scale in the procurement, production and
distribution stages are to be implemented. It is the organization of logistics systems
which substantially supports the cost leadership strategy. Thus, the network structures
in procurement and distribution logistics determine the warehousing and transport
costs (see Chap. 8). Further cost estimation factors include the application of trans-
port, warehouse, picking, andmaterial transport technologies. The degree of automa-
tion of the applied technologies significantly influences cost structure and cost effect
(see Sect. 11.5).
Besides the physical logistics processes, the organizational design of logistics
influences the cost structure. For example, this applies to order processing, inven-
tory planning, and the disposition of materials (see Chap. 7). The costs of the
associated processes, in turn, are influenced by the IT, information and communi-
cation systems used (see Chap. 9). Allocating logistics capacities and processes to
logistics service providers is a strategy that has increasingly been pursued by
companies. This form of logistical outsourcing has primarily been utilized in
distribution logistics, with service providers running distribution centers and man-
aging the distribution of goods (see Sects. 4.2.6 and 10.2.3). On the one hand, this
outsourcing process aims to make the costs more variable. On the other hand, it is
expected to reduce the costs through the realization of economies of both scale and
scope by the service provider (see Sect. 8.5).
Companies pursuing a differentiation strategy try to achieve a unique selling
point for a customer’s highly-valued demands. By reaching a unique selling point for
certain products or services, it is often possible for a company to establish higher
prices. Assuming that the prices achievable in themarket will not be compensated by
the (additional) costs of differentiation, a company will enhance its profit prospects.
1 Cf. Porter (1985), p. 11.
20 3 Logistics Systems

In addition, differentiation generally enables more customer loyalty, which helps
prevent new market entries and substitution products. Among the forms of differen-
tiation we can distinguish between the criteria of quality, design, image, and service.
Thus, service differentiation is aimed at providing services which offer the consumer
or customer additional benefits apart from the actual product. Differentiation strat-
egy is best implemented in/within the logistics service. Examples are incredibly
fast or reliable delivery services, or additional disposal services.2
3.2 Supply Chains and Networks
The modern understanding of logistics, which is based on the third level of logisti-
cal development (see Chap. 2), calls for process-oriented management of all
logistical elements in the business cycle. As opposed to the individual examination
of these elements, a highly complex picture of the logistics processes thus emerges
which involves extensive division of labor. In contrast to the management of rather
straightforward processes (e.g. the transport of goods between a supplier and a
customer), this complexity requires much more monitoring and managerial effort.
The terms supply chain management (SCM) and demand chain management(DCM) conceptualize these managerial tasks. Here, the words supply or demand
only describe where the logistics process is initiated, i.e. on the supply side or on the
demand side. Since inmost cases logisticsmakes commodities available on themarket
according to the supply volume and most companies offer their commodities on an
anonymous market, the term SCM is far more frequently used.3 Ultimately, the terms
SCM and DCM are a linguistic advancement of the terms controlling ormanagementof logistics systems across several steps in the value chain. Supply chain management
is enhanced by the comprehension of financial and monetary flows, the coherent
internal organizational units and external participants (see Sect. 10.1.3).
In order to accurately portray the complexity mentioned above, the term supply
chain – describing a string of logistical elements – has in many cases been
Fig. 3.1 Model of a logistics chain (supply chain)
2 Cf. Herter (1999), p. 81 et seq.3 Cf. Marbacher (2001), p. 18 et seq.
3.2 Supply Chains and Networks 21
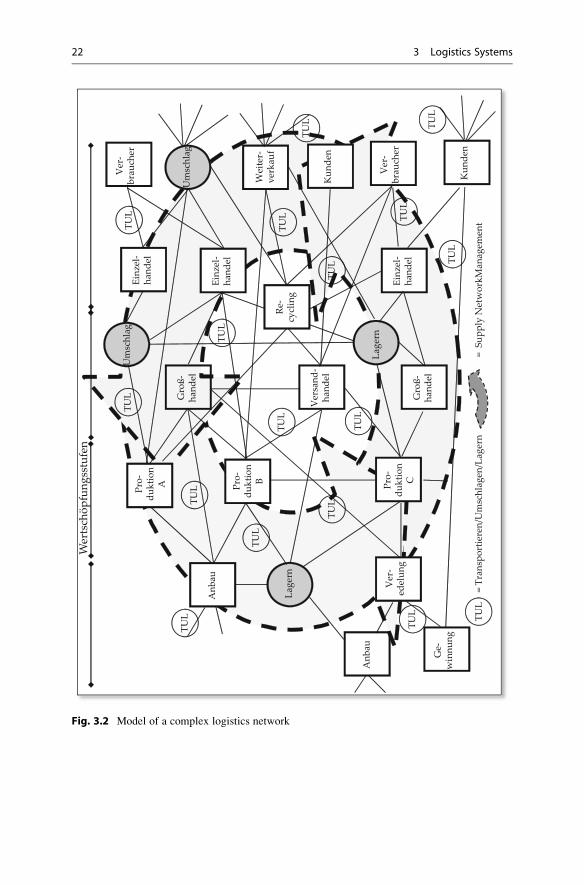
Um
schl
ag
Um
schl
ag
Lage
rn
Pro-
dukt
ion
B
Ge-
win
nung
Pro-
dukt
ion
A
Ver
sand
-ha
ndel
Wei
ter-
verk
auf
Gro
ß-ha
ndel
Einz
el-
hand
el
Einz
el-
hand
elG
roß-
hand
el
Einz
el-
hand
el
Anb
auLa
gern
Ver
-br
auch
er
Ver
-br
auch
er
Kun
den
Re-
cycl
ing
Kun
den
TUL
TUL
TUL
TUL
TUL
TUL
TUL
TUL
TUL
TUL
TUL
TUL
TUL
TUL
TUL
TUL
Pro-
dukt
ion
C
Ver
-ed
elun
g
Anb
au
TUL
= Tr
ansp
ortie
ren/
Um
schl
agen
/Lag
ern
Wer
tsch
öpfu
ngss
tufe
n
Fig. 3.2 Model of a complex logistics network
22 3 Logistics Systems
superseded by the term supply network. This term comprises all elements, agents,
and processes involved in both the physical and virtual (informational) flow of goods
from the source to the drain. While Fig. 3.1 depicts a relatively simplistic supply
chain, Fig. 3.2 shows a schematic representation of a complex network across
several value-added steps.
In operational practice, all forms of relationship networks are encountered,
ranging from less complex ones to highly complex ones. Included in this are simple,
isolated and self-contained networks with only one element, point to point
connections with two agents, and multi-level supply chains or highly branched
logistics networks. The main types of agents forming part of supply chains are4:
¢ Raw material producers (growing, extraction etc.)
¢ Manufacturers, producers (suppliers, industry, processors etc.)
¢ Wholesalers, distribution provider, importers, exporters
¢ Retailers
¢ Users, consumers
It is the objective of logistics and logistics management (supply chain or network
management) to influence the physical and informational transactions of the logistics
processes in a manner that meets the specific requirements and efficiently combines
the elements and methods consuming as few resources as possible and at the lowest
cost. Such efficient logistics processesmay entail a significant competitive advantage
for the companies involved. This competitive advantage is comprised of
¢ Cost advantage – through low factor consumption, low information cost and
high productivity
¢ Value advantage – through the increase in value of the products during the
logistics process by means of timely or fast availability, additional treatment of
the goods, or additional services associated with the goods.
Case Study 3.1: Detergent Supply Chain
The supply chain of a detergent manufacturer starts with the purchase of detergent
by a customer at a retail shop. The removal of the detergent from the shelf is
registered during the payment process at the checkout and supply is automatically
requested. As soon as the need for supply has reached a certain level the relevant
wholesaler is requested to supply the amount of detergent needed and delivery to
the retailer is effected. Meanwhile, the dispatching process at the wholesaler
initiates a supply request for detergent to the detergent manufacturer. The manu-
facturer obtains the intermediate products required for the detergent production
from a variety of suppliers which, in turn, are supplied by other suppliers. The
packaging, for example, is produced by a supplier which obtains its cardboard in
an upstream stage of the supply chain from a paper manufacturer, which, in turn,
orders wood from a forestry (see Fig. 3.3).
4 Cf. Chopra and Meindl (2009), p. 22.
3.2 Supply Chains and Networks 23
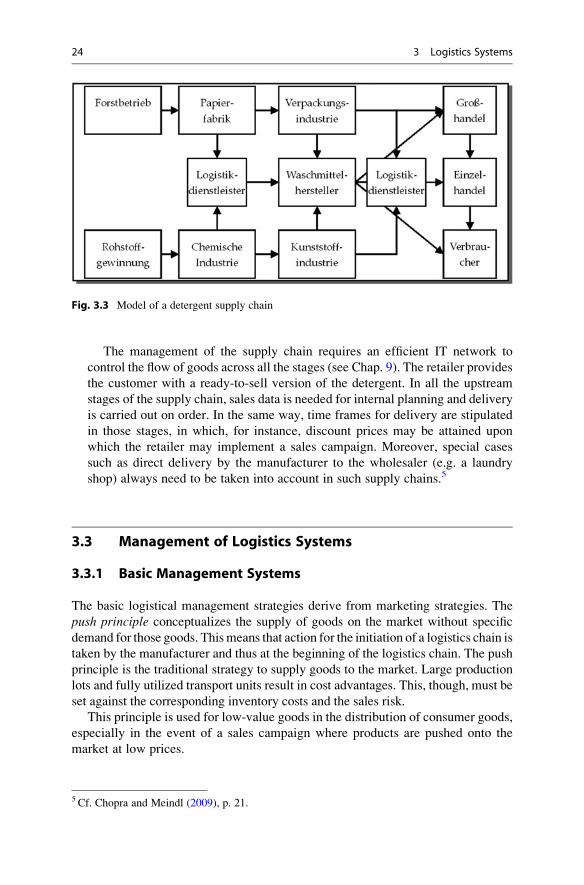
The management of the supply chain requires an efficient IT network to
control the flow of goods across all the stages (see Chap. 9). The retailer provides
the customer with a ready-to-sell version of the detergent. In all the upstream
stages of the supply chain, sales data is needed for internal planning and delivery
is carried out on order. In the same way, time frames for delivery are stipulated
in those stages, in which, for instance, discount prices may be attained upon
which the retailer may implement a sales campaign. Moreover, special cases
such as direct delivery by the manufacturer to the wholesaler (e.g. a laundry
shop) always need to be taken into account in such supply chains.5
3.3 Management of Logistics Systems
3.3.1 Basic Management Systems
The basic logistical management strategies derive from marketing strategies. The
push principle conceptualizes the supply of goods on the market without specific
demand for those goods. Thismeans that action for the initiation of a logistics chain is
taken by the manufacturer and thus at the beginning of the logistics chain. The push
principle is the traditional strategy to supply goods to the market. Large production
lots and fully utilized transport units result in cost advantages. This, though, must be
set against the corresponding inventory costs and the sales risk.
This principle is used for low-value goods in the distribution of consumer goods,
especially in the event of a sales campaign where products are pushed onto the
market at low prices.
Fig. 3.3 Model of a detergent supply chain
5 Cf. Chopra and Meindl (2009), p. 21.
24 3 Logistics Systems
The pull principle, on the other hand, initiates the logistics chain at its end. This
means that the logistics process is activated when the end user (consumer) requires
specific goods and thus creates demand. This principle is normally applied for
high-quality investment goods. Due to the generally difficult sales situation and the
competition-induced need to reduce costs in the supply chain, the pull principle is
also increasingly used for consumer goods and low-price goods. This principle
entails an interesting cost advantage as a result of reduced inventory costs and
sales risks. It is, however, also associated with relatively long delivery times and
increased costs for small (single) shipments.
In order to offer customers better availability of goods that pass through the
logistics channel according to the pull principle, elaborate forecasting methods are
increasingly being used. These are based on detailed analyses of previous customer
behavior and on intelligent logistical management techniques. Thus, the time
between the placing of the order by the customer and delivery can sometimes be
shortened significantly and the disadvantages associated with long delivery times
mentioned above may be offset (see Sect. 8.3).
Another approach in managing the supply chain processes is measuring the cycle
time of the logistics process. A distinction can be drawn between the following
cycles6:
¢ Procurement cycle of the suppliers
¢ Manufacturing cycle of the manufacturers
¢ Replenishment cycle in trade
¢ Customer order cycle of the consumers
This classification is modeled according to the functional distinction of logistics
(see Sect. 2.4) and can be broken down into the time spent on the informational
processing of the order (acceptance of order or purchase by customer at point of
sale), on the physical processing of the order (picking, packing), and on the delivery
(transport) or reception by the customer.7
Apart from these basic management techniques, there is a multitude of other
management systems. One of them is the so-called order to cash cycle system which
focuses on shorter time spans between order placement and payment by the
customer. This perspective is above all in the interest of the industry sector
(sometimes also in the trade sector if it is part of the supply chain) since the time
until receipt of the sales revenues is shortened and cost effective capital commit-
ment is therefore reduced (see Sect. 10.1.3). In this way, efficient logistics processes
and a networked supply chain management may substantially expedite the order to
cash cycle.
6 Cf. Chopra and Meindl (2009), p. 27 et seq.7 Cf. Delfmann and Reihlen (2003), p. 9.
3.3 Management of Logistics Systems 25
3.3.2 System Leadership
The core question around system leadership is to determine which one of the agents
at different value-added steps within a logistics chain or network assumes leader-
ship in managing these steps. Joint control by several agents normally yields
dissatisfying solutions due to shared responsibility. If several value-added steps
within a supply chain are linked to each other, the question of system leadership
appears. This question for instance is discussed and negotiated between
¢ The raw material supplier, the component manufacturer, or the end product
manufacturer; here, the end product manufacturer often dominates
¢ The end product manufacturer and the trade sector; depending on the market
power of the parties involved, various constellations between the industry sector
and the trade sector may result here
¢ The wholesalers and the retailers if several levels of trade are involved. In these
instances many small retailers are confronted with few powerful wholesalers,
which also assume leadership
¢ The shipping agents (industry and trading sector) and the logistics service
providers entrusted with the logistics processes
System leadership entails supremacy of control, which enables the system
leader to generate logistical synergy potential, such as cost advantages. Barring
distinctly cooperative companies, system leadership is usually wielded by indus-
trial and commercial companies which prevail due to their market power. How-
ever, it is also possible to pass system leadership on to third parties, for example to
logistics service providers. If several service providers are involved in the supply
chain, it is possible to designate one of them as system leader (Lead Logistics
Provider). The car industry offers many examples that illustrate this issue since
car manufacturers often assume leadership over their suppliers or service
providers with concepts such as Just in Time (JIT) or Just in Sequence (JIS)
(see Sect. 7.3.3). Consumer goods manufacturers and trading companies have
taken similar courses of action by implementing instruments for Efficient Con-
sumer Response (ECR) (see Sect. 7.5).
3.4 Organizational Variables in Logistics Systems
3.4.1 Organizational and Operational Structures of Logistics
Logistical task management and supply chain management require a corresponding
organization of these functions within a company. On the one hand, it is crucial to
set up a structure for the allocation of tasks and competencies within the respective
areas of responsibility. On the other hand, the functions and processes need to be
structured. A suitable way to view the corporate structure is to distinguish between
26 3 Logistics Systems
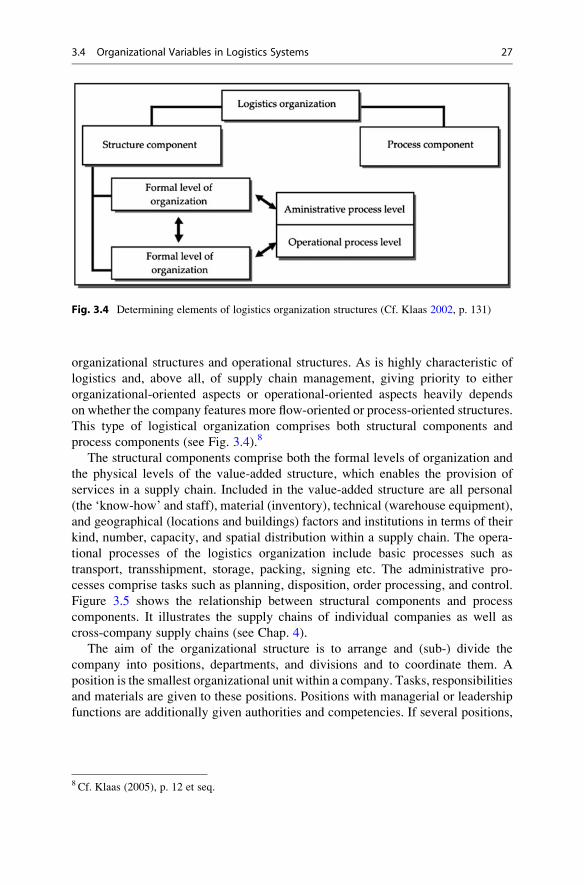
organizational structures and operational structures. As is highly characteristic of
logistics and, above all, of supply chain management, giving priority to either
organizational-oriented aspects or operational-oriented aspects heavily depends
on whether the company features more flow-oriented or process-oriented structures.
This type of logistical organization comprises both structural components and
process components (see Fig. 3.4).8
The structural components comprise both the formal levels of organization and
the physical levels of the value-added structure, which enables the provision of
services in a supply chain. Included in the value-added structure are all personal
(the ‘know-how’ and staff), material (inventory), technical (warehouse equipment),
and geographical (locations and buildings) factors and institutions in terms of their
kind, number, capacity, and spatial distribution within a supply chain. The opera-
tional processes of the logistics organization include basic processes such as
transport, transshipment, storage, packing, signing etc. The administrative pro-
cesses comprise tasks such as planning, disposition, order processing, and control.
Figure 3.5 shows the relationship between structural components and process
components. It illustrates the supply chains of individual companies as well as
cross-company supply chains (see Chap. 4).
The aim of the organizational structure is to arrange and (sub-) divide the
company into positions, departments, and divisions and to coordinate them. A
position is the smallest organizational unit within a company. Tasks, responsibilities
and materials are given to these positions. Positions with managerial or leadership
functions are additionally given authorities and competencies. If several positions,
Fig. 3.4 Determining elements of logistics organization structures (Cf. Klaas 2002, p. 131)
8 Cf. Klaas (2005), p. 12 et seq.
3.4 Organizational Variables in Logistics Systems 27
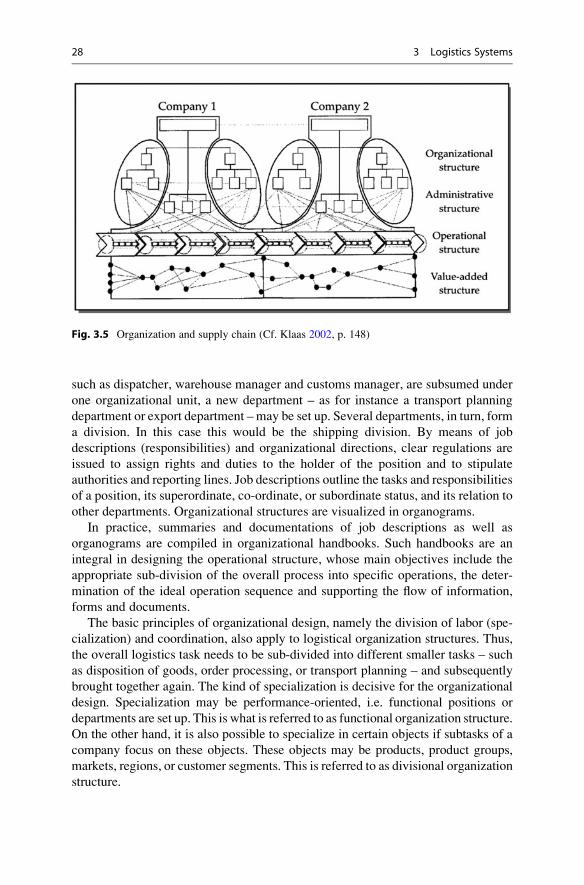
such as dispatcher, warehouse manager and customs manager, are subsumed under
one organizational unit, a new department – as for instance a transport planning
department or export department – may be set up. Several departments, in turn, form
a division. In this case this would be the shipping division. By means of job
descriptions (responsibilities) and organizational directions, clear regulations are
issued to assign rights and duties to the holder of the position and to stipulate
authorities and reporting lines. Job descriptions outline the tasks and responsibilities
of a position, its superordinate, co-ordinate, or subordinate status, and its relation to
other departments. Organizational structures are visualized in organograms.
In practice, summaries and documentations of job descriptions as well as
organograms are compiled in organizational handbooks. Such handbooks are an
integral in designing the operational structure, whose main objectives include the
appropriate sub-division of the overall process into specific operations, the deter-
mination of the ideal operation sequence and supporting the flow of information,
forms and documents.
The basic principles of organizational design, namely the division of labor (spe-
cialization) and coordination, also apply to logistical organization structures. Thus,
the overall logistics task needs to be sub-divided into different smaller tasks – such
as disposition of goods, order processing, or transport planning – and subsequently
brought together again. The kind of specialization is decisive for the organizational
design. Specialization may be performance-oriented, i.e. functional positions or
departments are set up. This is what is referred to as functional organization structure.
On the other hand, it is also possible to specialize in certain objects if subtasks of a
company focus on these objects. These objects may be products, product groups,
markets, regions, or customer segments. This is referred to as divisional organization
structure.
Fig. 3.5 Organization and supply chain (Cf. Klaas 2002, p. 148)
28 3 Logistics Systems
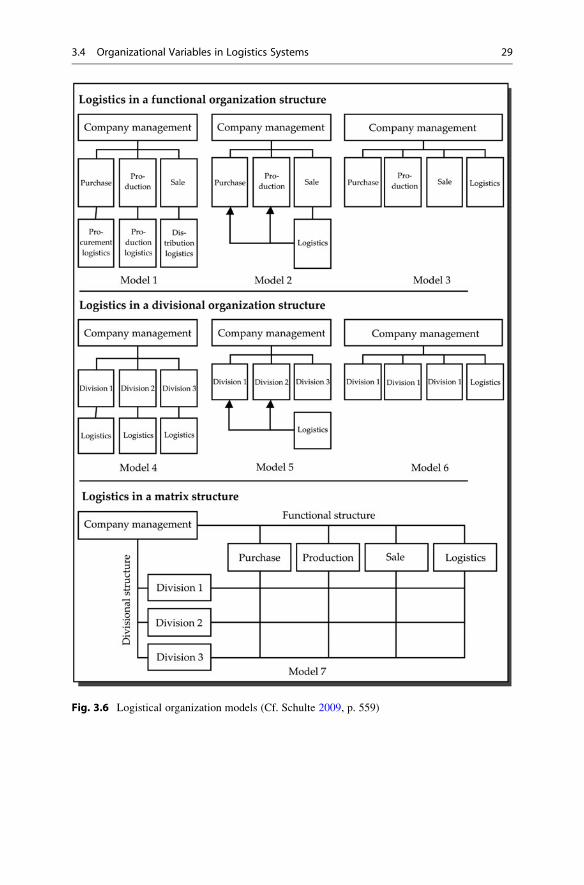
Fig. 3.6 Logistical organization models (Cf. Schulte 2009, p. 559)
3.4 Organizational Variables in Logistics Systems 29
Regarding logistics organization, Fig. 3.6 shows logistical organization forms
which can be distinguished as follows9:
¢ Functional Organization Structure
– Model 1: Logistical sub-functions, such as procurement logistics, production
logistics and distribution logistics, are generated to match the respective
functional areas of purchase, production, and marketing.
– Model 2: The cross-functional coordination is effected by setting up a
logistical functional area.
– Model 3: An independent central department is established for logistics
which operates on the same level as purchase, production, and marketing.
¢ Divisional Organization Structure
– Model 4: Each division operates its own logistics department.
– Model 5: The logistical processes are coordinated by an independent logis-
tics department.
– Model 6: An independent central department carries out the logistical tasks
for the respective division.
¢ Matrix Structure
– Model 7: Logistics is an independent functional area responsible for all
logistical operations.
Apart from these organizational designs, there are a number of other logistical
organization structures which can be employed by small to medium-sized businesses
or by businesses with a small volume of logistics tasks. By establishing a central
staff unit, it is thus possible to coordinate the flow of goods and materials centrally
without having to set up a new department. In these cases, however, the management
responsibilities are given to other functional areas such as production or sales. That is
why staff units may often only have a say by virtue of their methodical and profes-
sional competencies as for instance budgeting or simulation calculation, cost-benefit
analysis, or key figures development. The same is true for expert panels (conferences,
committees, meetings) and teams that assume advisory functions and/or perform
preparatory work for decision-making. Teams are especially suitable for collabora-
tive and temporary tasks and projects.
Along with the development of logistics (see Chap. 1), there has been a change
in the company’s logistical organization structure.10 This change is characterized
by a shift away from rigid, hierarchy-oriented organizational structures towards
more flexible, process-oriented operational structures. This organizational form
is also referred to as process chain management.11 In the case of a process-oriented
organizational design, the criterion of process efficiency is essential. Process
9 Cf. Schulte (2009), p. 558 et seq.10 Cf. Pfohl (2010), p. 238 et seq.11 Cf. Ihde (2001), p. 343.
30 3 Logistics Systems
efficiency is to be understood as the orientation of the internal performance
processes towards the goals of the company as a whole.12
The main characteristics of process orientation are13:
¢ The process-specific allocation of resources
¢ The assignment of processes to process owners
¢ A marked customer orientation
A clear resource allocation reduces the level of resource interdependency
between individual processes, which, for example, leads to faster cycle times. The
appointment of process owners with corresponding discretionary, control, and
coordination competencies foregoes the setup of additional managing, controlling,
and coordinating authorities. Customer orientation allows customer requirements to
be considered across all departments and not only those with immediate concern,
for instance, sales or distribution. There has been an ongoing appreciation of
logistical functions in operational practice in line with these developments. It is
reflected both in the hierarchy layout of logistics areas (department management,
corporate management) and in the functional areas themselves (logistics centers,
site logistics, plant logistics).
However, knowledge of logistics concepts, in many cases, has been circulating
in companies and individual departments so that sometimes it does not appear
necessary to further anchor professional expertise in solid knowledge, at least with
regards to logistics. It seems more important to optimize cross-company alignment
between the agents in the supply chains.
3.4.2 Inter-Organizational Optimization Through Supply ChainManagement
In the preceding chapters, we discussed concepts of logistics and supply chain
management which were mostly based on material-flow techniques or information
techniques or featured solutions based on special methods and models. Apart from
these concepts, it is also the ways of collaboration between the agents in supply
chains, and thus their relationships among each other, which are becoming more and
more important. This has to do with the fact that supply chains are becoming
increasingly complex and globalized and alsowith the growing number of companies
involved and the resulting higher information technological interconnectedness.
Numerous changes reinforce these tendencies. Thus, traditional customer-supplier
relationships are evermore developing into innovation-oriented partnerships. The
choice of suppliers and service providers is in many cases no longer based on a
comparison of offers but on the level of existing development competence. Addi-
tionally, pricing processes and rebate policies are undergoing changes which make
12 Cf. Frese (2005), p. 317.13 Cf. Dehler (2001), p. 141.
3.4 Organizational Variables in Logistics Systems 31

for a replacement of annual price rounds without disclosure of the calculations by
continuous price and cost reductions based on the disclosure of target costs.
Owing to the cross-company responsibility and management of the flows of
goods, supply chain management also needs to undergo organizational changes.
This gives rise to logistical organization designs based on networks which subsume
all cross-company relationship structures comprising several partner companies
within a service network that trade with each other cooperatively.14 A prerequisite
for cooperation is the will to cooperate and the genuine purpose of overall optimi-
zation. To ensure this right from the beginning, cooperations should be encouraged
at senior level by the respective corporate management as there often are initial
misconceptions and opposition to be dispelled.
Ideally, the qualities of the agents complement each other in supply chains based
on the division of labor and thus lead to improved productivity and increased
revenues and profits, which is also referred to as win-win-situation.15 However,
this improvement potential is not generated automatically. Moreover, there are a
number of problems which require appropriate relationship management. It seems
interesting that the information and communication technological components do
not constitute a problem in the realization of supply chain management concepts
but that problems arise in the formation and maintenance of partnerships.
One of the main reasons for this is the fact that companies often lack familiarity
with and experience in managing business relations. This is especially true for
handling the apparent paradox of building up sustainable but yet highly flexible
partnerships in a fast changing environment. Problems also frequently arise with
regard to choosing the right business partners. Furthermore, operationalizing the
cost and benefits optimization, which is being achieved through relationship man-
agement, often poses problems. Thus, the goals of relationship management are16:
¢ The results for the partner (successful relationship, fair relationship)
¢ The activities of the partner (specific investments, specific stakes)
¢ One’s own goals (successful relationship, fair relationship)
Obviously, in operational practice there are numerous hindrances to the realization
of these goals. In particular, choosing the right partner is of paramount importance
since long-term cooperation might be desired. Business relationships may thus be
characterized as dominant, confrontational, cooperative or amicable. Partnerships
between agents in a business relationship should feature the following
characteristics:
¢ High technological standard
¢ Existing development and innovation activities
¢ Distinct skills in single functional areas
14 Cf. Stolzle (1999b), p. 587.15 Cf. Scheer and Borowski (1999), p. 9.16 Cf. Stolzle (1999a), p. 224 et seq.
32 3 Logistics Systems
It is essential to build up reputation and trust. This can be achieved by agreeing on
exclusivity, risk-taking, fair distribution of decision-making rights between the
partners in a non-centralized way, and by demonstrating reliability.17 Based on
this, differing interests can be expressed and mutual obligations stipulated. How-
ever, this may lead to mutual dependency between the partners and loss of control
over one’s own resources. Trust, and thus the disposition to enter into long-term
partnerships, can only be brought about if the partners are under the subjective
impression that investing in the business relationship is proportionate to the benefits
resulting from this relationship. This can be measured in monetary dimensions, such
as increased volume of turnover or profits, but also in non-monetary dimensions.
The risk of opportunistic behavior after the disclosure and exchange of informa-
tion, such as sales figures, cost data or profit margins, may pose another problem.
If this information is leaked to the dominating partner, they might use it to improve
their own market position by demanding additional services or discounts.
An example of this would be the market position of the trade sector compared to
that of the manufacturer. Since the trade sector is closer to the consumer and
because it has the manufacturer’s products in its product range, the manufacturer’s
success is in part heavily dependent on the trade sector. Another example is the
provision of sales data at the point of sale. If the cooperation between trader and
manufacturer is characterized by mutual trust, this data can be provided without any
problems and rationalization potential may be realized. This, however, is still rarely
the case and often the manufacturer is only given aggregated central warehouse
data which is far less detailed and does not allow for or at least complicates the
supply of subsidiaries.
3.4.3 Intra-Organizational Behavior and Changed StaffRequirements
The deliberations outlined above about the inter-organizational prerequisites of logis-
tics and supply chain management cannot conceal the fact that an improvement of
inter-organizational coordination still requires coordinating the intra-organizational
processes. This means that inter-organizational and intra-organizational coordination
are mutually dependent and only jointly enable further optimization. The mentality of
department and sector optimization is to be superseded by a mentality of thinking in
holistic, customer-oriented processes. Goal conflicts between the organizational units
should be avoided.18 In this context it is important to bear in mind the mutual
dependencies which, above all, occur between the areas of marketing, sales, and
logistics. These reciprocities, also referred to as trade-offs, are established by the
17 Cf. Stolzle (1999a), p. 229 et seq.18 Cf. Pfohl (2010), p. 233.
3.4 Organizational Variables in Logistics Systems 33
actions or decisions of one organizational unit, thereby modifying the decision area of
another organizational unit in a goal-relevant manner.19
These trade-offs result from possible goal conflicts between the logistics depart-
ment and other business functions. Due to market conditions, the marketing and
sales departmentsmay demand comprehensive 24/7-availability of a broad and deep
product range, often without considering the associated inventory costs and the
cost effects of an extensive product range. Thus, marketing goals may (initially)
play a counterpart to a desired logistical efficiency.20 Suitable cost and benefit
calculations as well as controlling instruments therefore need to make goal conflicts
transparent internally (see Chap. 10). Examples of cross-company solutions are
Vendor Managed Inventory (VMI), Collaborative Planning Forecasting Replenish-
ment (CPFR) etc. (see Sect. 7.5).
In order to develop and realize the right solutions for inter-organizational and
intra-organizational processes it is important that the people involved are not only
professionally but also methodically competent and that they display a high level of
soft skills. On the other hand, they need to have the necessary authority to be able to
make and enforce decisions. This entails increased requirements for staff members
in the overall optimization of supply chain logistics. Purchase decisions, for
example, may thus have repercussions on the logistics level which the purchaser
needs to take into account and has to answer for. It is not least due to these changing
requirements that opposition is encountered. Advanced vocational training courses
can help alleviate these negative effects.
Cooperation concepts of ECR turn former product managers of producers into
sales-oriented commodity group managers, whose autonomous management of
their commodity group takes the specific interests of their partners into account.
One should not underestimate the influence of the employees within growing
organizational structures that can impact the implementation of such changes.
The setup of supply chains usually calls for dispensing with familiar working
models and hierarchical models and makes it necessary to embrace change. This,
however, also means that both openness and trust must be prevalent among the
employees so that the right solutions can be found and fair distribution of the jointly
achieved benefits can be effected.
19 Cf. Frese (2005), p. 242 et seq.20 Cf. Zentes (2004), p. 256.
34 3 Logistics Systems

Review Questions
1. Give examples of organizational logistics structures.
2. What are logistics systems?
3. What are the basic principles of controlling logistics systems?
4. What is the significance of system leadership and how can it be influenced?
5. Describe different organizational and operational logistics structures within
companies.
6. What is the difference between process-oriented organization and conven
tional forms of operational organization?
7. What is a process owner?
8. What kind of competencies do employees in logistics organizations need
to have?
9. What are the main challenges of logistical relationship management?
10. Draft a job description for a transport planning role.
Additional Literature
Bowersox, D. J., Mentzer, J. T., & Speh, T. W. (1995). Logistics leverage. Journal of BusinessStrategies, 12, 36–49.
Chopra, S., & Meindl, P. (2009). Supply chain management. Upper Saddle River: Prentice-Hall.Christopher, M. (2005). Logistics and supply chain management. Harlow: Pearson Education
Limited.
Gleißner, H. (2000). Logistikkooperationen zwischen Industrie und Handel. Gottingen: Cuvillier.Gopfert, I. (2005). Logistik Fuhrungskonzeption. Munchen: Vahlen.
Klaas, T. (2002). Logistik-Organisation. Wiesbaden: DU-Verlag.
Laurent, M. (1996). Vertikale Kooperationen zwischen Industrie und Handel. Frankfurt:
Deutscher Fachverlag.
Pfohl, H.-C. (2010).Logistiksysteme: Betriebswirtschaftliche Grundlagen (8th ed.). Berlin: Springer.Rogers, D., & Tibben-Lembke, R. S. (1999). Going backwards: reverse logistics trends and
practices. Reverse Logistics Executive Council: University of Nevada, Reno.
Schulte, C. (2009). Logistik-Wege zur Optimierung der Supply Chain (5th ed.). Munchen: Vahlen.
Sebastian, H.-J., & Grunert, T. (Ed.) (2001). Logistikmanagement: Supply chain management undE-Business. Stuttgart: Teubner Verlag.
Spengler, Th., Voß, St., & Kopfer, H. (Ed.) (2004). Logistikmanagement: Prozesse, Systeme,Ausbildung. Heidelberg: Springer.
Stock, J. R., & Lambert, D. M. (2001). Strategic logistics management (4th ed.). Homewood:
McGraw-Hill Irwin.
Zhao, M., Droge, C., & Stank, T. O. (2001). The effects of logistics capabilities on firm
performance. Journal of Business Logistics, 22(2), 91–100.
Additional Literature 35
Logistical Infrastructure 4
Learning Objectives
Logistical infrastructure is the backbone of logistics systems. Apart from the
transport infrastructure, the suprastructure including the logistics locations and
real estate as well as the telecommunication infrastructure are becoming increas-
ingly important for logistics. It is the aim of this chapter to illustrate the logistical
functions of the various infrastructural facilities. To this end, the numerous
complexities and interdependencies of the individual infrastructures will be
identified and amalgamated into the logistical infrastructure.
Keywords
¢ Transport infrastructure
¢ Infrastructure, superstructure
¢ Individual properties, logistics parks
¢ Terminals
¢ Transshipment facilities
¢ Freight villages
¢ Satellite navigation
¢ Disaster Recovery
¢ Business Continuity
H. Gleissner and J.C. Femerling, Logistics, Springer Texts in Business and Economics,
DOI 10.1007/978-3-319-01769-3_4, # Springer International Publishing Switzerland 2013
37
4.1 Basic Terminology, Types and Functions
A capable logistical infrastructure is prerequisite for modern logistics systems in
which efficient logistical processes are to be carried out. In general terms, infra-
structure means the entirety of sustainable facilities and supply channels that can be
used by private households and companies. We distinguish between economicinfrastructure and social infrastructure. Economic infrastructure comprises
transport infrastructure, information infrastructure, and (tele)-communication infra-
structure.1 Social infrastructure includes institutions for education, healthcare,
culture and security within a state and society. In contrast to this macroeconomic
view, the microeconomic dimension of logistical infrastructure refers to the defini-
tion of the spatial and technical structural properties and to the dimensioning of a
logistics system. This, for example, includes warehouses, means of transport,
conveyors, storage and picking technology and facilities as well as the
corresponding information and communication systems.2 It is therefore in a com-
prehensive and holistic sense that the concept of logistical infrastructure covers the
micro- and macro-economic infrastructure facilities of transport infrastructure, site
infrastructure, building infrastructure, and communication infrastructure (real
estate).
Transport infrastructure comprises the infrastructure for passenger transport and
freight transport. This includes all physical traffic routes such as railroads for trains
and city railroads, roads, tunnels, waterways and pipelines including their control
systems, and handling facilities. These are also termed linear or networked traffic
infrastructure or transport infrastructure. In contrast, site infrastructure includes
airports, train stations, inland ports and sea ports, which are also referred to as
point-shaped traffic or transport infrastructure. Logistical infrastructure in this sense
not only comprises traffic facilities but also facilities for transshipment and storage
at the site’s terminal. These facilities are also termed suprastructure (see Fig. 2.5).The information exchange necessary for logistics processes is made possible by
telecommunication and its corresponding infrastructure. Telecommunication infra-
structure includes telephone networks, fibre optics networks and their network
nodes, satellites with their associated ground stations, and data centers. This is
also referred to as web-based or digital infrastructure. As part of all the infrastruc-
ture facilities mentioned so far we can also summarize buildings, structures and
properties in different shapes and sizes under the term real estate infrastructure.
1 Also Cf. Pfohl (2000), p. 349 et seq., who uses the term macro-logistical infrastructure to cover
the infrastructure of goods and information flows, as well as transport policy.2 Cf. Arnold et al. (2008), p. 901.
38 4 Logistical Infrastructure
4.2 Transport Infrastructure and Suprastructure
4.2.1 Transport Routes and Transport Networks
Depending on the respective transport mode, transport infrastructure can be broken
down into the national and international networks of air transport, rail transport,
inland waterway transport, sea transport, and road transport.3
The EU features a network of air routes which comprises more than 450 airports
operated by more than 130 airlines. Hub-and-spoke networks have been set up by
airlines in order to operate these air routes in themost efficientmanner (see Sect. 8.4.2).
Within these networks, the busier routes are bundled together by central airports
(hubs). Less busy routes start from the spokes and are then joined to the hubs.
The longest railroad networks in Western Europe are located in Germany
(38,206 km) and France (30,832 km). The quality of railroad networks within
Europe differs as to the degree of electrification and the expansion of high-speed
train networks. Differing track gages, e.g. in Spain and Russia, necessitate
transshipment in cross-border transport. By 2020, Spain will convert its railroad
network to the standard European gage.
Inland waterway networks aremade up of navigablewaterways that serve as a link
between inland ports and/or sea ports. Depth and breadth of waterways are defining
for their utilization. The longest networks can be found in Finland (7,884 km),
Germany (6,636 km), the Netherlands (6,183 km), and France (5,384 km).
Sea transport networks provide routes for either short sea shipping or internationalocean shipping. Short sea shipping is carried out on pre-defined offshore routes
with good connections to the Hinterland. Sea routes determine the connections on
the high seas.
Extensive road networks make a region accessible. Within Europe, Germany
(12,363 km), Spain (11,622 km), and France (10,801 km) feature the longest highway
network. Germany distinguishes between federal highways (Bundesfernstraße/Bundesautobahn/Bundesstraße), state roads (Landesstraße), county roads (Kreisstraße),and municipal roads (Gemeindestraße).
Transport infrastructure is increasingly controlled by the information and com-munication infrastructure of systems that are associated with the respective trans-
port mode. This serves the purpose of improving the transport infrastructure’s
quality. Examples for inland waterway transport include river information systems
(water levels, lock allocation etc.) and automatic indentification systems. In sea
transport, automatic identification systems are provided in the form of Internet
applications and portals.4 Numerous telematics systems are available for road
traffic transport in order to track vehicles and goods, to monitor rest and driving
periods, and to capture data about tolls, traffic congestions and diversions.
3 Cf. Ruhl (2008), p. 37 et seq.4 Cf. Biebig et al. (2004), p. 444 et seq.
4.2 Transport Infrastructure and Suprastructure 39
4.2.2 Airports
Air transport is organized according to the following (sub-) systems5:
¢ Air transport services offered by airlines
¢ Set-up and operation of air traffic control and control systems
¢ Set-up and operation of airports (airport services)
Airports fulfill important infrastructural functions. Their main purpose is to
provide infrastructure relevant to air transport. This mainly includes the provision
of runway systems, passenger terminals, and connections to ground transport systems
(see Fig. 4.1).6 Airports can be subdivided into landside and airside areas as well as
air freight buildings.7 The terminal is the main landside building. In general it
consists of two areas separated by border and passport control through which all
passengers and flight personnel need to pass preflight. Check-in (ticket collection,
seat reservation, luggage check-in, security control) takes place in the front part of the
terminal.
Frequently, this part also features shops, restaurants, and exhibition areas
(non-aviation area).Waiting areas and accesses to the gates are located behind this part.
The airside area of an airport comprises the system of runways which is needed
to enable aircraft movements (take-off, landing). Taxiways, maneuvering areas,
hangars, and cargo centers also form part of this area.
Depending on the location and distribution area of airports and thus on their
position in the hierarchy of central facilities, we can distinguish between regionalor national airports for feeder and distribution services and international majorairports serving as hubs and transit points. In this context, an airport’s significance
as a logistics location and its interconnection with the surrounding region are
displayed by nearby airport industrial parks, airport terminals or airport logisticscenters for air cargo dispatch.8 However, rather than necessarily offering air cargo
services, logistics service providers in many cases only take advantage of an
airport’s prominent position within the transport system and of the existence of a
highly developed transport infrastructure.
The development of cargo airports was brought about by the importance of air
cargo and due to the limited service offers of existing airports such as capacity
bottlenecks and bans on night flights.9 In most cases, the hubs of mail and parcel
service providers (integrators) are located at these airports (see Sect. 5.5.2). This, in
5 Cf. Koch (2006), p. 93 et seq.6 Cf. Maurer et al. (2003), p. 69.7 Cf. Arnold et al. (2008), p. 770.8 Cf. Ihde (2001), p. 214; Vahrenkamp (2005), p. 301 et seq.9 Cf. Meeder (2003), p. 492.
40 4 Logistical Infrastructure
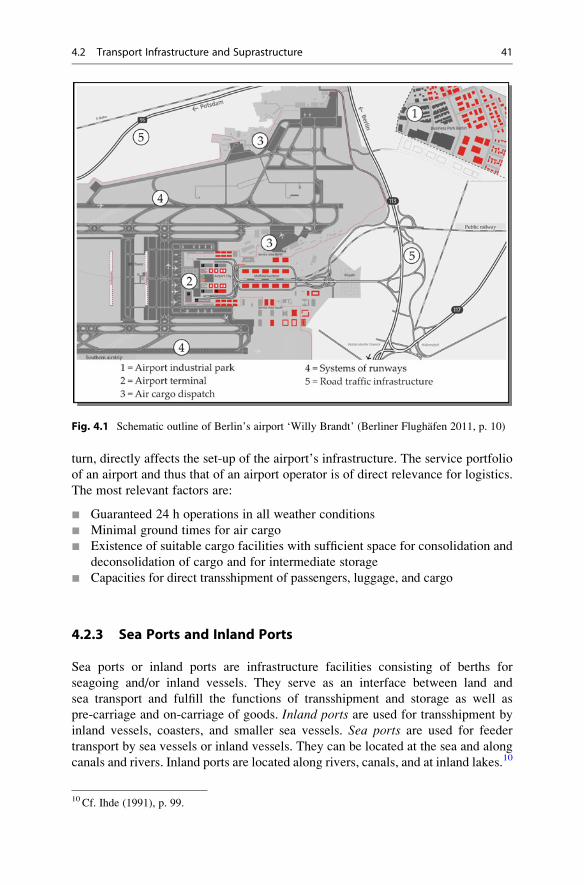
turn, directly affects the set-up of the airport’s infrastructure. The service portfolio
of an airport and thus that of an airport operator is of direct relevance for logistics.
The most relevant factors are:
¢ Guaranteed 24 h operations in all weather conditions
¢ Minimal ground times for air cargo
¢ Existence of suitable cargo facilities with sufficient space for consolidation and
deconsolidation of cargo and for intermediate storage
¢ Capacities for direct transshipment of passengers, luggage, and cargo
4.2.3 Sea Ports and Inland Ports
Sea ports or inland ports are infrastructure facilities consisting of berths for
seagoing and/or inland vessels. They serve as an interface between land and
sea transport and fulfill the functions of transshipment and storage as well as
pre-carriage and on-carriage of goods. Inland ports are used for transshipment by
inland vessels, coasters, and smaller sea vessels. Sea ports are used for feeder
transport by sea vessels or inland vessels. They can be located at the sea and along
canals and rivers. Inland ports are located along rivers, canals, and at inland lakes.10
Fig. 4.1 Schematic outline of Berlin’s airport ‘Willy Brandt’ (Berliner Flughafen 2011, p. 10)
10 Cf. Ihde (1991), p. 99.
4.2 Transport Infrastructure and Suprastructure 41

With regard to a port’s infrastructure, we generally distinguish between the infra-
structure and the suprastructure. Infrastructure comprises immovable port facilities
such as docks, shipping channels, track systems, and quays. Suprastructure, in turn,
includes movable and immovable facilities such as crane systems, warehouses, and
industrial trucks. Also included in this superstructure are information and communi-
cation systems which illustrate the interdependencies between the individual forms
of logistical infrastructure.
Port infrastructure is largely dependent on the development of the ports and on the
functions they fulfil. In the wake of the industrialization, the development of the
railway and due to globalization, ports have become a gateway to the Hinterland.11
Hinterland is a term for those inland territories behind a port which maintain an
exchange of goods with the port.12 The infrastructural connections to the Hinterlandthrough pipelines, railways, waterways, roads, and by air are of great importance for
the economic development of the Hinterland.13 The demand for incoming and
outgoing seaward (mass) transports and improved transport connections in the
Hinterland lead to increased ship sizes, the construction of deeper approaches
to ports as well as to the installation of railway sidings and depots for docks and
quays. This also exemplifies the interdependencies between different logistical
infrastructures. Major factors in the development of ports are the fact that increas-
ingly bigger ships are built as well as the containerization of transport flows (see
Sects. 5.3.4 and 5.4.2). Both these developments call for an increased industrializa-
tion of transshipment in ports, which, in turn, poses significant challenges for a port’s
infrastructure and suprastructure.
4.2.4 Rail Stations and Railroad Systems
Rail stations are generally defined as railroad systems with at least one switch,
providing a starting and ending point for trains and allowing them to swerve or
turn.14 Rail infrastructure includes all railroad systems, properties, buildings and
other facilities necessary to perform or secure passenger or cargo transport by rail.
An overview of elements relevant to rail infrastructure is given in Fig. 4.2.
Depots serve to load and unload rail cars and wagons. Facilities for loading and
unloading may come in the simple form of transshipment areas between freight cars
and road vehicles. These areas can be located beside or in between the rails. There
11 Cf. Nuhn (2005), p. 110.12 Cf. Biebig et al. (2004), p. 290 et seq.13 Cf. Pfohl (2000), p. 352.14 Cf. Berndt (2001) p. 82 et seq.
42 4 Logistical Infrastructure
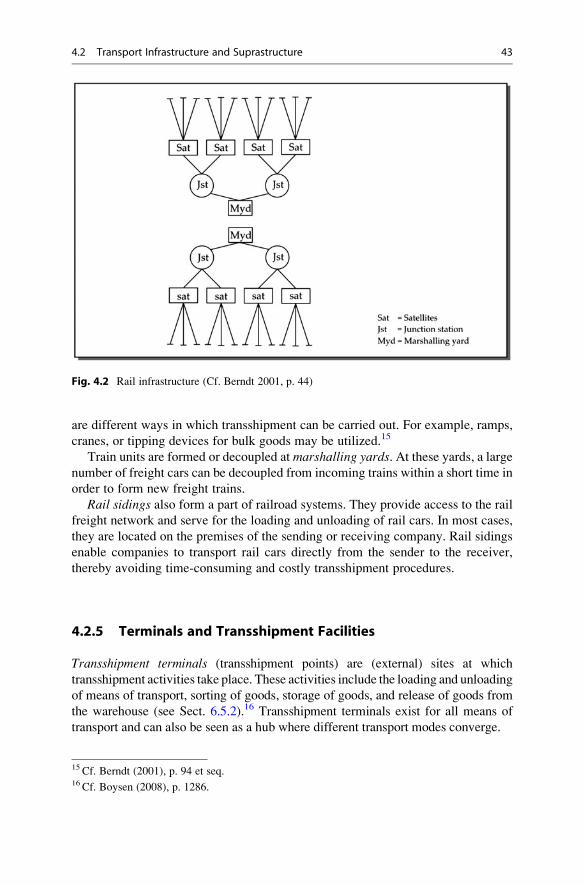
are different ways in which transshipment can be carried out. For example, ramps,
cranes, or tipping devices for bulk goods may be utilized.15
Train units are formed or decoupled at marshalling yards. At these yards, a largenumber of freight cars can be decoupled from incoming trains within a short time in
order to form new freight trains.
Rail sidings also form a part of railroad systems. They provide access to the rail
freight network and serve for the loading and unloading of rail cars. In most cases,
they are located on the premises of the sending or receiving company. Rail sidings
enable companies to transport rail cars directly from the sender to the receiver,
thereby avoiding time-consuming and costly transshipment procedures.
4.2.5 Terminals and Transshipment Facilities
Transshipment terminals (transshipment points) are (external) sites at which
transshipment activities take place. These activities include the loading and unloading
of means of transport, sorting of goods, storage of goods, and release of goods from
the warehouse (see Sect. 6.5.2).16 Transshipment terminals exist for all means of
transport and can also be seen as a hub where different transport modes converge.
Fig. 4.2 Rail infrastructure (Cf. Berndt 2001, p. 44)
15 Cf. Berndt (2001), p. 94 et seq.16 Cf. Boysen (2008), p. 1286.
4.2 Transport Infrastructure and Suprastructure 43
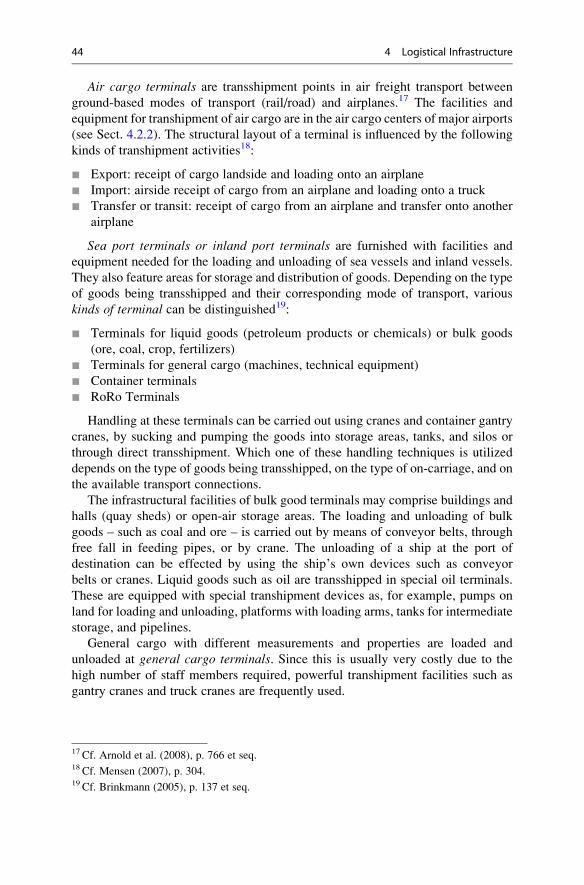
Air cargo terminals are transshipment points in air freight transport between
ground-based modes of transport (rail/road) and airplanes.17 The facilities and
equipment for transhipment of air cargo are in the air cargo centers of major airports
(see Sect. 4.2.2). The structural layout of a terminal is influenced by the following
kinds of transhipment activities18:
¢ Export: receipt of cargo landside and loading onto an airplane
¢ Import: airside receipt of cargo from an airplane and loading onto a truck
¢ Transfer or transit: receipt of cargo from an airplane and transfer onto another
airplane
Sea port terminals or inland port terminals are furnished with facilities and
equipment needed for the loading and unloading of sea vessels and inland vessels.
They also feature areas for storage and distribution of goods. Depending on the type
of goods being transshipped and their corresponding mode of transport, various
kinds of terminal can be distinguished19:
¢ Terminals for liquid goods (petroleum products or chemicals) or bulk goods
(ore, coal, crop, fertilizers)
¢ Terminals for general cargo (machines, technical equipment)
¢ Container terminals
¢ RoRo Terminals
Handling at these terminals can be carried out using cranes and container gantry
cranes, by sucking and pumping the goods into storage areas, tanks, and silos or
through direct transshipment. Which one of these handling techniques is utilized
depends on the type of goods being transshipped, on the type of on-carriage, and on
the available transport connections.
The infrastructural facilities of bulk good terminals may comprise buildings and
halls (quay sheds) or open-air storage areas. The loading and unloading of bulk
goods – such as coal and ore – is carried out by means of conveyor belts, through
free fall in feeding pipes, or by crane. The unloading of a ship at the port of
destination can be effected by using the ship’s own devices such as conveyor
belts or cranes. Liquid goods such as oil are transshipped in special oil terminals.
These are equipped with special transhipment devices as, for example, pumps on
land for loading and unloading, platforms with loading arms, tanks for intermediate
storage, and pipelines.
General cargo with different measurements and properties are loaded and
unloaded at general cargo terminals. Since this is usually very costly due to the
high number of staff members required, powerful transhipment facilities such as
gantry cranes and truck cranes are frequently used.
17 Cf. Arnold et al. (2008), p. 766 et seq.18 Cf. Mensen (2007), p. 304.19 Cf. Brinkmann (2005), p. 137 et seq.
44 4 Logistical Infrastructure
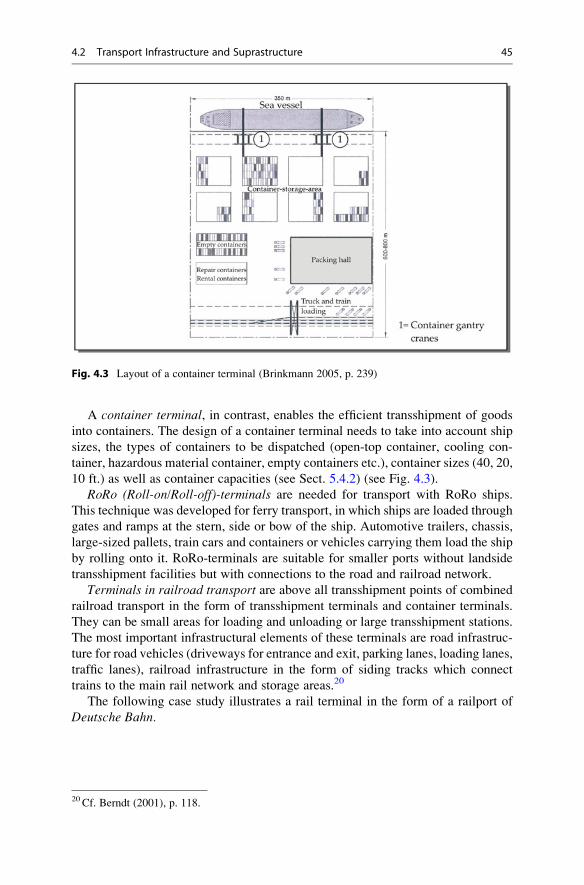
A container terminal, in contrast, enables the efficient transshipment of goods
into containers. The design of a container terminal needs to take into account ship
sizes, the types of containers to be dispatched (open-top container, cooling con-
tainer, hazardous material container, empty containers etc.), container sizes (40, 20,
10 ft.) as well as container capacities (see Sect. 5.4.2) (see Fig. 4.3).
RoRo (Roll-on/Roll-off)-terminals are needed for transport with RoRo ships.
This technique was developed for ferry transport, in which ships are loaded through
gates and ramps at the stern, side or bow of the ship. Automotive trailers, chassis,
large-sized pallets, train cars and containers or vehicles carrying them load the ship
by rolling onto it. RoRo-terminals are suitable for smaller ports without landside
transshipment facilities but with connections to the road and railroad network.
Terminals in railroad transport are above all transshipment points of combined
railroad transport in the form of transshipment terminals and container terminals.
They can be small areas for loading and unloading or large transshipment stations.
The most important infrastructural elements of these terminals are road infrastruc-
ture for road vehicles (driveways for entrance and exit, parking lanes, loading lanes,
traffic lanes), railroad infrastructure in the form of siding tracks which connect
trains to the main rail network and storage areas.20
The following case study illustrates a rail terminal in the form of a railport of
Deutsche Bahn.
Fig. 4.3 Layout of a container terminal (Brinkmann 2005, p. 239)
20 Cf. Berndt (2001), p. 118.
4.2 Transport Infrastructure and Suprastructure 45
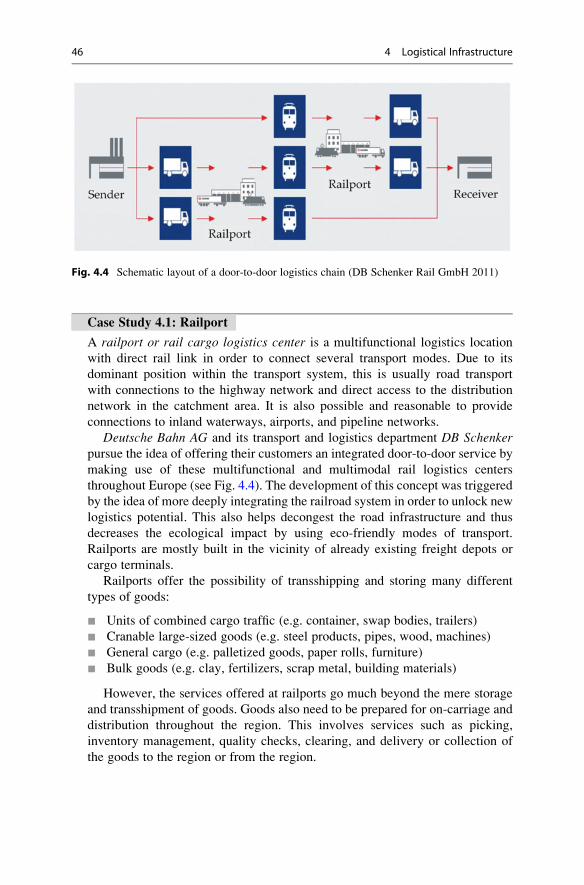
Case Study 4.1: Railport
A railport or rail cargo logistics center is a multifunctional logistics location
with direct rail link in order to connect several transport modes. Due to its
dominant position within the transport system, this is usually road transport
with connections to the highway network and direct access to the distribution
network in the catchment area. It is also possible and reasonable to provide
connections to inland waterways, airports, and pipeline networks.
Deutsche Bahn AG and its transport and logistics department DB Schenkerpursue the idea of offering their customers an integrated door-to-door service by
making use of these multifunctional and multimodal rail logistics centers
throughout Europe (see Fig. 4.4). The development of this concept was triggered
by the idea of more deeply integrating the railroad system in order to unlock new
logistics potential. This also helps decongest the road infrastructure and thus
decreases the ecological impact by using eco-friendly modes of transport.
Railports are mostly built in the vicinity of already existing freight depots or
cargo terminals.
Railports offer the possibility of transshipping and storing many different
types of goods:
¢ Units of combined cargo traffic (e.g. container, swap bodies, trailers)
¢ Cranable large-sized goods (e.g. steel products, pipes, wood, machines)
¢ General cargo (e.g. palletized goods, paper rolls, furniture)
¢ Bulk goods (e.g. clay, fertilizers, scrap metal, building materials)
However, the services offered at railports go much beyond the mere storage
and transshipment of goods. Goods also need to be prepared for on-carriage and
distribution throughout the region. This involves services such as picking,
inventory management, quality checks, clearing, and delivery or collection of
the goods to the region or from the region.
Fig. 4.4 Schematic layout of a door-to-door logistics chain (DB Schenker Rail GmbH 2011)
46 4 Logistical Infrastructure
An ideal railport usually features the following components:
¢ Traffic routes of the different transport modes
¢ Areas dedicated to the operation of transshipment devices (e.g. gantry
cranes, truck cranes, forklift trucks)
¢ Open areas for handling and storage
¢ Sheltered or indoor areas to carry out logistics services
Transshipment and storage activities can thus be adapted to requirements of
the specific types of goods. Open areas, warehouses, and transshipment halls
usually have direct rail and road access.
Depending on the size and number of terminals, the most common
transshipment techniques involve cranes (bridge cranes, gantry cranes) and
forklift trucks (frontload trucks, sideload trucks, telescopic handlers).
Cross-docking terminals as another type of transshipment terminals in which
consignments are directly transshipped between incoming and outgoing trucks
without intermediate storage. They aremostly long buildingswith numerous gates.
They are mainly utilized in consumer goods logistics (retail chains), by mail and
parcel service providers (hub-and-spoke systems), by transport companies and
carriers (general cargo networks) and in the automobile industry (OEMs,
suppliers) (see Sects. 5.5, 7.4, 8.4.3).21 Different technical devices may be used,
depending on industry and function. These include ground conveyors (vehicles),
material flow technology, and sorting technology (conveyor belts, chain
conveyors, sorting robots) (see case study 6.3).
4.2.6 Logistics Real Estate, Logistics Parks, and Freight Villages
Logistics real estate can be described as a building with appropriate infrastructure
and technology built on a suitable property for the purpose of performing
transshipment, storage, and all services associated with it (picking, packing, quality
checks, (sub) assembly).22 Therefore, a number of different types and categories of
logistics real estate can be distinguished. On the one hand, there are individualproperties including warehouses, transshipment halls, distribution centers, and
logistics service centers.23 On the other hand, there are real estate parks comprising
several buildings and sites, which can serve as logistics parks, industrial parks, or
freight villages.24
Warehouses may be used as central warehouses, regional warehouses, produc-
tion warehouses, or distribution warehouses. Their purpose is the storage of goods,
and they serve as a link between procurement and distribution. The way they are
21 Cf. Boysen and Tiedemann (2010), p. 54.22 Cf. Borner-Kleindienst (2006), p. 453; Nehm et al. (2009), p. 24.23 Cf. Borner-Kleindienst (2006), p. 454.24 Cf. Nehm and Schryver (2007), p. 233 et seq.
4.2 Transport Infrastructure and Suprastructure 47
equipped is dependent on the range of functions they fulfil and on the logistics
processes to be carried out on the property (see Sect. 8.3). In most cases,
warehouses offer good delivery capabilities for a speedy transshipment of goods.
Transshipment halls serve to distribute goods that arrive through long-distance
and short-distance transport. Since goods are stored for only a short time and
because the throughput rate is accordingly high, transshipment halls feature a
small height and depth but many gates for usually double-sided delivery. The
gates need to be designed in a way which enables the loading and unloading of
large trucks, utility vans, as well as station wagons.
Compared to warehouses and transshipment halls, distribution centers are signifi-cantly larger and have a greater number of loading gates. In addition, they are
frequently equipped with (automated) storage and picking systems. The type and
quantity of goods and commodities to be handled have a significant bearing on the
size and capacities of a distribution center. The spectrum of goods ranges from all
kinds of consumer goods (food, necessities, brown goods, white goods) to various
industrial goods. Perishable and temperature-sensitive products, for example, require
facilities for low-temperature storage which, in turn, raises certain challenges for the
property (layout, accesses, insulation). Machines and facilities require an especially
stable ground as well as special lifting and transport devices (cranes) (see Sect. 6.6).
Logistics service centers have the purpose of concentrating several suppliers,
warehousing companies, and transport companies in one place so that production
can take place nearby (e.g. just-in-time delivery). To this end, goods from different
sources need to be consolidated and processed in, for instance, production-logistics
centers (light industrial).
A logistics park is an area where several logistics properties are concentrated in
close proximity. The individual properties may differ with regard to their type and
size as well as to their tenancy and ownership relations. The main purpose of a
logistics park is the realization of synergies through the common use of infrastruc-
tural facilities such as gas stations, forklift truck fleets, workshops, offices etc. The
administration and maintenance of the infrastructural facilities is at the responsibil-
ity of the park owner. Since these parks are usually managed as an integrated whole,
it is safe to say that they are cheaper to maintain than an individual property.
Logistics parks may also be designed in an industry-specific way and according to
required logistical concepts. For this reason, there are numerous concepts for
logistics parks, which are also termed supplier parks. These are especially prevalent
in the automobile industry (see Sect. 7.4.3).25
Due to the high accumulation of logistics real estate, freight villages can be seen
as an extended form of logistics parks. Freight parks, however, serve purposes
related to transport and traffic policy and to the supply and disposal of goods in
specific regions (see Sect. 8.4.4).
25 Cf. Becker (2006), p. 41.
48 4 Logistical Infrastructure
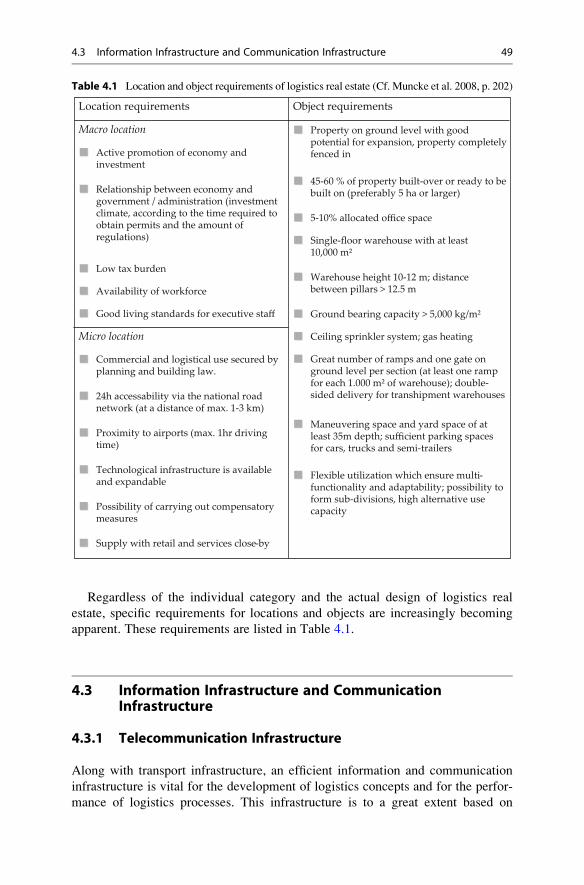
Regardless of the individual category and the actual design of logistics real
estate, specific requirements for locations and objects are increasingly becoming
apparent. These requirements are listed in Table 4.1.
4.3 Information Infrastructure and CommunicationInfrastructure
4.3.1 Telecommunication Infrastructure
Along with transport infrastructure, an efficient information and communication
infrastructure is vital for the development of logistics concepts and for the perfor-
mance of logistics processes. This infrastructure is to a great extent based on
Table 4.1 Location and object requirements of logistics real estate (Cf. Muncke et al. 2008, p. 202)
Location requirements Object requirements
Macro location
Active promotion of economy and investment
Relationship between economy and government / administration (investment climate, according to the time required to obtain permits and the amount of regulations)
Low tax burden
Availability of workforce
Good living standards for executive staff
Property on ground level with good potential for expansion, property completelyfenced in
45-60 % of property built-over or ready to be built on (preferably 5 ha or larger)
5-10% allocated office space
Single-floor warehouse with at least 10,000 m²
Warehouse height 10-12 m; distance between pillars > 12.5 m
Ground bearing capacity > 5,000 kg/m²
Ceiling sprinkler system; gas heating
Great number of ramps and one gate on ground level per section (at least one ramp for each 1.000 m² of warehouse); double-sided delivery for transhipment warehouses
Maneuvering space and yard space of at least 35m depth; sufficient parking spaces for cars, trucks and semi-trailers
Flexible utilization which ensure multifunctionality and adaptability; possibility to form sub-divisions, high alternative use capacity
-
Micro location
Commercial and logistical use secured by planning and building law.
24h accessability via the national road network (at a distance of max. 1-3 km)
Proximity to airports (max. 1hr driving time)
Technological infrastructure is available and expandable
Possibility of carrying out compensatory measures
Supply with retail and services close-by
4.3 Information Infrastructure and Communication Infrastructure 49

telecommunication infrastructure and can be set up using different networks (land-
line, mobile telephony, radio network, microwave radio relay), depending on the
services offered (GSM, UMTS) and on the data transfer.26 There is, however, a
tendency towards the development of a uniform network infrastructure through
which all services can be offered and utilized. This network infrastructure is based
on the Internet Protocol (IP) which replaces the circuit-switched networks with a
packet-switched network infrastructure.
Telecommunication networks can exhibit different structures (network typology)
which utilize various types of hardware and access methods for data connection and
transmission. These, in turn, determine the rate of transmission, the data throughput,
and data security concepts. Thus, local networks (LANs – Local Area Networks)
consist of several computers and external devices (printers, scanner etc.) which are
interconnected in one building. Internet access is given via a router. In contrast to
LANs, WANs (Wide Area Networks) cover a large geographical area. Commercial
WANs are designed formaximum capacity utilization and consist of circuit-switched
connections, point-to-point connections, packet-switched connections, and Virtual
Private Networks (VPN). In order to support these services and to achieve high
transmission speeds, optical transmission media (fiberglass) are used more and
more frequently for broadband infrastructure.27
All these hardware and software installations are usually hosted in IT rooms,
server rooms, or in data centers which display a specific infrastructure. The
infrastructure of data centers includes the provision of rooms, energy supply, air
conditioning, and object security.28
The development of IT and computer technologies does not only substantially
influence the kind of services rendered in data centers – it also affects the property
and room layout. Data centers are a specific type of real estate which are also
termed collocation centers, IT centers, IT hotels, server hotels, telehouses, and so
forth.29
We can also see an increase in the number of data center parks in which
companies rent cages, several rooms, or entire buildings which are then equipped
or (re-) constructed according to the customer’s specifications. These types of
solutions offer the advantage of redundant provisioning of building infrastructure
as well as the possibility to provide office space with emergency workplaces. These
workplaces can be utilized in emergency situations (disaster recovery, business
continuity) in order to continue business without interruption, which is also becom-
ing increasingly important in a logistical context.
26 Cf. Heiserich et al. (2011), p. 361 et seq.27 Regarding this technology Cf. Keller (2011), p. 141 et seq.28 Cf. Rittweger and Rossbach (2006), p. 239.29 Cf. Seitz (2004), p. 29.
50 4 Logistical Infrastructure
4.3.2 Satellite Systems and Satellite Navigation
World-wide telecommunication is to a great extent based on satellite systems.
This technology makes it possible to set up a comprehensive infrastructure that
offers services with high data transmission rates. A logistical example of this is the
ERMTS (European Railway Transport Management System), which offers several
projects and services in the area of railroad information systems, as for example
the international GSM-R-network (Global System for Mobile Communication
Railways). This network is a platform for commercial railroad radio systems.30
Apart from the support of telecommunication services, satellites also offer satellitenavigation as one of their core functions. This method enables the determination of an
object’s position. Using suitable technologies and programs, modern satellite naviga-
tionmakes it possible to determine the coordinates of locations based on their distances
to at least three satellites. The construction of the European satellite system Galileo,due to be operational by 2013, is of paramount significance for the commercial use of
satellite systems. Galileo will be a system of the European Union which adds to the
already existing state-ownedUS satellite systemGPS (Global Positioning System) and
to the Russian system Glonass (Globalnaja Nawigazionnaja Sputnikowaja Sistema).
The system will comprise 30 satellites. Galileo will make it possible to offer different
services which vary in regard to accuracy, number of signals, and reliability of service.
Commercial satellite navigation services are especially suitable for logistics and
can be used for the navigation of continental transport, telematics platforms, for
locating purposes in aviation and shipping, and as research platforms for transport
and logistics systems.31 The additional availability of these applications in compari-
son to existing systems is mainly due to the system’s high accuracy and its world-
wide availability. Central to these applications is the localization and tracking of
goodswhich are transported in amulti-modalmanner. This requires constant location
of the respective carriers and of the goods transported, and all parties involved in the
supply chain need to be able to continuously obtain information across all transport
modes and independent of their location (location information).32
30 Cf. Berndt (2001), p. 122.31 Cf. Schenk et al. (2011), p. 573 et seq.32 Cf. Clausen and Inninger (2009), p. 43 et seq.; Elsenbach (2006), p. 445.
4.3 Information Infrastructure and Communication Infrastructure 51
Review Questions
1. What does logistical infrastructure mean?
2. What is the difference between superstructure and transport infrastructure?
3. What is the significance of information and communication infrastructure for
logistics systems?
4. Name the infrastructure facilities of an airport that are relevant for air cargo
transport.
5. Name the most important factors that need to be considered when setting up
a container terminal at a sea port.
6. Describe the functions of a marshalling yard.
7. Differentiate between different types of logistics real estate.
8. What are the most important location and object requirements for logistics
real estate?
9. In what way are logistics parks different from freight villages?
10. What is the significance of telecommunication infrastructure for logistics?
Additional Literature
Bose, J. W. (2011). Handbook of terminal planning. New York: Springer.
Bowersox, J. D., Closs, D. J., & Cooper, M. B. (2009). Supply chain logistics management.New York: McGraw-Hill.
Coyle, J. J., Bardi, E. J., & Novack, R. A. (2000). Transportation (5th ed.). Cincinnati: South-
Western College Publishing.
Deutsche Bahn AG. (2007). Transport & logistik: Drehkreuze. In Mobility networks logistics.Berlin.
Dornier Consulting GmbH. (2006). Erfolgsfaktoren und Bewertungsmoglichkeiten vonPPP-Projekten fur Verkehrsinfrastruktur: Eine internationale und verkehrstrageruber-greifende Analyse. Berlin.
Ernst, M., & Walpuski, D. (1997). Telekommunikation und Verkehr. Munchen: Vahlen.
Hatton, G. (1994). Designing a warehouse or distribution centre. In J. Gattorna (Ed.), The Gowerhandbook of logistics and distribution management (pp. 175–193). Adlershot: Chartered
Institute of Purchasing & Supply.
Kazda, A., & Caves, R. E. (2007). Airport design and operation. Amsterdam: Elsevier.
Klauenberg, J. (2009). Modellierung und Typisierung von Distributionszentren in Seehafen.
Dissertation Universitat Rostock, Hamburg.
Song, D.-W., & Panayides, P. H. (2012).Maritime logistics: A complete guide to effective shippingand port management. London/Philadelphia: Kogan Page.
Stock, J. R., & Lambert, D. M. (2000). Strategic logistics management. New York: McGraw-Hill.
Vahrenkamp, R. (2005). Logistik: Management und Strategien, 5., vollstandig uberarbeitete und
erweiterte Edition, Munchen: Oldenbourg Verlag.
52 4 Logistical Infrastructure

Transport Systems and Logistics Services 5
Learning Objectives
Transport services and logistics services are an integral part of logistics systems.
This chapter aims to give an overview of the existing means of transport, the
modes of transport and their services, the role that logistics service providers
take, and the development they have undergone. In this way, we will equip the
reader with a basic understanding of the concepts and service products within the
transport and logistics service economy in order to utilize them for the various
forms of co-operation.
Keywords
¢ Transport development
¢ Modes of transport and transport services
¢ Categories of modes of transport
¢ Transport networks
¢ Transport chains
¢ Transport technology
¢ Freight carriers and forwarders
¢ CEP service providers and integrators
¢ Contract logistics
H. Gleissner and J.C. Femerling, Logistics, Springer Texts in Business and Economics,
DOI 10.1007/978-3-319-01769-3_5, # Springer International Publishing Switzerland 2013
53
5.1 Transport Basics
A transport system comprises the elements of the goods transported (transport
object), the means of transport used (mode of transport, traffic routes), and the
transport process as an organized transport sequence (transport chain). The process
of service provision results in transport services being carried out. Transport
services cause movements of people or goods. We can distinguish between internal
and external transport services. Internal transport services, for instance, occur
within a plant among different departments of a warehouse. External transport
services take place between suppliers and customers or between plants and
warehouses. Transport processes carried out without actual goods being transported
are referred to as empty transport. The criteria for a transport service are a providing
location, a destination, and the goods transported. Goods are generally not
manipulated during the transport process, i.e., merely the technical process of
changing location takes place. The transport service performance is measured in
tonne kilometers (tkm).
Companies may use their own vehicles to carry out transport services. This is
referred to as private haulage. There has been a tendency, however, towards
logistics service providers being commissioned with the transport. The means of
transport used for this include air, rail transport, road, and water; all of which are
also termed modes of transport. The vehicles employed in these modes of transport
are trucks, railway carriages, as well as inland and ocean vessels. The totality of
both means and modes of transport is the pipeline network.
Transport service is a basic element of logistics services. These services com-
prise all relevant interdependencies between production, transfer, and consumption
and are integrated into the value chains of senders and receivers. Apart from the
transport component, logistics services also include the subservices of
transshipment, storage, sorting services, and auxiliary services. Transshipment
consists of the loading and unloading of vehicles. Storage serves to modify the
temporal properties of goods and to bridge time. Sorting services, such as sorting
and sorting out, alter the quantitative and categorical composition of goods. Auxil-
iary services include services such as packing, insuring, customs clearance, as well
as less significant manipulations of goods and quality checks.
Production and cross-border consumption processes based on the fragmented
work flow, and thus the mobility of goods, only become possible through transport,
traffic, and logistics services in conjunction. The degree of the mobility of goods on
a national level and cross-border transports are directly linked to the intensity of the
exchange processes and to the level at which division of labor is implemented.
5.2 Significance and Development
The development of the transport and logistics sector largely depends both on the
economic development, conveyed in terms of economic growth, and on the further
development of the logistic structures and processes within the value adding
54 5 Transport Systems and Logistics Services
systems of the sectors of industry, trade, and service. These can be assessed by
looking at the supply chain strategies of companies.
One of the main strategies is decreasing the vertical range of manufacture, i.e.,
the outsourcing of value-adding steps to suppliers and service providers. This
strategy continues to become more popular, which results in a significant increase
in the Europe-wide and world-wide flows of goods between companies. The
increasing division of labour leads to more freight traffic (measured in tons) and
larger transport volumes (measured in tons per kilometer). Both of these parameters
are experiencing a growth which is disproportionate to the growth of production
(GDP). This development is referred to as volume of goods effect. It conceptualizesa decrease in the share of typical bulk goods transported while the share of high-
quality general cargo transported increases due to changed procurement and pro-
duction strategies. An example of such strategies would be the modularization of
products and the procurement of these modules (modular Sourcing), thereby
increasing the value of the goods at each delivery stage. This development is termed
goods structure effect.Apart from an increase in the division of labor and growing site diversification,
logistic processes are undergoing changes, especially in the transport sector. This is
initiated by modern logistic concepts, including, for instance, the concepts of Just-
In-Time (JIT), Efficient Consumer Response (ECR) or Vendor Managed Inventory
(VMI) (see Chap. 7). These concepts require high-quality transport services,
increased adherence to delivery dates, and speedy transport of small transport
lots, i.e., the transport of small shipment sizes with high transport frequency.
Effects resulting from this are sometimes referred to as logistics effect.The so-called integration effect is brought about by opening up the national
markets through free trade areas and WTO treaties in conjunction with an expan-
sion of market and procurement areas, and by establishing world-wide production
networks. Increased globalization amplifies these effects. Correspondingly, Global
Sourcing, Global Production, and Global Distribution are strategies that are very
common among companies. A striking indicator of globalization is, for example,
the increased share of container cargo in maritime traffic (see Sect. 4.2.3).
An increase in freight traffic can be observed as a result of the ongoing
Europeanization which was essentially fuelled by the creation of a single European
market from the 1990s onwards. Additionally, we are seeing changes in distribution
structures which are characterized by setting up European central warehouses –
primarily in the Benelux countries. Furthermore, a tendency towards relocating pro-
duction facilities to Central and Eastern European countries, such as the Czech
Republic, Poland, andHungary, has become apparent and individual production stages
are increasingly relocated to different countries. In the next few years, these
developments will contribute to a significant intensification of cross-border traffic
between the EU and accession countries and the bordering countries in Eastern and
South Eastern Europe.
All of the aforementioned trends have varying ramifications for transport and
logistics service providers, which will be analyzed in the following.
5.2 Significance and Development 55
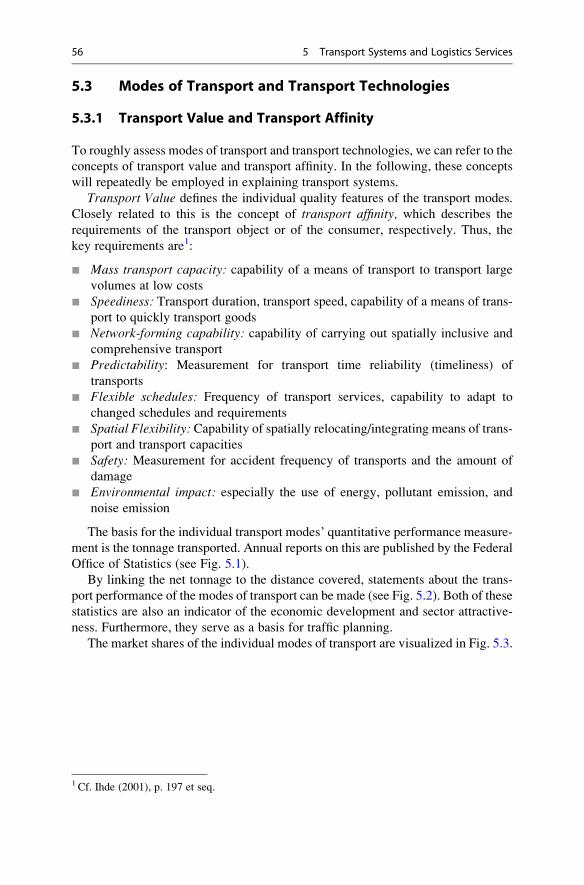
5.3 Modes of Transport and Transport Technologies
5.3.1 Transport Value and Transport Affinity
To roughly assess modes of transport and transport technologies, we can refer to the
concepts of transport value and transport affinity. In the following, these concepts
will repeatedly be employed in explaining transport systems.
Transport Value defines the individual quality features of the transport modes.
Closely related to this is the concept of transport affinity, which describes the
requirements of the transport object or of the consumer, respectively. Thus, the
key requirements are1:
¢ Mass transport capacity: capability of a means of transport to transport large
volumes at low costs
¢ Speediness: Transport duration, transport speed, capability of a means of trans-
port to quickly transport goods
¢ Network-forming capability: capability of carrying out spatially inclusive and
comprehensive transport
¢ Predictability: Measurement for transport time reliability (timeliness) of
transports
¢ Flexible schedules: Frequency of transport services, capability to adapt to
changed schedules and requirements
¢ Spatial Flexibility: Capability of spatially relocating/integrating means of trans-
port and transport capacities
¢ Safety: Measurement for accident frequency of transports and the amount of
damage
¢ Environmental impact: especially the use of energy, pollutant emission, and
noise emission
The basis for the individual transport modes’ quantitative performance measure-
ment is the tonnage transported. Annual reports on this are published by the Federal
Office of Statistics (see Fig. 5.1).
By linking the net tonnage to the distance covered, statements about the trans-
port performance of the modes of transport can be made (see Fig. 5.2). Both of these
statistics are also an indicator of the economic development and sector attractive-
ness. Furthermore, they serve as a basis for traffic planning.
The market shares of the individual modes of transport are visualized in Fig. 5.3.
1 Cf. Ihde (2001), p. 197 et seq.
56 5 Transport Systems and Logistics Services
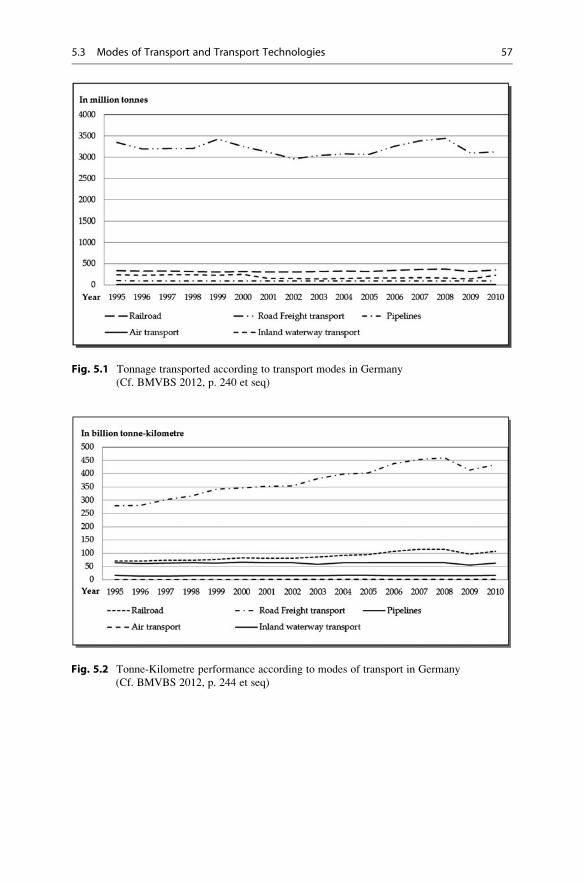
Fig. 5.2 Tonne-Kilometre performance according to modes of transport in Germany
(Cf. BMVBS 2012, p. 244 et seq)
Fig. 5.1 Tonnage transported according to transport modes in Germany
(Cf. BMVBS 2012, p. 240 et seq)
5.3 Modes of Transport and Transport Technologies 57

5.3.2 Road Freight Transport
Road freight transport is the most important mode of transport. With about
650,000 km of motor traffic roads, it constitutes the densest road network in the
EU (see Sect. 4.2.1) and is therefore unrivalled for spatially inclusive and compre-
hensive logistic services. Road freight transport can be conceptualized by the
characteristics listed in Table 5.1. Road traffic is highly controversial. For one
thing, this is because of its environmental pollution through energy consumption,
exhaust emission, noise generation, and traffic congestion. For another thing, state
subsidies for traffic routes and the ongoing competitive distortion within Europe
(despite liberalization) due to varying factor costs in the individual states (personnel,
taxes, duties etc.) are cause for debate.
The most important distinguishing characteristics of road freight transport are
shown in Fig. 5.4.
Commercial road transport is the transport of goods by means of motor vehicles
in a business context or in return for payment. Private haulage, however, is transportcarried out by industrial companies or commercial enterprises using their own
vehicles. The distinction between short-distance and long-distance traffic harks
back to the time when the governmental regulation of the transport market system
will a significant impact on the supply and the market outcomes of road freight
traffic. Capacity restrictions by granting concessions and tariff commitments to
regulate pricing were supposed to increase or at least stabilize the train‘s market
share compared to the truck’s market share, which eventually yielded no success.
Additionally, national companies were to be protected against foreign competition
by means of restrictive cabotage regulations. Cabotage is a foreign carrier’s permis-
sion to perform transports in a specific country, so long as they begin and end in the
Fig. 5.3 Tonne-kilometer performance according to market share in 2011 in Germany
(Cf. BMVBS 2012, p. 247; Bundesnetzagentur 2011, p. 19)
58 5 Transport Systems and Logistics Services

same country. Following the realization of free movement of services within the EU,
the 1990s saw extensive deregulatory measures in the transport market, which
resulted in free formation of prices and the abolishment of capacity restrictions.
Fig. 5.4 Distinguishing characteristics of road freight transport
Table 5.1 Important characteristics of road freight transport
Characteristics of Road Freight Transport
Good network-forming possibilites (i.e.. a good linkage between the primary elements of the traffic system is possible)
Speediness in conjunction with a relatively low transport risk (Direct delivery in door-to-door transport, transshipment and/or intermediate charging are only conditionally necessary or not nec-essary at all)
Rational utilization of the network (normally via groupage, delivery traffic and feeder traffic)
Utilization of vehicles specific to the volume of goods (silo truck and dump truck, refrigerated transport, tank transport, luggage transport, container transport, semi-trailer truck, high-capacity transport, heavy-load transport etc.)
Cost optimization and environmental-impact optimization by means of the piggy-back system with railway
In long-haul transport abroad, road freight transport is o�en used for the first and the last transport stages, e. g. pre-transport from sender to the sea-going vessel (sender) and onward transport from port of discharge to the buyer on the target market
Relatively short standstill periods and latency
High flexibility (with regard to acceptance dates, delivery deadlines, dates for transport and possi-bilities for new dispositions of goods and transport modes)
Complex competitive relationships (both within road freight transport and with other modes of transport)
5.3 Modes of Transport and Transport Technologies 59

High adaptability to the manifold and changing tasks of senders who service vast
areas has made road freight transport the mode of transport which is most suitable to
perform logistics services. In short-distance transport and long-distance transport
up to 400 km, trucks are markedly faster than trains, both nationally and interna-
tionally. This is especially true for direct door-to-door transport relations.
Medium-sized service providers continue to be prevalent in road transport. Due
to this, the transport services sector is having difficulties meeting the increasing
requirements of senders. Individual carriers can only rarely service areas compre-
hensively, which is why they mainly work as subcontractors for major forwarders
or co-operate with other providers.
5.3.3 Rail Freight Transport
The development of the railroad was essential for the industrialization and the
establishment of raw-material-intensive base industries. In this respect, the
advantages of rail transport in the form of scale advantages came into their own
for bulk transports and long-range transports.
After the shift towards post-industrial economic structures, the railroad now has
to meet different demands. The volume-of-goods effect, the goods-structure effect,and the logistics effect are increasingly changing the economic requirements com-
pared to the traditional requirements the railroad had to fulfill. In addition, railroad
transport has lost its erstwhile monopoly position on traditional mass-transport
markets to inland vessel transport, pipeline transport, and road freight transport.
However, with rising environmental awareness and more bottlenecks in the road
network, the railroad system is currently experiencing a comeback. This is supported
by a trend towards containerization, which greatly enhances the possibilities of
multi-modal traffic. An example of this would be the Hinterland traffic of sea
ports. Furthermore, privatization has invited the development of innovative service
offers, such as the Railport concept for cargo traffic suited to rail transport (see case
study 4.1). Railports are simple and flexible transshipment points for general cargo,
containers, bulk goods etc. between trucks and trains. A comprehensive network
allows for main-run transports largely to be carried out by train, while pre-transports
and onward transports are conducted by truck.
Table 5.2 summarizes logistically relevant and system-specific characteristics of
the railroad in the context of freight traffic.
Figure 5.5 gives an overview of providers of rail freight transport services.
The efforts that have been made to privatize the so far dominant national
railroads in Europe brought with them considerable changes for the rail freight
transport market. These changes are part of a long-lasting process, since railroad
transports have their legal basis in the German constitutional law and are therefore
guaranteed. The privatization process of Deutsche Bahn AG and their efforts
towards improving their capabilities of market cultivation have made great prog-
ress. A structural layout of Deutsche Bahn AG – Germany’s main service provider
of railroad transport – is depicted in Fig. 5.6.
60 5 Transport Systems and Logistics Services
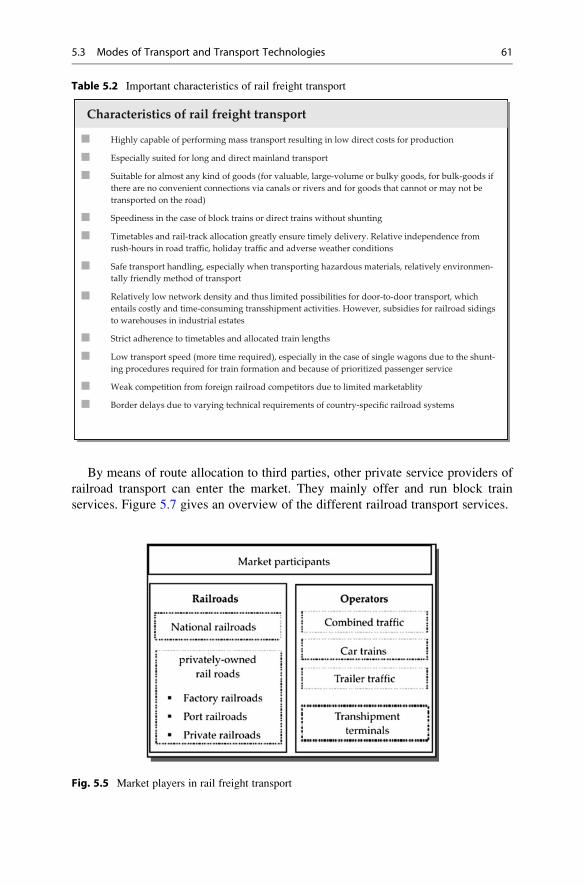
By means of route allocation to third parties, other private service providers of
railroad transport can enter the market. They mainly offer and run block train
services. Figure 5.7 gives an overview of the different railroad transport services.
Table 5.2 Important characteristics of rail freight transport
83
Characteristics of rail freight transport
Highly capable of performing mass transport resulting in low direct costs for production
Especially suited for long and direct mainland transport
Suitable for almost any kind of goods (for valuable, large-volume or bulky goods, for bulk-goods if there are no convenient connections via canals or rivers and for goods that cannot or may not be transported on the road)
Speediness in the case of block trains or direct trains without shunting
Timetables and rail-track allocation greatly ensure timely delivery. Relative independence from rush-hours in road traffic, holiday traffic and adverse weather conditions
Safe transport handling, especially when transporting hazardous materials, relatively environmen-tally friendly method of transport
Relatively low network density and thus limited possibilities for door-to-door transport, which entails costly and time-consuming transshipment activities. However, subsidies for railroad sidings to warehouses in industrial estates
Strict adherence to timetables and allocated train lengths
Low transport speed (more time required), especially in the case of single wagons due to the shunt-ing procedures required for train formation and because of prioritized passenger service
Weak competition from foreign railroad competitors due to limited marketablity
Border delays due to varying technical requirements of country-specific railroad systems
Fig. 5.5 Market players in rail freight transport
5.3 Modes of Transport and Transport Technologies 61
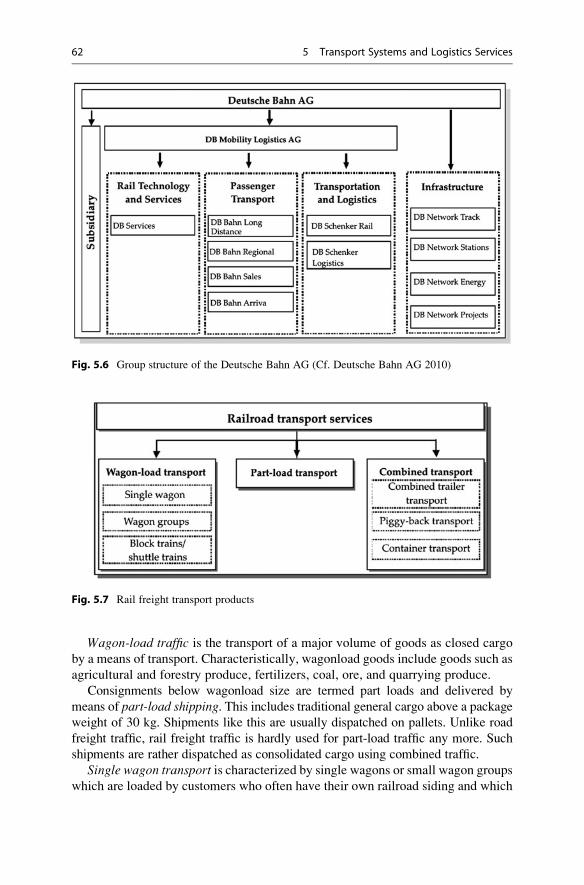
Wagon-load traffic is the transport of a major volume of goods as closed cargo
by a means of transport. Characteristically, wagonload goods include goods such as
agricultural and forestry produce, fertilizers, coal, ore, and quarrying produce.
Consignments below wagonload size are termed part loads and delivered by
means of part-load shipping. This includes traditional general cargo above a packageweight of 30 kg. Shipments like this are usually dispatched on pallets. Unlike road
freight traffic, rail freight traffic is hardly used for part-load traffic any more. Such
shipments are rather dispatched as consolidated cargo using combined traffic.
Single wagon transport is characterized by single wagons or small wagon groups
which are loaded by customers who often have their own railroad siding and which
Fig. 5.7 Rail freight transport products
Fig. 5.6 Group structure of the Deutsche Bahn AG (Cf. Deutsche Bahn AG 2010)
62 5 Transport Systems and Logistics Services
the railroad service provider then transports to the destination station. Effective
train formation can be achieved by grouping together several customers’ wagons
with the same destination. Today there are flexible service offers that allow for
single wagon transports to be freely commissioned on an international level with
regard to time, volume, and relation. As a part of these services, 1,400 freight traffic
locations and 4,000 private rail track sidings are being operated. Freight traffic
locations are goods stations, public loading stations, or border crossings. Amongst
other things, they serve as a basis for tariff kilometer calculations within the
German rail network.
Block train traffic enables the transport of a customer’s high volume of goods
from sender to receiver in complete trains without en-route handling. This kind of
transport is usually employed for price-sensitive bulk goods and breakbulk cargo
which do not require speedy transport or different wagon types, e.g., raw materials
and products of the mining or mineral oil industry and building materials.
Block train traffic in the form of shuttle trains or direct trains are high-quality
services for linking production sites as well as for procurement logistics and
distribution logistics. This type of transport services are customized by means of
individual timetables and thus guarantee on-schedule delivery. Shuttle trains pro-
vide point-to-point connections with fixed sets of wagons and without further
addition of wagons during transport.
Besides its product range of bulk train services (flextrain, variotrain andplantrain), DB Schenker has developed industry-specific concepts catering to the
needs of, for example, the paper industry, the chemical industry, the waste manage-
ment industry, and the mineral oil industry.
Carriers provide combined cargo services, which come in the form of bulk trains
or groups of wagons. Here, different carrier wagons are employed for containers,
swap bodies and trailers. Combined cargo has the benefits of speediness by taking
advantage of favorable traffic conditions at night. Furthermore, loading and dis-
charge take place at the production site or at the warehouse and containers may
serve as intermediate or buffer storage facilities.
Combined transport is utilized if trucks, trailers, and swap-bodies are to be
transported using piggy-back transport. In Germany, the handling process for this
is implemented by the company Kombiverkehr Deutsche Gesellschaft furkombinierten Guterverkehr GmbH & Co. KG. Currently, there are 230 limited
partners holding stakes in Kombiverkehr, of which 50 % are held by forwarders
and carriers and another 50 % by Deutsche Bahn AG.Kombiverkehr operates over 50 transshipment terminals. Their services include
the Kombi-Netz 2000+ service, which is a system of 26 trains that service
60 relations on weekdays and the Albatross Express service of the freight forwarderTransfracht, which connects the ports in Hamburg and Bremen to 18 Hinterland
terminals using nightly container trains.
The future market potential of rail freight services is largely dependent on the
continued development of logistically relevant services and of the capacities to
implement them. Constructing exclusive cargo routes and separating passenger
transport and cargo transport will be an essential prerequisite for this. Not only
should this happen on a national level, but also on an international, cross-border
5.3 Modes of Transport and Transport Technologies 63
level, which calls for extensive deregulation in the EU-wide railroad sector. Fur-
thermore, infrastructural, operational, and vehicle-related technical impediments
need to be disposed of to enhance inter-operability.
Case Study 5.1: Railroad Usage in Industrial Logistics
BASF SE (The Chemical Company) is one of the world’s leading chemical
companies. Its subsidiary BASF Schwarzheide favors rail transport for the
transport of their goods. The company’s site in Lausitz produces a wide range
of plastics, foam rubber, pesticides, and waterborne coatings. PU dispersions and
Laromer® brands (coating raw materials) complement their portfolio. Feed-
stock, packaging, operating supplies, and technical goods are needed for the
production process. The means of transport eligible for receiving and sending
goods are tank wagons, covered freight wagons, road tank vehicles, trucks,
various containers, and utility vans.
The development of economical, reliable, and environmentally-friendly
transport concepts and their target-oriented implementation, as well as regular
monitoring makes the site logistically attractive, even without direct connection
to waterways. For the own transport volume and for other companies based on
the same premises, BASF Schwarzheide GmbH uses an EU-wide block train
railroad network provided by private railroad companies. This network connects
BASF sites in Ludwigshafen, Antwerp, and Schwarzheide on a daily basis. The
liberalization of the European rail freight traffic has allowed for competition to
develop withDeutsche Bahn AG for these relations. This was the prerequisite for
cost-effective rail freight traffic.
An international forwarder operates a public container terminal on the com-
pany premises in Schwarzheide (see Sect. 4.2.5). The terminal is being expanded
to a hub for Eastern Europe with connections to Poland, Ukraine, and Russia.
Plans to extend the connections to China are underway. The container terminal
in Schwarzheide is connected to the German combi-terminal network, thus
maintaining strong connections to Ludwigshafen and the whole of Europe.
Various providers of combined transport services design and develop these
networks in co-operation with partners and organize transports with different
carriers.
A good railroad infrastructure and integration into the European block train
and container network enable economical and high-quality rail transports. This
provides immense potential for a shift from road transports to railroad transports.
Customers, suppliers, the producer, and various service providers are included in
the development of logistics concepts and transport concepts.
The transport system implemented at BASF Schwarzheide shows that cargo
transport can purposefully be operated by rail (see Fig. 5.8). The transport shares
in 2009 are:
Total traffic volume 100 % 1.8 million t
By rail 65 % 1.2 million t
By road 35 % 0.6 million t
In the future, the share of rail freight traffic is planned to be further increased
at BASF Schwarzheide GmbH.
64 5 Transport Systems and Logistics Services
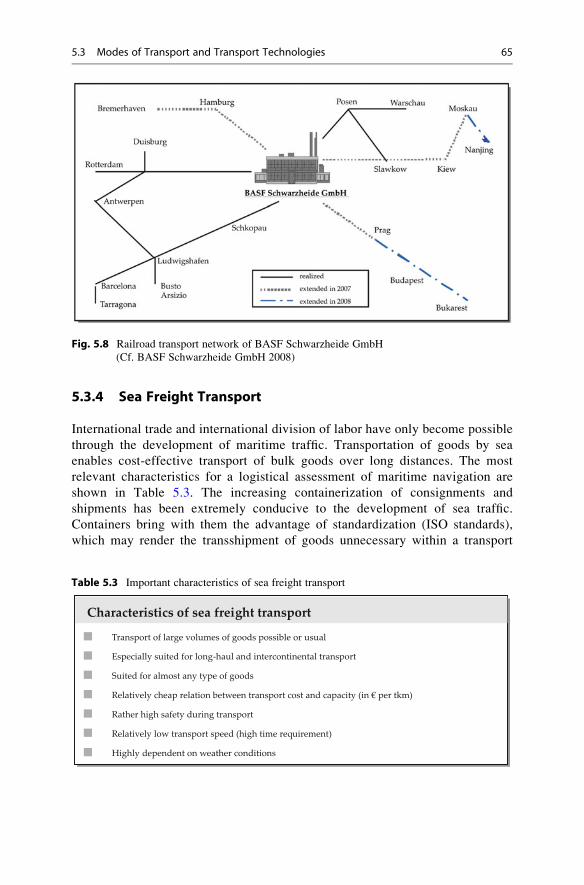
5.3.4 Sea Freight Transport
International trade and international division of labor have only become possible
through the development of maritime traffic. Transportation of goods by sea
enables cost-effective transport of bulk goods over long distances. The most
relevant characteristics for a logistical assessment of maritime navigation are
shown in Table 5.3. The increasing containerization of consignments and
shipments has been extremely conducive to the development of sea traffic.
Containers bring with them the advantage of standardization (ISO standards),
which may render the transshipment of goods unnecessary within a transport
Fig. 5.8 Railroad transport network of BASF Schwarzheide GmbH
(Cf. BASF Schwarzheide GmbH 2008)
Table 5.3 Important characteristics of sea freight transport
Characteristics of sea freight transport
Transport of large volumes of goods possible or usual
Especially suited for long-haul and intercontinental transport
Suited for almost any type of goods
Relatively cheap relation between transport cost and capacity (in € per tkm)
Rather high safety during transport
Relatively low transport speed (high time requirement)
Highly dependent on weather conditions
5.3 Modes of Transport and Transport Technologies 65

system and which makes it possible to change from one transport mode to another
within a short period of time.
Thus, container shipping assumes a central role in maritime traffic and has
greatly influenced the relevant transport and handling technologies as well as
shipbuilding developments and ship sizes. High-performance container gantry
cranes with handling capacities of over 55 containers per hour make it possible to
load and discharge even the largest container ships within 1 or 2 days.2 Quick
discharge makes short laytime at the port possible. This reduces laytime charges in
ports, enables speedy implementation of transport, and reduces the round-trip time
of containers.
On the other hand, the development of goods volumes and ship sizes signifi-
cantly influences the sea traffic and sea port infrastructures, leading to fewer ports in
a specific area being navigable for large container ships (Main Ports) and to feeder
services having to supply the main ports with consignments from smaller ports and
Hinterland ports. Feeder services are small container ships capable of navigating
canals and commuting between the large international container ports, smaller
seaports, and inland ports accessible to coasters.
Some of the port infrastructure determinants are:
¢ Width and depth of fairway
¢ Wharfage, open space, and storage area
¢ Handling facilities, container gantry cranes
¢ Information and communication systems
Of major importance, alongside the infrastructure, is the port location.
The following basic location factors of sea ports can be identified3:
¢ Seafront location: geographical location in relation to the main open sea traffic
routes. Thus, for incoming ships via the English Channel the Antwerp-
Rotterdam-Amsterdam range (ARA) is at a temporal advantage of about
1 day compared to the German North Sea ports.
¢ Coast location: proximity to open fairway. Thus, the ports of Bremen and
Hamburg are at a distance of up to 100 km from the open sea.
¢ Hinterland location: economic area which operates its sea traffic via that
specific port with varying expansion and depending on type of goods and
transport modes. An example of this is the so called Rheinschiene, the route
alongside the river Rhine.
Due to the large volume of exports, the ports with the world’s greatest handling
tonnage are located in Asia. The reception ports of Europe and North America are
found among the lower ranks (see Table 5.4).
2 Cf. Vis/Harika (2005), p. 58.3 Cf. Ihde (1991), p. 99 et seq.; Brinkmann (2005), p. 5 et seq.
66 5 Transport Systems and Logistics Services
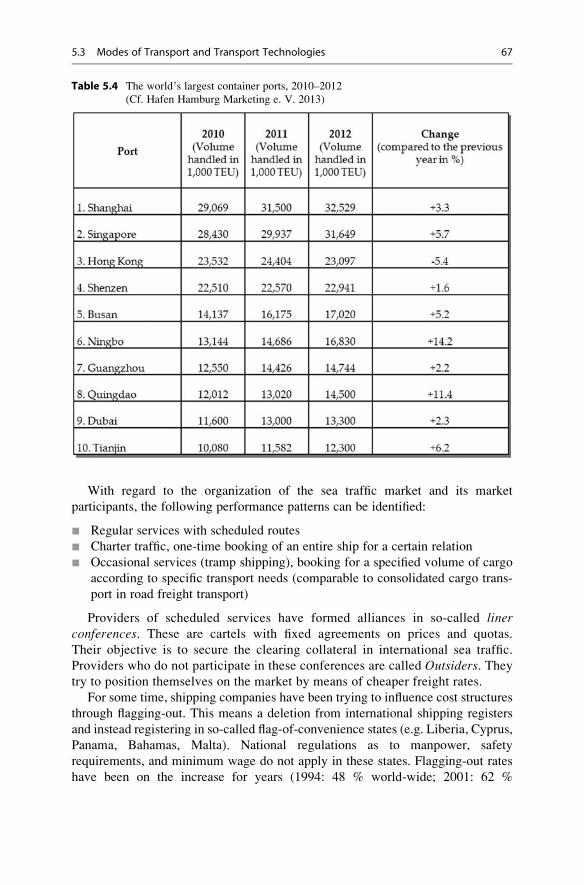
With regard to the organization of the sea traffic market and its market
participants, the following performance patterns can be identified:
¢ Regular services with scheduled routes
¢ Charter traffic, one-time booking of an entire ship for a certain relation
¢ Occasional services (tramp shipping), booking for a specified volume of cargo
according to specific transport needs (comparable to consolidated cargo trans-
port in road freight transport)
Providers of scheduled services have formed alliances in so-called linerconferences. These are cartels with fixed agreements on prices and quotas.
Their objective is to secure the clearing collateral in international sea traffic.
Providers who do not participate in these conferences are called Outsiders. Theytry to position themselves on the market by means of cheaper freight rates.
For some time, shipping companies have been trying to influence cost structures
through flagging-out. This means a deletion from international shipping registers
and instead registering in so-called flag-of-convenience states (e.g. Liberia, Cyprus,
Panama, Bahamas, Malta). National regulations as to manpower, safety
requirements, and minimum wage do not apply in these states. Flagging-out rates
have been on the increase for years (1994: 48 % world-wide; 2001: 62 %
Table 5.4 The world’s largest container ports, 2010–2012
(Cf. Hafen Hamburg Marketing e. V. 2013)
5.3 Modes of Transport and Transport Technologies 67
world-wide).4 Second registers and plans to introduce a European maritime
shipping register are supposed to put a check on these developments.
The traditional procedure of overseas container transport can be described
through the process chains of Carrier’s Haulage and Merchant’s Haulage.5 With
Carrier’s Haulage, sea shipping companies offer door-to-door container freight
transport. The sea shipping company takes the empty container to the sender’s
ramp, organizes pre-carriage of the container to the sea port, provides ship trans-
port, organizes on-carriage to the receiver, and collects the discharged container. It
assumes liability for the entire transport process and commissions other carriers
with the forwarding of the goods. The carrier issues bills of lading, which are
bankable documents of title confirming the rights to the goods transported and
containing detailed liability regulations.
In the case ofMerchant’s Haulage, the sender instructs their forwarder to carry outtransport. The forwarder orders a container from a sea shipping company and organizes
the pre-carriage. The sea shipping company is responsible for the transport at sea. A
corresponding forwarder receives the container from the sea shipping company at the
port of destination and takes out customs clearance and transport in the country of
destination. The container is returned to the sea shipping company after discharge.
Apart from sea shipping companies there are Non-Vessel-Operating CommonCarriers (NVOCC). A NVOCC provides overseas transport and operates in a
fashion similar to that of a sea shipping company. The only difference is that a
NVOCC does not operate its own vessels and in most cases does not rely on its own
containers. Freight capacity is chartered from sea shipping companies at their
transport relation (also referred to as slot charter). Subsequently, the NVOCC offers
these freight capacities to its customers on the market. The NVOCC is entitled to
issue the necessary freight documents (bill of lading). In many cases it also operates
its own offices both at the places of dispatch and destination or works with partners
that organize dispatch (pre-carriage) and delivery (on-carriage) of the containers.
This guarantees one-stop freight service for the sender.
Case Study 5.2: Container Transport
FCLMARINE AGENCIES GmbH in Bremen is a Non Vessel Operation Carrier
(NVOCC) and conducts world-wide container transports. One of their transport
operations involved the shipment of 24 off-road racing vehicles to the USA for
testing purposes. The value of the vehicles ranged from 175,000 to 250,000
Euros per vehicle. They were loaded into containers in Stuttgart and sub-
sequently shipped to Houston, Texas. Customs clearance for temporary import
was taken out by a partner in Houston. The vehicles underwent test drives in the
Arizona desert and through the Southern US states (New Mexico, Texas,
Louisiana, Mississippi, and Alabama). After 4 weeks the client ordered the
containers to be brought to Tuscaloosa, Alabama for return transport. Loading
4Cf. Aberle (2009), p. 268.5 Cf. Ihde (2001), p. 143 et seq.
68 5 Transport Systems and Logistics Services
the containers out of town so that the vehicles would arrive in Germany in good
condition was especially challenging. Following this, the containers were
transported to the sea port by truck and subsequently shipped to Germany. The
import formalities had then to be taken care of in Bremerhaven and on-carriage
to the final destination needed to be arranged. Each step in this high-value
transport process was coordinated by FCL who were also the point of contact
for the client at the same time.
5.3.5 Inland Waterway Transport
The most important forms of inland waterway transport are bulk goods waterway
transport, general cargo waterway transport, and river and maritime navigation.
Bulk goods waterway transport mainly involves the transportation of raw
materials and primary products in solid and liquid form. The development of
tugboats brought about increased flexibility in the loading and discharging process
and in the organization of routes since the transport units (lighters) are decoupled
from the motorized push units.
General cargo waterway transport is primarily used for finished goods from the
automobile, engineering, and construction sector. Roll-on-roll-off transports are
ferry services allowing new vehicles or trucks to drive on and off the vessel, which
greatly facilitates handling.
In river and maritime navigation there is an overlap between inland shipping – i.e.transport carried out exclusively on rivers and canals – and sea traffic. Owing to their
size, vessels used in river and maritime navigation are capable of navigating both at
sea (along coastlines) and on large, developed inland waterways (e.g. on the Rhine
river up to Duisburg). Thus, by using appropriate navigable units and coastal motor
vessels, additional shipping connections may be established, such as short-seashipping (see Sect. 4.2.1).
Further distinctions can be drawn according to product groups transported in
inland waterway transport (see Fig. 5.9).
As is the case in sea freight transport, container traffic is becomingmore and more
important for inlandwaterway transport. The increase in turnover by 2015 is estimated
to be 10 % p.a. Accordingly, the significance of inland ports and handling facilities in
the Hinterland for groupage in pre-carriage and on-carriage is on the rise. To create
high-performance transport chains and to support multimodal traffic, there is increas-
ing demand for multimodal (road/rail) and trimodal (road/rail/inland waterway) port
facilities. Moreover, inland ports are increasingly being converted into logisticsservice centers (see Sect. 4.2.6), where procurement-logistical and distribution-
logistical services are offered by logistics service providers alongside purely port-
logistical services. These developments are largely determined by the characteristics
of inland waterway transport, which can be summarized as follows (see Table 5.5).
The supply structure of inland waterway transport market in Germany is essen-
tially dominated by few shipping companies, such as Imperial, Rhenus Partnership,
Haeger&Schmidt, Lehnkering and the Deutsche Binnenreederei, which in most
cases have emerged from formerly company-owned shippers. Some larger shipping
5.3 Modes of Transport and Transport Technologies 69

companies, as well as many small independent owner operators (private shippers
with up to three boats) complement this supply structure. Charterers do not own
their own shipping space but merely organize ship transports on behalf of senders.
They could be called forwarders for inland waterway transport. The role of shipping
companies has changed significantly. While traditionally their responsibilities
included the organization of shipping space, the provision of freight, and the
disposition and implementation of transport, they primarily only assume the role
of shippers nowadays.
The future development of inland waterway transport mainly depends on
whether freight traffic forecasts will hold true and on the influence they will have
on the modal split. By now, the modal split – i.e. the share that the different modes
of transport have in the total volume of transport – is largely determined by the
transport mode’s capacities and its ecological relevance. Inland waterway transport
enjoys a competitive advantage in this regard.
Fig. 5.9 Most important forms of inland waterway transport
70 5 Transport Systems and Logistics Services

Improvements need to be made with regard to consistent navigability by means
of expanding inland waterways and upgrading locks (see Fig. 5.10 and Sect. 4.2.1).
The purchase of more efficient inland vessels would bring about a general effi-
ciency enhancement and thus increased competitiveness.
Analogously to the situation in rail freight transport, it will be crucial for inland
waterway transport to adapt its range of services to market requirements and thus
render it attractive for shippers. The rail’s competitive behavior will continue to
have an influence on inland waterway transport as well as on the persisting
competitive gaps between Western European countries (esp. between Germany,
Belgium, and the Netherlands).
Case Study 5.3: Service Offers in Inland Waterway Transport: Vehicle
Transport
Apart from the transportation of bulk goods, inland waterway transport may also
serve to transport high-value goods such as brand-new passenger cars. Ever
since the development of an innovative logistical solution by the charterer E.H.Harms-Terminal Kelheim GmbH & Co. KG, cars of Mitsubishi, Ford, andRenault have been transported on the Danube from Kelheim or Vienna to
Budapest.
Suzuki cars are transported from Budapest to Kelheim on the return trip. Thus,
empty trips can be avoided and the cost efficiency of the transporting vessel can
be increased. The vessels run on a non-regular schedule according to peak
seasons over the year. Trips can also be scheduled or cancelled on short notice
in order to react to sector-specific fluctuations in demand in a prompt and flexible
manner. This liner service is carried out by the small-scale German shipping
company Trodel and by Lehnkering GmbH. The waterway motor vessel
Heilbronn is used for the service. The vessel is furnished with three decks
with grid floors designed for vehicles up to 2,000 kg each. The Heilbronn has
a capacity of 205–270 vehicles, depending on vehicle type. The handling of the
Table 5.5 Most important characteristics of inland waterway transport
Characteristics of Inland Waterway Transport
High mass-transport capacity (low costs at large goods volumes and large distances)
24hr service due to radar navigation
Free capacities on waterways
High reliability and transport safety (also for hazardous goods)
Environmentally friendly (low energy consumption per transport unit)
Low network density
Low transport speed
Dependent on weather conditions (high/low water levels, icing)
5.3 Modes of Transport and Transport Technologies 71

Fig. 5.10 Network of North European inland waterways (Deutsche Binnenreederei 2007)
72 5 Transport Systems and Logistics Services
cars is facilitated by means of a bow ramp which connects to the concrete RoRo
ramp of the port.6
Case Study 5.4: Service Offers in Inland Waterway Transport: Transport
of Large-Dimension Goods
The Deutsche Binnenreederei AG in Berlin transports rotor blades and equipment
for the wind power station manufacturer ENERCON GmbH in Aurich. The rotor
blades for the wind power stations are produced in Magdeburg. Using 480 km of
inland waterway routes, the rotor blades are then shipped to Emden by means of a
liner service, where they are loaded onto overseas vessels. Using a special, double-
layered transport rack, six rotor blades can be transported per push-barge. From
Magdeburg to Bergeshovede (Dortmund-Ems-canal), two push barges can be
coupled together for transport. The barges, however, need to be de-coupled in
Bergeshovede to carry on transport individually due to the underdeveloped state of
the waterway route. Furthermore, additional ballasting of the barges with water is
necessary at the lock in Sulfeld (Mittelland Canal), due to a clearance height of
4.20 m between the water surface and the bottom edge of the bridge.
The barges therefore need to be double-hull vessels. To lower the vessel, the
space between the hulls is filledwithwater,which is subsequently pumped out again.
5.3.6 Air Freight Transport
Air freight transport is becoming more and more important. For one thing, this is
due to the creation of global and intercontinental logistics chains with decentralized
structures of production and distribution. For another thing, more and more high-
value products from the engineering sector (machine parts), the electrotechnical
sector (PCs) and the automobile sector (modules, spare parts) are being transported
by air freight.
The characteristics of air freight transport are summarized in Table 5.6.
Air freight services fall into the organizationally and institutionally separate
partial performances of:
¢ Air transport services, rendered by airlines
¢ Air traffic control systems, provided by the air traffic control authorities
¢ Airport services, provided by the airport.
The supply of air transport services is essentially determined by the market and
production conditions in air traffic. These conditions are characterized by oligopo-
listic competition with market access restrictions, national regulations and traffic
laws, high capital intensity, and adherence to flight safety requirements.
Air traffic distinguishes between two institutions, namely the ICAO (Interna-
tional Civil Aviation Organization), which includes all countries operating air
traffic, and the IATA (International Air Transport Association), which organizes
6 Osterreichische Wasserstraßen-Gesellschaft mbH (2007), p. 27.
5.3 Modes of Transport and Transport Technologies 73
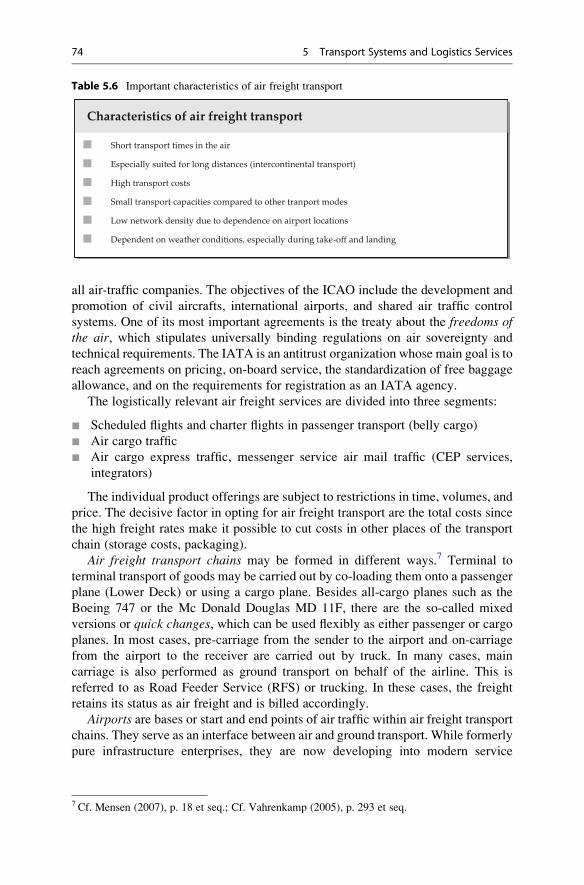
all air-traffic companies. The objectives of the ICAO include the development and
promotion of civil aircrafts, international airports, and shared air traffic control
systems. One of its most important agreements is the treaty about the freedoms ofthe air, which stipulates universally binding regulations on air sovereignty and
technical requirements. The IATA is an antitrust organization whose main goal is to
reach agreements on pricing, on-board service, the standardization of free baggage
allowance, and on the requirements for registration as an IATA agency.
The logistically relevant air freight services are divided into three segments:
¢ Scheduled flights and charter flights in passenger transport (belly cargo)
¢ Air cargo traffic
¢ Air cargo express traffic, messenger service air mail traffic (CEP services,
integrators)
The individual product offerings are subject to restrictions in time, volumes, and
price. The decisive factor in opting for air freight transport are the total costs since
the high freight rates make it possible to cut costs in other places of the transport
chain (storage costs, packaging).
Air freight transport chains may be formed in different ways.7 Terminal to
terminal transport of goods may be carried out by co-loading them onto a passenger
plane (Lower Deck) or using a cargo plane. Besides all-cargo planes such as the
Boeing 747 or the Mc Donald Douglas MD 11F, there are the so-called mixed
versions or quick changes, which can be used flexibly as either passenger or cargo
planes. In most cases, pre-carriage from the sender to the airport and on-carriage
from the airport to the receiver are carried out by truck. In many cases, main
carriage is also performed as ground transport on behalf of the airline. This is
referred to as Road Feeder Service (RFS) or trucking. In these cases, the freight
retains its status as air freight and is billed accordingly.
Airports are bases or start and end points of air traffic within air freight transportchains. They serve as an interface between air and ground transport. While formerly
pure infrastructure enterprises, they are now developing into modern service
Table 5.6 Important characteristics of air freight transport
Characteristics of air freight transport
Short transport times in the air
Especially suited for long distances (intercontinental transport)
High transport costs
Small transport capacities compared to other tranport modes
Low network density due to dependence on airport locations
Dependent on weather conditions, especially during take-off and landing
7 Cf. Mensen (2007), p. 18 et seq.; Cf. Vahrenkamp (2005), p. 293 et seq.
74 5 Transport Systems and Logistics Services
companies for air cargo handling (Airport Industrial Parcs) (see Sect. 4.2.2). An
airport operator’s range of services with regard to the air freight sector should
include the provision of suitable transport facilities with adequate space and
capacity, and quick and direct handling facilities. In addition, minimum ground
times as well as 24-h and all-weather operation should be guaranteed.
In order to provide air freight services and to operate air freight transport chains, it
is vital that air freight information and communication systems be in place. Examples
include customs and document processing (electronic air waybill), disposition of
holds and flights, tariff and rate calculation, as well as billing and tracking.
Further information and cargo handling systems offer features such as data
collection and synchronization for drop-off and receipt processing, inventory man-
agement, charge preparation, and generation of loading lists at initial clearance. Air
freight forwarders rely on the systems of airlines and other carriers in pre-carriage
and on-carriage to view flight schedules, match transport terms, and make
bookings. Internet-based applications enable cross-over transactions between
agents, countries, and companies.
5.3.7 Pipeline Transport
Another transport technology is pipeline transport. It is an independent mode of
transport. However, unlike other transport modes, transport route, transport container,
and means of transport form a unit in this instance. Pipelines can be categorized into
four groups: oil, gas, and product pipelines, as well as other energy pipelines.
Oil pipelines distinguish between feeder pipelines and distance pipelines. Feeder
pipelines only have a rather small diameter of about 10 cm and are operated under low
pressure produced by a pump. They transport the oil from the well to central points
where it is first processed in order to free it from gases and water. Subsequently, the
oil is stored in tanks. Distance pipelines start from these tank farms. These pipelines
can have a diameter of up to 1.20 m and are operated under higher pressure. Pumps
along the route generate pressure in the pipes and are located according to the relief
(altitude difference between ground and sea level). The oil travels several hundred
kilometers through the pipeline until it arrives at the port or at a refinery.
The transport of gas in gas pipelines is similar to the transport of oil but differs as
to the operating conditions and the equipment used. Smaller pipelines lead from a
gas field to a gasworks where the gas is cleared of impurities such as water, sulfur,
toxic gas, sulfides, and dioxides. After this cleansing process at the gasworks, the
gas is fed into the distance pipeline. In contrast to oil pipelines, compressors along
the route generate sufficient pressure in the pipeline.
Product pipelines transport refined mineral oils such as gasoline, diesel fuel, and
heating oil but also secondary products such as vaseline, paraffin, bitumen, petroleum
coke, lamp oils, and lubricants from refineries to storage and distribution centers.
Additionally, gases filtered out in the oil and natural gas production process (butane,
ethane, propane) are transported in liquid aggregate state to refineries where they are
separated again. As opposed to oil and gas pipelines, product pipelines do not solely
5.3 Modes of Transport and Transport Technologies 75

transport one specific type of goods. Moreover, they serve to carry several different
products consecutively or even simultaneously.
To avoid an intermingling of individual components when transporting different
products, three basic procedures may be utilized8:
¢ The valves necessary to separate the batches at the infusion stations briefly
remain closed
¢ Balloons which are marginally smaller in diameter than the pipeline are inserted
between the individual batches
¢ A buffer batch is interposed in between two products which may intermingle
with both products
Mineral oils and liquid gases require higher pressure for transport since they are
lighter than crude oil or natural gas. Furthermore, higher pressure is required to
prevent mixtures of liquids and gas as such a mixture could permanently damage
the pumps in the pipeline.
Energy pipelines comprise so-called two-phase pipelines which are mainly used
as feed pipes between oil or gas fields. They simultaneously transport liquids and
gases resulting from the extraction process. These two products are separated in
refineries and gasworks close to the production area. Another type of energy
pipelines are liquefied-natural-gas pipelines which – after liquefaction in special
plants – carry the natural gas to a port for transport by tankship or collect it from the
tankship at the port of destination. Energy pipelines also include the rarely used type
of coal-slurry pipelines. These pipes carry finely ground coal blended with water.
Transcontinental pipelines stretching from production areas to consumption
areas or to sea ports attract the most attention. In these cases the pipelines span
long distances and are installed either above ground, underground, or on the
seafloor. Since they are to a greater or lesser extent taken for granted, less attention
is attracted by shorter pipeline networks used as an integral part of production, as
can be found in the pharmaceutical or chemical industry or in the communal supply
and disposal networks for gas, water, and sewage. The characteristics of pipeline
transport are summarized in Table 5.7.
However, owing to its investment volume and high fixed costs, pipeline trans-
port is not very wide-spread. Thus, pipeline traffic only accounts for a small share of
Table 5.7 Important characteristics of pipeline transport
Characteristics of pipeline transport
High mass-transport capacity, depending on pipe diameter and conveyor speed
High network-forming capability (mostly direct connection from sender to receiver)
High reliability and thus planability
Low risk of air or water pollution (in case of flawless construction and smooth operation)
Environmentally friendly by avoiding emissions
8 Cf. Brecht et al. (1982), p. 31.
76 5 Transport Systems and Logistics Services
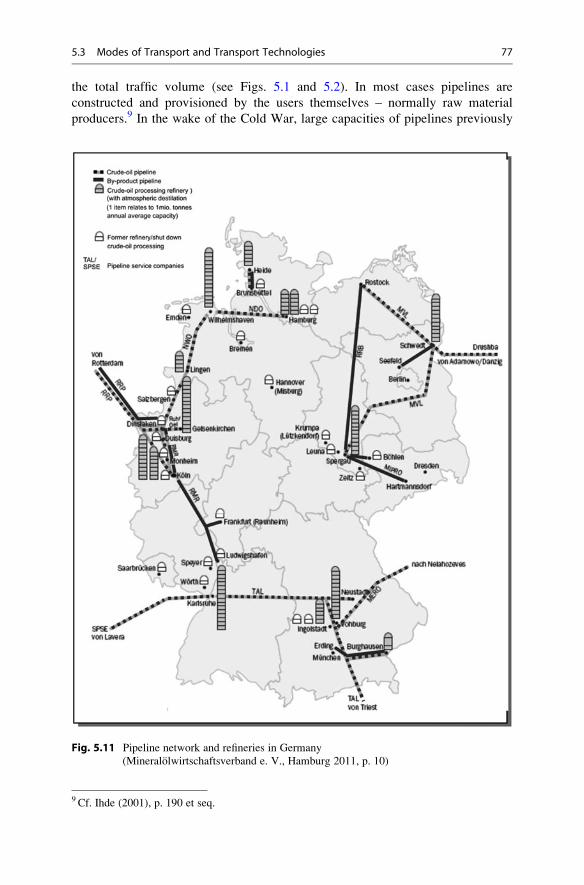
the total traffic volume (see Figs. 5.1 and 5.2). In most cases pipelines are
constructed and provisioned by the users themselves – normally raw material
producers.9 In the wake of the Cold War, large capacities of pipelines previously
Fig. 5.11 Pipeline network and refineries in Germany
(Mineralolwirtschaftsverband e. V., Hamburg 2011, p. 10)
9 Cf. Ihde (2001), p. 190 et seq.
5.3 Modes of Transport and Transport Technologies 77
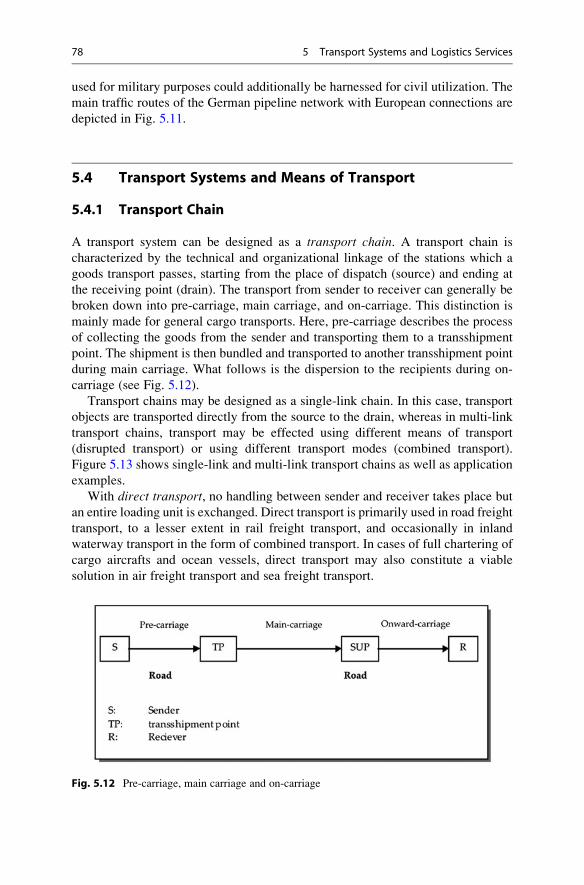
used for military purposes could additionally be harnessed for civil utilization. The
main traffic routes of the German pipeline network with European connections are
depicted in Fig. 5.11.
5.4 Transport Systems and Means of Transport
5.4.1 Transport Chain
A transport system can be designed as a transport chain. A transport chain is
characterized by the technical and organizational linkage of the stations which a
goods transport passes, starting from the place of dispatch (source) and ending at
the receiving point (drain). The transport from sender to receiver can generally be
broken down into pre-carriage, main carriage, and on-carriage. This distinction is
mainly made for general cargo transports. Here, pre-carriage describes the process
of collecting the goods from the sender and transporting them to a transshipment
point. The shipment is then bundled and transported to another transshipment point
during main carriage. What follows is the dispersion to the recipients during on-
carriage (see Fig. 5.12).
Transport chains may be designed as a single-link chain. In this case, transport
objects are transported directly from the source to the drain, whereas in multi-link
transport chains, transport may be effected using different means of transport
(disrupted transport) or using different transport modes (combined transport).
Figure 5.13 shows single-link and multi-link transport chains as well as application
examples.
With direct transport, no handling between sender and receiver takes place but
an entire loading unit is exchanged. Direct transport is primarily used in road freight
transport, to a lesser extent in rail freight transport, and occasionally in inland
waterway transport in the form of combined transport. In cases of full chartering of
cargo aircrafts and ocean vessels, direct transport may also constitute a viable
solution in air freight transport and sea freight transport.
Fig. 5.12 Pre-carriage, main carriage and on-carriage
78 5 Transport Systems and Logistics Services

In order to benefit from the advantages of the individual transport modes,
especially on long distances and under ever-changing transport conditions, systems
have evolved which make use of two or several different transport modes. The main
differentiators of combined transport are listed in Table 5.8.
Combined transport is a way of conducting transport in which goods are carried
from the drain to the source in one loading unit without changing the load carrier,
Fig. 5.13 Setup of transport chains (Cf. Junemann and Schmidt 1999, p. 328)
Table 5.8 Important characteristics of combined transport
Characteristics of combined transportBenefits from the individual transport modes advantages (costs, safety, adherance to delivery dates, environmentally friendly etc.)
Favorable transport times for long distances
Relatively environmentally friendly
Disrupts the transport chain
Rather time consuming due to transshipment of goods
Increased need for spatial and technological capacities due to transshipment
5.4 Transport Systems and Means of Transport 79
by using several transport modes consecutively within a transport chain. To this
end, entire vehicles are loaded onto carrier vehicles, or loading units – if suitable – are
loaded from the carrier vehicle of one transport mode onto the carrier vehicle of
another transport mode.
Types of combined transport are:
¢ Piggy-back transport: Trailer trucks and semi-trailers are loaded onto special
railway carriages which perform the main carriage to the destination area; on-
carriage to the point of destination is carried out by truck
¢ Loading unit or container transport: Containers are used as rationalizing
transport aids, which can be transported in any transport mode
¢ Roll-on-Roll-off transport: trucks or semi-trailers are driven onto RoRo ships
using ramps
¢ Trajectory transport: rail freight wagons are rolled onto rail-equipped ferries
5.4.2 Means of Transport
In order to provide transport services, means of transport need to be utilized.
We distinguish between stationary and mobile means of transport. Stationary means
of transport are means of conveyance (see Chap. 6) which are only used in hubswithin
transport chains, such aswarehouses or transshipment sites.Mobilemeans of transport
are vehicles which are used for transport between hubs.10 A variety of vehicles is
employed in road freight transport. They can be categorized according to net load
class and volume capacity and include utility vans, trucks (motor vehicle and trailer),
and semitrucks (tractor unit and trailer). The most common transport means in road
freight transport are shown in Fig. 5.14.
The broad spectrum of usage possibilities is complemented by loading aids,which can be fixed or interchangeable. The former type comprises superstructures
and roadbeds providing more transport safety than, for example, covers or roof
arches. They are also a technical prerequisite for refrigerated cargo transport or
hazardous goods transport. Interchangeable loading aids are swap bodies in the
form of standardized containers which are equipped with foldable supports. Trucks
are able to drive below these swap bodies to pick up cargo, which renders the
loading and unloading process independent of the transport vehicle.
Rail wagons are the means of transport in rail freight transport. Apart from the
engines, there is a variety of goods wagons in standard and special design
(depending on the transported goods) and are categorized into various types
(see Table 5.9 and Fig. 5.15). The goods wagons are owned by the railway
10 Cf. Isermann (1994), p. 1095.
80 5 Transport Systems and Logistics Services

companies as well as by the dispatching companies. Furthermore, there are rental
companies offering wagons, especially tank wagons, for hire.
The loading gauge determines up to what height an open wagon may be loaded.
This, in turn, is dependent on the so-called minimum clearance outline along
railway routes. The minimum clearance outline is the same in most European
countries. Exceptions are France, Italy, and Switzerland, where a smaller loading
gauge applies accordingly.
Container ships are the prevalent means of transport in ocean shipping.Depending on the goods to be transported, other types of ocean vessels include
crude oil tankers, gas tankers, and bulk ships. Bulk ships are equivalent to tradi-
tional freight ships which can be loaded with individual bulk cargo. However, bulk
Fig. 5.14 Transport means in road freight transport
5.4 Transport Systems and Means of Transport 81
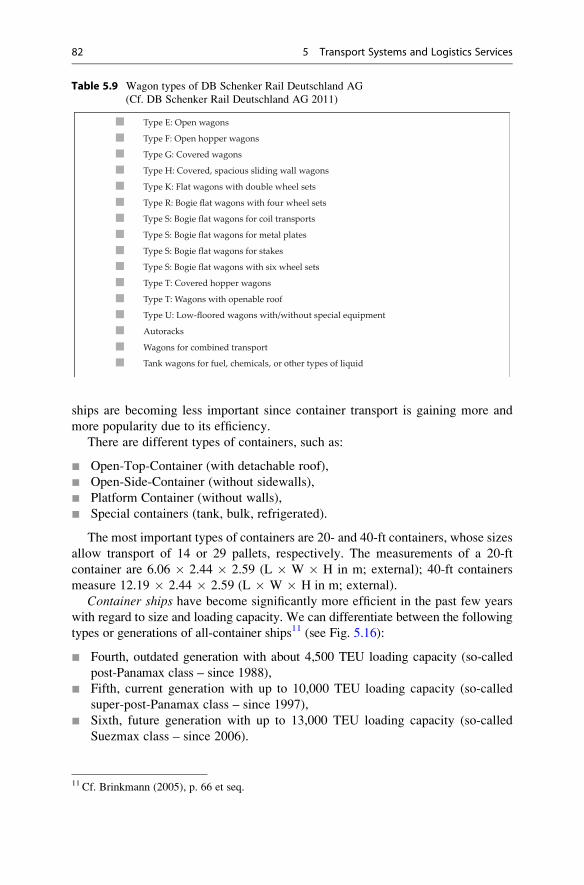
ships are becoming less important since container transport is gaining more and
more popularity due to its efficiency.
There are different types of containers, such as:
¢ Open-Top-Container (with detachable roof),
¢ Open-Side-Container (without sidewalls),
¢ Platform Container (without walls),
¢ Special containers (tank, bulk, refrigerated).
The most important types of containers are 20- and 40-ft containers, whose sizes
allow transport of 14 or 29 pallets, respectively. The measurements of a 20-ft
container are 6.06 � 2.44 � 2.59 (L � W � H in m; external); 40-ft containers
measure 12.19 � 2.44 � 2.59 (L � W � H in m; external).
Container ships have become significantly more efficient in the past few years
with regard to size and loading capacity. We can differentiate between the following
types or generations of all-container ships11 (see Fig. 5.16):
¢ Fourth, outdated generation with about 4,500 TEU loading capacity (so-called
post-Panamax class – since 1988),
¢ Fifth, current generation with up to 10,000 TEU loading capacity (so-called
super-post-Panamax class – since 1997),
¢ Sixth, future generation with up to 13,000 TEU loading capacity (so-called
Suezmax class – since 2006).
Table 5.9 Wagon types of DB Schenker Rail Deutschland AG
(Cf. DB Schenker Rail Deutschland AG 2011)
Type E: Open wagons
Type F: Open hopper wagons
Type G: Covered wagons
Type H: Covered, spacious sliding wall wagons
Type K: Flat wagons with double wheel sets
Type R: Bogie flat wagons with four wheel sets
Type S: Bogie flat wagons for coil transports
Type S: Bogie flat wagons for metal plates
Type S: Bogie flat wagons for stakes
Type S: Bogie flat wagons with six wheel sets
Type T: Covered hopper wagons
Type T: Wagons with openable roof
Type U: Low-floored wagons with/without special equipment
Autoracks
Wagons for combined transport
Tank wagons for fuel, chemicals, or other types of liquid
11 Cf. Brinkmann (2005), p. 66 et seq.
82 5 Transport Systems and Logistics Services

TEU stands for Twenty-Foot Equivalent Unit and is the measurement most
commonly used in container transport based on the measurements of a 20-ft
container. This means, for example, that a 10,000 TEU container ship can transport
the equivalent of five thousand 40-ft containers. The terms Panamax and Suezmax
Fig. 5.15 Railway wagons (Cf. DB Schenker Rail Deutschland AG 2011)
5.4 Transport Systems and Means of Transport 83
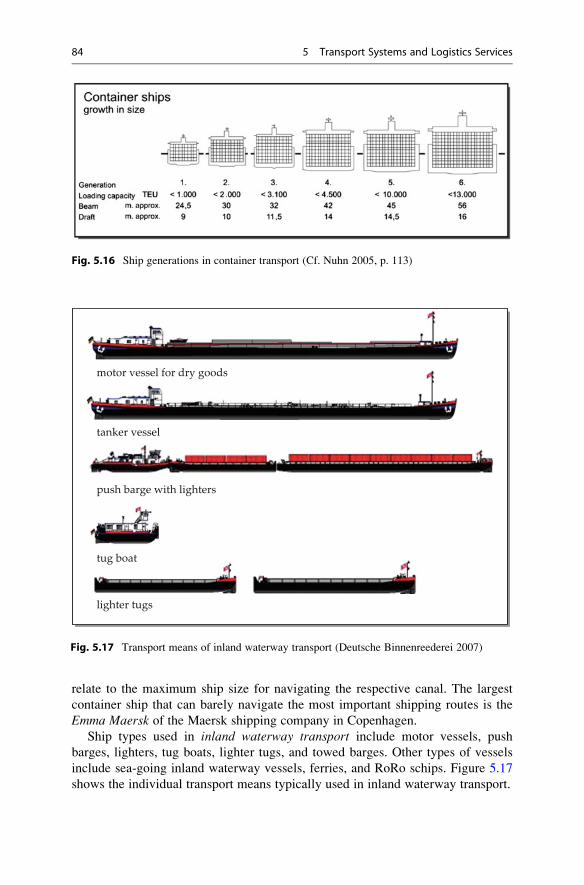
relate to the maximum ship size for navigating the respective canal. The largest
container ship that can barely navigate the most important shipping routes is the
Emma Maersk of the Maersk shipping company in Copenhagen.
Ship types used in inland waterway transport include motor vessels, push
barges, lighters, tug boats, lighter tugs, and towed barges. Other types of vessels
include sea-going inland waterway vessels, ferries, and RoRo schips. Figure 5.17
shows the individual transport means typically used in inland waterway transport.
Fig. 5.16 Ship generations in container transport (Cf. Nuhn 2005, p. 113)
motor vessel for dry goods
tanker vessel
push barge with lighters
tug boat
lighter tugs
Fig. 5.17 Transport means of inland waterway transport (Deutsche Binnenreederei 2007)
84 5 Transport Systems and Logistics Services

With air freight transport services, the airplane as a means of transport is
differentiated into passenger plane, quick-change plane and all-cargo plane. To a
limited extent the lower deck loading capacity (belly capacity) of passenger planes
can be utilized for goods transport.12 More lower deck capacity is available on
combined passenger/cargo planes. All-cargo planes are solely used for freight
transport. Figure 5.18 shows the different airplane types and their basic freight
capacities.
The distinct shape of airplanes requires the use of special loading aids for air
transport. A selection of commonly-used air freight containers which are fitted to
airplane shapes is depicted in Fig. 5.19.
passenger and cargo planeBoing B747
passenger plane Airbus A320
passenger plane BoingB737
Main-Deck
Lower-Deck (Belly)
passenger plane Airbus A330
passenger and cargo plane McDonaldDouglas MD11F
Fig. 5.18 Airplane types (Deutsche Lufthansa AG 2007)
12 Cf. Mensen (2007), p. 52 et seq.
5.4 Transport Systems and Means of Transport 85

Figure 5.20 shows the different loading profiles of cargo planes on two
and three levels. The planes are loaded either from the side, in front, or from
the rear.
Fig. 5.19 Air freight containers (Deutsche Lufthansa 2005, o. S.)
~16.5 ft
118 in~10 ft 96 in
~8 ft
82 in~7 ft
~26 ft
Boeing B747–400F Airbus A380–800F
Fig. 5.20 Loading profiles of all-cargo planes (Boeing 2006)
86 5 Transport Systems and Logistics Services
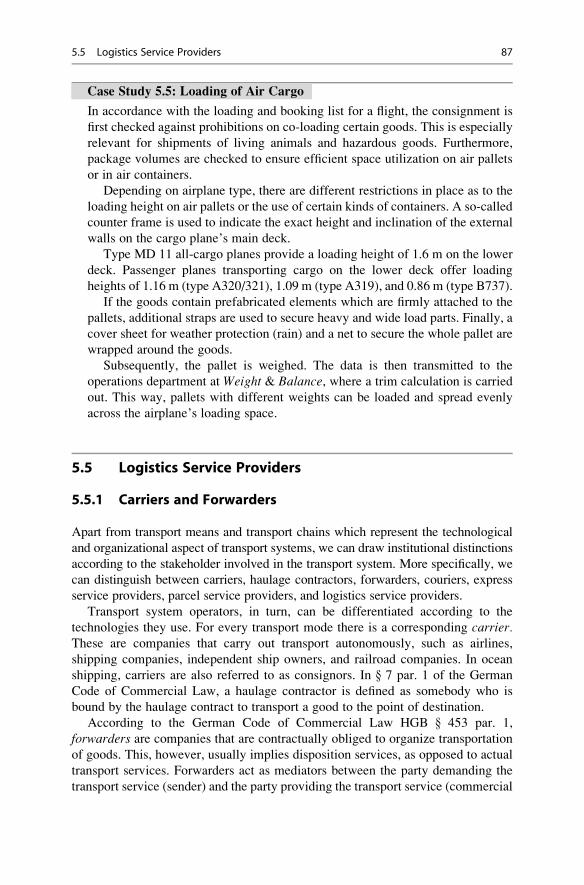
Case Study 5.5: Loading of Air Cargo
In accordance with the loading and booking list for a flight, the consignment is
first checked against prohibitions on co-loading certain goods. This is especially
relevant for shipments of living animals and hazardous goods. Furthermore,
package volumes are checked to ensure efficient space utilization on air pallets
or in air containers.
Depending on airplane type, there are different restrictions in place as to the
loading height on air pallets or the use of certain kinds of containers. A so-called
counter frame is used to indicate the exact height and inclination of the external
walls on the cargo plane’s main deck.
Type MD 11 all-cargo planes provide a loading height of 1.6 m on the lower
deck. Passenger planes transporting cargo on the lower deck offer loading
heights of 1.16 m (type A320/321), 1.09 m (type A319), and 0.86 m (type B737).
If the goods contain prefabricated elements which are firmly attached to the
pallets, additional straps are used to secure heavy and wide load parts. Finally, a
cover sheet for weather protection (rain) and a net to secure the whole pallet are
wrapped around the goods.
Subsequently, the pallet is weighed. The data is then transmitted to the
operations department at Weight & Balance, where a trim calculation is carried
out. This way, pallets with different weights can be loaded and spread evenly
across the airplane’s loading space.
5.5 Logistics Service Providers
5.5.1 Carriers and Forwarders
Apart from transport means and transport chains which represent the technological
and organizational aspect of transport systems, we can draw institutional distinctions
according to the stakeholder involved in the transport system. More specifically, we
can distinguish between carriers, haulage contractors, forwarders, couriers, express
service providers, parcel service providers, and logistics service providers.
Transport system operators, in turn, can be differentiated according to the
technologies they use. For every transport mode there is a corresponding carrier.These are companies that carry out transport autonomously, such as airlines,
shipping companies, independent ship owners, and railroad companies. In ocean
shipping, carriers are also referred to as consignors. In } 7 par. 1 of the German
Code of Commercial Law, a haulage contractor is defined as somebody who is
bound by the haulage contract to transport a good to the point of destination.
According to the German Code of Commercial Law HGB } 453 par. 1,
forwarders are companies that are contractually obliged to organize transportation
of goods. This, however, usually implies disposition services, as opposed to actual
transport services. Forwarders act as mediators between the party demanding the
transport service (sender) and the party providing the transport service (commercial
5.5 Logistics Service Providers 87

goods traffic). Thus, a forwarder organizes mode-neutral transportation of goods.
For this reason, forwarders are sometimes called the architects or organizers oftransport chains. Through own-name transactions (Code of Commercial Law HGB
} 458), transport services and other services may also be rendered by the forwarders
themselves. Forwarders focus on certain transport modes or service areas, such as
truck, railroad, air freight, or sea freight. Table 5.10 provides an overview of the
different service areas and the corresponding focus areas.
Consolidated transport or groupage transport on the road assumes a prominent
function. The table shows that 41.3% of all forwarders surveyed carry out this kind of
transport. Such operations were the main focus area for 21.6 % of the companies
Table 5.10 Service areas and service focus of forwarders (Benchmark: 2,900 surveyed
companies, multiple answers possible) (Cf. DSLV (2010), p. 2)
Consolidated road freight transport 41.3 % 21.6 %
Consolidated rail freight transport 4.4 % 1.4 %
Parcel and express services 11.1 % 4.6 %
Freighting of external trucks 63.3 % 21.9 %
Long-distance truck transports (own-name) 47.4 % 29.4 %
Short-distance transport / cartage 51.8 % 21.4 %
DB general cargo private haulage 7.8 % 3.9 %
International forwarder 55.1 % 24.1 %
Air freight transport company 23.9 % 11.9 %
Sea port forwarder 17.1 % 7.8 %
Customs clearance 45.2 % 12.2 %
Inland waterway forwarder 6.6 % 2.1 %
Inland waterway transshipment 5.6 % 2.6 %
Moving company 9.5 % 4.6 %
Distribution warehousing 39.5 % 4.6 %
Bulk commodity warehousing 8.3 % 3.3 %
Cereal and feedingstuff warehousing 3.7 % 2,0 %
Hazardous goods handling 31.2 % 5.9 %
Distribution logistics 24.0 % 11.0 %
Procurement logistics 19.3 % 7.8 %
service area service focusService area of forwarders
88 5 Transport Systems and Logistics Services
surveyed. With these operations, the forwarder organizes dispatch of goods
shipments from different senders as consolidated cargo (consolidated shipment or
groupage consignment). Apart from consolidated cargo traffic there is combined
transport. Combined transport is used for goods that either do not take up the full
capacity of a means of transport (part-load shipping) or that take up a transport
means’ full capacity (full-load shipping). The term consignment comprises all goods
which have been handed over to a forwarder by a sender together with a shipping
order and which are meant to be shipped to a receiver. A consignment may consist of
several individual shipping orders. Conversely, one shipping order may be carried out
through several consignments. In groupage traffic, a transport chain involves:
¢ The collection of single consignments within a local/regional area (pre-
carriage)
¢ The spatial and temporal consolidation of grouped consignments of as many
senders as possible and for receivers in the same destination areas
¢ The joint transport of those consignments in one means of transport over as long
a distance as possible
¢ Discharge at the points of destination
¢ Delivery of the consignments to the receivers (onward carriage)
One of the benefits of groupage traffic is economies of scale, which are brought
about through increased capacity utilization of the means of transport, thus reducing
transport costs per shipment.
Groupage transport is very common for the transportation of general cargoshipments. General cargo consists of individual goods in solid form, which can
be separately handled and informationally registered. These include unpacked
goods, packages, and loading units. They can weigh from 25 up to 3,000 kg.
General cargo shipments are usually very heterogeneous and consist of several
shipping units. Groupage transport is an important submarket of small goodstransport, which also includes courier services, express services, parcel services,
and mail services.
5.5.2 Courier, Express, Parcel and Mail Service Providers
In contrast to forwarders of groupage cargo, courier messenger, express and
parcel (CEP) service providers focus on specific transport objects, such as
documents or parcels with weight restrictions, whose shipment usually only
comprises one shipment unit. These services require speedy transactions and
high reliability. Express services provide transport of consignments with or
without weight and size restrictions. Speediness and reliability are again para-
mount for these kind of services. Parcel services offer transport of one-piece
parcels with weight and size restrictions (e.g. maximum weight 31.5 kg; maxi-
mum girth measurement 3 m).
In many cases, CEP service providers are integrators (Integrated Service
Carrier) which are providing the entire transport chain. They produce and sell
5.5 Logistics Service Providers 89
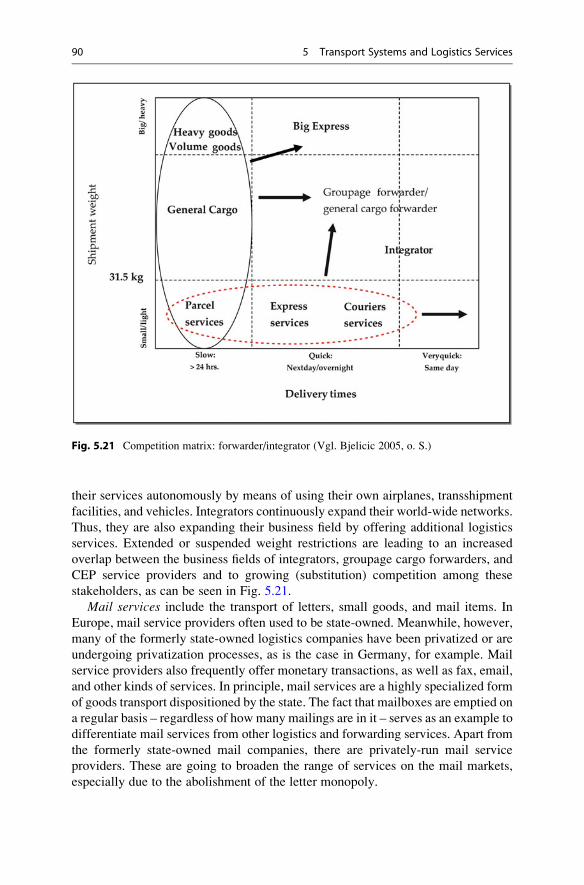
their services autonomously by means of using their own airplanes, transshipment
facilities, and vehicles. Integrators continuously expand their world-wide networks.
Thus, they are also expanding their business field by offering additional logistics
services. Extended or suspended weight restrictions are leading to an increased
overlap between the business fields of integrators, groupage cargo forwarders, and
CEP service providers and to growing (substitution) competition among these
stakeholders, as can be seen in Fig. 5.21.
Mail services include the transport of letters, small goods, and mail items. In
Europe, mail service providers often used to be state-owned. Meanwhile, however,
many of the formerly state-owned logistics companies have been privatized or are
undergoing privatization processes, as is the case in Germany, for example. Mail
service providers also frequently offer monetary transactions, as well as fax, email,
and other kinds of services. In principle, mail services are a highly specialized form
of goods transport dispositioned by the state. The fact that mailboxes are emptied on
a regular basis – regardless of how many mailings are in it – serves as an example to
differentiate mail services from other logistics and forwarding services. Apart from
the formerly state-owned mail companies, there are privately-run mail service
providers. These are going to broaden the range of services on the mail markets,
especially due to the abolishment of the letter monopoly.
Fig. 5.21 Competition matrix: forwarder/integrator (Vgl. Bjelicic 2005, o. S.)
90 5 Transport Systems and Logistics Services

Case Study 5.6: Express Service Provider as Integrator
The term integrator comes from the English verb (to) integrate. More specifically,
this refers to the logistical service structure of a transport service provider. This
means that an integrator unifies or integrates procurement, production and sales of a
service in their portfolio on an international level. To this end theymake use of their
own networks, hubs, vehicles, and airplanes. For example, with 672 airplanes the
American express service provider FedEx runs the world’s largest air fleet. In
parallel to air freight companies, integrators also participate in the international
freight market by offering loading space to other airlines or by requesting addi-
tional loading space in the case of a bottleneck situation. The product portfolio of
these companies not only comprises CEP services but by now also includes aspects
of contract logistics (especially storage, order-picking, billing), consulting
services, mail services, and financial services. This underlines a strong tendency
towards the formation of integrated logistics groups. Additionally, the logistics
service provider’s extended range of services becomes apparent by offering a
number of value added services.
World-wide there are four integrators which generated an aggregate turnover
of about € 120 bn in 2010 (see Table 5.11). With a turnover of roughly € 11 bn,
TNT is the smallest company out of the four. TNT operates their own air freight
and road network in Europe to provide their services (see Fig. 5.22).
These networks are based on the hub-and-spoke principle, which connects
superordinate locations with subordinate ones in a radial way. TNT’s European
air network is a single-tier system with one central airport in Luttich (Belgium)
and 58 associated destinations in 23 countries. The European road network
comprises 414 depots in 33 countries and has a multi-level structure since
several smaller hub-and-spoke systems are integrated into an overarching
hub-and-spoke system. Thus, TNT‘s Express division operates the most exten-
sive air and road network in the whole of Europe.
5.5.3 Systems Service Providers and Contract Logistics Providers
Over the past few years, there has been a significant trend towards outsourcinglogistics services to external service providers (see Sect. 8.5). Several forms of
outsourcing have developed on the market. These developments include carriers
and forwarders outsourcing freight services as well as allocating entire logistics
Table 5.11 The most important integrators and their turnover in 2010
(Cf. Annual reports of TNT, UPS, FedEX, DPWN 2010 ($ exchange rate as of
31.12.2010))
TNT UPS FedEX DPWN
Turnover(across the group in 2010) €11.3 bn €37.3 bn €26.1 bn €51.5 bn
Market share 8.9 % 29.6 % 20.7 % 40.8 %
5.5 Logistics Service Providers 91
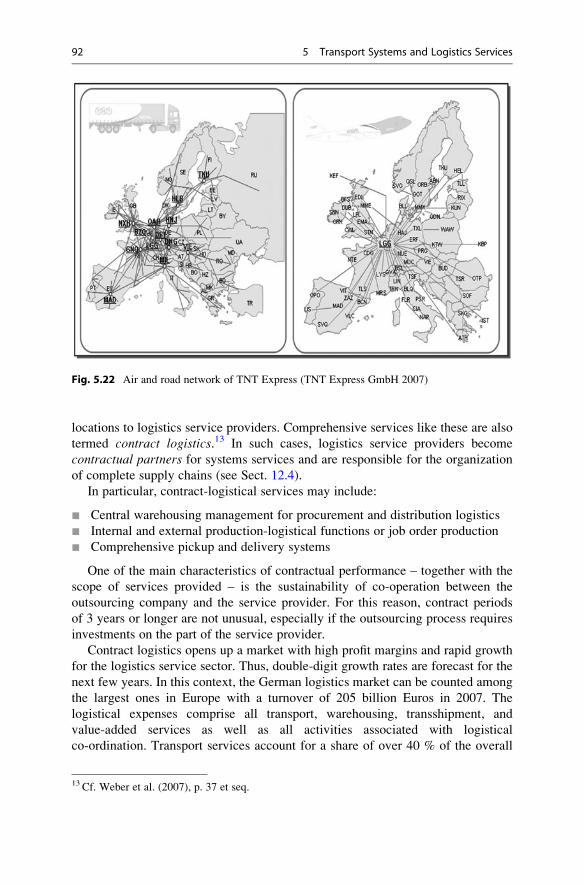
locations to logistics service providers. Comprehensive services like these are also
termed contract logistics.13 In such cases, logistics service providers become
contractual partners for systems services and are responsible for the organization
of complete supply chains (see Sect. 12.4).
In particular, contract-logistical services may include:
¢ Central warehousing management for procurement and distribution logistics
¢ Internal and external production-logistical functions or job order production
¢ Comprehensive pickup and delivery systems
One of the main characteristics of contractual performance – together with the
scope of services provided – is the sustainability of co-operation between the
outsourcing company and the service provider. For this reason, contract periods
of 3 years or longer are not unusual, especially if the outsourcing process requires
investments on the part of the service provider.
Contract logistics opens up a market with high profit margins and rapid growth
for the logistics service sector. Thus, double-digit growth rates are forecast for the
next few years. In this context, the German logistics market can be counted among
the largest ones in Europe with a turnover of 205 billion Euros in 2007. The
logistical expenses comprise all transport, warehousing, transshipment, and
value-added services as well as all activities associated with logistical
co-ordination. Transport services account for a share of over 40 % of the overall
Fig. 5.22 Air and road network of TNT Express (TNT Express GmbH 2007)
13 Cf. Weber et al. (2007), p. 37 et seq.
92 5 Transport Systems and Logistics Services

logistics volume, while storage and transshipment services make up about one
quarter. The remainder includes services related to order processing, inventory
management, and supply chain management.14
There are, however, numerous requirements to be met by providers of contract-
logistical services. These include a minimum enterprise size, corresponding avail-
ability of capital and, most importantly, know-how in logistics and market cultiva-
tion. In addition, certain company functions, such as marketing, production, quality
management, controlling, and IT, are confronted with increased challenges.
14 Cf. Klaus and Kille (2008), p. 45; BVL e. V. (2011), p. 1.
5.5 Logistics Service Providers 93
Review Questions
1. Differentiate between transport services and logistics services.
2. What is meant by volume-of-goods effect and goods-structure effect?
3. What is containerization?
4. What are the advantages of inland waterway transport as a mode of
transport?
5. What are the differences between wagonload transport, part-load transport,
and combined transport?
6. What do the acronyms ICAO and IATA stand for?
7. Explain the structure of an air transport chain.
8. What is the significance of road traffic?
9. What is the difference between a transport chain and a means of transport?
10. What is contract logistics?
Additional Literature
Aberle, G. (2009). Transportwirtschaft: Einzelwirtschaftliche und gesamtwirtschaftlicheGrundlagen (5th ed.). Munchen/Wien: Oldenbourg.
Biebig, P., Althof, W., & Wagener, N. (2004). Seeverkehrswirtschaft: Kompendium (3rd ed.).
Munchen: Oldenbourg.
Klaus, P., & Kille, C. (2008). Die Top 100 der Logistik. Hamburg: Dt. Verkehrs-Verl.
Korf, W. (Ed.) (2005). Lorenz-Leitfaden fur Spediteure und Logistiker in Ausbildung und Beruf,Vol. 1, (20th ed.). Hamburg: DVZ.
Kummer, S. (2010). Einfuhrung in die Verkehrswirtschaft. Wien: Facultas.
Liberatore, M. J., & Miller, T. (1995). A decision support approach for transport carrier and mode
selection. Journal of Business Logistics, 16(2), 85–116.Merkel, H., & Bjelicic, B. (Ed.) (2003). Logistik und Verkehrswirtschaft im Wandel: Unterneh-
mensubergreifende Versorgungsnetzwerke verandern die Wirtschaft, Festschrift fur Gosta B.
Ihde. Munchen: Vahlen.
Schubert, W. (Ed.) (2000). Verkehrslogistik: Technik und Wirtschaft. Munchen: Vahlen.
Sterzenbach, R. (2009). Luftverkehr: Betriebswirtschaftliches Lehr-und Handbuch, 4. Edition,
Munchen: Oldenbourg Verlag.
94 5 Transport Systems and Logistics Services

Warehousing, Handling, and PickingSystems 6
Learning Objectives
Storage and warehousing are central logistics tasks. They require logistics
systems which are to a great extent technology-driven and which any logistics
expert needs to work with in everyday practice. This chapter aims to familiarize
the reader with the basics of warehousing, handling and sorting systems. In so
doing, it will address the basic methods to organize storage areas and storage
processes. Furthermore, tried and tested solutions for warehouse equipment will
be explained. The main focus will be to elucidate the business-economical
contexts and effects associated with different solutions in order to point out
the diverse options to the readers and to assist them in the assessment thereof.
Keywords
¢ Functions of warehousing
¢ Storage systems and conveyors
¢ Technological and organizational warehousing designs
¢ Task areas within a warehouse
¢ Transport and handling of goods
¢ Integrating a warehouse into transport chains
H. Gleissner and J.C. Femerling, Logistics, Springer Texts in Business and Economics,
DOI 10.1007/978-3-319-01769-3_6, # Springer International Publishing Switzerland 2013
95
6.1 Warehousing Basics
Storage is a key element of the logistical system of services and occurs in all stages
of a supply chain and on all levels of the value-adding process and production
process. Storage is of particular importance for distribution logistics in the context
of end-customer delivery of goods. Apart from the actual storing of goods, addi-
tional functions, such as picking, packaging, or return processing need to be
fulfilled in this area.
There is a direct link between warehousing and inventory management (see
Chap. 7). At a warehouse, goods are prepared or transshipped for on-carriage to theultimate consumer and may undergo quality-checks and maintenance in cases of
long storage periods.
Warehouses also fulfill allocative functions within the distribution process to
direct shipments to their destinations in the right composition. Accordingly,
warehouses serve to bring together flows of goods from different sources and
places, e. g. production sites or suppliers. In one warehouse, an entire range of
products may thus be available, which can be transported to the respective distri-
bution area or from which actual customer orders can be compiled. The on-carriage
may be organized in a way which utilizes the capacities of the outgoing loading or
transport unit most efficiently (see Chap. 5).
The Deutsches Institut fur Normung, DIN e. V. (German Institute for
Standardization) and the Verein Deutscher Ingenieure (Association of German
Engineers) have developed several definitions with regard to the most important
warehousing terminology. Storage is any planned waiting time for goods or work
objects in the flow of materials and goods.1 Throughout the literature, the term flowof materials is more commonly used for production processes in the industry sector.
In the distribution and trading sector, however, the term flow of goods is more
common.
A warehouse is a room or an area in which goods are stored in solid (general
cargo or bulk cargo), liquid, or gaseous state and where their quantity and value is
usually recorded. In this context, the term general cargo characterizes goods which
can be handled or carried by conventional conveyors either directly or in their
respective packaging. Bulk cargo consists of very small, loose, and pourable
conveying goods. Storage, in the economic sense, is a deliberate process. However,
only if the goods stored are documented the term storage actually applies.
Conveyance occurs if goods are moved within a storage area or plant, e.g. from
or towards the productions site. Thus, conveyance mainly refers to in-plant flows of
materials and goods. Within the confines of such a system, conveyance may also
comprise the movement of people, besides the movement of goods. The convey-
ance of goods from one system to another (warehouses, production sites etc.) over
long distances is referred to as transport.
1 Cf. VDI code No. 2411.
96 6 Warehousing, Handling, and Picking Systems
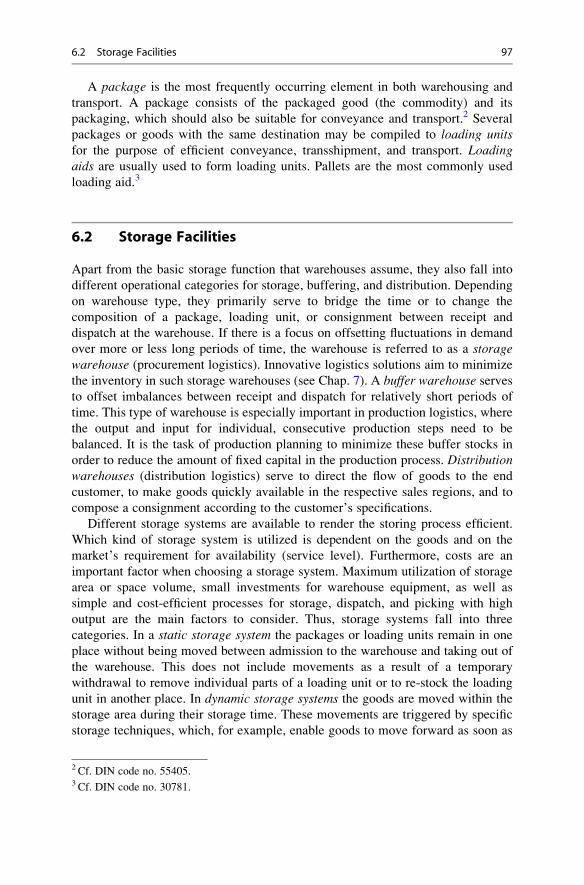
A package is the most frequently occurring element in both warehousing and
transport. A package consists of the packaged good (the commodity) and its
packaging, which should also be suitable for conveyance and transport.2 Several
packages or goods with the same destination may be compiled to loading unitsfor the purpose of efficient conveyance, transshipment, and transport. Loadingaids are usually used to form loading units. Pallets are the most commonly used
loading aid.3
6.2 Storage Facilities
Apart from the basic storage function that warehouses assume, they also fall into
different operational categories for storage, buffering, and distribution. Depending
on warehouse type, they primarily serve to bridge the time or to change the
composition of a package, loading unit, or consignment between receipt and
dispatch at the warehouse. If there is a focus on offsetting fluctuations in demand
over more or less long periods of time, the warehouse is referred to as a storagewarehouse (procurement logistics). Innovative logistics solutions aim to minimize
the inventory in such storage warehouses (see Chap. 7). A buffer warehouse servesto offset imbalances between receipt and dispatch for relatively short periods of
time. This type of warehouse is especially important in production logistics, where
the output and input for individual, consecutive production steps need to be
balanced. It is the task of production planning to minimize these buffer stocks in
order to reduce the amount of fixed capital in the production process. Distributionwarehouses (distribution logistics) serve to direct the flow of goods to the end
customer, to make goods quickly available in the respective sales regions, and to
compose a consignment according to the customer’s specifications.
Different storage systems are available to render the storing process efficient.
Which kind of storage system is utilized is dependent on the goods and on the
market’s requirement for availability (service level). Furthermore, costs are an
important factor when choosing a storage system. Maximum utilization of storage
area or space volume, small investments for warehouse equipment, as well as
simple and cost-efficient processes for storage, dispatch, and picking with high
output are the main factors to consider. Thus, storage systems fall into three
categories. In a static storage system the packages or loading units remain in one
place without being moved between admission to the warehouse and taking out of
the warehouse. This does not include movements as a result of a temporary
withdrawal to remove individual parts of a loading unit or to re-stock the loading
unit in another place. In dynamic storage systems the goods are moved within the
storage area during their storage time. These movements are triggered by specific
storage techniques, which, for example, enable goods to move forward as soon as
2 Cf. DIN code no. 55405.3 Cf. DIN code no. 30781.
6.2 Storage Facilities 97
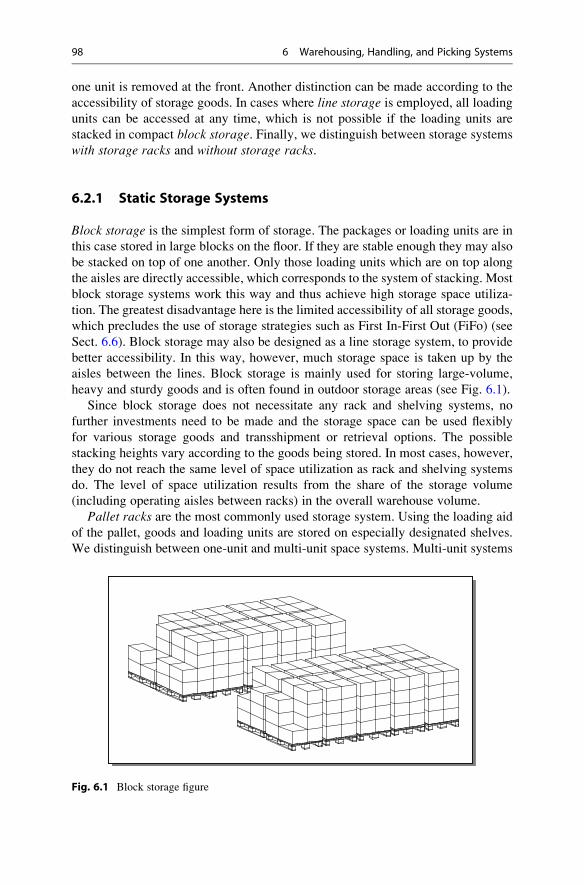
one unit is removed at the front. Another distinction can be made according to the
accessibility of storage goods. In cases where line storage is employed, all loading
units can be accessed at any time, which is not possible if the loading units are
stacked in compact block storage. Finally, we distinguish between storage systems
with storage racks and without storage racks.
6.2.1 Static Storage Systems
Block storage is the simplest form of storage. The packages or loading units are in
this case stored in large blocks on the floor. If they are stable enough they may also
be stacked on top of one another. Only those loading units which are on top along
the aisles are directly accessible, which corresponds to the system of stacking. Most
block storage systems work this way and thus achieve high storage space utiliza-
tion. The greatest disadvantage here is the limited accessibility of all storage goods,
which precludes the use of storage strategies such as First In-First Out (FiFo) (see
Sect. 6.6). Block storage may also be designed as a line storage system, to provide
better accessibility. In this way, however, much storage space is taken up by the
aisles between the lines. Block storage is mainly used for storing large-volume,
heavy and sturdy goods and is often found in outdoor storage areas (see Fig. 6.1).
Since block storage does not necessitate any rack and shelving systems, no
further investments need to be made and the storage space can be used flexibly
for various storage goods and transshipment or retrieval options. The possible
stacking heights vary according to the goods being stored. In most cases, however,
they do not reach the same level of space utilization as rack and shelving systems
do. The level of space utilization results from the share of the storage volume
(including operating aisles between racks) in the overall warehouse volume.
Pallet racks are the most commonly used storage system. Using the loading aid
of the pallet, goods and loading units are stored on especially designated shelves.
We distinguish between one-unit and multi-unit space systems. Multi-unit systems
Fig. 6.1 Block storage figure
98 6 Warehousing, Handling, and Picking Systems

are designed to store more than one pallet next to each other on the shelf. Pallets can
have varying measurements, but in most cases they are rectangular. Therefore, they
can either be stored deep (mostly three next to each other), which results in greater
capacity utilization, or they may be stored horizontally if goods are picked directly
from the pallet. Pallets can also be stored one behind the other. If a pallet rack
exceeds a height of approximately 15 m, it is called high rack.4 Depending on type
of goods and picking frequency the pallet racks may be separated by broad operating
aisles or they can be designed as a narrow-aisle construction (see Fig. 6.2).
In contrast to block storage systems, pallet racks provide direct accessibility to
each loading unit, as long as they are stored next to each other on the shelf. If
standard pallet types are used, pallet racks also guarantee relatively high flexibility
and transshipment performance with regard to goods types and picking
requirements. The high storage volume utilization which can be achieved using
this type of storage system is especially advantageous in metropolitan areas where
storage space is costly. The ground on which a pallet rack is set up needs to meet
certain constructional requirements irrespective of whether the construction is
located outdoors or in a warehouse. In comparison to a block storage system,
additional costs may arise for investments in shelving technologies and possibly
also for technologically more advanced conveyor techniques used in the storage
and retrieval processes.
Instead of using pallets, rack shelves may also serve to store small parts in
containers of different sizes. To this end, the space between the shelving levels can
be reduced. This storage type is termed container shelving. The storage of goods onflat, trough-like plates (trays) is referred to as tray storage.
Drive-in racks or drive-in shelves combine pallet shelving and block storage and
are used for storing palletized goods. In principle, they are similar to one-unit pallet
shelves. With this storage system, however, several pallets can be stored deep one
Fig. 6.2 Pallet rack
4 Cf. Schulte (2009), p. 234.
6.2 Storage Facilities 99
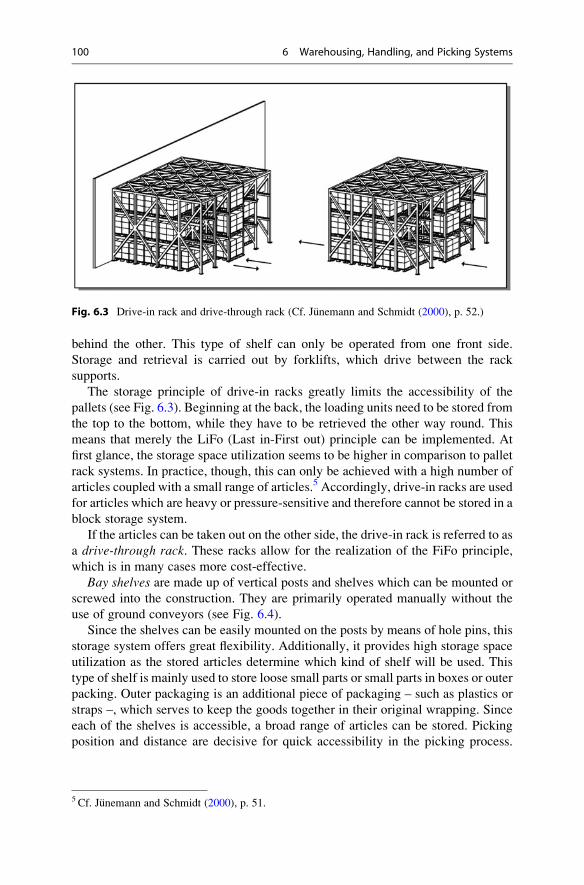
behind the other. This type of shelf can only be operated from one front side.
Storage and retrieval is carried out by forklifts, which drive between the rack
supports.
The storage principle of drive-in racks greatly limits the accessibility of the
pallets (see Fig. 6.3). Beginning at the back, the loading units need to be stored from
the top to the bottom, while they have to be retrieved the other way round. This
means that merely the LiFo (Last in-First out) principle can be implemented. At
first glance, the storage space utilization seems to be higher in comparison to pallet
rack systems. In practice, though, this can only be achieved with a high number of
articles coupled with a small range of articles.5 Accordingly, drive-in racks are used
for articles which are heavy or pressure-sensitive and therefore cannot be stored in a
block storage system.
If the articles can be taken out on the other side, the drive-in rack is referred to as
a drive-through rack. These racks allow for the realization of the FiFo principle,
which is in many cases more cost-effective.
Bay shelves are made up of vertical posts and shelves which can be mounted or
screwed into the construction. They are primarily operated manually without the
use of ground conveyors (see Fig. 6.4).
Since the shelves can be easily mounted on the posts by means of hole pins, this
storage system offers great flexibility. Additionally, it provides high storage space
utilization as the stored articles determine which kind of shelf will be used. This
type of shelf is mainly used to store loose small parts or small parts in boxes or outer
packing. Outer packaging is an additional piece of packaging – such as plastics or
straps –, which serves to keep the goods together in their original wrapping. Since
each of the shelves is accessible, a broad range of articles can be stored. Picking
position and distance are decisive for quick accessibility in the picking process.
Fig. 6.3 Drive-in rack and drive-through rack (Cf. Junemann and Schmidt (2000), p. 52.)
5 Cf. Junemann and Schmidt (2000), p. 51.
100 6 Warehousing, Handling, and Picking Systems

Articles that are stored on top or at the bottom are more difficult to pick than those
stored at breast height.
Cantilever shelves consist of vertical posts on arms jutting out laterally. Long
loads, such as tubes, profiles, bars, beams, and boards are stored on these arms. The
number of arms on top of each other and the arm length are determined by the
measurements and weight of the storage goods (see Fig. 6.5).
If the articles are supposed to be individually accessible, the number of articles
per cantilever arm is limited.
6.2.2 Dynamic Storage Systems
Live storage shelving is the most commonly used dynamic storage system. The
loading units are stored on slightly inclined roller lanes and are fed in at the higher
Fig. 6.5 Cantilever shelf
Fig. 6.4 Bay shelf
6.2 Storage Facilities 101
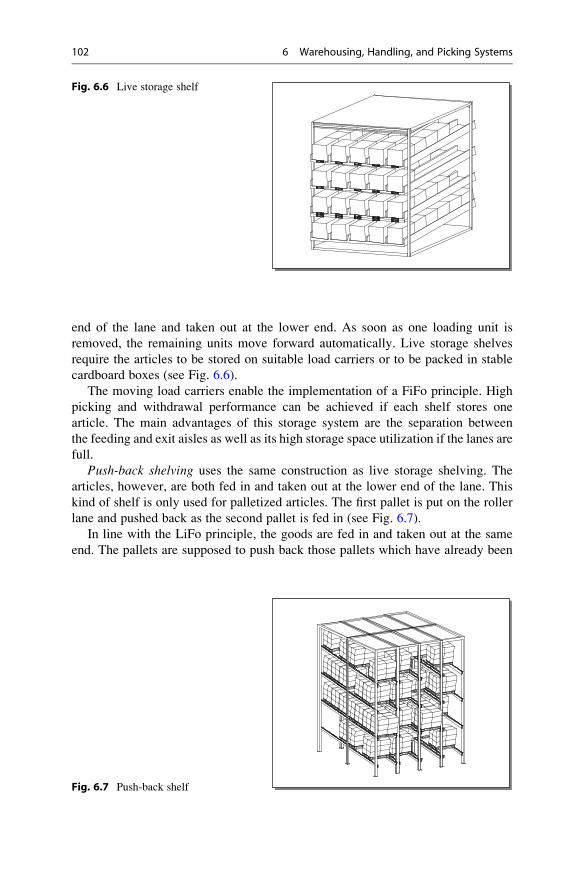
end of the lane and taken out at the lower end. As soon as one loading unit is
removed, the remaining units move forward automatically. Live storage shelves
require the articles to be stored on suitable load carriers or to be packed in stable
cardboard boxes (see Fig. 6.6).
The moving load carriers enable the implementation of a FiFo principle. High
picking and withdrawal performance can be achieved if each shelf stores one
article. The main advantages of this storage system are the separation between
the feeding and exit aisles as well as its high storage space utilization if the lanes are
full.
Push-back shelving uses the same construction as live storage shelving. The
articles, however, are both fed in and taken out at the lower end of the lane. This
kind of shelf is only used for palletized articles. The first pallet is put on the roller
lane and pushed back as the second pallet is fed in (see Fig. 6.7).
In line with the LiFo principle, the goods are fed in and taken out at the same
end. The pallets are supposed to push back those pallets which have already been
Fig. 6.6 Live storage shelf
Fig. 6.7 Push-back shelf
102 6 Warehousing, Handling, and Picking Systems

stored on the shelf. This needs to be taken into account when opting for a shelving
system. Furthermore, the pallets are prone to canting.
Satellite storage systems are a variation to push-back shelving. With this storage
system, the pallets are put on self-propelled carts which independently drive into
the lanes. Subsequently, the carts drive back to the point of loading. This system’s
advantage over push-back systems is the fact that forklifts or shelving operating
devices can proceed with other tasks while the pallet is still being stored.
A vertical carousel (paternoster) is a type of shelving storage system in which
the individual shelves are attached to two vertically circulating chains. Using a
control panel, the required shelf is moved to the discharge opening (see Fig. 6.8).
In order to avoid full circulations when retrieving goods, the same articles should
ideally be grouped together and stored on different levels. To this end, the shelves
are partitioned and allow for separation according to article type. The handling
performance is dependent on the height of the carousel and on the range of articles.
Paternosters offer a higher percentage of storage space utilization than bay shelving
systems while providing the same accessibility. The system is lockable and is well
suited for the storage of small to medium-sized goods and high-value goods.
Manual operation, e.g. in the case of a system failure, is not possible.
A horizontal carousel is another type of shelving storage system. A horizontal
overhead conveyor moves the individual shelves, which are attached to the con-
veyor. Using a control panel, the requested shelves are moved to the side of
discharge (see Fig. 6.9). Thus, the goods-to-man principle (see Sect. 6.5) applies
both to vertical and horizontal carousels.
This shelving type is primarily used in picking warehouses. Employment of this
solution begs the question whether the picking person would have access to the
needed article more quickly on foot or using this type of system. Ideally, several
carousels should be inter-connected in one picking zone so that the requested article
can be retrieved during the picking person’s transit time. Transit time describes the
time that is needed for a person to move from one picking point to another.
Fig. 6.8 Vertical carousel
6.2 Storage Facilities 103
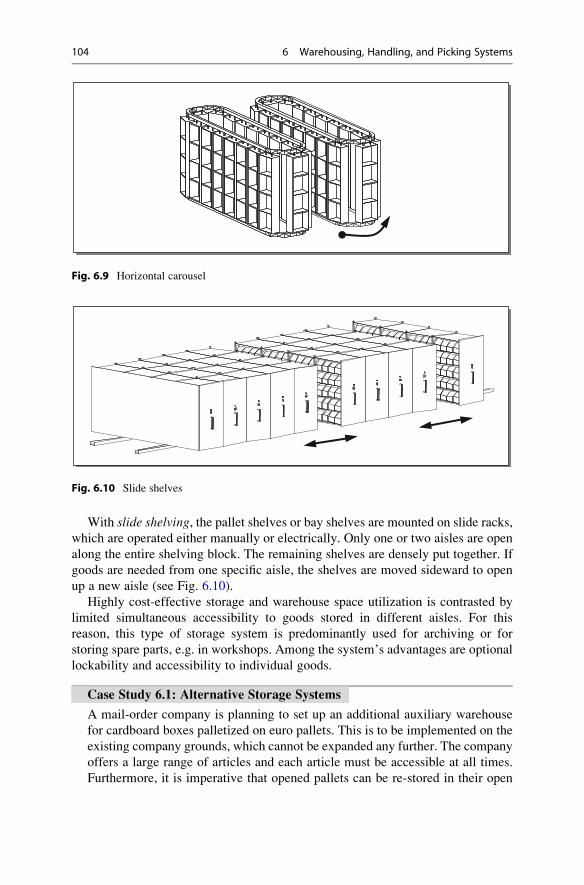
With slide shelving, the pallet shelves or bay shelves are mounted on slide racks,
which are operated either manually or electrically. Only one or two aisles are open
along the entire shelving block. The remaining shelves are densely put together. If
goods are needed from one specific aisle, the shelves are moved sideward to open
up a new aisle (see Fig. 6.10).
Highly cost-effective storage and warehouse space utilization is contrasted by
limited simultaneous accessibility to goods stored in different aisles. For this
reason, this type of storage system is predominantly used for archiving or for
storing spare parts, e.g. in workshops. Among the system’s advantages are optional
lockability and accessibility to individual goods.
Case Study 6.1: Alternative Storage Systems
A mail-order company is planning to set up an additional auxiliary warehouse
for cardboard boxes palletized on euro pallets. This is to be implemented on the
existing company grounds, which cannot be expanded any further. The company
offers a large range of articles and each article must be accessible at all times.
Furthermore, it is imperative that opened pallets can be re-stored in their open
Fig. 6.10 Slide shelves
Fig. 6.9 Horizontal carousel
104 6 Warehousing, Handling, and Picking Systems

state. The average height of one pallet is 1 m and the pallets are not stackable. To
cover the long-term storage requirements, the new warehouse is supposed to
have more than 6,000 pallet spaces available. Constructional restrictions by the
responsible building authority allow an indoor clearance of 13 m.
The planning department is discussing three alternative storage systems:
(a) Pallet shelving (storage space utilization 45 %),
(b) Live storage shelving (storage space utilization 65 %),
(c) Block storage (storage space utilization 80 %).
The level of storage space utilization is the share of the storage area (includ-
ing operational aisles between shelves but excluding main traffic areas and zones
for receiving, issuing, and provisioning goods) in the total area of the warehouse.
For safety purposes and to ensure sufficient free scope for storing and retrieving,
a clearance height of 0.5 m per pallet needs to be factored in for pallet shelving.
Other areas, such as goods receiving, goods issuing, and main traffic areas may
be disregarded in the calculation.
Calculate the space requirements for each of the three alternatives.
Considering the circumstances, which storage system would you
recommend?
6.3 Conveyors
To enable conveyance, i.e. the movement of goods within systems over short
distances, technological aids – so-called conveyors or conveyor systems – need to
be employed.6 Conveyors transport goods within locally determined operational
units, e.g. within production sites, warehouses, transshipment terminals or, airports.
Besides their main task of conveying, conveyor technologies serve additional
purposes such as distributing or sorting (sorting out of shipments), collecting(merging of individually incoming packages), buffering (transit time from
dispatching location to destination or accumulation zones at the end of conveyor),
or picking (sorting of goods for outgoing shipments or customer shipments). If
some of the conveying goods can be discharged at certain points along the con-
veyor, we also talk about sorters or sorting technology.
Conveyor systems can be distinguished according to the following criteria:
¢ Discontinuous conveyors produce an intermittent stream of conveying goods
and operate in individual working cycles (so-called intermittent conveyors).
¢ Continuous conveyors convey bulk or general cargo continuously.
¢ Floor-bound conveyors drive on the floor or on installations that are flush-
mounted in the floor.
¢ Supported conveyors move above the floor on supports or on supported rails.
¢ Suspended conveyors move along rails on the ceiling.
6 Cf. DIN 30781.
6.3 Conveyors 105

6.3.1 Discontinuous Conveyors
Manual lift trucks are manually-operated conveyors for the movement of single
pallets on short distances. They are used for loading and un-loading vehicles (trucks
or trains wagons).
Manual lift trucks can only lift a pallet to a height which enables them to drive
carrying the pallet. For this reason they cannot be used to stack goods. Due to their
technical simplicity, sturdiness, and good maneouvrability, manual lift trucks are
suited to cover short distances in cramped spaces (see Fig. 6.11).
Lift pallet trucks, which belong to the category of stackers, are a variation of themanual lift truck. The base lift functionality as a so called low lift pallet truck
enables them to stack pallets at a low height, around 1 m, which is why they are
frequently used in the goods receiving and goods outgoing departments where goods
are stacked up. Lift pallets trucks may also operate in storage areas. There are also
high lift pallet trucks available to reach stacking highs up to 5 m (see Fig. 6.12).
Both manual lift trucks and lift pallet trucks can be fitted with an engine. This
may serve to support staff members in pulling or pushing the truck, or the truck may
be designed as a driver-seated lift truck. Both trucks are mainly used indoors since
they cannot be driven on uneven surfaces due to their small wheels.
Fig. 6.11 Manual lift truck
Fig. 6.12 Lift pallet truck
106 6 Warehousing, Handling, and Picking Systems
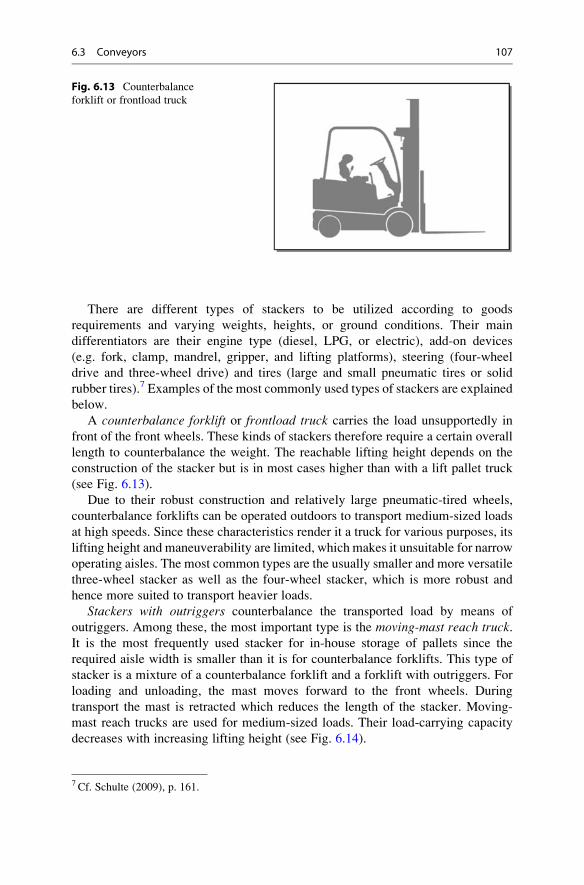
There are different types of stackers to be utilized according to goods
requirements and varying weights, heights, or ground conditions. Their main
differentiators are their engine type (diesel, LPG, or electric), add-on devices
(e.g. fork, clamp, mandrel, gripper, and lifting platforms), steering (four-wheel
drive and three-wheel drive) and tires (large and small pneumatic tires or solid
rubber tires).7 Examples of the most commonly used types of stackers are explained
below.
A counterbalance forklift or frontload truck carries the load unsupportedly in
front of the front wheels. These kinds of stackers therefore require a certain overall
length to counterbalance the weight. The reachable lifting height depends on the
construction of the stacker but is in most cases higher than with a lift pallet truck
(see Fig. 6.13).
Due to their robust construction and relatively large pneumatic-tired wheels,
counterbalance forklifts can be operated outdoors to transport medium-sized loads
at high speeds. Since these characteristics render it a truck for various purposes, its
lifting height and maneuverability are limited, which makes it unsuitable for narrow
operating aisles. The most common types are the usually smaller and more versatile
three-wheel stacker as well as the four-wheel stacker, which is more robust and
hence more suited to transport heavier loads.
Stackers with outriggers counterbalance the transported load by means of
outriggers. Among these, the most important type is the moving-mast reach truck.It is the most frequently used stacker for in-house storage of pallets since the
required aisle width is smaller than it is for counterbalance forklifts. This type of
stacker is a mixture of a counterbalance forklift and a forklift with outriggers. For
loading and unloading, the mast moves forward to the front wheels. During
transport the mast is retracted which reduces the length of the stacker. Moving-
mast reach trucks are used for medium-sized loads. Their load-carrying capacity
decreases with increasing lifting height (see Fig. 6.14).
Fig. 6.13 Counterbalance
forklift or frontload truck
7 Cf. Schulte (2009), p. 161.
6.3 Conveyors 107
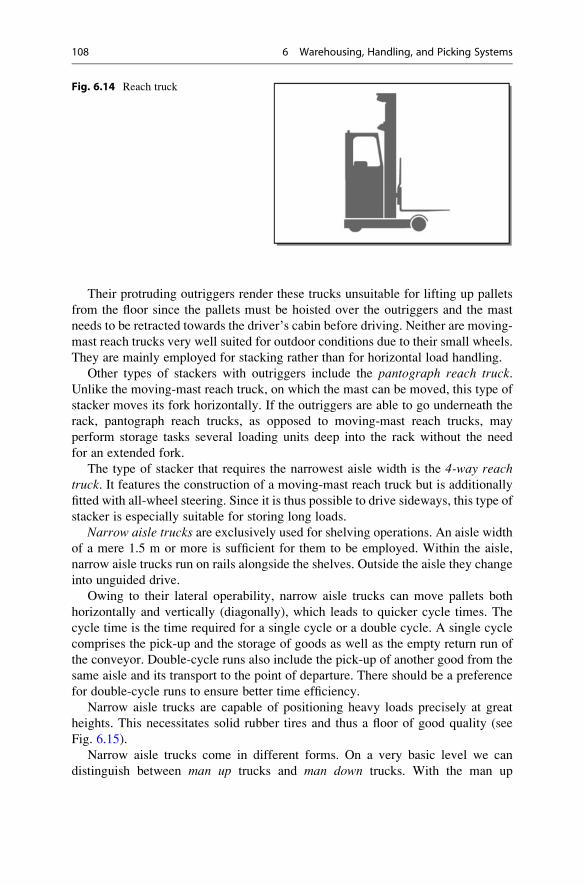
Their protruding outriggers render these trucks unsuitable for lifting up pallets
from the floor since the pallets must be hoisted over the outriggers and the mast
needs to be retracted towards the driver’s cabin before driving. Neither are moving-
mast reach trucks very well suited for outdoor conditions due to their small wheels.
They are mainly employed for stacking rather than for horizontal load handling.
Other types of stackers with outriggers include the pantograph reach truck.Unlike the moving-mast reach truck, on which the mast can be moved, this type of
stacker moves its fork horizontally. If the outriggers are able to go underneath the
rack, pantograph reach trucks, as opposed to moving-mast reach trucks, may
perform storage tasks several loading units deep into the rack without the need
for an extended fork.
The type of stacker that requires the narrowest aisle width is the 4-way reachtruck. It features the construction of a moving-mast reach truck but is additionally
fitted with all-wheel steering. Since it is thus possible to drive sideways, this type of
stacker is especially suitable for storing long loads.
Narrow aisle trucks are exclusively used for shelving operations. An aisle widthof a mere 1.5 m or more is sufficient for them to be employed. Within the aisle,
narrow aisle trucks run on rails alongside the shelves. Outside the aisle they change
into unguided drive.
Owing to their lateral operability, narrow aisle trucks can move pallets both
horizontally and vertically (diagonally), which leads to quicker cycle times. The
cycle time is the time required for a single cycle or a double cycle. A single cycle
comprises the pick-up and the storage of goods as well as the empty return run of
the conveyor. Double-cycle runs also include the pick-up of another good from the
same aisle and its transport to the point of departure. There should be a preference
for double-cycle runs to ensure better time efficiency.
Narrow aisle trucks are capable of positioning heavy loads precisely at great
heights. This necessitates solid rubber tires and thus a floor of good quality (see
Fig. 6.15).
Narrow aisle trucks come in different forms. On a very basic level we can
distinguish between man up trucks and man down trucks. With the man up
Fig. 6.14 Reach truck
108 6 Warehousing, Handling, and Picking Systems
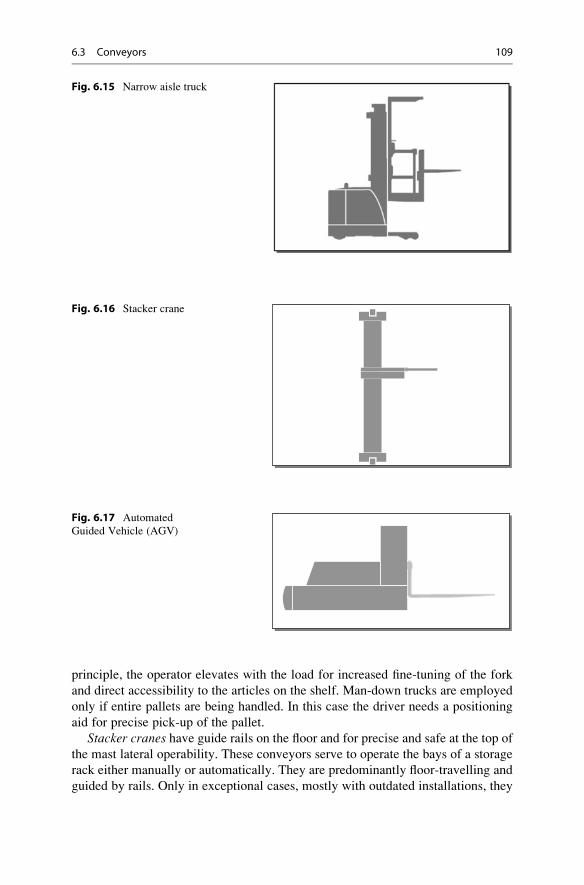
principle, the operator elevates with the load for increased fine-tuning of the fork
and direct accessibility to the articles on the shelf. Man-down trucks are employed
only if entire pallets are being handled. In this case the driver needs a positioning
aid for precise pick-up of the pallet.
Stacker cranes have guide rails on the floor and for precise and safe at the top ofthe mast lateral operability. These conveyors serve to operate the bays of a storage
rack either manually or automatically. They are predominantly floor-travelling and
guided by rails. Only in exceptional cases, mostly with outdated installations, they
Fig. 6.16 Stacker crane
Fig. 6.15 Narrow aisle truck
Fig. 6.17 Automated
Guided Vehicle (AGV)
6.3 Conveyors 109
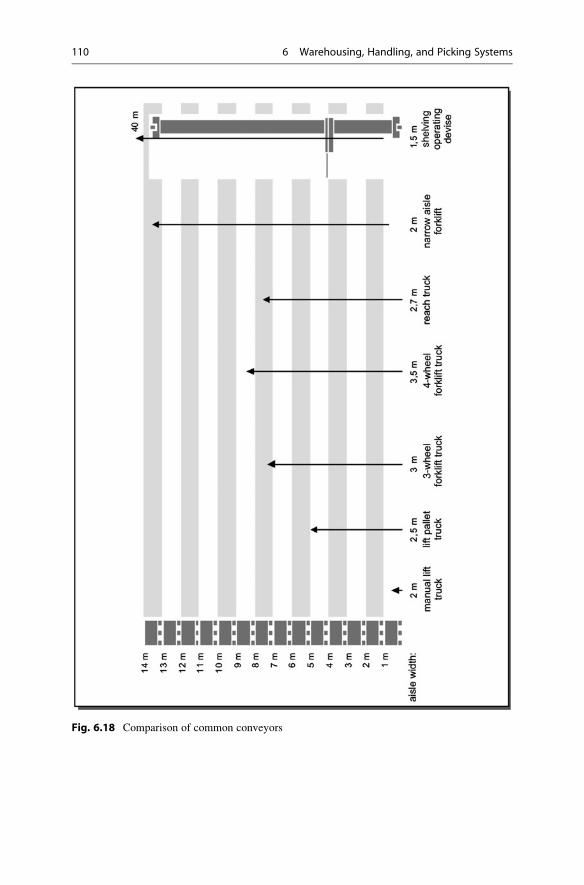
Fig. 6.18 Comparison of common conveyors
110 6 Warehousing, Handling, and Picking Systems
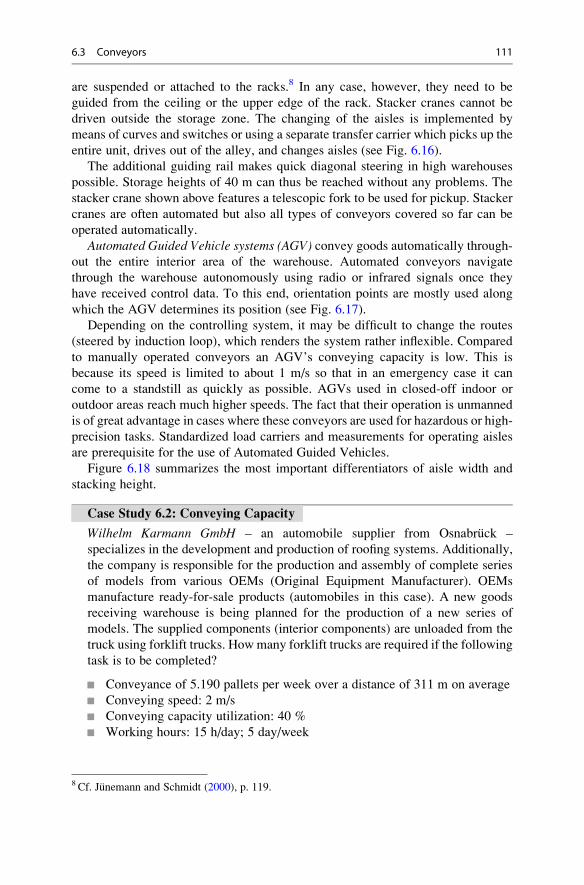
are suspended or attached to the racks.8 In any case, however, they need to be
guided from the ceiling or the upper edge of the rack. Stacker cranes cannot be
driven outside the storage zone. The changing of the aisles is implemented by
means of curves and switches or using a separate transfer carrier which picks up the
entire unit, drives out of the alley, and changes aisles (see Fig. 6.16).
The additional guiding rail makes quick diagonal steering in high warehouses
possible. Storage heights of 40 m can thus be reached without any problems. The
stacker crane shown above features a telescopic fork to be used for pickup. Stacker
cranes are often automated but also all types of conveyors covered so far can be
operated automatically.
Automated Guided Vehicle systems (AGV) convey goods automatically through-
out the entire interior area of the warehouse. Automated conveyors navigate
through the warehouse autonomously using radio or infrared signals once they
have received control data. To this end, orientation points are mostly used along
which the AGV determines its position (see Fig. 6.17).
Depending on the controlling system, it may be difficult to change the routes
(steered by induction loop), which renders the system rather inflexible. Compared
to manually operated conveyors an AGV’s conveying capacity is low. This is
because its speed is limited to about 1 m/s so that in an emergency case it can
come to a standstill as quickly as possible. AGVs used in closed-off indoor or
outdoor areas reach much higher speeds. The fact that their operation is unmanned
is of great advantage in cases where these conveyors are used for hazardous or high-
precision tasks. Standardized load carriers and measurements for operating aisles
are prerequisite for the use of Automated Guided Vehicles.
Figure 6.18 summarizes the most important differentiators of aisle width and
stacking height.
Case Study 6.2: Conveying Capacity
Wilhelm Karmann GmbH – an automobile supplier from Osnabruck –
specializes in the development and production of roofing systems. Additionally,
the company is responsible for the production and assembly of complete series
of models from various OEMs (Original Equipment Manufacturer). OEMs
manufacture ready-for-sale products (automobiles in this case). A new goods
receiving warehouse is being planned for the production of a new series of
models. The supplied components (interior components) are unloaded from the
truck using forklift trucks. Howmany forklift trucks are required if the following
task is to be completed?
¢ Conveyance of 5.190 pallets per week over a distance of 311 m on average
¢ Conveying speed: 2 m/s
¢ Conveying capacity utilization: 40 %
¢ Working hours: 15 h/day; 5 day/week
8Cf. Junemann and Schmidt (2000), p. 119.
6.3 Conveyors 111
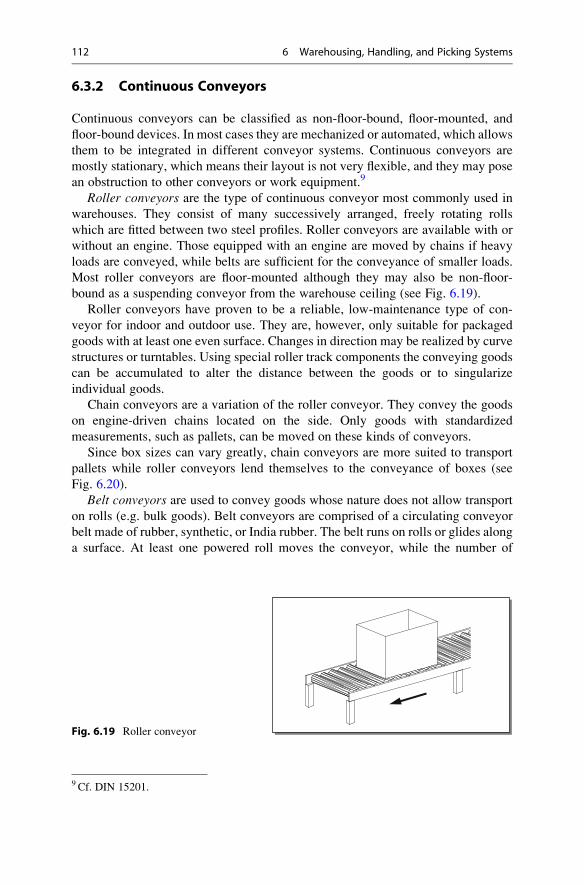
6.3.2 Continuous Conveyors
Continuous conveyors can be classified as non-floor-bound, floor-mounted, and
floor-bound devices. In most cases they are mechanized or automated, which allows
them to be integrated in different conveyor systems. Continuous conveyors are
mostly stationary, which means their layout is not very flexible, and they may pose
an obstruction to other conveyors or work equipment.9
Roller conveyors are the type of continuous conveyor most commonly used in
warehouses. They consist of many successively arranged, freely rotating rolls
which are fitted between two steel profiles. Roller conveyors are available with or
without an engine. Those equipped with an engine are moved by chains if heavy
loads are conveyed, while belts are sufficient for the conveyance of smaller loads.
Most roller conveyors are floor-mounted although they may also be non-floor-
bound as a suspending conveyor from the warehouse ceiling (see Fig. 6.19).
Roller conveyors have proven to be a reliable, low-maintenance type of con-
veyor for indoor and outdoor use. They are, however, only suitable for packaged
goods with at least one even surface. Changes in direction may be realized by curve
structures or turntables. Using special roller track components the conveying goods
can be accumulated to alter the distance between the goods or to singularize
individual goods.
Chain conveyors are a variation of the roller conveyor. They convey the goods
on engine-driven chains located on the side. Only goods with standardized
measurements, such as pallets, can be moved on these kinds of conveyors.
Since box sizes can vary greatly, chain conveyors are more suited to transport
pallets while roller conveyors lend themselves to the conveyance of boxes (see
Fig. 6.20).
Belt conveyors are used to convey goods whose nature does not allow transport
on rolls (e.g. bulk goods). Belt conveyors are comprised of a circulating conveyor
belt made of rubber, synthetic, or India rubber. The belt runs on rolls or glides along
a surface. At least one powered roll moves the conveyor, while the number of
Fig. 6.19 Roller conveyor
9 Cf. DIN 15201.
112 6 Warehousing, Handling, and Picking Systems

powered rolls is dependent on the length and weight of the conveying good (see
Fig. 6.21).
Belt conveyors generally reach higher speeds than roller conveyors. What is
more, the dampening effect of the conveyor belt as well as the missing relative
motion of the conveying good to the conveyor belt result in less noise being
generated. Curves can be formed on the belt conveyor by using tapered rolls.
Conveying routes can be generated by joining several separately powered belt
conveyors together, which makes it possible to accumulate and sort out goods.
The advantages of roller and belt conveyors can be brought together in a
combination of both these conveyor systems. Thus, the more inexpensive roller
conveyors may be used for straight sections while belt conveyors are employed for
curves and slopes since they provide better adhesion for the goods conveyed.
Circular conveyors transport general cargo by means of a suspension gear. The
suspension devices are connected to a permanently running chain. Circular
conveyors may run horizontally, vertically, or ascendingly. Consequently, this
allows for an almost unrestricted layout in path configuration. The suspension
gears can take different forms and may be designed for the particular load to be
handled. Thus, they are available as platforms, trays, boxes, forks, or hooks, to
name but a few.10 At the points of pickup and deposit, the conveyor is pulled
downwards, while for the rest of the conveying path it runs above the work area.
Fig. 6.21 Belt conveyor
Fig. 6.20 Chain conveyor
10 Cf. Bode and Preuß (2004), p. 227.
6.3 Conveyors 113
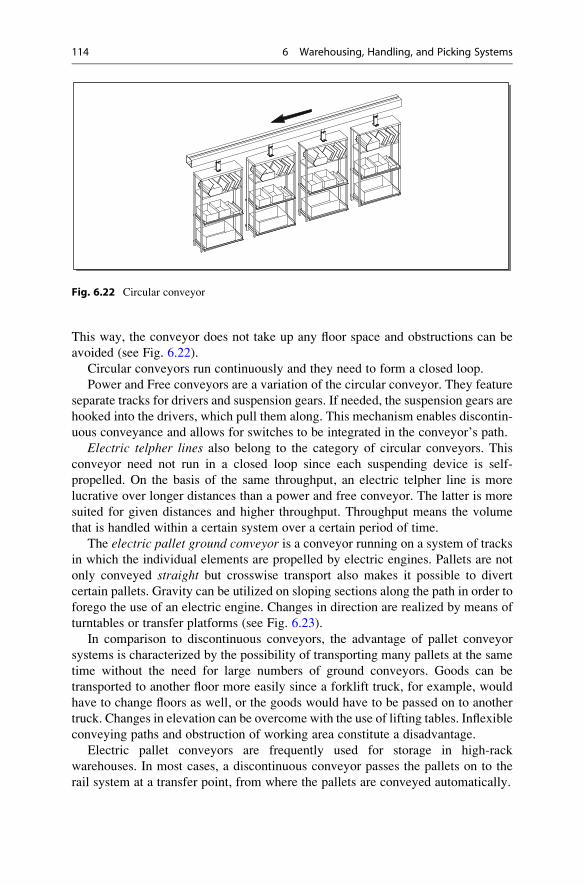
This way, the conveyor does not take up any floor space and obstructions can be
avoided (see Fig. 6.22).
Circular conveyors run continuously and they need to form a closed loop.
Power and Free conveyors are a variation of the circular conveyor. They feature
separate tracks for drivers and suspension gears. If needed, the suspension gears are
hooked into the drivers, which pull them along. This mechanism enables discontin-
uous conveyance and allows for switches to be integrated in the conveyor’s path.
Electric telpher lines also belong to the category of circular conveyors. This
conveyor need not run in a closed loop since each suspending device is self-
propelled. On the basis of the same throughput, an electric telpher line is more
lucrative over longer distances than a power and free conveyor. The latter is more
suited for given distances and higher throughput. Throughput means the volume
that is handled within a certain system over a certain period of time.
The electric pallet ground conveyor is a conveyor running on a system of tracks
in which the individual elements are propelled by electric engines. Pallets are not
only conveyed straight but crosswise transport also makes it possible to divert
certain pallets. Gravity can be utilized on sloping sections along the path in order to
forego the use of an electric engine. Changes in direction are realized by means of
turntables or transfer platforms (see Fig. 6.23).
In comparison to discontinuous conveyors, the advantage of pallet conveyor
systems is characterized by the possibility of transporting many pallets at the same
time without the need for large numbers of ground conveyors. Goods can be
transported to another floor more easily since a forklift truck, for example, would
have to change floors as well, or the goods would have to be passed on to another
truck. Changes in elevation can be overcome with the use of lifting tables. Inflexible
conveying paths and obstruction of working area constitute a disadvantage.
Electric pallet conveyors are frequently used for storage in high-rack
warehouses. In most cases, a discontinuous conveyor passes the pallets on to the
rail system at a transfer point, from where the pallets are conveyed automatically.
Fig. 6.22 Circular conveyor
114 6 Warehousing, Handling, and Picking Systems
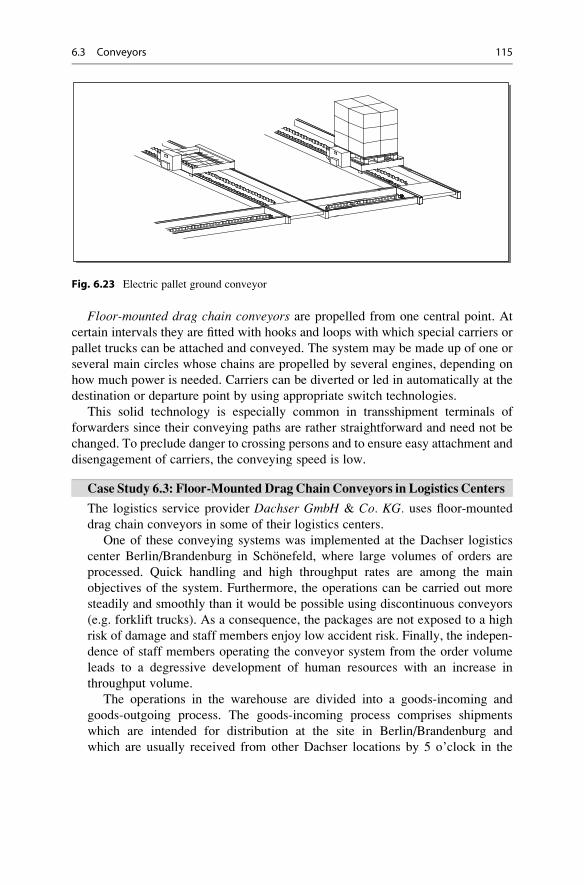
Floor-mounted drag chain conveyors are propelled from one central point. At
certain intervals they are fitted with hooks and loops with which special carriers or
pallet trucks can be attached and conveyed. The system may be made up of one or
several main circles whose chains are propelled by several engines, depending on
how much power is needed. Carriers can be diverted or led in automatically at the
destination or departure point by using appropriate switch technologies.
This solid technology is especially common in transshipment terminals of
forwarders since their conveying paths are rather straightforward and need not be
changed. To preclude danger to crossing persons and to ensure easy attachment and
disengagement of carriers, the conveying speed is low.
Case Study 6.3: Floor-Mounted Drag Chain Conveyors in Logistics Centers
The logistics service provider Dachser GmbH & Co. KG. uses floor-mounted
drag chain conveyors in some of their logistics centers.
One of these conveying systems was implemented at the Dachser logistics
center Berlin/Brandenburg in Schonefeld, where large volumes of orders are
processed. Quick handling and high throughput rates are among the main
objectives of the system. Furthermore, the operations can be carried out more
steadily and smoothly than it would be possible using discontinuous conveyors
(e.g. forklift trucks). As a consequence, the packages are not exposed to a high
risk of damage and staff members enjoy low accident risk. Finally, the indepen-
dence of staff members operating the conveyor system from the order volume
leads to a degressive development of human resources with an increase in
throughput volume.
The operations in the warehouse are divided into a goods-incoming and
goods-outgoing process. The goods-incoming process comprises shipments
which are intended for distribution at the site in Berlin/Brandenburg and
which are usually received from other Dachser locations by 5 o’clock in the
Fig. 6.23 Electric pallet ground conveyor
6.3 Conveyors 115
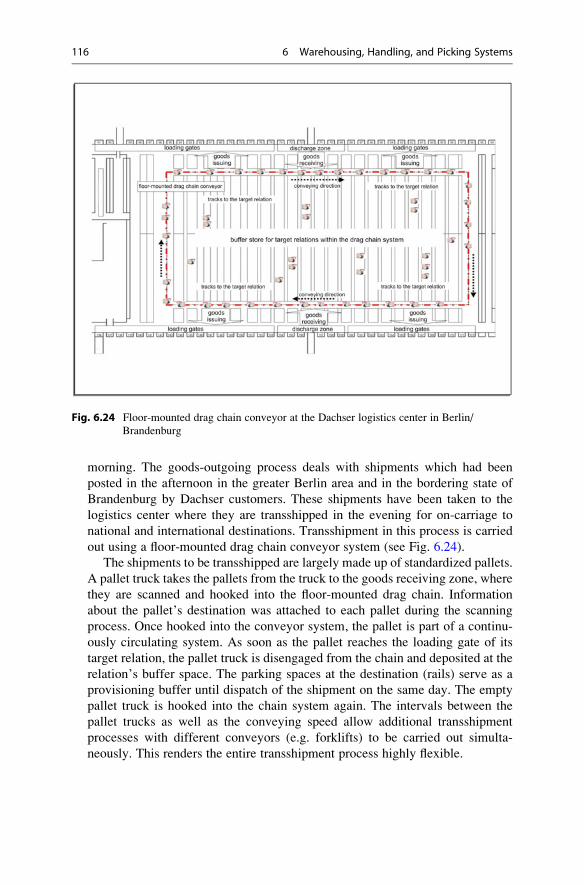
morning. The goods-outgoing process deals with shipments which had been
posted in the afternoon in the greater Berlin area and in the bordering state of
Brandenburg by Dachser customers. These shipments have been taken to the
logistics center where they are transshipped in the evening for on-carriage to
national and international destinations. Transshipment in this process is carried
out using a floor-mounted drag chain conveyor system (see Fig. 6.24).
The shipments to be transshipped are largely made up of standardized pallets.
A pallet truck takes the pallets from the truck to the goods receiving zone, where
they are scanned and hooked into the floor-mounted drag chain. Information
about the pallet’s destination was attached to each pallet during the scanning
process. Once hooked into the conveyor system, the pallet is part of a continu-
ously circulating system. As soon as the pallet reaches the loading gate of its
target relation, the pallet truck is disengaged from the chain and deposited at the
relation’s buffer space. The parking spaces at the destination (rails) serve as a
provisioning buffer until dispatch of the shipment on the same day. The empty
pallet truck is hooked into the chain system again. The intervals between the
pallet trucks as well as the conveying speed allow additional transshipment
processes with different conveyors (e.g. forklifts) to be carried out simulta-
neously. This renders the entire transshipment process highly flexible.
Fig. 6.24 Floor-mounted drag chain conveyor at the Dachser logistics center in Berlin/
Brandenburg
116 6 Warehousing, Handling, and Picking Systems

6.3.3 Sorters
Sorters are used to separate and sort goods while using conveying technologies.
Several sorter types are described in the following.
Push sorters are hydraulic push or pull arms which are installed above the
conveyor belt. They push or pull the conveying goods towards chutes that are
attached to the conveyor. The fact that they can also be added on to the conveyor at
a later point and their compatibility with roller as well as belt conveyors is
advantageous. The hydraulically operated pushers generate a high level of noise.
Only sturdy goods can be sorted using this technique due to the pusher’s high
impact speed onto the goods, which also depends on the conveying speed.
Tilt-tray sorters have platforms that can be tilted to one side. These platforms are
tilted so that the goods can slide down laterally under the force of gravity.
Conveying goods may be fed in or discharged at any point of the conveyor. To
this end, appropriate transfer or collecting equipment needs to be installed (see
Fig. 6.25).
Tilt tray sorters do not require a separate conveyor, it is an integrated conveyor-
sorter type. The goods are already separated on the conveyor or sorter before the
handling process and can thus be deposited at their destination in a quick and
accurate way. Problems may arise for goods with high friction since the tilting
mechanism works in the same way for all goods. Tilt-tray sorters are very well
suited for transporting robust, medium-weight goods. To achieve higher curve
speeds, the trays may be tilted in the curves or the side walls could be molded
into a bowl-shape.
A crossbelt sorter is a conveyor belt with traverse belt-trays, which are moved
by an electric engine upon passing the discharge position, thus discharging the
conveying good (see Fig. 6.26).
To avoid tipping of the goods, their bottom side should be flat due to the traction
impacting on it. The conveyor’s construction is not suitable for the transport of
heavy goods. It is, however, supremely suited to be used in e.g. mail order
companies, owing to its low noise generation and positioning accuracy if little
traction is impacting on the goods.
Sliding sorters or slat sorters offer high-performance sorting of a variety of
goods. This type of sorter consists of a slat conveyor – mostly made of extruded
Fig. 6.25 Tilt-tray sorter
6.3 Conveyors 117
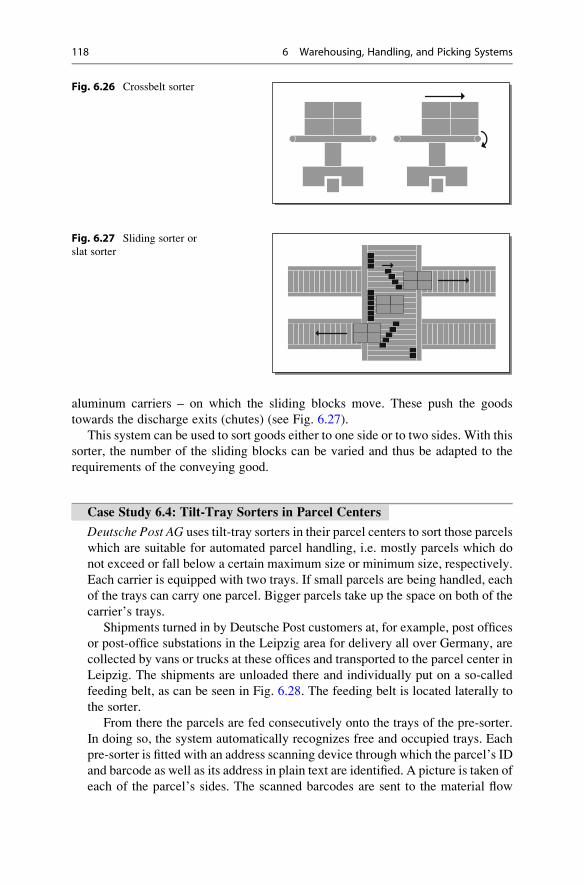
aluminum carriers – on which the sliding blocks move. These push the goods
towards the discharge exits (chutes) (see Fig. 6.27).
This system can be used to sort goods either to one side or to two sides. With this
sorter, the number of the sliding blocks can be varied and thus be adapted to the
requirements of the conveying good.
Case Study 6.4: Tilt-Tray Sorters in Parcel Centers
Deutsche Post AG uses tilt-tray sorters in their parcel centers to sort those parcels
which are suitable for automated parcel handling, i.e. mostly parcels which do
not exceed or fall below a certain maximum size or minimum size, respectively.
Each carrier is equipped with two trays. If small parcels are being handled, each
of the trays can carry one parcel. Bigger parcels take up the space on both of the
carrier’s trays.
Shipments turned in by Deutsche Post customers at, for example, post offices
or post-office substations in the Leipzig area for delivery all over Germany, are
collected by vans or trucks at these offices and transported to the parcel center in
Leipzig. The shipments are unloaded there and individually put on a so-called
feeding belt, as can be seen in Fig. 6.28. The feeding belt is located laterally to
the sorter.
From there the parcels are fed consecutively onto the trays of the pre-sorter.
In doing so, the system automatically recognizes free and occupied trays. Each
pre-sorter is fitted with an address scanning device through which the parcel’s ID
and barcode as well as its address in plain text are identified. A picture is taken of
each of the parcel’s sides. The scanned barcodes are sent to the material flow
Fig. 6.26 Crossbelt sorter
Fig. 6.27 Sliding sorter or
slat sorter
118 6 Warehousing, Handling, and Picking Systems

computer (controller) while the delivery address, i.e. ZIP code, street, and house
number are identified using the plain text. As soon as the material flow computer
has identified the destination, it sends a feedback to the address scanner, which
then terminates the process and deletes the picture. On the pre-sorter, the tray ID
is then associated with the destination and discharge onto one of the connecting
belts is determined.
After discharge onto one of the connecting belts, the parcels are conveyed
onto a main sorter where they are scanned. The ID code and tray number are then
sent to the material flow computer which confirms the destination. Subsequently,
the computer decides which control system will trigger which tray to tilt the
parcel into the exit chute. The tilting mechanism is triggered by an electronic
contact prompting a discharge ramp to fold by which the tray is then tilted. The
main sorters supply all terminal points in the parcel center. Shipments to other
parcel centers are loaded onto swap bodies for on-carriage. Shipments for the
center’s own delivery district are loaded onto roller containers, which are then
transported to the delivery bases.
Similar sorters are used at the destination centers with which the parcels are
distributed to smaller delivery regions of the area.
6.4 Packages, Loading Units, and Load Carriers
The packaging of goods and the formation of packages serve more than purely
logistical functions.11 The packaging primarily has a protective function to preservethe goods in a saleable state and to prevent damage or spoilage. The storage andtransport function enables the movement of goods within the logistics process.
The identification and informational function of the packaging supports the
controlling of goods. This kind of data may be attached to the packaging in plain
Fig. 6.28 Transition from feeding belt to tilt-tray sorter
11 Cf. Jansen (1989), p. 79.
6.4 Packages, Loading Units, and Load Carriers 119
text, as barcodes, or using a RFID data carrier. Barcodes, which are used for
identification, are made up of an opto-electronic script of lines that vary in thick-
ness. RFID is a data transmission and storage technique based on radio technology
and is also used for identification purposes. The data can, for example, contain
information about the type of good, the content quantity, sender and receiver,
weight, volume and handling instructions (fragility, cooling, information for instal-
lation etc.).
The sales function is especially relevant for consumer goods. Thus, it should
contain buying stimulation to encourage customers to pick up the packaged item
from the shelf. This includes advertisements, price, colorful packaging, or interest-
ing shapes.
Finally, the packing sometimes also fulfills a usage function. This is mainly the
case in the consumer goods sector, where e.g. food is consumed directly out of the
packaging. The packaging also serves a usage function if goods are directly taken
out of their packaging for assembly in production processes or if they are produced
into the packaging.
In order to efficiently handle goods in general and packages or general cargo in
particular, they are consolidated into loading units. Load carriers, such as pallets,
wire-mesh boxes, or containers are generally used to form loading units.
Packaging falls into the broad categories of disposable packaging and reusablepackaging. Disposable packaging is mostly made from cardboard and is designed
for one-time protection during transport since the goods are only in some cases
stored in it as well. Reusable packaging consists of more solid materials, such as
plastics or metal. This type of packaging is characterized by the fact that the goods
need not be taken out of the box during the entire supply chain to the installation
location because the packaging fulfills all of the above mentioned packaging
functions. Another advantage is the significant reduction in waste disposal costs
compared to disposable packing and the environmental aspects associated with it.
Return transport of empty packaging constitutes a disadvantage.
Packaging and loading units are further distinguished as follows.12 Packaging isproduced of packaging materials and serves to wrap up or hold together the
packaged goods in order to render it able to be dispatched, storable and salable.
Loading units are goods which are compounded for handling purposes by a load
carrier. The formation of loading units requires additional effort. The advantages
thus achievable, however, include efficient handling within the transport chain by
forming greater pieces of cargo, cost-efficient usability of means of storage,
conveyance, traffic and handling, as well as a general reduction of costs in the
flow of materials and enhanced delivery service.
As mentioned before, one way of forming loading units is the use of pallets.Load-carrying pallets come in different forms, measurements and materials. Within
Europe, the most common types of pallets are the euro pallet measuring
0.8 � 1.2 m and the industrial pallet, which measures 1 � 1.2 m (see Fig. 6.29).
12 Cf. DIN 55405.
120 6 Warehousing, Handling, and Picking Systems
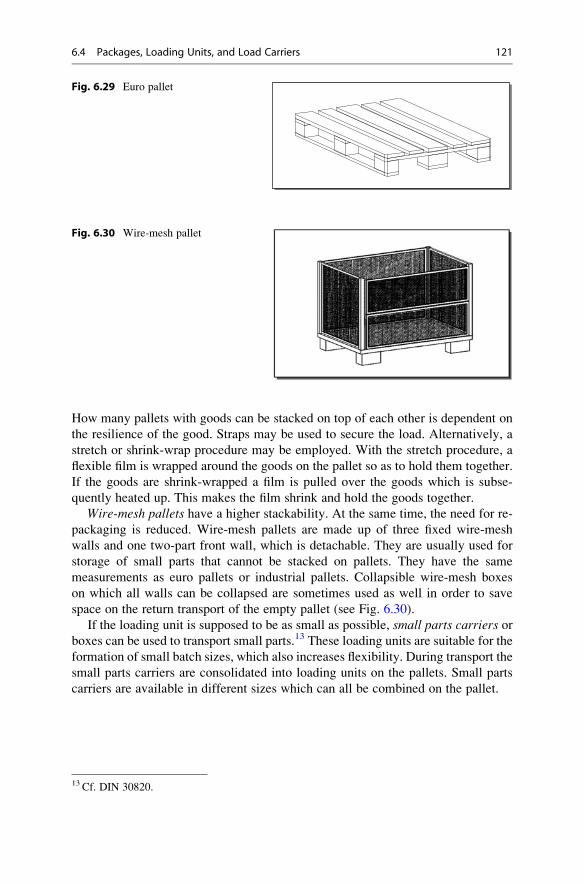
How many pallets with goods can be stacked on top of each other is dependent on
the resilience of the good. Straps may be used to secure the load. Alternatively, a
stretch or shrink-wrap procedure may be employed. With the stretch procedure, a
flexible film is wrapped around the goods on the pallet so as to hold them together.
If the goods are shrink-wrapped a film is pulled over the goods which is subse-
quently heated up. This makes the film shrink and hold the goods together.
Wire-mesh pallets have a higher stackability. At the same time, the need for re-
packaging is reduced. Wire-mesh pallets are made up of three fixed wire-mesh
walls and one two-part front wall, which is detachable. They are usually used for
storage of small parts that cannot be stacked on pallets. They have the same
measurements as euro pallets or industrial pallets. Collapsible wire-mesh boxes
on which all walls can be collapsed are sometimes used as well in order to save
space on the return transport of the empty pallet (see Fig. 6.30).
If the loading unit is supposed to be as small as possible, small parts carriers orboxes can be used to transport small parts.13 These loading units are suitable for the
formation of small batch sizes, which also increases flexibility. During transport the
small parts carriers are consolidated into loading units on the pallets. Small parts
carriers are available in different sizes which can all be combined on the pallet.
Fig. 6.29 Euro pallet
Fig. 6.30 Wire-mesh pallet
13 Cf. DIN 30820.
6.4 Packages, Loading Units, and Load Carriers 121
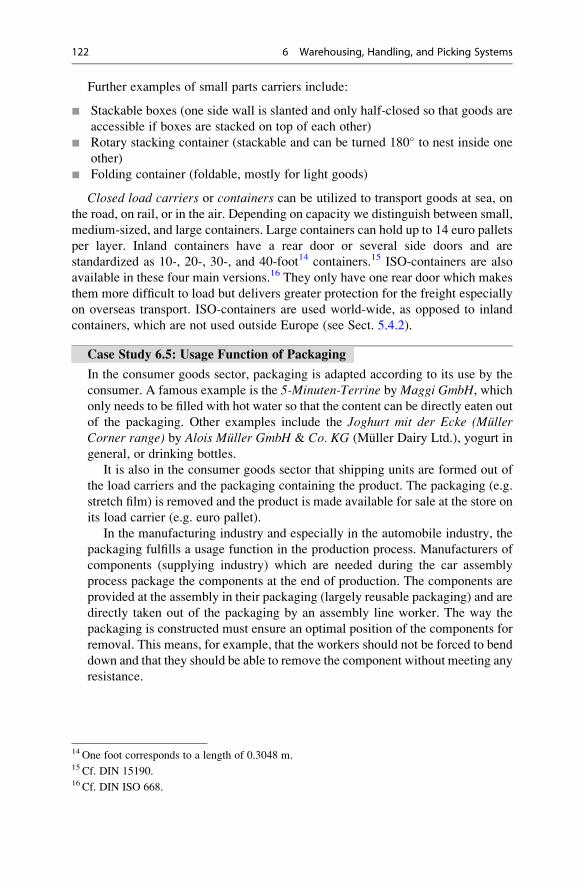
Further examples of small parts carriers include:
¢ Stackable boxes (one side wall is slanted and only half-closed so that goods are
accessible if boxes are stacked on top of each other)
¢ Rotary stacking container (stackable and can be turned 180� to nest inside one
other)
¢ Folding container (foldable, mostly for light goods)
Closed load carriers or containers can be utilized to transport goods at sea, on
the road, on rail, or in the air. Depending on capacity we distinguish between small,
medium-sized, and large containers. Large containers can hold up to 14 euro pallets
per layer. Inland containers have a rear door or several side doors and are
standardized as 10-, 20-, 30-, and 40-foot14 containers.15 ISO-containers are also
available in these four main versions.16 They only have one rear door which makes
them more difficult to load but delivers greater protection for the freight especially
on overseas transport. ISO-containers are used world-wide, as opposed to inland
containers, which are not used outside Europe (see Sect. 5.4.2).
Case Study 6.5: Usage Function of Packaging
In the consumer goods sector, packaging is adapted according to its use by the
consumer. A famous example is the 5-Minuten-Terrine byMaggi GmbH, whichonly needs to be filled with hot water so that the content can be directly eaten out
of the packaging. Other examples include the Joghurt mit der Ecke (MullerCorner range) by Alois Muller GmbH & Co. KG (Muller Dairy Ltd.), yogurt in
general, or drinking bottles.
It is also in the consumer goods sector that shipping units are formed out of
the load carriers and the packaging containing the product. The packaging (e.g.
stretch film) is removed and the product is made available for sale at the store on
its load carrier (e.g. euro pallet).
In the manufacturing industry and especially in the automobile industry, the
packaging fulfills a usage function in the production process. Manufacturers of
components (supplying industry) which are needed during the car assembly
process package the components at the end of production. The components are
provided at the assembly in their packaging (largely reusable packaging) and are
directly taken out of the packaging by an assembly line worker. The way the
packaging is constructed must ensure an optimal position of the components for
removal. This means, for example, that the workers should not be forced to bend
down and that they should be able to remove the component without meeting any
resistance.
14 One foot corresponds to a length of 0.3048 m.15 Cf. DIN 15190.16 Cf. DIN ISO 668.
122 6 Warehousing, Handling, and Picking Systems
6.5 Picking and Handling
The process of taking goods out of the warehouse for compilation of a customer
shipment is called picking. The receiver may be an external customer of the
company or an internal accepting instance (e.g. production). The consumer infor-
mation can be a sales-oriented order (customer order) or a production-oriented one
(internal order). The process of unloading goods from a transport mode into the
goods receiving area of a warehouse, from the goods issuing area of a warehouse
into a transport mode, or from one transport mode into another is termed
transshipment. Transshipment areas, which can be outdoors or indoors, are fre-
quently used to effect transshipment between modes of transport. Additional
picking processes may be carried out during transshipment if the shipments
(packages or load carriers) need to be compiled into amended, customer-specific
shipments. Such facilities are termed transshipment points or cross-docking points.
If goods are also purposefully stored at these transshipment points over a certain
period we speak of distribution warehouses, as described above.
6.5.1 Picking
The process of picking is divided into the sub-systems of organization, materialsflow, and data flow. The organization of sections division can be one-zone or multi-zone. Articles with different properties, e.g. large and small or light and heavy,
should be stored in separate sections to ensure optimal operation by the picking
person. The order may be processed in a single-stage or multi-stage manner. Single-
stage order processing leaves the entire picking process to be implemented by one
picking person while with multi-stage order processing, only one stage is allocated
to one person and the article is passed on for further sorting. Since multi-stage
picking necessitates temporary storage and sorting, it is more suited to be used for
order structures with long throughput times and which are not characterized by
urgent or prioritized orders.
The materials flow is divided into provisioning, movement, withdrawal, and
handing over. Provisioning is either static if the picking person moves towards the
article (man-to-goods) or it is dynamic if the article is brought to the picking person
at a picking workplace (goods-to-man). Movement is effected either on one level or
on several levels using either manual or automated withdrawal techniques. The
article is handed over either at one location (centralized) or at several locations(decentralized) in the warehouse.
The data flow is characterized by data preparation and data transmission. Thedata is prepared either according to order sequence (Order Picking) or in batches
(Batch Picking). In the case of order picking the orders are processed synchronouslyto the order inflow. The processing may be carried out simultaneously or in series
(consecutively). Batch Picking is a way of picking in which the orders are first
collected. Individual items of several orders are subsequently compiled to one
aggregated item. These orders are then allocated to the individual picking sections
6.5 Picking and Handling 123
and processed simultaneously or in series. As a last step, the aggregated orders are
then distributed back to the original orders. This procedure is also called two-step
picking.
Traditionally, we distinguish between electronic data transmission and datatransmission on paper. The use of handheld devices, displays on picking vehicles,
Pick by Voice or Pick by Light renders paperwork unnecessary. With Pick by Voice
the order is transmitted to the picking person via headphones, while Pick by Light
technologies activate small lights at the respective point of withdrawal. Confirma-
tion of the picking order is done actively by the picking person or automatically, forexample by means of an automatic withdrawal confirmation system on the shelf.
Using one picking system or another mainly depends on the range of articles and
the volume of articles to be picked. In general, it seems recommendable to use
single-stage picking systems for a small and homogeneous range of articles or in
cases of little daily throughput. Multi-stage order picking or batch picking is more
suitable for a more heterogeneous article range and higher throughput volumes.
The following outlines several common combinations of picking procedures
resulting from Table 6.1.17 Manual systems with static provisioning, one-
dimensional movement, centralized handover, and manual withdrawal are suited
for small numbers of picking items per day. Using a picking vehicle, the picking
person drives through the aisles and brings the readily picked order back to the
central picking station (see Fig. 6.31).
An extended range of articles would increase the transit times with this picking
procedure. Growing throughput would soon lead to picking persons hindering each
other in the aisles. In order to decrease transit times and to be able to distribute more
picking persons to the aisles, it is more suitable to employ decentralized withdrawal
in conjunction with a conveyor belt instead of picking vehicles (see Fig. 6.32).
The picking person puts the required number of articles into the passing carriers
move e.g. by conveyors. The goods in the carriers are sorted at another location.
Table 6.1 Basic principles of picking systems
Function Possibilities of Realization
Provisioning of articles
Static Dynamic Centralized Decentralized
Movement of picking person
None 1-dimensional 2-dimensional 3-dimensional
manually; mechanically; automatically
Withdrawal of articles
Single item Aggregated item
manually; mechanically; automatically
Handover of articles
Static Dynamic Centralized Decentralized
17 Cf. Gudehus (2010), p. 679 et seq.
124 6 Warehousing, Handling, and Picking Systems
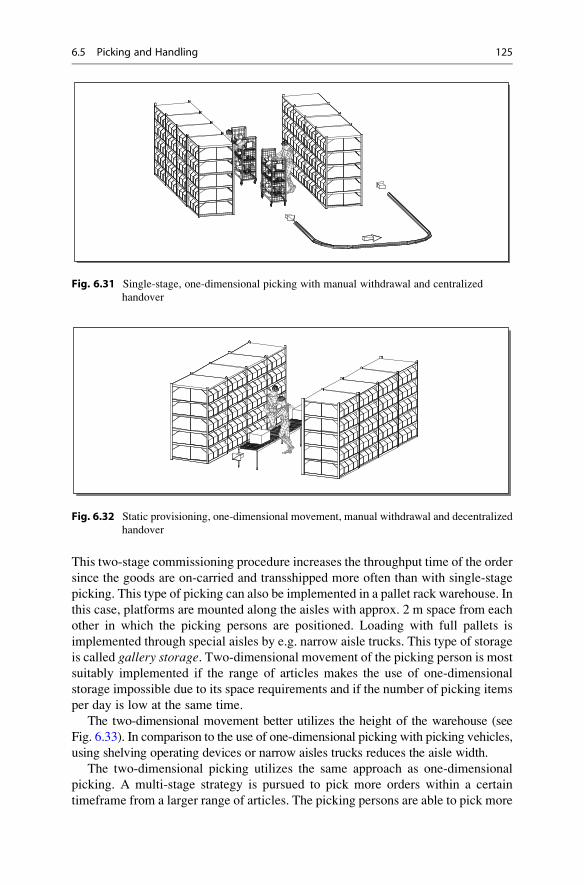
This two-stage commissioning procedure increases the throughput time of the order
since the goods are on-carried and transshipped more often than with single-stage
picking. This type of picking can also be implemented in a pallet rack warehouse. In
this case, platforms are mounted along the aisles with approx. 2 m space from each
other in which the picking persons are positioned. Loading with full pallets is
implemented through special aisles by e.g. narrow aisle trucks. This type of storage
is called gallery storage. Two-dimensional movement of the picking person is most
suitably implemented if the range of articles makes the use of one-dimensional
storage impossible due to its space requirements and if the number of picking items
per day is low at the same time.
The two-dimensional movement better utilizes the height of the warehouse (see
Fig. 6.33). In comparison to the use of one-dimensional picking with picking vehicles,
using shelving operating devices or narrow aisles trucks reduces the aisle width.
The two-dimensional picking utilizes the same approach as one-dimensional
picking. A multi-stage strategy is pursued to pick more orders within a certain
timeframe from a larger range of articles. The picking persons are able to pick more
Fig. 6.31 Single-stage, one-dimensional picking with manual withdrawal and centralized
handover
Fig. 6.32 Static provisioning, one-dimensional movement, manual withdrawal and decentralized
handover
6.5 Picking and Handling 125
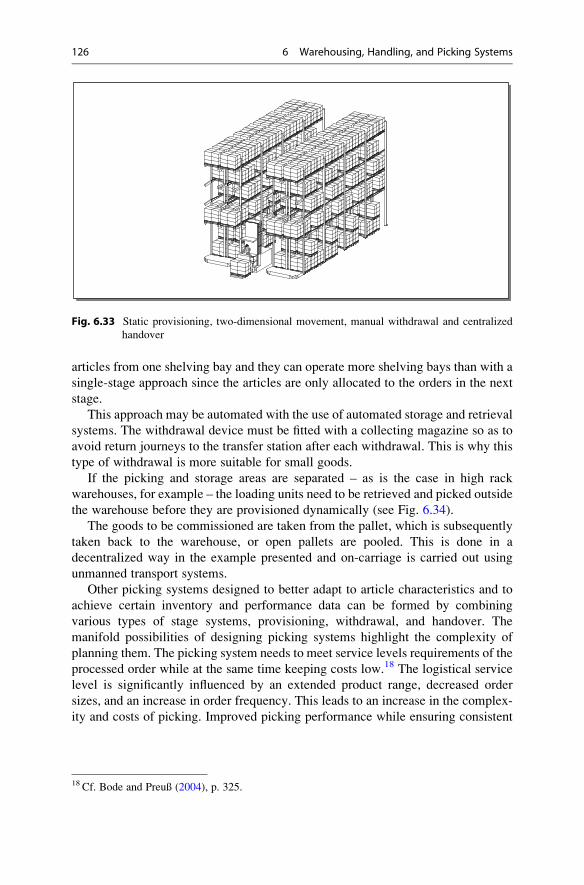
articles from one shelving bay and they can operate more shelving bays than with a
single-stage approach since the articles are only allocated to the orders in the next
stage.
This approach may be automated with the use of automated storage and retrieval
systems. The withdrawal device must be fitted with a collecting magazine so as to
avoid return journeys to the transfer station after each withdrawal. This is why this
type of withdrawal is more suitable for small goods.
If the picking and storage areas are separated – as is the case in high rack
warehouses, for example – the loading units need to be retrieved and picked outside
the warehouse before they are provisioned dynamically (see Fig. 6.34).
The goods to be commissioned are taken from the pallet, which is subsequently
taken back to the warehouse, or open pallets are pooled. This is done in a
decentralized way in the example presented and on-carriage is carried out using
unmanned transport systems.
Other picking systems designed to better adapt to article characteristics and to
achieve certain inventory and performance data can be formed by combining
various types of stage systems, provisioning, withdrawal, and handover. The
manifold possibilities of designing picking systems highlight the complexity of
planning them. The picking system needs to meet service levels requirements of the
processed order while at the same time keeping costs low.18 The logistical service
level is significantly influenced by an extended product range, decreased order
sizes, and an increase in order frequency. This leads to an increase in the complex-
ity and costs of picking. Improved picking performance while ensuring consistent
Fig. 6.33 Static provisioning, two-dimensional movement, manual withdrawal and centralized
handover
18 Cf. Bode and Preuß (2004), p. 325.
126 6 Warehousing, Handling, and Picking Systems
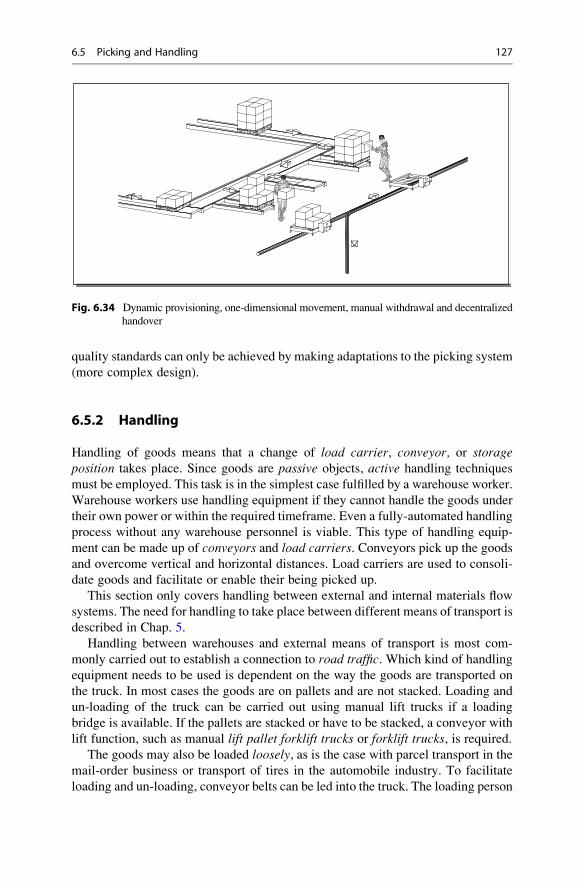
quality standards can only be achieved by making adaptations to the picking system
(more complex design).
6.5.2 Handling
Handling of goods means that a change of load carrier, conveyor, or storageposition takes place. Since goods are passive objects, active handling techniques
must be employed. This task is in the simplest case fulfilled by a warehouse worker.
Warehouse workers use handling equipment if they cannot handle the goods under
their own power or within the required timeframe. Even a fully-automated handling
process without any warehouse personnel is viable. This type of handling equip-
ment can be made up of conveyors and load carriers. Conveyors pick up the goods
and overcome vertical and horizontal distances. Load carriers are used to consoli-
date goods and facilitate or enable their being picked up.
This section only covers handling between external and internal materials flow
systems. The need for handling to take place between different means of transport is
described in Chap. 5.
Handling between warehouses and external means of transport is most com-
monly carried out to establish a connection to road traffic. Which kind of handling
equipment needs to be used is dependent on the way the goods are transported on
the truck. In most cases the goods are on pallets and are not stacked. Loading and
un-loading of the truck can be carried out using manual lift trucks if a loading
bridge is available. If the pallets are stacked or have to be stacked, a conveyor with
lift function, such as manual lift pallet forklift trucks or forklift trucks, is required.The goods may also be loaded loosely, as is the case with parcel transport in the
mail-order business or transport of tires in the automobile industry. To facilitate
loading and un-loading, conveyor belts can be led into the truck. The loading person
Fig. 6.34 Dynamic provisioning, one-dimensional movement, manual withdrawal and decentralized
handover
6.5 Picking and Handling 127

can drag the conveyor to the position of the current workplace and thus avoids
moving in and out of the truck.19
The handling of goods between means of rail transport or inland waterwaytransport and internal materials flow systems is of minor importance for the supply
of most warehouses.
Railroad wagons are always loaded and un-loaded from the side to avoid
decoupling.
Goods that are being transported on inland waterway vessels are usually stored
in containers. At the port, these containers are either loaded onto trucks first, which
enables regular handling in the goods receiving and goods issuing areas, or they are
taken to a loading zone using conveyors.
6.6 Warehouse Organization
Warehouse organization distinguishes between operational warehouse organiza-tion and structural warehouse organization. Operational warehouse organization
defines the temporal and spatial organization of sequences which are also reflected
in the order of warehouse sections that certain goods or parts of goods pass through.
Structural warehouse organization defines work contents and competencies in a
hierarchical structure.
The most important warehouse areas are the goods receiving area, the warehouse
itself, and the goods issuing or outgoing area. The distances leading from the goods
receiving area through the warehouse to the goods issuing area are called circula-
tion area. The aisles between storage locations belong to the circulation area as
well. It is also in this order that goods pass through the warehouse. Areas located in
between these areas may fulfill additional functions. These include picking and
packing areas, quality inspection zones, and provisioning areas in general. In
addition, sanitary and administration areas for staff members must be taken into
account.
The goods receiving and goods outgoing areas constitute an interface between
internal and external traffic and are termed loading zone.The goods receiving area mainly serves to accept the incoming goods and to
forward them to the following warehouse areas (see Sect. 7.3.4). The goods are
either stored or directly forwarded to the goods issuing area (transit area) to leave
the warehouse shortly. Goods which do not meet the quality criteria after inspection
in the goods receiving area are prepared for return shipment and also passed on to
the goods issuing area. Stored articles first need to be compiled into a shipment
(picking) upon receipt of a shipping order before they are taken to the goods issuing
area.
19 Cf. Junemann and Schmidt (2000), p. 290.
128 6 Warehousing, Handling, and Picking Systems
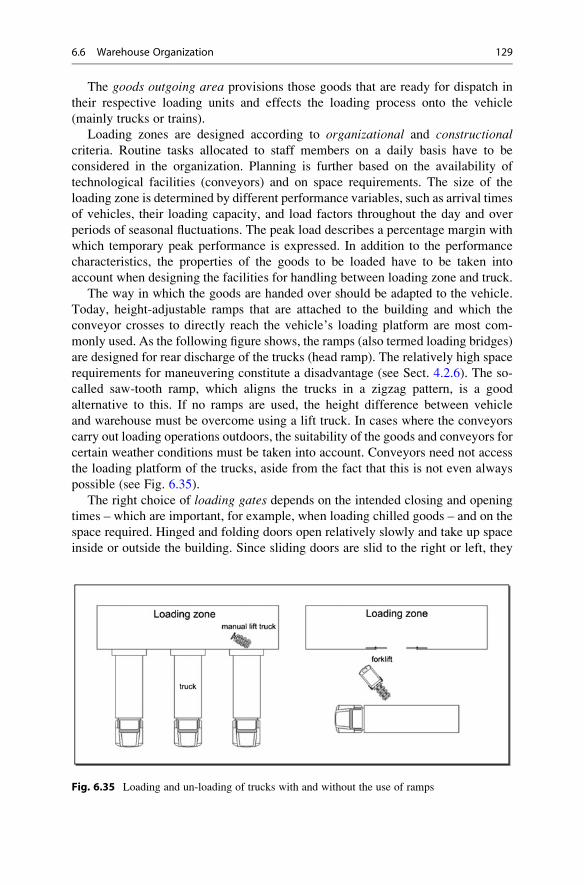
The goods outgoing area provisions those goods that are ready for dispatch in
their respective loading units and effects the loading process onto the vehicle
(mainly trucks or trains).
Loading zones are designed according to organizational and constructionalcriteria. Routine tasks allocated to staff members on a daily basis have to be
considered in the organization. Planning is further based on the availability of
technological facilities (conveyors) and on space requirements. The size of the
loading zone is determined by different performance variables, such as arrival times
of vehicles, their loading capacity, and load factors throughout the day and over
periods of seasonal fluctuations. The peak load describes a percentage margin with
which temporary peak performance is expressed. In addition to the performance
characteristics, the properties of the goods to be loaded have to be taken into
account when designing the facilities for handling between loading zone and truck.
The way in which the goods are handed over should be adapted to the vehicle.
Today, height-adjustable ramps that are attached to the building and which the
conveyor crosses to directly reach the vehicle’s loading platform are most com-
monly used. As the following figure shows, the ramps (also termed loading bridges)
are designed for rear discharge of the trucks (head ramp). The relatively high space
requirements for maneuvering constitute a disadvantage (see Sect. 4.2.6). The so-
called saw-tooth ramp, which aligns the trucks in a zigzag pattern, is a good
alternative to this. If no ramps are used, the height difference between vehicle
and warehouse must be overcome using a lift truck. In cases where the conveyors
carry out loading operations outdoors, the suitability of the goods and conveyors for
certain weather conditions must be taken into account. Conveyors need not access
the loading platform of the trucks, aside from the fact that this is not even always
possible (see Fig. 6.35).
The right choice of loading gates depends on the intended closing and opening
times – which are important, for example, when loading chilled goods – and on the
space required. Hinged and folding doors open relatively slowly and take up space
inside or outside the building. Since sliding doors are slid to the right or left, they
Fig. 6.35 Loading and un-loading of trucks with and without the use of ramps
6.6 Warehouse Organization 129

preclude a dense arrangement of several doors next to each other. Shorter distances
can be realized with roll-up doors or sectional doors as they are pulled overhead
when opened. These door types are used preferentially because they open and close
quickly and do not take up much space.
A complete gate system consists of a loading bridge, a shelter (optional), and of
the door itself. The main purpose of a gate is to enable loading and un-loading of
trucks. Additionally, improved conditions for the protection of the goods can be
achieved with outdoor shelters or temperature and air locks inside the building.
What is more, drafts can be avoided this way, which leads to an improvement of the
working conditions for the loading personnel (see Fig. 6.36).
Gate houses offer the best insulation. They are built in front of the actual gate
opening and contain a loading bridge and a second gate, which creates a tempera-
ture lock.
The most common layouts for goods receiving and goods issuing areas are
shown in the figure below (see Fig. 6.37).
Fig. 6.36 Gate system
Fig. 6.37 Possible goods receiving (ingoing) – goods issuing (outgoing) layouts
130 6 Warehousing, Handling, and Picking Systems

By virtue of their shape, the letters I, U and L imitate the flow of goods. The
I-layout provides for all goods to travel through the entire warehouse. This is also
the layout’s disadvantage since the frequently handled goods have to travel the
same distance as the less frequently handled ones. The straightforward flow of
goods can be seen as an advantage. Both the U-layout and the L-layout enablefrequently handled goods to be stored close the goods receiving and goods outgoing
areas to avoid travels through the entire warehouse. Goods that are supposed to be
moved directly to the goods issuing area without intermediate storage do not have
to pass through the entire warehouse as is the case with an I-layout. The U-layout is
greatly advantageous in that all gates are situated on the same side of the ware-
house. Thus, the space needed for the maneuvering of the trucks is located on one
side and smaller than with the other layouts. By-passes for trucks are therefore not
necessary and the warehouse premises can be kept smaller. Since the traffic takes
place on one side, however, obstructions and confusions of goods receiving and
goods outgoing areas are more likely to occur.
The following describes the organizational design of the actual area where the
goods are stored – the so-called storage zone. Storage zones can be classified
according to various characteristics (also see Sect. 6.2):
¢ Storage temperature (temperature-controlled – heated or chilled – or not tem-
perature-controlled)
¢ Weight and volume of articles
¢ Turnover rate (fast or slow-moving consumer goods, ABC articles)
¢ Property relations of articles (customer, consignment, or customs warehouse)
¢ Degree of hazardousness of article (hazardous goods classification)
¢ Value and fading frequency of articles
Storage zones should not be planned too small to take advantage of synergies.
Neither should they be too large so that the area can be taken in at a glance.
Storage zone management aims at minimizing distances, producing even utili-
zation of existing storage capacity and at avoiding an overaging of the stored goods.
To this end, various strategies for storage space allocation and storage and with-
drawal are available.
With Fixed storage space allocation, each article is allocated a fixed storage
space while the space remains empty if the article is out of stock. Fixed storage
space allocation can theoretically be practiced without the use of IT systems.
Free storage space allocation within fixed areas or storage zones allocates
storage spaces to the article according to its turnover frequency. Articles with a
high turnover rate are located within short reach. In chaotic storage systems, eacharticle is allocated the nearest available storage space or the nearest free storage
space which is best suited for the article.
These strategies may be combined with permission or prohibition of additional
storing in storage spaces that are already partly occupied. If additional storing is
permitted, the age of the articles may be of no relevance. Quantity adjustments upon
withdrawal may be permitted or prohibited. This means that loading units are
opened to comply with the order quantity.
6.6 Warehouse Organization 131
The practicability of withdrawal strategies depends on the storage type used andon the degree of complexity of the storage management. Withdrawal of those
articles that had been stored first is called First In – First Out (FiFo). Live storageshelves, for example, automatically realize a FiFo strategy. Using appropriate
control devices or marking, however, a FiFo strategy can be implemented for any
storage technique. If the most recently stored article is taken out first, we speak of a
Last In – First Out (LiFo) strategy. This strategy is utilized if goods are stored
whose age is irrelevant, e.g. goods that are not subject to a sell-by date.
Apart from FiFo and LiFo, other strategies can be adopted and combined. Thus,
withdrawal may be organized according to the shortest distance to the point of
withdrawal and then be combined into orders with optimized distance coverage.
Furthermore, withdrawal can follow a certain order or is implemented according to
quantity adjustments. For example, withdrawal may be organized according to size
or weight of the articles. In the case of perishable goods it is best to combine the
FiFo principle with the FeFo principle. The FeFo (First Expired – First Out)
principle provides for goods whose sell-by date will be reached next to be
taken out first. Quantity adjustment means that only full or open loading units are
taken out.
Case Study 6.6: Storage Space Requirements
At the goods distribution center of Amazon.de GmbH in Leipzig, articles are re-
ordered according to the following principle. Whenever the stock reaches the
reorder level of three loading units, six loading units are ordered. The loading
unit of one article requires two storage spaces. One loading unit always contains
ten articles. This means that the loading units have to be depleted one after the
other so that 30 articles are left if three loading units are in stock. The following
question needs to be answered in order to assess how the storage space must be
allocated in order to take up the least amount of storage capacity:
How many storage spaces must be made available if
(a) Fixed storage space allocation is implemented and
(b) A chaotic storage strategy has been chosen?
Case Study 6.7: Warehousing Processes
The trading company Gebruder Heinemann KG a distributor of international
brand articles on the travel market and, amongst other things, operates duty-free
shops on airports. Both consolidation and flexibilization of their logistical
activities to international market requirements and their own positive business
development have led to a turnkey-ready logistics center being built in Hamburg
Allermohe with SSI Schafer as the general contractor. The logistics center is oneof the most modern and high-performing ones world-wide. It keeps 35,000
articles in stock with an outgoing tonnage of about 1,000 t per day, which is
equivalent to 85,000 picked boxes (see Fig. 6.38).
132 6 Warehousing, Handling, and Picking Systems
The warehouse is divided into a gallery storage warehouse for pallets, a
container storage warehouse with picking zone, a bay shelving warehouse, and
a tray warehouse.
In the goods receiving area the goods are completely transshipped from the
truck onto conveyors and separated for the different warehouse sections.
Cigarettes, coffee, candy, and spirits are stored on whole pallets in the gallerystorage warehouse. IT-supported quality inspection and labeling of the pallets
are carried out in the goods receiving area. Accurate weighing is especially
important since all inspections of the outgoing goods will be based on
comparisons of weight later on.
The gallery storage warehouse consists of eight aisles, each furnished with
one shelving operating device which stores and retrieves the pallets in the
location allocated to them by the warehouse management system. To achieve
the highest possible storage capacity, the pallets are stored double-deep. The
gallery storage warehouse supplies the various storage and picking areas with
goods. The tray storage warehouse serves to provide whole cartons for direct
withdrawal by the dispatch area or to re-stock the picking area.
High-priced articles, such as perfume, cosmetics, cigars, or articles for
individual picking are transported from the goods receiving area to the second
warehouse level. The articles are separated into system containers at 16
repacking stations. The packed containers undergo a shape control and are
1: Good receiving area
2: Tray warehouse
3: High rack warehouse
4: Container warehouse
5: Bay shelving warehouse
6: Sorter
7: Order consolidation
8: Dispatch area
Fig. 6.38 Warehouse layout Gebr. Heinemann, KG (SSI Schafer (2007))
6.6 Warehouse Organization 133
electronically recorded using a barcode. Conveyors turn the containers in the
right direction and transport them to one of the storage locations allocated by
the warehouse management system within one of the 36 picking zones of the
container storage warehouse. The containers are stored double-deep as well.
Accessories, such as suitcase sets, toys, and designer articles are likewise
separated in the goods receiving area and – analogous to the picking articles –
taken to the second warehouse floor using conveyor technologies and vertical
conveyors. The articles are then distributed manually to the storage locations of
the storage shelves. Goods and storage location are associated with each other
using a barcode reader to enable the warehouse management system to retrieve
the manually stored articles at any time.
The distribution center is designed for approximately 1,600 outgoing pallets
per day. Apart from the dispatch of whole pallets from the gallery storage
warehouse, goods are picked in the individual storage areas, analogous to
storage procedures. The routes of the picking vehicles in the manual storage
areas are optimized by the warehouse management system.
Picking systems have been integrated into four levels of the gallery storage
warehouse to carry out retrieval. Goods pallets are provided for whole-box
picking. The shelving operating devices automatically supply the picking station
according to the stipulated minimum stock levels. These picking stations are
partly dynamic picking stations for slow-moving articles in order to realize a
greater range of articles. The warehouse management system provides the
respective pallets for picking. Once the goods have been picked, the pallets are
re-stored into the gallery store. Double deep pallets with fast-moving articles are
continuously provided at the static picking stations. Whole boxes are picked
manually in the gallery store on the pallets located on the picking vehicles. Staff
members receive all data via a radio data transmission terminal which is attached
to the picking vehicle. Thus, the picking staff can be directed through the
warehouse on optimized routes which take article weights into account. By
means of a control weighing and for the purpose of accurate documentation of
withdrawals and inventory, the pallets undergo a quantity check by weight
comparison both at the beginning and at the end of picking. The picked pallets
are temporarily stored in buffer zones and are combined with the rest of the order
in the dispatch area.
Articles – especially perfume and cosmetics – are picked purely by individual
picking in the bin storage warehouse. The articles are supplied from the 36 silos
of the warehouse by a dynamic picking system. In order to pick the articles, the
warehouse management system requests a box that is adapted to the picking
volume. An order label is attached to the box, which associates the box with the
transport tray through a barcode. The tray with the box on it then travels through
the picking warehouse fully automatically. Depending on the goods to be picked
the tray is diverted at the respective picking station where the articles are stored
and provisioned in a time-efficient way. The tray’s diversion prompts the
shelving operating device to trigger the immediate transport of the storage
container with the requested articles from the storage zone to the provisioning
134 6 Warehousing, Handling, and Picking Systems
zone. Static and dynamic picking stations provide the respective articles for
picking. Picking can now take place at 77 picking points. The box is sorted out
by means of a radio scanner. Subsequently, all picking items and picking
quantities are indicated by a pick-to-light installation at the point of picking.
Using these indications and the data from the radio terminal, the picking person
can now compose the articles. The picking process is confirmed and triggers a
control weight mechanism along with a booking in the system. By means of a
variance analysis, the system determines the contents of the box. After picking is
finished, the staff member pushes the tray with the box back onto the conveyor.
The tray is then transported to the next picking station where picking continues.
If the picking order is completed, the box is discharged from the container
storage warehouse. A continuous scale checks the order once again during this
process. All picked orders are transported to a control terminal. If any
discrepancies are detected, the staff member at the control station is informed
and performs a manual check. Incorrect pickings are fed back into picking cycle
through the conveyor for completion. The conveyor system carries the inspected
boxes on to the tray collection point. The trays are collected and led back into the
system. The picked boxes go through a strapping machine, after which the
conveyor transports them to the sorter.
Picking from the assortment of accessories and slow-moving articles takes
place in the bay shelving warehouse. By means of multi-order picking, up to
eight orders can be processed at the same time. The picking list to do so is given
to the staff members through mobile hand terminals. Depending on the article
and order, whole boxes may be retrieved in the tray warehouse. The goods are
then repacked from the boxes into cartons. The content is recorded and checked
by scanning the EAN code. After attachment of a dispatch label, the cartons are
transported to the sorter.
Cartons from the automated picking warehouse and from the bay shelving
warehouse are conveyed to a sorting machine for initial order combination in the
dispatch area. They are sorted there according to orders and customers or
destinations and then discharged through the respective chute. Staff members
at the chutes compile the cartons on a pallet. Upon completion of the palletiza-
tion, the warehouse management system checks whether the pallet weight is
correct, in another control weighing. Pallets from the perfumes and accessories
area are then transported to the goods issuing area. The warehouse management
system determines whether a pallet goes directly through the shrinking machine
to the allocated loading gate or if it should be collected at a loading station in the
loading area, together with the pallets from the gallery storage warehouse. Staff
members from the loading zone decide how they would like to load the goods
onto the matching pallets and communicate their decision to the warehouse
management system via radio scanner. Subsequently, another control weighing
takes place to avoid loading mistakes. On the way to the dispatch area the pallets
are secured by an automated pallet shrinking station. Within a live storage
system, four transfer carriages then distribute the pallets to gravity roller
conveyors for dispatch. From there, the shipments are loaded onto the trucks.
This way, up to 100 trucks are sent off with goods on a daily basis.
6.6 Warehouse Organization 135
The extremely complex movements of goods are managed and comprehen-
sively monitored by SSI Schafer’s warehouse management system named ant®.
ant® controls all processes from the goods receiving area to the goods issuingarea and manages the data transfer between shelving operating devices, picking
persons and mobile radio terminals. Its main objective is exact trip management
of the trucks to the gates as well as just-in-time actuation of retrieval processes
so that loading times can strictly be adhered by and the loading zones do not
become blocked as a consequence of early order provisioning. Ongoing checks
and inventory management through numerous weighings and the resulting
reduction of shortages to under 1 % only become possible through the use of
an advanced management system. Additionally, the use of state-of-the-art visu-
alization technologies makes it possible to clearly visualize the processes and
movements of materials.
136 6 Warehousing, Handling, and Picking Systems

Review Questions
1. Explain the basic functions of a warehouse.
2. Name the areas in which continuous and discontinuous conveyors can each
be applied.
3. What steps would you take in designing a system for reusable packing and
what must be taken into consideration?
4. Assuming a throughput of 1,000 items per day, is single-stage manual
picking or multi-stage automated picking more suitably implemented?
5. Allowances for a possible expansion of storage capacities should always be
made. Which provisions can be taken in the choice of the warehouse location
and storage technology?
6. Name possible ways to secure palletized loading units.
7. Name the advantages and disadvantages of unmanned transport systems and
the resulting task areas.
8. According to what criteria would you determine the use of stackers?
9. What needs to be considered when opting for a type of sorter?
10. What possibilities do we have to design and equip a warehouse as flexibly as
possible?
Additional Literature
Ackerman, K. B. (1997). Practical handbook of warehousing (4th ed.). Alphen aan den Rijn:
Kluwer Academic.
Arnold, D., Kuhn, A., Isermann, H., & Tempelmeier, H. (2002). Logistik. Heidelberg: Springer.
Bode, W., & Preuß, R. (2004). Intralogistik in der Praxis: Komplettanbieter der Intralogistik.Suhl. Wirtschaftsverlag.
Fischer, W., & Dittrich, L. (2003). Materialfluss und Logistik. Optimierungspotenziale im Trans-port- und Lagerwesen. Berlin: Springer.
Frazelle, E. (2002). World-class warehousing and materials handling. New York: McGraw-Hill.
Gudehus, T. (2010). Logistik (3. Edition). Berlin: Springer.Junemann, R., & Schmidt, T. (2000). Materialflusssysteme: Systemtechnische Grundlagen
(2. Edition). Heidelberg: Springer.
Additional Literature 137

Inventory, Stock and ProvisioningManagement 7
Learning Objectives
Inventory management, stock management, and provisioning management play
an important role in logistics. On the one hand, they directly influence the
delivery service. On the other hand, inventory costs are a significant cost driver
in the supply chains.
This chapter aims to present different approaches to inventory and order
planning as well as to the application of established warehousing strategies, of
fundamental principles of provisioning, and of procurement-logistical concepts.
Furthermore, different approaches in developing cooperative inventory manage-
ment strategies within the supply chains will be discussed. From this the reader
will get comprehensive references in order to meet the challenge between high
product availability and low inventory (costs).
Keywords
¢ Function of inventory
¢ Demand-oriented (pull) or action-oriented (pull) supply of goods
¢ Availability versus destocking
¢ Warehousing strategies
¢ ABC analysis
¢ Just in time/Just in sequence
¢ ECR, VMI, CPFR
¢ Regional freight carrier concept
¢ Cooperation concepts
H. Gleissner and J.C. Femerling, Logistics, Springer Texts in Business and Economics,
DOI 10.1007/978-3-319-01769-3_7, # Springer International Publishing Switzerland 2013
139
7.1 Inventory Basics
7.1.1 Contents and Objectives
Inventory management, stock management, and provisioning management servelogistical purposes and purposes related to warehousing. The objective of
warehousing theory is to minimize the total inventory costs, order costs, and
delivery costs. The basic aim is the reduction of stock and the depletion of safety
stock. To this end, decisions regarding order sizes, order dates, and delivery dates
have to be made; usually by the material planning department. Other points of
consideration include stock-keeping of inventory and delivery.The logistical aim of inventory management is to optimize the entire supply
chain across the different stages to adequately serve the demand. Problems may
arise as a result of this multi-stage structure and due to the isolated and often
uncoordinated flows of goods at the different stages of the supply and distribution
chain. This is owing to the fact that stocks are kept at all these stages to meet the
demand of the subsequent stage.
Depending on its position in the value chain, inventory can comprise material
goods (raw, auxiliary, and operating materials), intermediate, or semi-finished
products (parts, components, modules), or finished products (end products). Players
in the supply chain are producers who manufacture ready-for-sale end products.
Suppliers produce parts, components, and modules and can therefore be categorized
as parts suppliers, component suppliers, module suppliers, or system suppliers. The
end products are offered to the consumers through different distribution and sales
channels, such as trading enterprises, wholesale stores, and retail stores. Thus,
procurement organs and procurement logistics as well as distribution organs and
the associated distribution logistics play a part in the value chain.
7.1.2 Determination of Requirements
There are three traditional methods available for the determination of materialdemand:
¢ Deterministic methods, where the requirements are calculated based on the
production program
¢ Stochastic methods, which make use of consumption statistics and forecasts
¢ Heuristic methods, which allow to make inferences as to the requirements by
means of comparisons with similar products (analogous estimation) or intuitive
estimations without relying on numerical data
The kind of raw materials and parts required and the point in time for their
procurement can be derived from the determination of requirements based on the
types of requirements shown in Fig. 7.1.
Primary demand is dependent upon external factors, such as fluctuations in
demand, the state of the economy, or seasonal demand and can therefore hardly
140 7 Inventory, Stock and Provisioning Management
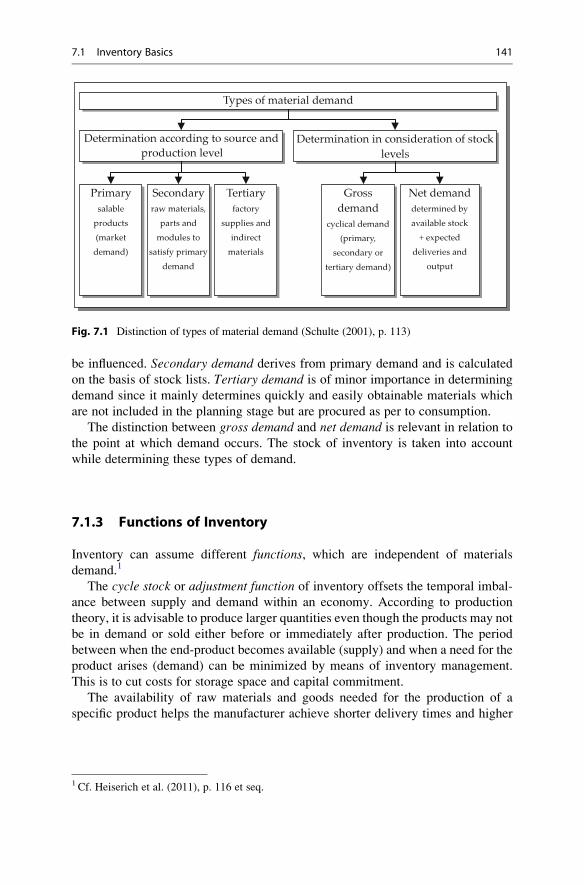
be influenced. Secondary demand derives from primary demand and is calculated
on the basis of stock lists. Tertiary demand is of minor importance in determining
demand since it mainly determines quickly and easily obtainable materials which
are not included in the planning stage but are procured as per to consumption.
The distinction between gross demand and net demand is relevant in relation to
the point at which demand occurs. The stock of inventory is taken into account
while determining these types of demand.
7.1.3 Functions of Inventory
Inventory can assume different functions, which are independent of materials
demand.1
The cycle stock or adjustment function of inventory offsets the temporal imbal-
ance between supply and demand within an economy. According to production
theory, it is advisable to produce larger quantities even though the products may not
be in demand or sold either before or immediately after production. The period
between when the end-product becomes available (supply) and when a need for the
product arises (demand) can be minimized by means of inventory management.
This is to cut costs for storage space and capital commitment.
The availability of raw materials and goods needed for the production of a
specific product helps the manufacturer achieve shorter delivery times and higher
Fig. 7.1 Distinction of types of material demand (Schulte (2001), p. 113)
1 Cf. Heiserich et al. (2011), p. 116 et seq.
7.1 Inventory Basics 141

flexibility to meet different customer requirements. This is referred to as the
acquisition function of inventory.
Inventory allows Economies of scale to be collected if the purchasing depart-
ment manages to obtain quantity discounts and favorable terms of transport through
consolidation.
Another function of inventory is the safety stock function. In this case, stock is
kept to ensure the availability of goods at all times. This is important, for example,
in the procurement process so that production need not be discontinued if suppliers
are unable to provide raw materials or semi-finished goods in time or if delivery is
delayed due to busy transport networks or inclement weather conditions. On the
other hand, sudden fluctuations in demand may be offset using safety stocks.
Without influencing the production process, unsold goods may be kept as inventory
in warehouses. Conversely, if sales are above average, demand can be met using
inventory stocks and sales shortfalls may thus be avoided.
Furthermore, inventory has a function of speculation. Through stock-keeping
and the availability of storage capacities, it becomes possible to purchase goods
today even if they will only be needed later for production or resale. Such decisions
may be economically sensible if market prices are low (e.g. with promotional
offers) or if prices are likely to increase in the future (e.g. if prices for raw materials
go up or if demand increases).
It is only through the refinement function of inventory that certain products
become salable after production. Examples of this are typical ripening processes
of food and drinks.
Finally, inventories may serve to ensure consistent quality for products that hail
from different provenances (place of origin, production series etc.). In these cases,
inventory takes on an assortment function.2
7.1.4 Inventory Cost
Keeping inventory stocks entails inventory costs in the form of storage costs
(building, technology, staff) und inventory carrying costs (capital commitment,
shrinkage, obsolescence). Unavailability of out-of-stock goods leads to production
downtime and drops in sales, which can be classified as out-of-stock costs, sales
shortfalls, and shortfalls in profit margin. The portion of costs and the share in
results that inventory has in the respective reference and target figures can be
determined by material and inventory classification. Probably the most famous
method of inventory classification is the ABC and XYZ analysis. It is the aim of this
2 Cf. Ihde (2001), p. 44 et seq.
142 7 Inventory, Stock and Provisioning Management
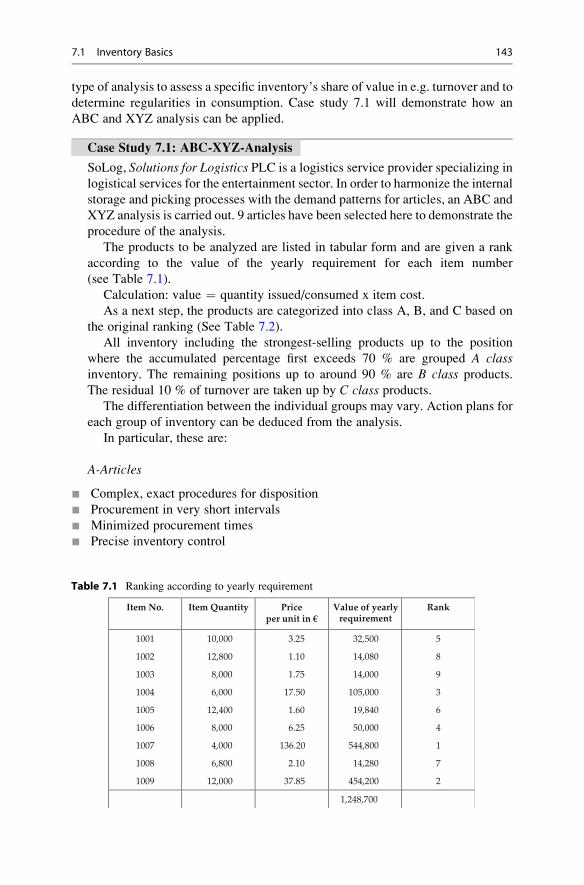
type of analysis to assess a specific inventory’s share of value in e.g. turnover and to
determine regularities in consumption. Case study 7.1 will demonstrate how an
ABC and XYZ analysis can be applied.
Case Study 7.1: ABC-XYZ-Analysis
SoLog, Solutions for Logistics PLC is a logistics service provider specializing in
logistical services for the entertainment sector. In order to harmonize the internal
storage and picking processes with the demand patterns for articles, an ABC and
XYZ analysis is carried out. 9 articles have been selected here to demonstrate the
procedure of the analysis.
The products to be analyzed are listed in tabular form and are given a rank
according to the value of the yearly requirement for each item number
(see Table 7.1).
Calculation: value ¼ quantity issued/consumed x item cost.
As a next step, the products are categorized into class A, B, and C based on
the original ranking (See Table 7.2).
All inventory including the strongest-selling products up to the position
where the accumulated percentage first exceeds 70 % are grouped A classinventory. The remaining positions up to around 90 % are B class products.
The residual 10 % of turnover are taken up by C class products.The differentiation between the individual groups may vary. Action plans for
each group of inventory can be deduced from the analysis.
In particular, these are:
A-Articles
¢ Complex, exact procedures for disposition
¢ Procurement in very short intervals
¢ Minimized procurement times
¢ Precise inventory control
Table 7.1 Ranking according to yearly requirement
Item No. Item Quantity Priceper unit in €
Value of yearly requirement
Rank
1001
1002
1003
1004
1005
1006
1007
1008
1009
10,000
12,800
8,000
6,000
12,400
8,000
4,000
6,800
12,000
3.25
1.10
1.75
17.50
1.60
6.25
136.20
2.10
37.85
32,500
14,080
14,000
105,000
19,840
50,000
544,800
14,280
454,200
5
8
9
3
6
4
1
7
2
1,248,700
7.1 Inventory Basics 143
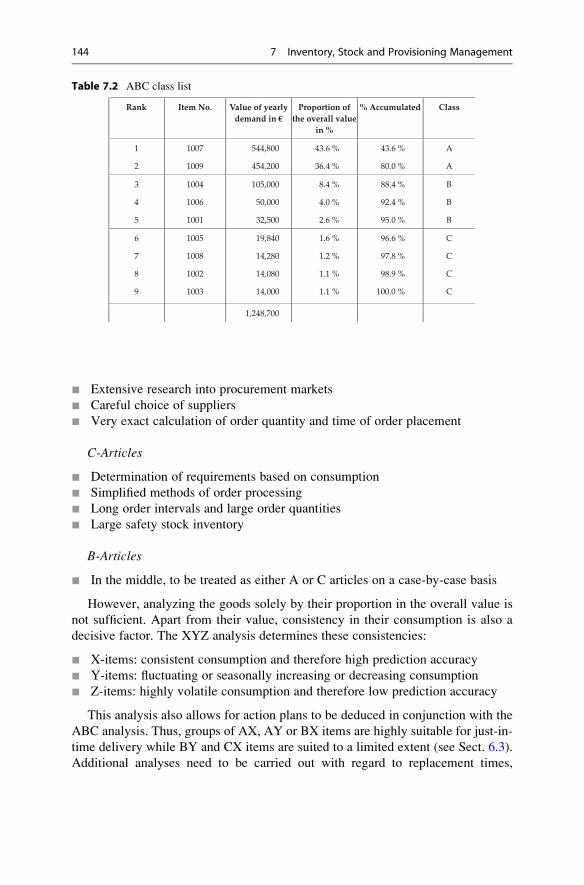
¢ Extensive research into procurement markets
¢ Careful choice of suppliers
¢ Very exact calculation of order quantity and time of order placement
C-Articles
¢ Determination of requirements based on consumption
¢ Simplified methods of order processing
¢ Long order intervals and large order quantities
¢ Large safety stock inventory
B-Articles
¢ In the middle, to be treated as either A or C articles on a case-by-case basis
However, analyzing the goods solely by their proportion in the overall value is
not sufficient. Apart from their value, consistency in their consumption is also a
decisive factor. The XYZ analysis determines these consistencies:
¢ X-items: consistent consumption and therefore high prediction accuracy
¢ Y-items: fluctuating or seasonally increasing or decreasing consumption
¢ Z-items: highly volatile consumption and therefore low prediction accuracy
This analysis also allows for action plans to be deduced in conjunction with the
ABC analysis. Thus, groups of AX, AY or BX items are highly suitable for just-in-
time delivery while BY and CX items are suited to a limited extent (see Sect. 6.3).
Additional analyses need to be carried out with regard to replacement times,
Table 7.2 ABC class list
Rank Item No. Value of yearly demand in €
Proportion of the overall value
in %
% Accumulated Class
1
2
1007
1009
544,800
454,200
43.6 %
36.4 %
43.6 %
80.0 %
A
A
3
4
5
1004
1006
1001
105,000
50,000
32,500
8.4 %
4.0 %
2.6 %
88.4 %
92.4 %
95.0 %
B
B
B
6
7
8
9
1005
1008
1002
1003
19,840
14,280
14,080
14,000
1.6 %
1.2 %
1.1 %
1.1 %
96.6 %
97.8 %
98.9 %
100.0 %
C
C
C
C
1,248,700
144 7 Inventory, Stock and Provisioning Management

frequency of item changes, out-of-stock costs, as well as maximum inventory,
minimum inventory, and safety stock.
7.2 Inventory Planning and Management
7.2.1 Disposition Procedures
In a general sense, disposition is defined as the quantitative arrangement of orders
with their individual service requirements and the scheduled allocation of internal
orders to available resources.3
Disposition is carried out in the procurement of charge materials for production and
in the provision of end-products for trade. A conventional lot size calculation may be
employed to optimize the procurement of materials for production. This determines
the ideal order quantity while taking order and storage costs into account. Scale of
discount, price hikes, and promotional offers etc. may also be factored in.4
In the trade sector dispositioning takes place on certain levels. Central warehouses
may dispose with suppliers, regional warehouses with central warehouses and branch
stores with regional warehouses In so doing, different procedures are implemented
which can generally be broken down into demand-led procedures and program-led
procedures.
Applying Consumption-led disposition, procurement becomes dependent on
demand. This demand is determined by outward materials movements within the
framework of inventory control. Order quantities and time of order placement are
established on the basis of these movements and existing inventory. The producer
then places the order with the supplier. Subsequently, the supplier processes the
order and identifies the order quantity and the delivery date.
Program-led disposition is characterized by its dependency on the production
program. Based on an initial forecast about the future demand of a specific product
(primary demand), the parts and components needed for the production of the end
product are identified (secondary demand). These requirements are then reconciled
with the existing stock inventory (net requirements) so that procurement requirements
(determination of order quantity) and provisioning dates (order scheduling) can be
established.
Another consumption-led disposition procedure is called stochastic disposition.It utilizes forecasting models that are based on past figures. Exponential smoothing,
for instance, is used as a forecasting procedure to visualize trend functions (constantfunctions, linear functions, quadratic functions). This is a recursive calculation of
exponentially smoothed averages for which only the actual demand of the latest
period and the smoothed average of the preceding period are required.5 The effect of
past averages on the new forecast can be altered by means of smoothing parameters.
3 Cf. Gudehus (2010), p. 43.4 Cf. Stolzle et al. (2004), p. 84 et seq.5 Cf. Stolzle et al. (2004), p. 63 et seq.
7.2 Inventory Planning and Management 145

This procedure (exponential smoothing of the first order) is suitable for articles with
stable sales and demand structures. Extraordinary fluctuations in demand triggered
by e.g. seasonality or marketing activities can be taken into account using seasonal
factors (exponential smoothing of the second and third order).6
7.2.2 Warehousing Strategies
Individual demand-led disposition procedures differ with regard to the parameters
used by the manufacturer to determine order quantities and the time of order
placement. These procedures, also termed warehousing strategies, include7:
¢ Order rhythm – lot size (t,q)
¢ Order rhythm – order level (t,S)
¢ Order point – lot size (s,q)
¢ Order point – order level (s,S)
Applying the order rhythm – lot size procedure (also called t-q policy), orders areplaced in regular intervals, which is represented by the parameter t (see Fig. 7.2).
The inventory level is always restocked by the same amount q. Uneven outward
stock movements may lead to highly fluctuating inventory stock levels S. Thus, a
high volume of outward stock movements within a given interval t bears the risk of
inventory shortfall.
Using an order rhythm – order level procedure (also referred to as t-S policy),
orders are placed in set intervals, represented by the parameter t. The inventory is
always restocked up to a pre-defined level S. The capacity limit can therefore never be
exceeded. Due to varying order volumes, suppliers may experience difficulties in
t = constant
q = constant
2t 3t
Time
qq q
t
Inventory level
Fig. 7.2 Warehousing strategies and order policies of the t-q policy
6 Cf. Kernler (2003), p. 65 et seq.7 Cf. Stolzle et al. (2004), p. 91 et seq.
146 7 Inventory, Stock and Provisioning Management
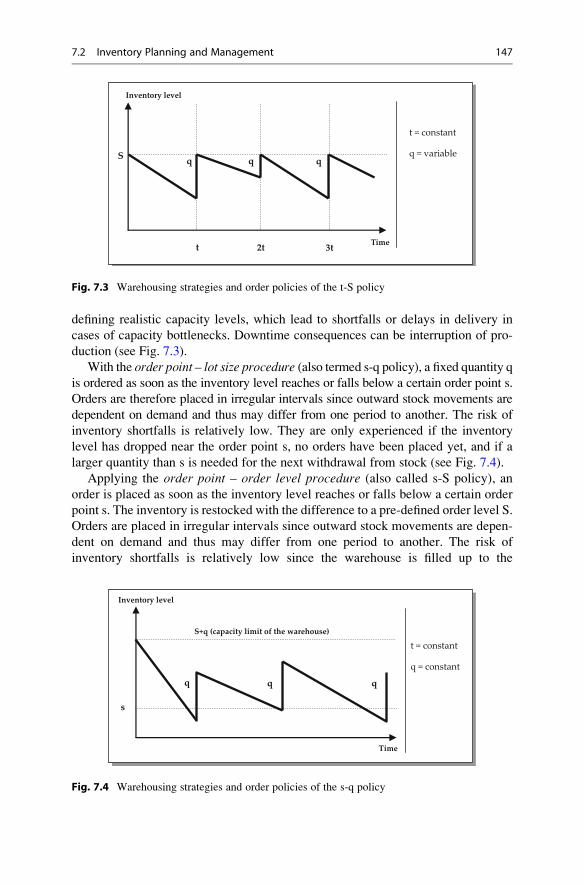
defining realistic capacity levels, which lead to shortfalls or delays in delivery in
cases of capacity bottlenecks. Downtime consequences can be interruption of pro-
duction (see Fig. 7.3).
With the order point – lot size procedure (also termed s-q policy), a fixed quantity q
is ordered as soon as the inventory level reaches or falls below a certain order point s.
Orders are therefore placed in irregular intervals since outward stock movements are
dependent on demand and thus may differ from one period to another. The risk of
inventory shortfalls is relatively low. They are only experienced if the inventory
level has dropped near the order point s, no orders have been placed yet, and if a
larger quantity than s is needed for the next withdrawal from stock (see Fig. 7.4).
Applying the order point – order level procedure (also called s-S policy), an
order is placed as soon as the inventory level reaches or falls below a certain order
point s. The inventory is restocked with the difference to a pre-defined order level S.
Orders are placed in irregular intervals since outward stock movements are depen-
dent on demand and thus may differ from one period to another. The risk of
inventory shortfalls is relatively low since the warehouse is filled up to the
q q q
2t Time
S
Inventory level
t = constant
q = variable
t 3t
Fig. 7.3 Warehousing strategies and order policies of the t-S policy
Time
s
q q q
S+q (capacity limit of the warehouse)
t = constant
q = constant
Inventory level
Fig. 7.4 Warehousing strategies and order policies of the s-q policy
7.2 Inventory Planning and Management 147

maximum level, i.e. high storage costs are deliberately incurred. Analogous to the
order point – lot size procedure, shortfalls may occur if the inventory level has
dropped near to the order point s (see Fig. 7.5).
7.2.3 Safety Stocks
Regardless of the actual demand, each inventory-carrying stage within a supply
chain is planned on the basis of requirements forecasts which, in turn, are based on
previous downstream demand structures. Orders are always triggered if the inven-
tory level drops below a pre-defined order point (see order point procedures) which
should still allow for demand to be met during the replenishment lead time. Since
demand and replenishment lead times are subject to fluctuations, it is necessary to
keep safety stocks.Safety stocks are established based on the service level and on the expected
probability distribution for demand. The precise amount of safety stocks depends
on the extent of forecast errors, expected demand, and on the probability with which
this demand occurs. Safety stocks can be calculated by means of the Gaussian
normal distribution, which standardizes the frequency of deviations from a mean
value. By specifying a certain multiple of the standard deviation, a probability can
be established with which a specific demand can be met by keeping a certain level
of stock. With a service level of 84 %, a safety stock of one standard deviation of the
forecast demand is required. If statistical safety of 97 % is aimed for, a safety stock
of two standard deviations is needed. These statistical safety measures are only
applicable with normally distributed frequency distributions.8
Time
s
S
Inventory level
t = constant
q = variableqqq
Fig. 7.5 Warehousing strategies and order policies of the s-S policy
8 Cf. Alicke (2005), p. 63.
148 7 Inventory, Stock and Provisioning Management

7.3 Provisioning of Goods
7.3.1 Individual Procurement and Bulk Procurement
Individual procurement on demand, in-stock provisioning, and just-in-time provi-
sioning are basic concepts in the provisioning of goods. Individual procurement ondemand is characterized by low stock levels and therefore incurs minimal storage
costs. Risks and disadvantages include delays in production, loss of customers or
turnover, and potentially high purchase prices. In the case of in-stock provisioning orbulk provisioning, goods are kept in stock. Keeping inventory secures the productionprocess or the supply of customers but also incurs high storage and capital commit-
ment costs. On the other hand, purchase discounts may be applicable.
7.3.2 Production Synchronized Provisioning
Using production synchronized provisioning, only the materials needed are pro-
cured and provisioned. This type of provisioning may be employed between two
stages of production, between production and assembly, or between supplier and
assembly.9 A self-managed control circuit governs the internal production and
orders are processed according to current demand and existing inventory levels.
This procedure termed KANBAN (card) is organized de-centrally and utilizes a
production concept based on the pull principle.
The pull principle is a control concept whereby replenishment orders are trig-
gered after demand occurs. With the push principle, however, replenishment orders
are placed according to plan. Applying the KANBAN principle, the self-managed
production or procurement at each upstream stage is set off by the demand of the
ensuing downstream stage. Materials must not be ordered in too large quantities, too
early, or in reserve by the production stage (drain). To realize the potential of the
KANBAN principle for the suppliers (source), they must not produce buffer stock
and they should only initiate production upon receipt of an order while guaranteeing
the flawless quality of the products. The short-term management of production is
passed on to the staff members. Cards are used as part-specific information carriers
between the provisioning unit (source) and the consuming unit (drain).
7.3.3 Just-In-Time Concepts
On the basis of the KANBAN principle – which Toyota developed into an efficient
procedure for production – just-in-time concepts between suppliers and buyers have
emerged.10 High predictability of the demand of the goods is a crucial prerequisite
9 Cf. Schulte (1996), p. 301.10 Cf. Stolzle et al. (2004), p. 133 et seq.
7.3 Provisioning of Goods 149
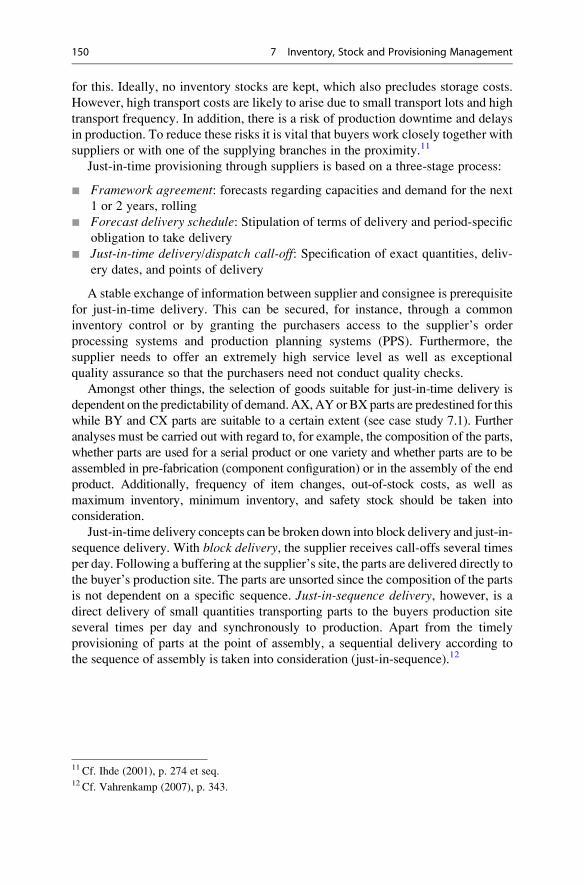
for this. Ideally, no inventory stocks are kept, which also precludes storage costs.
However, high transport costs are likely to arise due to small transport lots and high
transport frequency. In addition, there is a risk of production downtime and delays
in production. To reduce these risks it is vital that buyers work closely together with
suppliers or with one of the supplying branches in the proximity.11
Just-in-time provisioning through suppliers is based on a three-stage process:
¢ Framework agreement: forecasts regarding capacities and demand for the next
1 or 2 years, rolling
¢ Forecast delivery schedule: Stipulation of terms of delivery and period-specific
obligation to take delivery
¢ Just-in-time delivery/dispatch call-off: Specification of exact quantities, deliv-
ery dates, and points of delivery
A stable exchange of information between supplier and consignee is prerequisite
for just-in-time delivery. This can be secured, for instance, through a common
inventory control or by granting the purchasers access to the supplier’s order
processing systems and production planning systems (PPS). Furthermore, the
supplier needs to offer an extremely high service level as well as exceptional
quality assurance so that the purchasers need not conduct quality checks.
Amongst other things, the selection of goods suitable for just-in-time delivery is
dependent on the predictability of demand.AX,AYorBXparts are predestined for this
while BY and CX parts are suitable to a certain extent (see case study 7.1). Further
analyses must be carried out with regard to, for example, the composition of the parts,
whether parts are used for a serial product or one variety and whether parts are to be
assembled in pre-fabrication (component configuration) or in the assembly of the end
product. Additionally, frequency of item changes, out-of-stock costs, as well as
maximum inventory, minimum inventory, and safety stock should be taken into
consideration.
Just-in-time delivery concepts can be broken down into block delivery and just-in-
sequence delivery. With block delivery, the supplier receives call-offs several times
per day. Following a buffering at the supplier’s site, the parts are delivered directly to
the buyer’s production site. The parts are unsorted since the composition of the parts
is not dependent on a specific sequence. Just-in-sequence delivery, however, is adirect delivery of small quantities transporting parts to the buyers production site
several times per day and synchronously to production. Apart from the timely
provisioning of parts at the point of assembly, a sequential delivery according to
the sequence of assembly is taken into consideration (just-in-sequence).12
11 Cf. Ihde (2001), p. 274 et seq.12 Cf. Vahrenkamp (2007), p. 343.
150 7 Inventory, Stock and Provisioning Management
Case Study 7.2: JIT and JIS in the Automobile Industry
Based on volume and value, the VW plant Mosel procures more than 50 % of
its purchased parts through JIT and JIS procedures. The responsibility of the
respective suppliers comprises disposition, container management, and transport,
including provisioning of the components at the point of assembly. The JIS
suppliers are located at a distance of about 30 km from the plant. This makes it
possible to process an order and provision the parts just-in-sequence at the
assembly line within a few hours after the order was placed by the assembly
department at the OEM’s site (VW).
Using this principle, the OEM reduces production costs due to short assembly
and delivery times and as a result of freed-up production areas and production
capacities. This type of provisioning is especially effective withmodules suppliers,
such as chair producers who deliver pre-finished systems (see Chap. 12). The
responsibility of coordinating sub-suppliers is thus passed on to the modules
supplier, which reduces the number of direct contacts. All in all, this can be
regarded as a win-win situation between the OEM and the modules supplier.
Long-term partnerships are forged as a result of a close cooperation. The supplier
benefits by taking over certain proportions of the value added, by gaining know-
how, and therefore by sharpening the competitive edge.
7.3.4 Goods Receiving Functions
Irrespective of individually applied provisioning principles, goods need to be
received physically. This takes place at the goods receiving department whereall operational actions as to receipt, quantity control, and quality control of the
delivered goods take place. In particular, this includes the functions of13:
¢ Receipt of delivery
¢ Comparison of order and delivery data against type of goods delivered, quantity
of goods delivered, and time of delivery
¢ Approval to unload at a specific unloading point
¢ Checking goods during unloading with regard to shortfall quantities and
damages by means of visual inspection
¢ Reporting defects and, if necessary, refusing acceptance and returning goods
¢ Precise quantity control through counting, measuring, weighing, and recording the
results
¢ Comparison of results against delivery documents
¢ Labeling of goods and approval to store
13 Cf. Fortmann/Kallweit (2007), p. 83.
7.3 Provisioning of Goods 151
From a procurement-logistical viewpoint, a great amount of information is
necessary to ensure smooth goods receipt. This includes14:
¢ Categorization of the delivering means of transport according to type, size, and
loading height
¢ Delivery volume and quantity, such as average and maximum volume of
delivery, delivery time, number of deliveries per day
¢ Form of delivery, such as pallets, containers, boxes, or other types of loading
aids
Special importance is placed on the incoming goods inspection since it has to beverified whether the functionality and quality features agreed on with the supplier
have been adhered to. Depending on their extent and thoroughness, quality controls
may take a considerable amount of time, which delays the provisioning of the
incoming goods for production or dispatch. For this reason, the task of carrying out
quality controls is more and more frequently assigned to suppliers. They conduct
these controls using stipulated control parameters, control methods, testing equip-
ment, and rejection criteria.
7.4 Transport, Warehouse, and Location Concepts
7.4.1 Regional Freight Carrier Concept
In addition to the procedures of goods provisioning, numerous transport, ware-house, and location concepts have been established.15 A regional freight carrier isa logistics service provider who organizes the composition and bundling of
shipments from suppliers on behalf of a buyer within a specific area and implements
transport of the shipments to the production site of the consignee.
The buyer determines:
¢ The allocation of the regional freight carrier to the location of the supplier
¢ The processes the supplier should follow at the point of contact with the regional
freight carrier, e.g. scheduling of readiness to dispatch, specification of pickup
notification from supplier to regional freight carrier
¢ Specifications to be observed by the regional freight carrier as to means of
transport, containers, load carriers, timeframe for unloading, and delivery times
The regional freight carrier is responsible for:
¢ Implementation of collection rounds (timetable)
¢ Consolidation of individual shipments at central transit points
14 Cf. Fortmann/Kallweit (2007), p. 85.15 Cf. Stolzle/Gareis (2002), p. 402 et seq.
152 7 Inventory, Stock and Provisioning Management
¢ Transport to consignee in complete, point-to-point shipmentsThe prerequisites for the regional freight carrier concept are:
¢ Delivery conditions ex works, i.e. the regional freight carrier delivers by order ofthe consignee
¢ Suitability of goods for consolidated transport
¢ Limited need for speediness
¢ Negotiable delivery dates and loading times between suppliers
¢ Sufficient spacial concentration of the suppliers
Concentrating on one carrier per collection area facilitates scheduling through
central disposition. This increases the reliability of incoming shipments. Cost
advantages result mainly from the consolidation of goods flows. Bundling a number
of individual shipments into consolidated shipments results in a reduction of traffic
and thus in a decrease both in environmental pollution and transport costs. In
addition, bottlenecks at the buyer’s goods receipt may be avoided and the coordi-
nation of delivery dates can be simplified.16
7.4.2 External Provisioning Warehouse
An external provisioning warehouse serves the purpose of merging input materials
from several suppliers at a jointly managed warehouse.17
The prerequisites for this are:
¢ Horizontal cooperation between suppliers
¢ Consolidation during pre-carriage to the warehouse
¢ Consolidation during on-carriage to the consignee
¢ Consolidation for picking and loading carried out jointly by suppliers
¢ Synchronous delivery
Splitting warehouse costs and (jointly) remunerating the employed logistics
service providers are difficulties in the realization of external just-in-time
warehouses. The advantages are a reduction of traffic, increased reliability due to
geographical proximity, as well as greater suitability for just-in-time or just-in-sequence procedures. Consignment warehouses can be combined with just-in-time
warehouses but are different from them in that they are managed by one supplier.
The supplier stores contractually stipulated inventory stocks in them, from which
the consignee removes the goods in demand. The storage area is normally provided
by the consignee. The goods remain the property of the supplier until removal from
stock. The resulting capital commitment costs are borne by the supplier.
16 Cf. Vahrenkamp (2005), S. 233.17 Cf. Stolzle/Gareis (2002), p. 410.
7.4 Transport, Warehouse, and Location Concepts 153
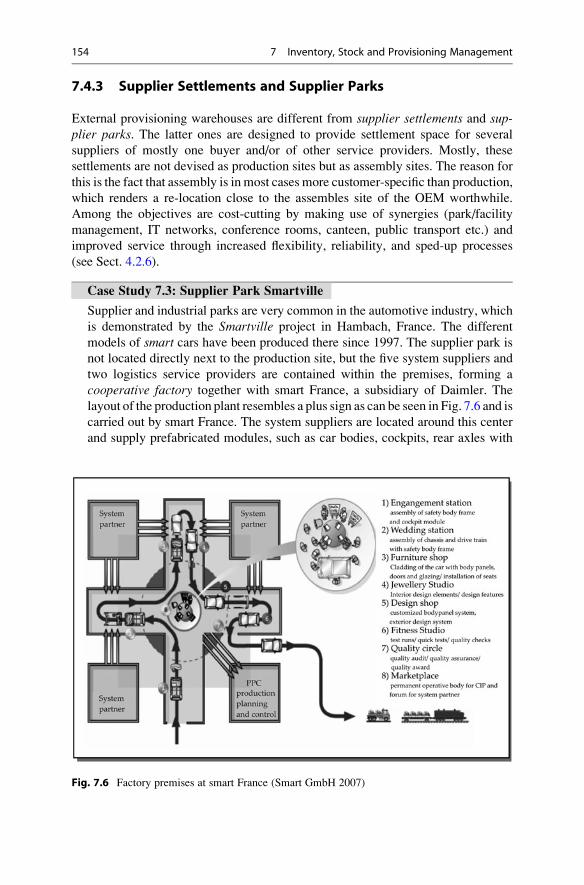
7.4.3 Supplier Settlements and Supplier Parks
External provisioning warehouses are different from supplier settlements and sup-plier parks. The latter ones are designed to provide settlement space for several
suppliers of mostly one buyer and/or of other service providers. Mostly, these
settlements are not devised as production sites but as assembly sites. The reason for
this is the fact that assembly is in most cases more customer-specific than production,
which renders a re-location close to the assembles site of the OEM worthwhile.
Among the objectives are cost-cutting by making use of synergies (park/facility
management, IT networks, conference rooms, canteen, public transport etc.) and
improved service through increased flexibility, reliability, and sped-up processes
(see Sect. 4.2.6).
Case Study 7.3: Supplier Park Smartville
Supplier and industrial parks are very common in the automotive industry, which
is demonstrated by the Smartville project in Hambach, France. The different
models of smart cars have been produced there since 1997. The supplier park is
not located directly next to the production site, but the five system suppliers and
two logistics service providers are contained within the premises, forming a
cooperative factory together with smart France, a subsidiary of Daimler. The
layout of the production plant resembles a plus sign as can be seen in Fig. 7.6 and is
carried out by smart France. The system suppliers are located around this center
and supply prefabricated modules, such as car bodies, cockpits, rear axles with
Fig. 7.6 Factory premises at smart France (Smart GmbH 2007)
154 7 Inventory, Stock and Provisioning Management
drive, front-end modules, doors, and plastic covers directly to the assembly line.
The advantages of this layout are the short distance between supplier and final
assembly as well as the ease of extending the entire structure. Just as on a common
production site, the suppliers located in immediate proximity are integrated in the
production and develop a high sense of responsibility for the processes. Further-
more, by contractual agreement, smart France motivates its partners by encourag-
ing them to make suggestions for improvement of the end product throughout the
entire product life cycle. About 70 % of the materials delivered to the assembly
lines are provisioned by the system suppliers located in Hambach. 20 % of the
remaining materials are delivered by JIT suppliers which facilitates production
with lean inventory. One of these suppliers is the engine factory MDC in Kolleda
(Thuringia). The engines are delivered in swap bodies which dock to the respec-
tive assembly station. Thus, the distance between material removal and point of
assembly hardly exceeds 10 m. The production plant in Berlin is informed at a 3
days notice prior to assembly start in Hambach as to which delivery is required.
This becomes possible by specifying so-called pearl chains, which signal that
from that point on the sequence of production is not changed anymore (see
Sect. 12.2.1). Therefore, Daimler is able to schedule its tours well ahead of time
and utilize its truck capacities to the fullest.
The residual 10 % of the production materials are made up of standard parts
and small parts. These are delivered to a supplier warehouse (consignment
warehouse) where they are buffered for 3–10 days on average. While still in
the warehouse, these parts remain the property of the producer until the logistics
service provider feeds them into the assembly processes.
All modules and bought-in parts generally remain the property of the
suppliers up to a defined counting point at the site in Hambach. Billing is then
carried out based on the requirements and according to the parts list. This renders
incoming goods inspection unnecessary since the supplier carries the responsi-
bility for the delivery date and the quality of the goods up to the point of
assembly. Hence, smart France produces without keeping any inventory. This
takes inventory risks off smart France and direct capital commitment costs can
be avoided.
Having the five main suppliers on site reduces the risk of supply bottlenecks
due to delivery problems such as traffic jams and so forth.
7.5 Cooperation Concepts of Inventory and ProvisioningManagement
7.5.1 Efficient Consumer Response
Apart from requirements planning and management, different forms of cooperation
between suppliers and producers or between producers and the trade sector are
becoming more and more important for the optimization of inventory along logis-
tics chains.
7.5 Cooperation Concepts of Inventory and Provisioning Management 155

Efficient Consumer Response (ECR) is a cross-company approach to optimize
flows of goods, information, and cash with the aim of an overall optimization of the
system including suppliers, producers, the trade sector, and end consumers. The
focus is on increasing the efficiency and productivity of the entire value chain and
not that of individual links in the chain. To this end, cooperative partnerships are
forged between producers and the trade sector for efficient replenishment, efficient
promotion, efficient assortment and efficient product introduction.18 In particular,
this calls for cooperation concepts in logistics (Supply Chain Management, SupplySide) and for cooperation concepts in marketing (Category Management, DemandSide).19 For our purposes we shall focus on the logistical approaches. These
approaches primarily seek to overcome uncoordinated and isolated procedures
along the supply chain, to build mutual trust and understanding, and to disclose
necessary information.
Efficient Replenishment aims at an efficient management of supply. This pull-
system which displays characteristics of just-in-time delivery of industry produc-
tion depends on the actual sales. Its goal is to synchronize the production of the
manufacturers and their suppliers with customer demand by linking all stages in
the supply chain together (customers, trade, headquarters, warehouse, branches,
producers, logistics service providers) within one integrated system. For the
implementation thereof, the instruments of Supply Chain Planning, Supply Chain
Execution, and Supply Chain Event Management are used (see Fig. 7.7):
¢ Supply Chain Planning deals with the planning of logistical resources in
procurement and distribution, such as inventory, delivery, and transport
capacities
¢ Supply Chain Execution supports the operational processes (management and
control), such as order processing, stock management, and transport
¢ Supply Chain Event Management monitors all activities and generates
notifications or warnings in cases of deviations (anomalies in inventory, provi-
sioning process)
Continuous Replenishment Programs (CRP) are geared towards securing direct
and automated replenishment by means of immediate transmission of stock and
inventory data. EDI systems (Electronic Data Interchange) are used for information
exchange since sped-up or partly automated replenishment can be realized by
avoiding media disruptions. Manual entry of data from faxes or emails into ERP
systems would be an example of media disruption.
18 Cf. Heiserich et al. (2011), p. 256 et seq.19 Cf. Hertel et al. (2005), p. 173 et seq.
156 7 Inventory, Stock and Provisioning Management

7.5.2 Vendor Managed Inventory
Along with CRP, Vendor Managed Inventory (VMI) is an ECR strategy which
optimizes replenishment. While planning and management of goods flows has so
far been at the discretion of the trade sector respectively the trade company, we can
now observe that the responsibilities of procurement logistics are increasingly
being assigned to the producers and suppliers. This means that only the producer
makes decisions about delivery rhythms and quantities delivered. The trade sector
and buyers, on the other hand, forego the establishment of delivery quantities and
delivery dates.
The process of Vendor Managed Inventory involves a continuous monitoring of
inventory at the customer’s site (warehouse, branch) and – citing the example of a
producer-vendor relationship – is based on the processing of sales data (scanning
cash register) in retail stores and on the transmission of sales figures and inventory
data to the producer. The sales forecast resulting from this is used as the planning
guideline by the producer. Thus, the producer determines the delivery quantity
based on quotas, order time, and available stocks. An order confirmation is then sent
to the trade company. Order processing and delivery is carried out by the producer
while the inventory level and the inventory range are jointly determined by the
vendor and producer.
A mild form of VMI is Co Managed Inventory (CMI). Here, the trade company
is still responsible for processing the order. The supplier issues suggestions as to the
order, which only have to be confirmed or adapted by the consignee.20 If a VMI
Marketing
ECR
Supply Chain Management Category Management
Efficient Replenishment Efficient Assortment
Efficient Promotion
Efficient Product Intro-
ductionStrategiesContinous ReplenishmentProgramsVMICPFRetc.
ToolsEDISupply Chain PlanningSupply Chain ExecutionSupply Chain Event Managementetc.
Marketing
Fig. 7.7 ECR overview (Cf. Gleißner (2000), p. 101)
20 Cf. Stolzle et al. (2004), p. 143.
7.5 Cooperation Concepts of Inventory and Provisioning Management 157
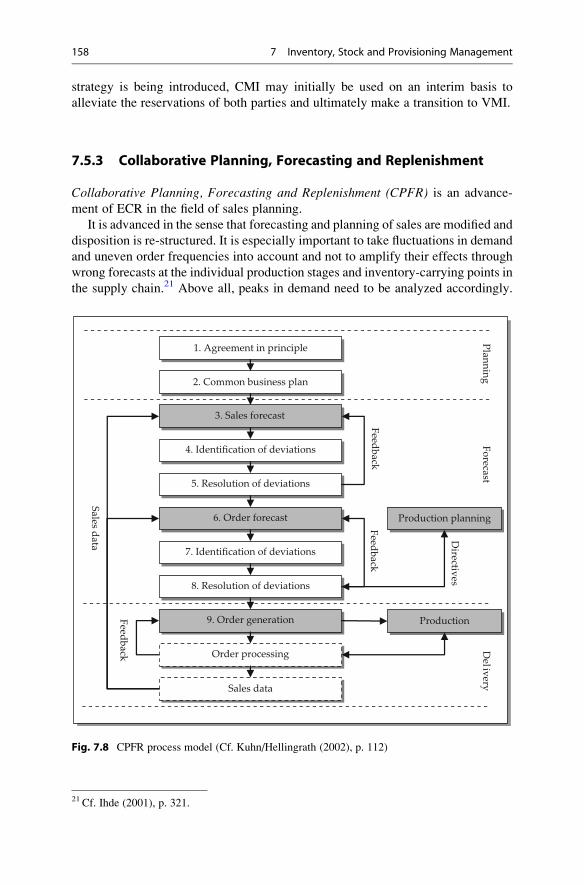
strategy is being introduced, CMI may initially be used on an interim basis to
alleviate the reservations of both parties and ultimately make a transition to VMI.
7.5.3 Collaborative Planning, Forecasting and Replenishment
Collaborative Planning, Forecasting and Replenishment (CPFR) is an advance-
ment of ECR in the field of sales planning.
It is advanced in the sense that forecasting and planning of sales are modified and
disposition is re-structured. It is especially important to take fluctuations in demand
and uneven order frequencies into account and not to amplify their effects through
wrong forecasts at the individual production stages and inventory-carrying points in
the supply chain.21 Above all, peaks in demand need to be analyzed accordingly.
1. Agreement in principle
2. Common business plan
3. Sales forecast
4. Identification of deviations
5. Resolution of deviations
6. Order forecast
7. Identification of deviations
8. Resolution of deviations
9. Order generation
Order processing
Sales data
Production
Production planning
PlanningForecast
Delivery
Sales data
Feedback
FeedbackFeedback
Directives
Fig. 7.8 CPFR process model (Cf. Kuhn/Hellingrath (2002), p. 112)
21 Cf. Ihde (2001), p. 321.
158 7 Inventory, Stock and Provisioning Management

This requires a detailed analysis of past purchase patterns (seasonal influences
throughout the year, weekly trends). Special emphasis therefore lies on the collab-
oration in the forecasting phase, in which the joint handling of critical deviations
turns into a learning process through giving feedback.22 This integrated planning
approach is shown in Fig. 7.8.
Additionally, marketing activities need to be taken into consideration (campaigns,
advertisements). Electronic marketing, electronic market research, and data from
Customer Relationship Management (CRM) systems may help to enrich sales
planning with valuable information. Integrated and improved methods for planning
and disposition as well as shortened cycles facilitate greater availability and thus
more reliable deliveries. In addition, more flexible planning becomes possible since
changes in plan at one stage entail consistent changes at all upstream and downstream
stages.
The following effects can be achieved through improved transparency:
¢ Greater product availability with low stocks
¢ Timely disposition of updated production plans in which changes in plan on the
buyer and supplier side can be taken into account
¢ Quicker reaction to changed customer demand
¢ Higher capacity utilization of transport means through coordination of distribu-
tion plans
Successful implementation of CPFR increases the effectiveness of ECR and/or
VMI. However, both ECR and VMI can be employed independently and do not
require the use of CPFR.
22 Cf. Hertel et al. (2005), p. 197 et seq.
7.5 Cooperation Concepts of Inventory and Provisioning Management 159

Review Questions
1. What are the goals of inventory management?
2. What are the functions of inventory?
3. Name the most important types of inventory costs.
4. What is the difference between order-point procedures and order-rhythm
procedures?
5. What are safety stocks?
6. Define the different principles of goods provisioning?
7. Name the most important approaches of Efficient Consumer Response (ECR).
8. Who employs regional freight carrier concepts and runs external just-in-time
warehouses?
9. Describe the procedures involved in just-in-time concepts.
10. What statements can be made on the basis of ABC and XYZ analyses?
Additional Literature
Alicke, K. (2005). Planung und Betrieb von Logistiknetzwerken: UnternehmensubergreifendesSupply Chain Management. Berlin: Springer.
Arminger, G. (2004). Absatz- und Bestellprognosen im CPFR-Prozess fur den Handel. SupplyChain Management, o. Jg., 2004, Nr. 3, S. 45–52.
Burt, D. N., Petcavage, S., Pinkerton, R. (2009). Supply management. New York: McGraw-Hill.
Cavinato, J. L., Flynn, A. E., & Kauffman, R. G. (2006). The supply management handbook(7th ed.). New York: McGraw-Hill.
Gudehus, T. (2004). Logistik (3rd ed.). Berlin: Springer.
Hahn, D., & Kaufmann, L. (2002). Handbuch Industrielles Beschaffungsmanagement (2nd ed.).
Wiesbaden: Gabler.
Kernler, H. (2007). Logistiknetze: Mit Supply Chain Management erfolgreich kooperieren.Heidelberg: Huthig.
Monczka, R., Handfield, R., Giunipero, L. C., & Patterson, J. L. (2011). Purchasing and supplychain management (5th ed.). Mason: South-Western College Publishing.
Sydow, J., & Mollering, G. (2009). Produktion in Netzwerken: Make, buy & cooperate. Munchen:
Vahlen.
Zipkin, P. J. (2000). Foundations of inventory management. New York: McGraw-Hill.
160 7 Inventory, Stock and Provisioning Management

Logistics Network Planning 8
Learning Objectives
Designing logistics systems means dealing with complex planning and decision
problems. The following chapter will examine details and strategies in logistics
planning with a focus on planning logistics networks, warehouse networks, and
transport networks.
Besides basic structures and configurations of logistics networks, the reader
will be introduced to contemporary concepts of designing transport and storage
networks. These are mainly employed in distribution. As logistics networks are
increasingly being operated by the logistics service providers, this chapter will
highlight aspects of outsourcing, tendering, and selecting transport and logistics
service providers.
Keywords
¢ Planning tasks and details
¢ Logistical goal conflict
¢ Logistics networks and structures
¢ Warehouse network structure
¢ Transport network structure
¢ Cross docking
¢ Capacity planning
¢ Warehouse layout planning
¢ Outsourcing
H. Gleissner and J.C. Femerling, Logistics, Springer Texts in Business and Economics,
DOI 10.1007/978-3-319-01769-3_8, # Springer International Publishing Switzerland 2013
161
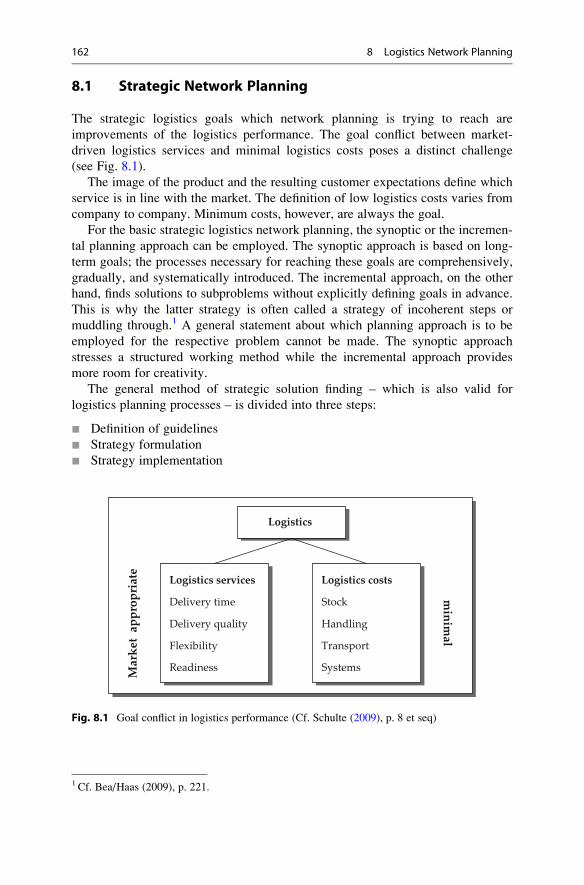
8.1 Strategic Network Planning
The strategic logistics goals which network planning is trying to reach are
improvements of the logistics performance. The goal conflict between market-
driven logistics services and minimal logistics costs poses a distinct challenge
(see Fig. 8.1).
The image of the product and the resulting customer expectations define which
service is in line with the market. The definition of low logistics costs varies from
company to company. Minimum costs, however, are always the goal.
For the basic strategic logistics network planning, the synoptic or the incremen-
tal planning approach can be employed. The synoptic approach is based on long-
term goals; the processes necessary for reaching these goals are comprehensively,
gradually, and systematically introduced. The incremental approach, on the other
hand, finds solutions to subproblems without explicitly defining goals in advance.
This is why the latter strategy is often called a strategy of incoherent steps or
muddling through.1 A general statement about which planning approach is to be
employed for the respective problem cannot be made. The synoptic approach
stresses a structured working method while the incremental approach provides
more room for creativity.
The general method of strategic solution finding – which is also valid for
logistics planning processes – is divided into three steps:
¢ Definition of guidelines
¢ Strategy formulation
¢ Strategy implementation
Logistics
Logistics services
Delivery time
Delivery quality
Flexibility
Readiness
Logistics costs
Stock
Handling
Transport
SystemsMar
ket
appr
opri
ate
minim
al
Fig. 8.1 Goal conflict in logistics performance (Cf. Schulte (2009), p. 8 et seq)
1 Cf. Bea/Haas (2009), p. 221.
162 8 Logistics Network Planning
Guidelines are based on general company goals and values. They are the starting
points for logistical strategy formulation (see Sect. 3.1). The first step is to examine
the company environment to find chances and risks, and the company itself for
strengths and weak points. The results are used to develop different strategic
options from which the preferred logistics strategy is chosen. During the strategyimplementation, strategic programs are created which help to employ the strategy.
The results from implementing the new logistics strategy are compared to the
original goals. If the goal and the result deviate from each other, changes to the
strategy will be made at the beginning of the decision-making process.
The following will give an overview about common logistics network models
and their advantages and disadvantages. They are the basis for strategic planning
processes.
8.2 Overview Logistics Networks
8.2.1 Representation of Logistics Networks
The planning task of logistics and supply chain management is to create the
preconditions for entering new markets, in order to introduce new or existing
products into these markets as successfully as possible. This necessitates the
creation and maintenance of a corresponding logistical infrastructure – i.e. logistics
networks – for procurement, production, and distribution logistics. The following
chapter focuses on the planning of warehouse and transport networks for distribu-
tion logistics.
Logistical networks can be represented using a graph-theoretical representation
of vertices and edges. Vertices represent the realization of physical processes,
e.g. warehousing, handling of goods, or data processing. Edges represent the
installations for transport processes, flow of goods, and information transmission.
Such a net then consists of sources of goods, e.g. manufacturers’ plants, points of
sale of merchant intermediaries, and the locations of consumer demand.
A detailed description of logistical nets is possible by further division into
relevant levels:2
¢ Functional level: Description of tasks for the distribution of goods
(warehousing and transport)
¢ Process level: Details about the number of stages in the process (degree of
fragmentation of the supply chain)
¢ Spatial level: Localization of the logistical process actualization
¢ Institutional level: Aspects of the organizational realization (creation and tasks
of functions and processes)
2 Cf. Stieglitz (1999), p. 91.
8.2 Overview Logistics Networks 163
8.2.2 Domains of Decision Making in the Network Design
Domains of decision making in the network design can be divided – according to
their time horizon and their contents – into strategic, tactical, and operative aspects.
The following planning contents may serve as an example:3
¢ Strategic (long-term)– Problem of gradation: Gradation/function of the vertices
– Problem of locations: Location of the vertices
– Problem of numbers: Number and dimension of the vertices
– Problem of allocation: Allocation of sources of goods and points of con-
sumer demand to the vertices
¢ Tactical (medium-term)– Transport organization
– Allocation of stock and representation of stock size within the network
– Definition of the purchase and supply frequencies
– Definition of the inventory management structure
¢ Operative (day-to-day)– Vehicle employment and route planning
– Definition of the ordered quantities and order times
8.2.3 Structures of Logistics Networks
Regarding the complexity of logistic networks, distinctions can be made between
one-step direct nets, two-step indirect nets, multi-step indirect nets and hybrid, and
combined nets. Figure 8.2 shows examples from consumer goods logistics with
respect to the distribution. These basic structures can also be applied to other fields
(see Sect. 12.2).
3 Cf. Stieglitz (1999), p. 97; Corsten and Gossinger (2007), p. 155 et seq.
164 8 Logistics Network Planning
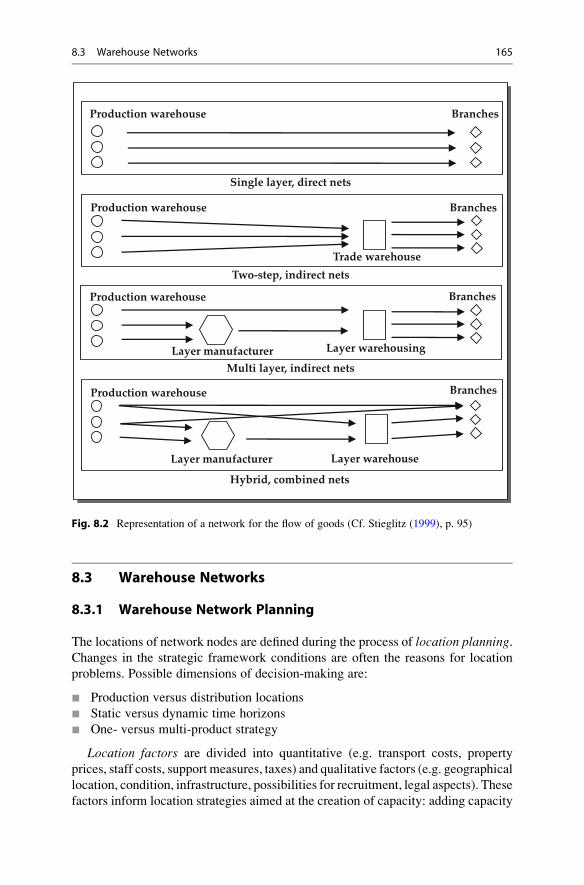
8.3 Warehouse Networks
8.3.1 Warehouse Network Planning
The locations of network nodes are defined during the process of location planning.Changes in the strategic framework conditions are often the reasons for location
problems. Possible dimensions of decision-making are:
¢ Production versus distribution locations
¢ Static versus dynamic time horizons
¢ One- versus multi-product strategy
Location factors are divided into quantitative (e.g. transport costs, property
prices, staff costs, support measures, taxes) and qualitative factors (e.g. geographical
location, condition, infrastructure, possibilities for recruitment, legal aspects). These
factors inform location strategies aimed at the creation of capacity: adding capacity
Production warehouse Branches
Single layer, direct nets
Two-step, indirect nets
Branches
Trade warehouse
Production warehouse
Multi layer, indirect nets
Branches
Layer warehousing
Production warehouse
Layer manufacturer
Hybrid, combined nets
Branches
Layer warehouse
Production warehouse
Layer manufacturer
Fig. 8.2 Representation of a network for the flow of goods (Cf. Stieglitz (1999), p. 95)
8.3 Warehouse Networks 165
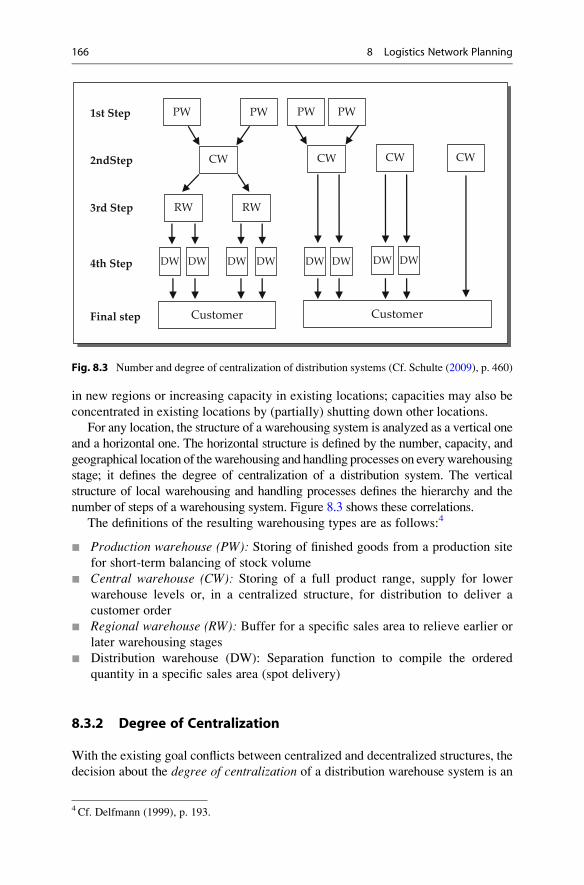
in new regions or increasing capacity in existing locations; capacities may also be
concentrated in existing locations by (partially) shutting down other locations.
For any location, the structure of a warehousing system is analyzed as a vertical one
and a horizontal one. The horizontal structure is defined by the number, capacity, and
geographical location of thewarehousing and handling processes on everywarehousing
stage; it defines the degree of centralization of a distribution system. The vertical
structure of local warehousing and handling processes defines the hierarchy and the
number of steps of a warehousing system. Figure 8.3 shows these correlations.
The definitions of the resulting warehousing types are as follows:4
¢ Production warehouse (PW): Storing of finished goods from a production site
for short-term balancing of stock volume
¢ Central warehouse (CW): Storing of a full product range, supply for lower
warehouse levels or, in a centralized structure, for distribution to deliver a
customer order
¢ Regional warehouse (RW): Buffer for a specific sales area to relieve earlier or
later warehousing stages
¢ Distribution warehouse (DW): Separation function to compile the ordered
quantity in a specific sales area (spot delivery)
8.3.2 Degree of Centralization
With the existing goal conflicts between centralized and decentralized structures, the
decision about the degree of centralization of a distribution warehouse system is an
RW RW
PWPW
CW
DW DW
Customer
DW DW
PWPW
CW
DW DW
Customer
CW
DW DW
CW
1st Step
2ndStep
3rd Step
4th Step
Final step
Fig. 8.3 Number and degree of centralization of distribution systems (Cf. Schulte (2009), p. 460)
4 Cf. Delfmann (1999), p. 193.
166 8 Logistics Network Planning

important one. There are two basic advantages to centralized warehouse concepts:
First, the possible reduction in the number of connections between the points of
delivery and the points of receipt; second, the possibility to considerably reduce the
stock, especially the safety stock. Additional, more efficient warehouse technologies,
e.g. automated, which are only profitable with a large handling volume, can be
employed. This is why for some time there has been a trend to reduce the number of
warehousing stages. Centralization and direct supply to companies is more and more
taking the place of multi-stage decentralized structures.5
Centralization of the warehouse can be achieved by eliminating a full warehouse
level or by reducing the number of warehouses on one level. These measures
lead to a decrease in the density of the warehouse network which means the total
volume of goods is stored in fewer warehouses. This, however, creates a higher
potential for bundling in delivery to warehouses. The catchment areas of the
warehouses – represented e.g. by the average number of branches supplied to by
one warehouse – grow. This results in the average transport distance growing. Onthe contrary, the creation of a decentralized regional warehouse system is opted for
if the delivery time is the most important factor, i.e. in cases where the supply from
a central warehouse to individual regions could only be realized with delivery times
or at delivery costs not tolerated by the market.
A concept often practically applied is selective warehousing. This is a two-levelwarehouse structure in which goods with a low prognosis risks, e.g. fast-moving
goods, are stored in decentralized regional and spot delivery warehouses that do not
carry the full product range. Inventory and B and C articles (slow-moving goods)
are centrally stored to economize the stock (see Fig. 8.4).
5 Cf. Baumgarten and Thoms (2002), p. 53.
Selective storage and deliveryTraditional approach Selective storing
Productionwarehouse
Centralwarehouse
Distributionwarehouse
Customers
A B C
A B C A B C
A B C C
A B C
A BA B C A B C
A B
A B
A, B, C: Products
Fig. 8.4 Concept of selective warehousing (Cf. Schulte (2009), p. 460)
8.3 Warehouse Networks 167
In addition to selective warehousing, further optimization is possible if goods are
delivered from the points on which they are stored without touching warehouses on
earlier or later stages. This is called selective delivery. Both concepts are often
employed in spare parts logistics.
Case Study 8.1: Spare Parts Logistics
The company Bosch und Siemens Hausgerate GmbH (BSHG) manufactures
home appliances. It was founded in 1967 as a joint venture between RobertBosch GmbH and Siemens AG. The company now has 43 plants in 15 countries
in Europe, the USA, Latin America, and Asia.
The basic requirement of fast troubleshooting is an effective spare parts
logistics. It directly becomes a part of customer experience. Therefore it is also
temporarily muchmore coupled to the time of the resale. This insight has inspired
the slogan The first product is sold by the sales department; all further productsare sold by the service. In 2000, the project Total Customer Logistics was started.
The individual steps were gradually implemented by 2005. The foremost goal
was an increase in customer satisfaction while reducing the costs at the same
time. The logistics concept that was created will be shortly introduced.
The global spare parts logistics network is based on the global manufacturing
networks of the product areas. Globally, there are seven central warehouseson four continents. To prevent uneconomical small transport activities, intercon-
tinental moving of goods is consolidated on the central warehouse level. The
flows of goods are clearly defined. The BSHG plants deliver goods only to
the central warehouse assigned to them. One central warehouse is assigned to
the subsidiaries in every country. The BSHG’s largest central spare partswarehouse is located in Furth, Southern Germany. With the introduction of
direct delivery from a central warehouse, it was possible to shut down eight
regional warehouses in seven European countries and 55 customer servicewarehouses in Germany and Austria (see Fig. 8.5).
By now, 800 customer service technicians in Germany, Austria, Belgium, and
the Netherlands receive spare parts overnight directly from the Furth central
warehouse. Orders from German technicians are taken every day until 3 p.m.
After the order-related commissioning, the parts are handed to the transport
company in reusable boxes for delivery by 7 a.m. the next day – directly to the
technician’s vehicle or to another point previously agreed on. Parts not needed
on the previous day are returned. Secondary processes like sorting, disposing,
and new packaging are integrated. Prior to each order, a clear statement is made
which spare part is needed. For this, the stock lists and exploded drawings are
available on the brand homepages, besides a number of general information.
The size of the appliance which is to be repaired determines the logistics
strategy: repair at the customer’s or repair in a workshop. In Europe, more than
2,000 company technicians are responsible for repairing stoves, washing
machines, dish washers, and cooling devices directly in households. Small
appliances, on the other hand, are repaired in central repair workshops to use
the economies of scale of centralization.
168 8 Logistics Network Planning

With this concept, including its effects on the repair and core business,
customer satisfaction could be measurably increased during the last 5 years.
Further market share in the core business could be won and the costs for spare
parts logistics could be lowered by 26 %.
8.3.3 Capacity Planning
The configuration of the warehouse network substantially influences the required
floor space, the spatial and staff capacities, as well as the layout of a warehouse
location. Furthermore, the technical equipment on storage, handling, and sorting
installations and the resulting process organizations must be considered.
The capacities can be divided into qualitative and quantitative aspects. The
qualitative achievement potential of a warehouse location must be in line with
the respective customer and order requirements regarding flexibility and productiv-
ity. Quantitative capacity dimensioning defines which capacities are actually
available for a given period of time. It has to consider the current order volume –
e.g. represented by the number of storage places, the number of orders within a
given period of time, and the chronological demand history – with respect to the
possible monthly, weekly, daily, or shift performance.
Anticipatory capacity planning must also take in account that the spatial
and handling potentials as well as the staff capacity of a warehouse location must
cover different workload volumes. Expected dimensions, ranges, and times of
GermanyNetherlandsBelgiumAustriaItalySlovenia
Sweden:FinlandNorwayDenmarkBaltics
CW
RW
Direct delivery from Central warehouses (CW) Fuerth:
Direct delivery from Regional warehouse (RW)
Fig. 8.5 Logistics network BSHG (BSH GmbH (2005))
8.3 Warehouse Networks 169

demand fluctuations must be part of the planning. Most of all when planning
commissioning capacities, solutions which are balanced between the danger of
too limited capacities – especially during (seasonal) peaks – and the problem
of too small workloads must be found. Staff adjustments to demand fluctuations
are possible with flexible work time models using working time accounts (e.g. for a
full year) and by employing part time and temporary staff. However, possible
negative effects on commissioning quality, productivity, and reliability must be
considered.
The defined processes necessary to realize the desired result are planned in
process organization. The necessary qualitative capacities are largely defined
based on the class and degree of automation of the equipment as well as the
corresponding qualification requirements of the staff. It must be noted that a
possibly desirable high degree of automation, described as the relation between
equipment performance and staff performance, is considerably influenced by the
types of storage and commissioning tasks, the homogeneity of the goods, as well as
the degree of palletization of the packaging. This has effects on the quantitative
capacity characteristics like possible order processing times and performance
features that are, in turn, to be considered for the qualitative capacity planning.
8.3.4 Layout Planning
Besides the projected number of orders or the number of goods to be stored, layoutplanning demands a rough idea of the flow of goods which is influenced, among
others, by the warehouse technology that is employed and by the spatial arrange-
ment of the equipment. Layout planning can be divided into basic and fine layout
planning. In basic planning, the property and building layout is planned based on
the local circumstances. Besides the dimensioning of the full floor space require-
ment, the structuring of the floor space for the warehouse and for the yard
(e.g. parking, waiting, and maneuvering spaces for vehicles and load carriers)
must be planned. Furthermore, enlargement options of the location must be taken
into account. Steps in the building layout planning are: the definition of the number
and the arrangement of gates and ramps; space and room requirements for
discharging, conveying, storing, commissioning, temporary storing; providing
and other functional areas; the spatial arrangement and the shape of the building
which represents the fine layout planning. (see Sect. 4.2.6).
With respect to the floor space capacity of the mentioned functional areas, the
technical equipment of the storing, sorting, and commissioning areas (shelves,
packaging machines, palletizers, lifting trucks, stackers) must be specified, as
well as the staff capacities according to their numbers and necessary qualifications.
The focus of the quantitative dimensioning of e.g. the commissioning capacities
would be planning the staff requirements and deployment. Based on the expected
volume of orders – as seen from the number of orders, number of order items, and
number of pieces per order item within a given period – the number and working
times of the staff, determined by the number and length of the shifts, is defined.
170 8 Logistics Network Planning
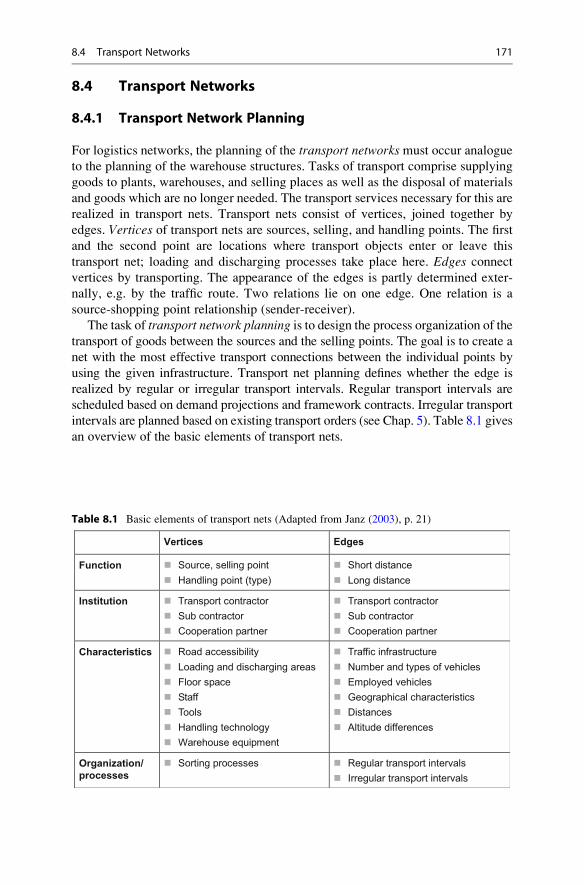
8.4 Transport Networks
8.4.1 Transport Network Planning
For logistics networks, the planning of the transport networks must occur analogue
to the planning of the warehouse structures. Tasks of transport comprise supplying
goods to plants, warehouses, and selling places as well as the disposal of materials
and goods which are no longer needed. The transport services necessary for this are
realized in transport nets. Transport nets consist of vertices, joined together by
edges. Vertices of transport nets are sources, selling, and handling points. The first
and the second point are locations where transport objects enter or leave this
transport net; loading and discharging processes take place here. Edges connect
vertices by transporting. The appearance of the edges is partly determined exter-
nally, e.g. by the traffic route. Two relations lie on one edge. One relation is a
source-shopping point relationship (sender-receiver).
The task of transport network planning is to design the process organization of thetransport of goods between the sources and the selling points. The goal is to create a
net with the most effective transport connections between the individual points by
using the given infrastructure. Transport net planning defines whether the edge is
realized by regular or irregular transport intervals. Regular transport intervals are
scheduled based on demand projections and framework contracts. Irregular transport
intervals are planned based on existing transport orders (see Chap. 5). Table 8.1 gives
an overview of the basic elements of transport nets.
Table 8.1 Basic elements of transport nets (Adapted from Janz (2003), p. 21)
Vertices Edges
Function Source, selling point Handling point (type)
Short distance Long distance
Institution Transport contractor Sub contractor Cooperation partner
Transport contractor Sub contractor Cooperation partner
Characteristics Road accessibility Loading and discharging areas Floor space Staff Tools Handling technology Warehouse equipment
Traffic infrastructure Number and types of vehicles Employed vehicles Geographical characteristics Distances Altitude differences
Organization/processes
Sorting processes Regular transport intervals Irregular transport intervals
8.4 Transport Networks 171
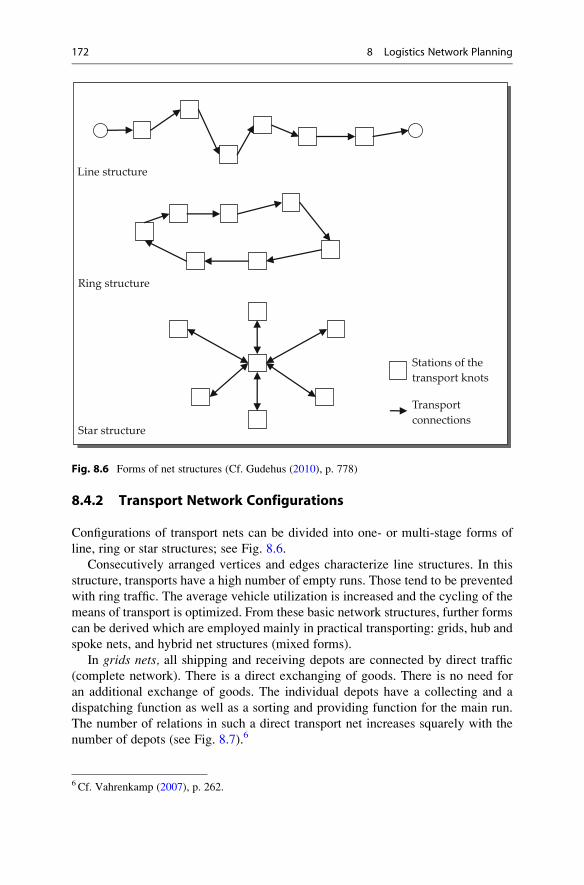
8.4.2 Transport Network Configurations
Configurations of transport nets can be divided into one- or multi-stage forms of
line, ring or star structures; see Fig. 8.6.
Consecutively arranged vertices and edges characterize line structures. In this
structure, transports have a high number of empty runs. Those tend to be prevented
with ring traffic. The average vehicle utilization is increased and the cycling of the
means of transport is optimized. From these basic network structures, further forms
can be derived which are employed mainly in practical transporting: grids, hub and
spoke nets, and hybrid net structures (mixed forms).
In grids nets, all shipping and receiving depots are connected by direct traffic
(complete network). There is a direct exchanging of goods. There is no need for
an additional exchange of goods. The individual depots have a collecting and a
dispatching function as well as a sorting and providing function for the main run.
The number of relations in such a direct transport net increases squarely with the
number of depots (see Fig. 8.7).6
Line structure
Ring structure
Star structure
Stations of the transport knots
Transport connections
Fig. 8.6 Forms of net structures (Cf. Gudehus (2010), p. 778)
6 Cf. Vahrenkamp (2007), p. 262.
172 8 Logistics Network Planning
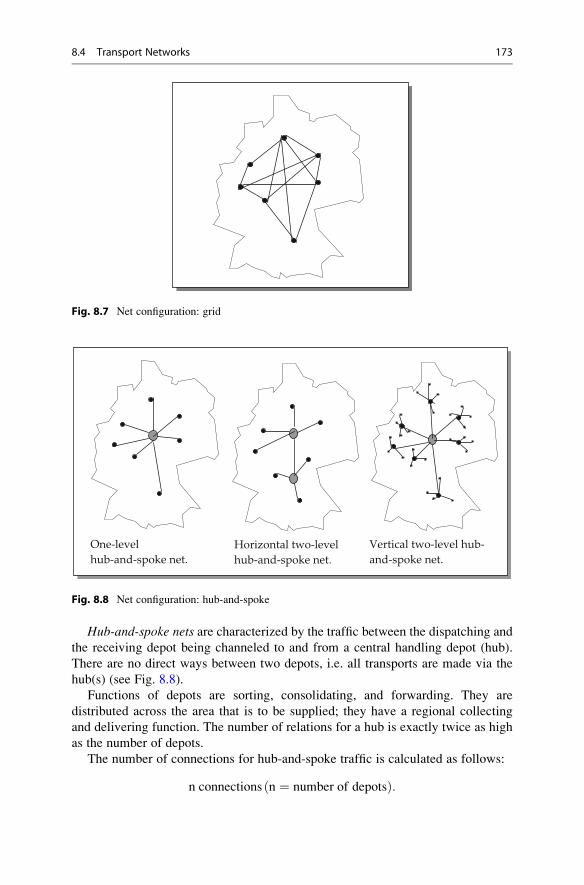
Hub-and-spoke nets are characterized by the traffic between the dispatching andthe receiving depot being channeled to and from a central handling depot (hub).
There are no direct ways between two depots, i.e. all transports are made via the
hub(s) (see Fig. 8.8).
Functions of depots are sorting, consolidating, and forwarding. They are
distributed across the area that is to be supplied; they have a regional collecting
and delivering function. The number of relations for a hub is exactly twice as high
as the number of depots.
The number of connections for hub-and-spoke traffic is calculated as follows:
n connections n ¼ number of depotsð Þ:
One-levelhub-and-spoke net.
Horizontal two-level hub-and-spoke net.
Vertical two-level hub- and-spoke net.
Fig. 8.8 Net configuration: hub-and-spoke
Fig. 8.7 Net configuration: grid
8.4 Transport Networks 173
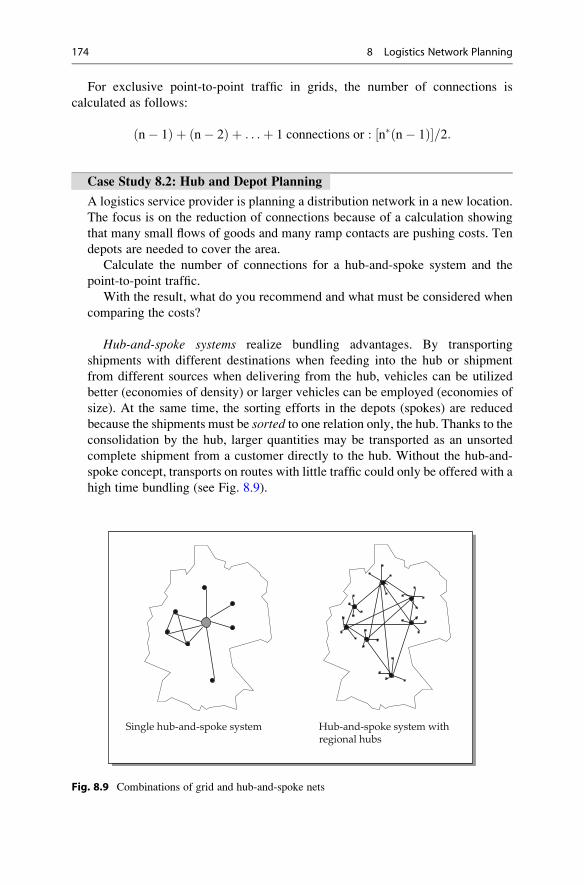
For exclusive point-to-point traffic in grids, the number of connections is
calculated as follows:
n� 1ð Þ þ n� 2ð Þ þ . . .þ 1 connections or : n� n� 1ð Þ½ �=2:
Case Study 8.2: Hub and Depot Planning
A logistics service provider is planning a distribution network in a new location.
The focus is on the reduction of connections because of a calculation showing
that many small flows of goods and many ramp contacts are pushing costs. Ten
depots are needed to cover the area.
Calculate the number of connections for a hub-and-spoke system and the
point-to-point traffic.
With the result, what do you recommend and what must be considered when
comparing the costs?
Hub-and-spoke systems realize bundling advantages. By transporting
shipments with different destinations when feeding into the hub or shipment
from different sources when delivering from the hub, vehicles can be utilized
better (economies of density) or larger vehicles can be employed (economies of
size). At the same time, the sorting efforts in the depots (spokes) are reduced
because the shipments must be sorted to one relation only, the hub. Thanks to theconsolidation by the hub, larger quantities may be transported as an unsorted
complete shipment from a customer directly to the hub. Without the hub-and-
spoke concept, transports on routes with little traffic could only be offered with a
high time bundling (see Fig. 8.9).
Single hub-and-spoke system Hub-and-spoke system with regional hubs
Fig. 8.9 Combinations of grid and hub-and-spoke nets
174 8 Logistics Network Planning

Indirect routes and additional handling processes are disadvantages of hub-
and-spoke systems. Decision criteria for implementing a hub-and-spoke system
are the volume of goods to be transported within the net, the time reserves
available for the consolidation steps, and the costs necessary for installing
consolidation stations.
Besides pure grid and hub-and-spoke systems, there are a number of
combinations of these two configurations. In such a net, relations with little
traffic are supplied via a hub; relations with a high traffic level are supplied
directly. Additional options are single hub-and-spoke systems and hub-and-spoke systems with regional hubs.7
Case Study 8.3: Distribution Nets
Sites where goods are stored, handled, or compiled according to customer or
order requirements are called distribution centers. From experience, different
forms of distribution centers have developed. With respect to their functions,
they are divided into regional and trans-regional distribution centers. A 2006
study by a logistics initiative from the German state of North Rhine-Westphalia
shows different modes of use for such distribution nets in different forms in this
state.
Regional distribution centers are mostly pure delivery sites operated by
retailers for supplying goods to their branches. On average, e.g. the regional
logistics centers operated by the retailer Aldi Sued supply consumer goods to
50 branches in a region. An Aldi Sued distribution center has an average size
of 2.5 ha and an average property size of around 20 ha. In one center, 150–180
people are employed. The investment volume for every site is 40 million Euros.
A different example for regional distribution centers is the food warehouse in
Oberhausen, Germany, operated by the company Lekkerland which, among
other activities, supplies convenience goods to gas stations. On a 10 ha property,
a center in one configuration stage has been built. It has a floor space of 1.8 ha
and employs 500 people.
Trans-regional distribution centers are, among others, used for central
storing and delivering goods to regional distribution centers. In Europe-wide
distribution structures, trans-regional centers also have the function of national
distribution. Such centers are mostly located in peripheral regions with impor-
tant trans-regional traffic connections (interchanges, terminals for intermodal
transport) and strategically planned near markets and production sites. The
distribution center operated by the drug store chain dm Drogeriemarkt in
Meckenheim near Cologne is an example of a trans-regional distribution center.
The goods are supplied by the manufacturers, stored, and compiled for the
branches as needed. The distribution center has a size of 2 ha on a property of
6.5 ha. Around 50 million Euros have been invested, and 500 jobs are planned.
Besides the center in Meckenheim, dm owns four more in Germany. An example
7 Cf. Arnold et al. (2008), p. 784 et seq.
8.4 Transport Networks 175
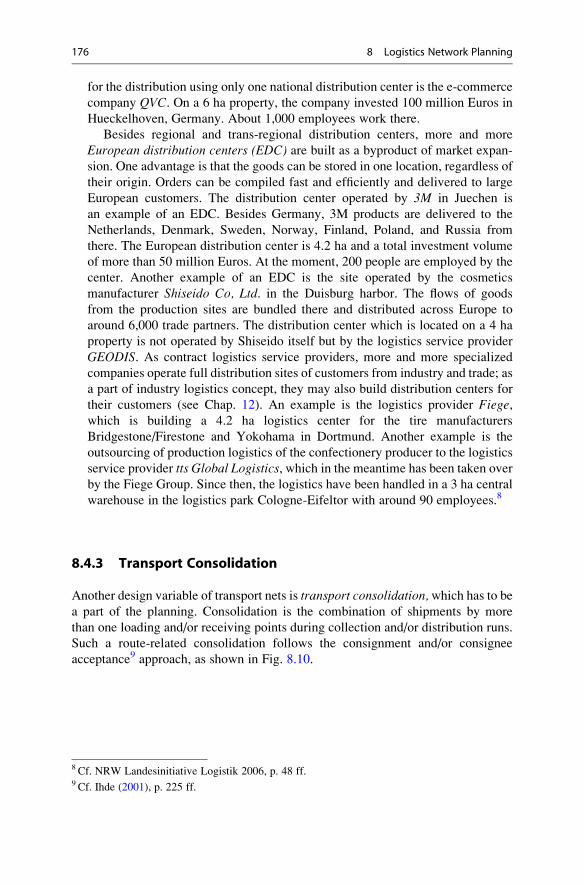
for the distribution using only one national distribution center is the e-commerce
company QVC. On a 6 ha property, the company invested 100 million Euros in
Hueckelhoven, Germany. About 1,000 employees work there.
Besides regional and trans-regional distribution centers, more and more
European distribution centers (EDC) are built as a byproduct of market expan-
sion. One advantage is that the goods can be stored in one location, regardless of
their origin. Orders can be compiled fast and efficiently and delivered to large
European customers. The distribution center operated by 3M in Juechen is
an example of an EDC. Besides Germany, 3M products are delivered to the
Netherlands, Denmark, Sweden, Norway, Finland, Poland, and Russia from
there. The European distribution center is 4.2 ha and a total investment volume
of more than 50 million Euros. At the moment, 200 people are employed by the
center. Another example of an EDC is the site operated by the cosmetics
manufacturer Shiseido Co, Ltd. in the Duisburg harbor. The flows of goods
from the production sites are bundled there and distributed across Europe to
around 6,000 trade partners. The distribution center which is located on a 4 ha
property is not operated by Shiseido itself but by the logistics service provider
GEODIS. As contract logistics service providers, more and more specialized
companies operate full distribution sites of customers from industry and trade; as
a part of industry logistics concept, they may also build distribution centers for
their customers (see Chap. 12). An example is the logistics provider Fiege,which is building a 4.2 ha logistics center for the tire manufacturers
Bridgestone/Firestone and Yokohama in Dortmund. Another example is the
outsourcing of production logistics of the confectionery producer to the logistics
service provider tts Global Logistics, which in the meantime has been taken over
by the Fiege Group. Since then, the logistics have been handled in a 3 ha central
warehouse in the logistics park Cologne-Eifeltor with around 90 employees.8
8.4.3 Transport Consolidation
Another design variable of transport nets is transport consolidation,which has to bea part of the planning. Consolidation is the combination of shipments by more
than one loading and/or receiving points during collection and/or distribution runs.
Such a route-related consolidation follows the consignment and/or consignee
acceptance9 approach, as shown in Fig. 8.10.
8 Cf. NRW Landesinitiative Logistik 2006, p. 48 ff.9 Cf. Ihde (2001), p. 225 ff.
176 8 Logistics Network Planning

Consolidation can also be achieved by including a handling point without stock
(transit point): Shipments are regrouped according to relation and receiver. Effects
of consolidation are, among others:
¢ Creation of polynomial transport chains
¢ More effort compared to direct delivery
¢ Additional handling processes
¢ Growing scheduling efforts for the flows of goods to be consolidated
¢ Better utilization of the means of transport because of a higher relation-related
quantity
¢ Creation of constant connections in cases of long-term trading relations
In procurement and distribution logistics of the consumer goods industry,
numerous consolidation concepts are employed.10 Table 8.2 gives an overview
about the most important ones.
The multi-pick concept says that the ordered quantities of a retailer and its
branch for a defined replacement period are collected during a defined tour of
manufacturers and sent bundled to the trading warehouse (see Fig. 8.11).
This requires giving the collecting and delivering job to one logistics service
provider. Effects are the increase of the average utilization of means of transport
and of the discharged quantity per delivery.
The by-pass concept includes picking up shipments that are already
commissioned for the branch at the manufacturer site. The goods are not stored
A
E
BSuppliers
Consignee
A BSuppliers
E
Consignee
A BSuppliers
A BSuppliers
E1 E2 E1 E2
Consignee Consignee
Fig. 8.10 Load and consignee acquisition (Cf. Ihde (2001), p. 226)
10 Cf. Stieglitz (1999), p. 150 ff.
8.4 Transport Networks 177
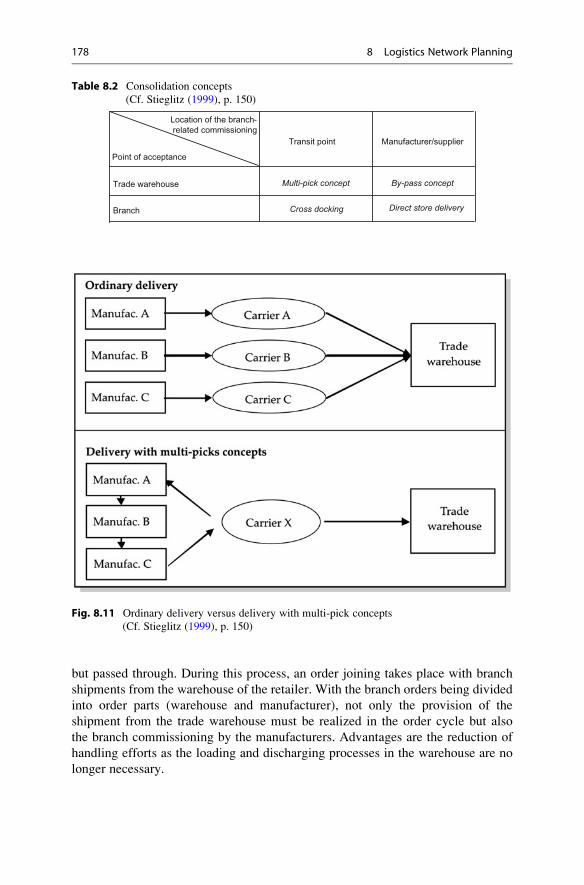
but passed through. During this process, an order joining takes place with branch
shipments from the warehouse of the retailer. With the branch orders being divided
into order parts (warehouse and manufacturer), not only the provision of the
shipment from the trade warehouse must be realized in the order cycle but also
the branch commissioning by the manufacturers. Advantages are the reduction of
handling efforts as the loading and discharging processes in the warehouse are no
longer necessary.
Fig. 8.11 Ordinary delivery versus delivery with multi-pick concepts
(Cf. Stieglitz (1999), p. 150)
Table 8.2 Consolidation concepts
(Cf. Stieglitz (1999), p. 150)
Trade warehouse
Branch
Transit point Manufacturer/supplier
Location of the branch-related commissioning
Point of acceptance
Multi-pick concept
Cross docking
By-pass concept
Direct store delivery
178 8 Logistics Network Planning

The cross-docking and merge-in-transit concepts are closely related to the
reduction of warehouse levels.
For cross docking, the handling process means that goods are cross-exchanged
(cross) between delivering trucks from different carriers that dock to the goods
receipt of the transit terminal at the same time (docking) and empty delivery
vehicles which are ready for loading in the goods outwards. The basic requirement
for this concept is advance information, in order to control the operation factors;
i.e. there must be a clear coordination regarding minimum and maximum order
volumes with the suppliers. High reliability is required here, with no stock buffer
planned between the manufacturer and the branch. The cross-docking platform
must be able to handle a high volume in little time. Some effects are a clear
reduction in the order lead time, from the placement of the order to the goods
arriving at the branch, a reduction in stock in the branch, the increase of the goods
handled, and the storing and take-out processes no longer being necessary
(see Fig. 8.12).
With respect to its steps, cross docking (CD) can be divided into:
¢ 1-step CD: The manufacturer commissions for the branch in advance; then the
shipments of more suppliers are joined in the cross-stocking point for
the delivery to single branches without manipulation to each shipment
(e.g. pallet) itself.
¢ 2-step CD: The manufacturer sends pallets by sort that are recompiled at the
cross docking point for final shipments to single branches.
The merge-in-transit concept must be seen in the context of production sites
located all over the world which makes it more and more necessary to join products
Supplier A Product a
Suppliers deliverfull truck loads
Delivery by branch
Supplier BProduct b
Supplier CProduct c
Incoming goods
Unloading, sorting and handling point
= Transit terminal
Outgoing goods
branchspecificunloading
Cross
Docking
handling andsorting
aaaaabbbbccccc
aaaaabbbbccccc
aaaaabbbbbbccc
aaabbbbbbccccc
aaaaaaabbccccc
aaaaabbbbccccc
bb
cc
aa
Fig. 8.12 The cross-docking principle (Cf. Kotzab (1997), p. 159)
8.4 Transport Networks 179

from a customer order not in a warehouse but to merge the individual items in
handling terminals (in transit) to complete orders before the actual delivery.
The direct-store delivery concept makes it possible to compile the goods for a
branch already at the manufacturer. The latter must make the commissioning
efforts. Depending on the size of the shipment (vehicle utilization) combined runs
can be made directly to the branch or compiled in a transit point after handling of
the shipments with respect to the relation to define delivery runs.
The basic possibilities for using consolidation potentials usually depend on the
terms of delivery agreed on by the supplier and the customer. They are important
instruments, especially in international movement of goods. The interpretation
of standard contract terms is defined in the International Commercial Terms
(INCOTERMS), which regulate the obligations of buyer and seller regarding
costs and risks. The terms EX Works (EXW), Free On Board (FOB), Cost,
Insurance, Freight (CIF), and Delivered Duty Paid (DDP)11 are common. With
this, the terms of delivery determine acquisition price.
The following will examine the choice between DDP and EXW more closely.
In case of DDP, the suppliers bear the costs and corresponding duties, e.g. for
delivery time and condition. Sometimes they will assume further duties like e.g. the
discharging of the goods. The buyer will assume the risk at the point of receipt,
i.e. the seller is responsible for complete and punctual delivery.
In case of ex works, the buyer bears the transport costs and takes responsibility
for delivering the goods to their destination. The supplier does not need an own
distribution structure. The buyer must organize the planning and controlling of the
collection and delivery at the points of receipt and order a logistics service provider.
Changes in the terms of delivery from DDP to EXW are becoming more and more
common. Basic requirement for changing to EXW is the bundling of volume from
individual or cooperating manufacturers.
With the freight costs a part of the pricing for DDP, it must be ensured that the
correct freight cost is calculated for EXW. The changes in the terms-of-delivery
strategy influence the distribution of the system leadership for goods movements.
This may result in strong conflicts of interests between the supplier and the buyer
(see Sect. 3.3.2), which is especially true for the cooperative division of the savings
resulting from the consolidation.
Case Study 8.4: Net Design of METRO Group Logistics
MGLMETRO Group Logistics is the logistics service provider for all companies
of the METRO Group. As logistical service and competence center, METRO
Group Logistics controls the flows of goods of the METRO Group sales brands.
With founding of METRO Group Logistics in 1995 and the implementation and
further development of the innovative concept of procurement logistics, the
METRO Group was able to strongly increase efficiency. The core points of
this concept will be briefly examined in the following.
11 Cf. Pfohl (2000), p. 189 et seq.
180 8 Logistics Network Planning
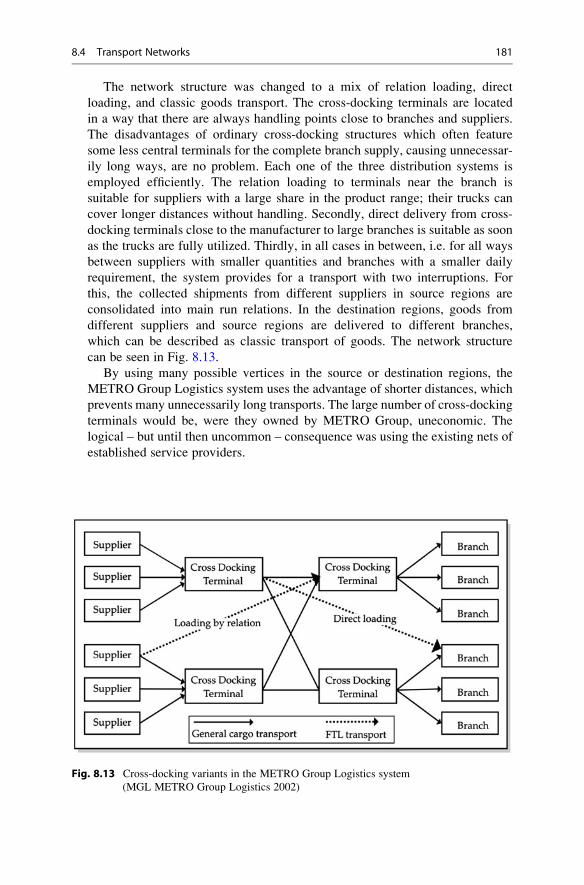
The network structure was changed to a mix of relation loading, direct
loading, and classic goods transport. The cross-docking terminals are located
in a way that there are always handling points close to branches and suppliers.
The disadvantages of ordinary cross-docking structures which often feature
some less central terminals for the complete branch supply, causing unnecessar-
ily long ways, are no problem. Each one of the three distribution systems is
employed efficiently. The relation loading to terminals near the branch is
suitable for suppliers with a large share in the product range; their trucks can
cover longer distances without handling. Secondly, direct delivery from cross-
docking terminals close to the manufacturer to large branches is suitable as soon
as the trucks are fully utilized. Thirdly, in all cases in between, i.e. for all ways
between suppliers with smaller quantities and branches with a smaller daily
requirement, the system provides for a transport with two interruptions. For
this, the collected shipments from different suppliers in source regions are
consolidated into main run relations. In the destination regions, goods from
different suppliers and source regions are delivered to different branches,
which can be described as classic transport of goods. The network structure
can be seen in Fig. 8.13.
By using many possible vertices in the source or destination regions, the
METRO Group Logistics system uses the advantage of shorter distances, which
prevents many unnecessarily long transports. The large number of cross-docking
terminals would be, were they owned by METRO Group, uneconomic. The
logical – but until then uncommon – consequence was using the existing nets of
established service providers.
Fig. 8.13 Cross-docking variants in the METRO Group Logistics system
(MGL METRO Group Logistics 2002)
8.4 Transport Networks 181

The controlling and coordination of the METROGroup procurement logistics
system is accompanied by a change in the system leadership in the supply chain
from the supplier to the retailer.
However, METRO Group does not always demand the control over logistics.
The supply chain partner with the structurally most favorable qualifications –
i.e. long-term – should bear the logistics efforts or find a logistics service
provider. To ensure this rule is obeyed, METRO Group expects being paid for
logistics services exactly the sum of the process costs taken off the suppliers by
the METRO Group service (cost equivalent).
In case of system leadership change, the following advantages and
disadvantages for METRO Group can be named: The suppliers do not have to
plan runs and concentrate on the core business, the manufacturing of products.
However, they are forced to exactly meet the production deadlines defined by
METRO Group.
The main advantage for METRO Group is the reduction of ramp contacts in
the branches because the trucks are better utilized and more precisely timed.
Though production fluctuations from the suppliers now have a stronger effect on
the whole transport organization.
The procurement logistics system introduced has by now been implemented
in many countries where METRO Group does business. It has, however, always
been adapted to the country-specific economic-geographical and logistical
characteristics. Besides procurement logistics, METRO Group Logistics offers
further services regarding sales brands and product ranges as well as cross-
border services.
8.4.4 Transport Logistics Concepts
Numerous transport logistics concepts have developed from the different structures
of transport nets. In this context, the freight village and city logistics will be
introduced.
Freight villages are transport logistics vertices on which logistics service
providers are present. At least carriers (road/rail/waterway/airport-multi modality),
an interchange in the form of handling points for short and long distance runs
(trans-regionality), as well as diverse logistics service providers and other pre- or
post-transport service providers (multifunctionality) should be parts of a freight
village. Aims are transport-logistical advantages to realize rationalization
potentials, e.g. by bundling transports and by shared use of information and
communication systems as well as databases. Ecological goals are also possible,
e.g. the prevention of high traffic volume by transport bundling and preventing
empty runs. Furthermore, it is an advantage for regional economic policy,
e.g. securing jobs, supporting small and medium-sized businesses, and a balanced
spatial structure.
182 8 Logistics Network Planning
Location requirements for freight village are, among others:12
¢ Position within the region
¢ Frequency/main direction of goods suitable for freight villages
¢ Space requirements of 60–200 ha
¢ Infrastructural connection/features
¢ Highway connection
¢ Main train line
¢ Inland waterway connection (optional)
¢ Terminal for combined transport
¢ Train terminal for combined transport
¢ Shipping port
The service providers in the freight village should at least offer the functions
inspection of goods, storing, order handling, commissioning, confectioning, mount-
ing, packing, route planning, disposition of transports, and shipment tracking.
Despite the advantages, there are large difficulties in establishing freight villages.
Although around 40 freight villages were planned in the 1990s in Germany, only a
few have actually been realized (e.g. Bremen).13 The reasons for this are:
¢ Carriers/forwarders/service providers are not willing to move after investing in
a larger site
¢ Carriers fear modal split changes from road to rail
¢ Large space requirements make it difficult to find a suitable property
¢ Required road connections lead to high infrastructure costs
¢ Communities, railway and freight village operators experience financing
restrictions
City logistics concepts try to solve the problems that come up with delivering to
and collecting from inner city areas.14 The city development is characterized by a
strong imbalance of the traffic flow, i.e. a usually much larger flow of goods into the
city than from it. The storage spaces in business have been reduced to a minimum
what, in turn, necessitates daily deliveries, or even more. The structure of inner city
traffic is mainly characterized by carrier and road freight transport as well as by cars
and utility vehicles for quick delivery. Pedestrian zones and determined delivery
times additionally restrict deliveries. The times during which retailers accept
deliveries are highly restrictive which leads to unproductive waiting times of the
vehicles. Increasing packaging disposal raises the need for transports in urban areas.
To solve these problems, numerous city logistics have been developed and partly
realized in some cities. The central approach is the partial relief of the inner areas
from transport traffic by bundling the delivery and collection runs and by reducing
12 Cf. Aberle (2009), p. 560 ff.13 Cf. Berg (2003), p. 418.14 Cf. Vahrenkamp (2005), p. 413 et seq.
8.4 Transport Networks 183
the number of daily runs to the inner city. The utilization of the remaining runs is
therefore increased and the inner city congestion intensity is reduced. Further
considerations are the use of public transport (trains and subways) for inner-city
transport of goods and the realization of city terminals for carriers, directly located
on the edge of the city.
8.5 Outsourcing, Tendering and Placing of Transportand Logistics Services
Cost effects are the most common argument for logistics outsourcing. Costs are
reduced by optimizing – after the logistics service provider has reached a high
average utilization, e.g. sinking costs per item with a growing transport volume or
economies of scale in warehousing. High fixed costs caused by capacities targeted
towards high peak loads can be made variable by outsourcing. Labor costs can be
reduced by sector arbitrage, e.g. because of more favorable wage agreements for
service providers. Furthermore, the reduction of opportunity costs should be
realized so that companies can concentrate on their core business and not on
logistics. In the latter case, it is possible to calculate a lost profit in the form of
opportunity costs.
Besides positive effects on costs, performance increases can also be a part of
logistics outsourcing.15 These result from the increase in efficiency by specializa-
tion because of the service provider’s know-how and the employment of possibly
more advanced technology. However, higher degrees of outsourcing do not auto-
matically lead to more success but rely on planning and realization. The process ofsuccessful outsourcing of logistics services can be divided into six phases:16
1. Creation of a full company logistics concept
2. Definition and quantification of the required services
3. Developing and adopting the placing policy
4. Realization of the tendering
5. Evaluation of the offers
6. Assessment of the services and costs
In the full company logistics conception, the nature and the quantity of the
required services, the logistics structures, and the limits of the own logistics
networks have to be defined. Rules have to be implemented in the form of
benchmarks e.g. for transport costs, costs and prices of internal logistics services,
estimated investments and operating costs for logistics centers. For the definitionand quantification of the service requirements, the required service quantities, rulesfor the realization of the services and payments related to the areas in which the
service was realized, must be defined. The goals of the outsourcing must be defined
with the developing and adopting of a placement policy. The core competences of
15 Cf. Wildemann (2007), p. 134 et seq.16 Cf. Gudehus (2010), p. 987.
184 8 Logistics Network Planning

the logistics services must be defined and, subsequently, which services must still
be realized internally. Furthermore, the limits of the outsourcing must be defined.
The realization of the tendering should consist of the following: A short descrip-
tion of the service requirements, a table with the required service quantities, a price
table to be filled by the service provider, and the general purchasing conditions for
logistics services. Tendering documents for warehouse and system services should
include the following:17
¢ Specification of the required functions and services
¢ Definition and identification of clear process and service chains
¢ Definition of service and quality requirements
¢ Statement about the required service quantity
¢ Requirements for information and communications systems
¢ Performance recording and payment
The assessment of the offers can be made according to formal, functional, and
commercial criteria:
¢ Formal criteria are, among others:
– Quality of the offer (Completeness, presentation)
– Price tables completely filled
– Offer documents signed
¢ Functional criteria rate e.g. the
– Concept solution: The offered solution fulfills all functions and requirements
– Functionality: Method of the realization (technology, equipment etc.), capa
bility of the IT competence
– Service realization: Availability of sufficient capacities or resources,
qualifications and experience of the staff
– Relevant and suitable references
Commercial criteria help to rate the following:
¢ Prices for the different services, including reference objects, fixed costs, vari
able cost rates etc.
¢ Yearly costs resulting from the planned quantities and services costs
¢ Payment modalities like payment deadlines and escalator clauses
¢ Liability/warranty: Regulating the amount and the length of the warranty
agreements and defining the liability sum and the penalty for faulty services
For performance recording and payment, agreements must be made about the
planning period and the payment periods as well as quality deficits and penalties. In
detail, this means agreements about the utilization risk, e.g. by fixed payments,
agreements about price adjustments (escalator clauses) and regulations about
17 Cf. Gudehus (2010), p. 1005 et seq.
8.5 Outsourcing, Tendering and Placing of Transport and Logistics Services 185
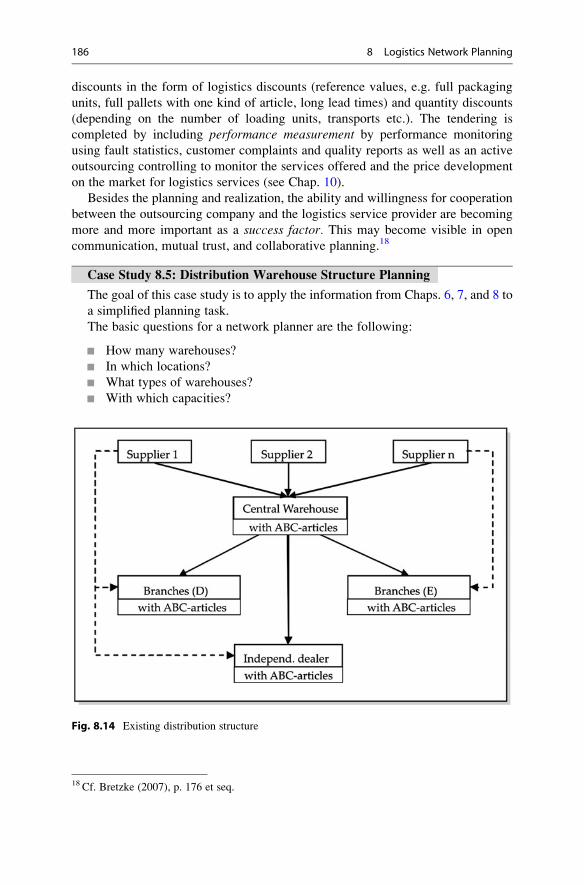
discounts in the form of logistics discounts (reference values, e.g. full packaging
units, full pallets with one kind of article, long lead times) and quantity discounts
(depending on the number of loading units, transports etc.). The tendering is
completed by including performance measurement by performance monitoring
using fault statistics, customer complaints and quality reports as well as an active
outsourcing controlling to monitor the services offered and the price development
on the market for logistics services (see Chap. 10).
Besides the planning and realization, the ability and willingness for cooperation
between the outsourcing company and the logistics service provider are becoming
more and more important as a success factor. This may become visible in open
communication, mutual trust, and collaborative planning.18
Case Study 8.5: Distribution Warehouse Structure Planning
The goal of this case study is to apply the information from Chaps. 6, 7, and 8 to
a simplified planning task.
The basic questions for a network planner are the following:
¢ How many warehouses?
¢ In which locations?
¢ What types of warehouses?
¢ With which capacities?
Fig. 8.14 Existing distribution structure
18 Cf. Bretzke (2007), p. 176 et seq.
186 8 Logistics Network Planning
¢ Which production sites deliver to which warehouses?
¢ Which customers are supplied to by which warehouses?
¢ Which means of transport are employed?
¢ Which product quantities are produced in which production sites?
The answering of these questions is aimed at one basic goal: To ensure a delivery
service which is in line with the market and, at the same time, by minimum logistics
costs.
A furniture store chain is reviewing its existing distribution structure. At the
moment, 143 suppliers deliver their goods to the central warehouse. The central
warehouse near Kassel, Germany, carries the full product range (A-, B-, and C-class
items); the same is true for the branches and the connected independent dealers.
Direct delivery to the German (D) branches is realized by four suppliers and with
around 30 products. Direct delivery in Spain (E) is realized by four suppliers, with
around 520 products (see Fig. 8.14).
Now you are asked to outline alternative network structures!
8.5 Outsourcing, Tendering and Placing of Transport and Logistics Services 187
Review Questions
1. What is a logistics net and what structures may it have?
2. What is meant by degree of centralization?3. Give concepts of transport consolidation.
4. What transport-logistical concepts do you know?
5. Explain cross docking.
6. What forms of distribution sites do you know?
7. Describe changes in the terms of delivery?
8. Name advantages of hub-and-spoke nets?
9. Design a net for the flow of goods for the food consumer goods sector.
10. What are important factors in the capacity planning of a distribution center?
Additional Literature
Aberle, G. (2009). Transportwirtschaft: Einzelwirtschaftliche und gesamtwirtschaftlicheGrundlagen (5th ed.). Munchen/Wien: Oldenbourg. 2009.
Aden, D. (2001). Neue Chancen fur Logistik-Dienstleister durch die Globalisierung. In:
Baumgarten, H. (Ed.) Logistik im E-Zeitalter. Die Welt der globalen Logistiknetzwerke.Frankfurt.
Ballou, R. H. (1995). Logistics network design: Modeling and informational considerations.
International Journal of Logistics Management, 6(2), 39–54.Baumgarten, H. (Ed.). (2001). Logistik im E-Zeitalter. Die Welt der globalen Logistiknetzwerke.
Frankfurt.
Baumgarten, H., & Thoms, F. (2002). Trends und Strategien in der Logistik: Supply Chains imWandel. Berlin: Verbum.
Baumgarten, H. et al. (Ed.). (2003). Springer experten system logistik-management, 1. Berlin.Bell, M. G. H., & Iida, Y. (1997). Transportation network analysis. Chichester: Wiley.
Blom, F., & Harlander, N. A. (2003). Logistik-Management: Der Aufbau ganzheitlicherLogistikketten in Theorie und Praxis. Renningen: Expert-Verl.
Francis, R. L., McGinnis, L. F., & White, J. A. (1992). Facility layout and location: An analyticalapproach (2nd ed.). Englewood Cliffs: Prentice-Hall.
Gudehus, T. (2010). Logistik. Berlin: Springer.Ihde, G. B. (2001). Transport, Verkehr, Logistik, Teil 3. Munchen: Vahlen.
Janz, O. (2003). Integriertes Transportnetzmanagement: Angebots- und nachfrageorientiertePlanung und Steuerung komplexer Transportnetze. Koln: Eul Verlag.
Maltz, A. B., & Ellram, L. M. (1997). Total cost relationship: An analytical framework for the
logistics outsourcing decision. Journal of Business Logistics, 18(1), 45–66.Pfohl, H.-C. (2004). Netzkompetenz in Supply Chains. Grundlagen und Umsetzung. Wiesbaden:
Gabler.
Powers, R. F. (1989). Optimization models for logistics decisions. Journal of Business Logistics,10(1), 106–121.
Schulte, Chr. (2009). Logistik, 5. Edition, Kapitel 8. Munchen: Vahlen.
Stieglitz, A. (1999). Die Reorganisation handelslogistischer Versorgungsketten. Munchen: Huss.
Vahrenkamp, R. (2007). Logistik: Management und Strategien. Munchen: Oldenbourg.
188 8 Logistics Network Planning

IT in Logistics 9
Learning Objectives
For the realization of cross-company supply chains, the informational linking
of departments within the company and of cooperating companies is an impor-
tant means. Furthermore, the internal logistics processes must be supported
by adequate information and communications systems. There are strong
relationships amongst these systems and the logistics functions. The goal of
this chapter is to introduce the many areas of application for identification,
information and communications systems, and their potential use in logistics
systems. Additionally, the respective effects on logistical performance, quality,
and costs will be explained.
Keywords
¢ Information requirements in logistics and supply chain
¢ IT standards in business
¢ Flows of information and their effects
¢ Electronis Data Interchange (EDI) principle
¢ Identification systems – barcode and RFID
¢ Stock management systems
¢ Planning of transports and runs
¢ Enterprise Resource Planning (ERP)
¢ E-logistics
H. Gleissner and J.C. Femerling, Logistics, Springer Texts in Business and Economics,
DOI 10.1007/978-3-319-01769-3_9, # Springer International Publishing Switzerland 2013
189

9.1 Electronic Data Transmission
9.1.1 Communication Standards
The complexity of logistical processes and the high number of parties involved
require strong efforts for information and communication as well as for controlling
and documentation. To control the logistics processes, diverse information with
mostly large data volumes are necessary. As an example for a shipment these are:
information about the addresses of sender, receiver, shipping company, and carrier;
information about the goods like weight, volume, size, special shipping and
handling requirements regarding cooling, fragility, preservability etc.; and infor-
mation about the price, the date of the shipment, and the time of the delivery.
Traditionally, this information can be communicated orally or in written form and
be attached to the shipment; it can also be sent prior to the shipment by fax.
However, a manual or paper-based process alone is not sufficient anymore for
a fast information supply that is ahead of physical events. To realize logistics
processes in the best way possible, it is necessary that e.g. information about the
delivery of a shipment is available way before the actual delivery for the recipient
and other parties like e.g. the carrier. This is made possible by electronic data
transmission technology. The same is true for realizing concepts with streamlined
process and organizational structures in logistics and in the company as a whole.
For this, the data should be available in standardized formats which allows for all
involved parties in the process chain to read and process the data without further
transmission, so-called media disruptions. This means a change of transmission
medium or data carrier in the information chain, e.g. transferring information from
an inventory card (paper) or a delivery note (paper) into an IT system or vice versa.
The problem with such media disruptions is the possibility of errors in the process.
Conversion in this context means e.g. the harmonization of the data-technological
sentence structure (syntax) with respect to the denomination, numerical character-
istic, sequence and length of fields in data sets. If media disruptions or conversion
processes are avoided during data transmission, information is not only available
faster for status requests or for adding controlling commands but the overall
transaction costs can be reduced in the process.
Transaction costs are defined as the costs necessary to initiate, coordinate and
realize the transfer of goods from the original seller to the consumer.1
Caused by the requirements of worldwide communication and the necessity
to rationalize internal processes, efficient concepts for managing the data intensity
and data volume have been developed – also, and especially, in logistics.
This is often called information logistics. It must fulfill the following
requirements:
¢ Avoidance of media disruptions (orally – written – electronic data format)
¢ Reduction of conversion efforts (intervention-free data transmission)
1 Cf. Gleißner (2000), p. 21 ff.
190 9 IT in Logistics
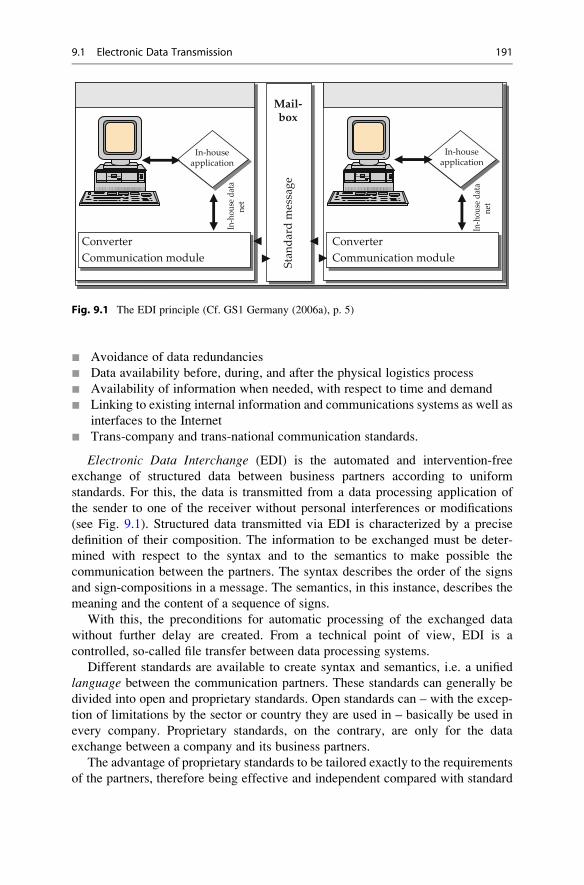
¢ Avoidance of data redundancies
¢ Data availability before, during, and after the physical logistics process
¢ Availability of information when needed, with respect to time and demand
¢ Linking to existing internal information and communications systems as well as
interfaces to the Internet
¢ Trans-company and trans-national communication standards.
Electronic Data Interchange (EDI) is the automated and intervention-free
exchange of structured data between business partners according to uniform
standards. For this, the data is transmitted from a data processing application of
the sender to one of the receiver without personal interferences or modifications
(see Fig. 9.1). Structured data transmitted via EDI is characterized by a precise
definition of their composition. The information to be exchanged must be deter-
mined with respect to the syntax and to the semantics to make possible the
communication between the partners. The syntax describes the order of the signs
and sign-compositions in a message. The semantics, in this instance, describes the
meaning and the content of a sequence of signs.
With this, the preconditions for automatic processing of the exchanged data
without further delay are created. From a technical point of view, EDI is a
controlled, so-called file transfer between data processing systems.
Different standards are available to create syntax and semantics, i.e. a unified
language between the communication partners. These standards can generally be
divided into open and proprietary standards. Open standards can – with the excep-
tion of limitations by the sector or country they are used in – basically be used in
every company. Proprietary standards, on the contrary, are only for the data
exchange between a company and its business partners.
The advantage of proprietary standards to be tailored exactly to the requirements
of the partners, therefore being effective and independent compared with standard
Mail-box
Stan
dard
mes
sage
In-houseapplication
In-houseapplication
In-h
ouse
dat
ane
t
In-h
ouse
dat
ane
t
ConverterCommunication module
ConverterCommunication module
Fig. 9.1 The EDI principle (Cf. GS1 Germany (2006a), p. 5)
9.1 Electronic Data Transmission 191
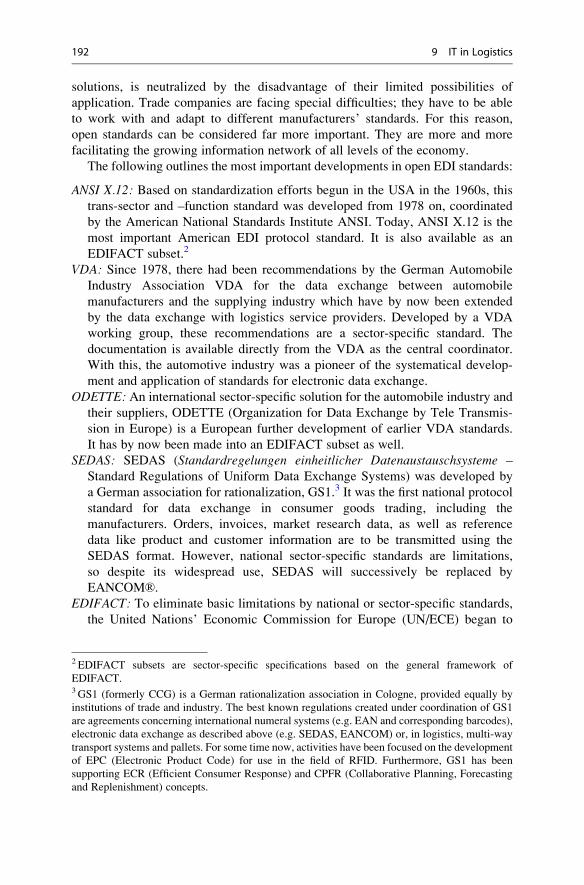
solutions, is neutralized by the disadvantage of their limited possibilities of
application. Trade companies are facing special difficulties; they have to be able
to work with and adapt to different manufacturers’ standards. For this reason,
open standards can be considered far more important. They are more and more
facilitating the growing information network of all levels of the economy.
The following outlines the most important developments in open EDI standards:
ANSI X.12: Based on standardization efforts begun in the USA in the 1960s, this
trans-sector and –function standard was developed from 1978 on, coordinated
by the American National Standards Institute ANSI. Today, ANSI X.12 is the
most important American EDI protocol standard. It is also available as an
EDIFACT subset.2
VDA: Since 1978, there had been recommendations by the German Automobile
Industry Association VDA for the data exchange between automobile
manufacturers and the supplying industry which have by now been extended
by the data exchange with logistics service providers. Developed by a VDA
working group, these recommendations are a sector-specific standard. The
documentation is available directly from the VDA as the central coordinator.
With this, the automotive industry was a pioneer of the systematical develop-
ment and application of standards for electronic data exchange.
ODETTE: An international sector-specific solution for the automobile industry and
their suppliers, ODETTE (Organization for Data Exchange by Tele Transmis-
sion in Europe) is a European further development of earlier VDA standards.
It has by now been made into an EDIFACT subset as well.
SEDAS: SEDAS (Standardregelungen einheitlicher Datenaustauschsysteme –
Standard Regulations of Uniform Data Exchange Systems) was developed by
a German association for rationalization, GS1.3 It was the first national protocol
standard for data exchange in consumer goods trading, including the
manufacturers. Orders, invoices, market research data, as well as reference
data like product and customer information are to be transmitted using the
SEDAS format. However, national sector-specific standards are limitations,
so despite its widespread use, SEDAS will successively be replaced by
EANCOM®.
EDIFACT: To eliminate basic limitations by national or sector-specific standards,
the United Nations’ Economic Commission for Europe (UN/ECE) began to
2 EDIFACT subsets are sector-specific specifications based on the general framework of
EDIFACT.3GS1 (formerly CCG) is a German rationalization association in Cologne, provided equally by
institutions of trade and industry. The best known regulations created under coordination of GS1
are agreements concerning international numeral systems (e.g. EAN and corresponding barcodes),
electronic data exchange as described above (e.g. SEDAS, EANCOM) or, in logistics, multi-way
transport systems and pallets. For some time now, activities have been focused on the development
of EPC (Electronic Product Code) for use in the field of RFID. Furthermore, GS1 has been
supporting ECR (Efficient Consumer Response) and CPFR (Collaborative Planning, Forecasting
and Replenishment) concepts.
192 9 IT in Logistics
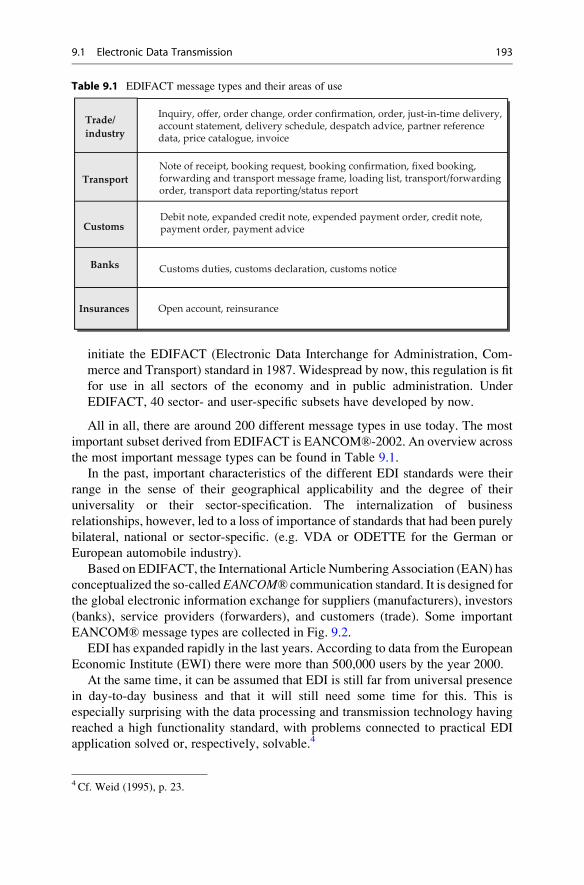
initiate the EDIFACT (Electronic Data Interchange for Administration, Com-
merce and Transport) standard in 1987. Widespread by now, this regulation is fit
for use in all sectors of the economy and in public administration. Under
EDIFACT, 40 sector- and user-specific subsets have developed by now.
All in all, there are around 200 different message types in use today. The most
important subset derived from EDIFACT is EANCOM®-2002. An overview across
the most important message types can be found in Table 9.1.
In the past, important characteristics of the different EDI standards were their
range in the sense of their geographical applicability and the degree of their
universality or their sector-specification. The internalization of business
relationships, however, led to a loss of importance of standards that had been purely
bilateral, national or sector-specific. (e.g. VDA or ODETTE for the German or
European automobile industry).
Based on EDIFACT, the International Article Numbering Association (EAN) has
conceptualized the so-called EANCOM® communication standard. It is designed for
the global electronic information exchange for suppliers (manufacturers), investors
(banks), service providers (forwarders), and customers (trade). Some important
EANCOM® message types are collected in Fig. 9.2.
EDI has expanded rapidly in the last years. According to data from the European
Economic Institute (EWI) there were more than 500,000 users by the year 2000.
At the same time, it can be assumed that EDI is still far from universal presence
in day-to-day business and that it will still need some time for this. This is
especially surprising with the data processing and transmission technology having
reached a high functionality standard, with problems connected to practical EDI
application solved or, respectively, solvable.4
Table 9.1 EDIFACT message types and their areas of use
Inquiry, offier, order change, order confirmation, order, just-in-time delivery, account statement, delivery schedule, despatch advice, partner reference data, price catalogue, invoice
Note of receipt, booking request, booking confirmation, fixed booking,forwarding and transport message frame, loading list, transport/forwarding order, transport data reporting/status report
Customs duties, customs declaration, customs notice
Debit note, expanded credit note, expended payment order, credit note,payment order, payment advice
Open account, reinsurance
Trade/ industry
Transport
Customs
Banks
Insurances
4 Cf. Weid (1995), p. 23.
9.1 Electronic Data Transmission 193
The lack of wider expansion of EDI is caused partly by subjective assessment by
the management regarding the advantages of its application. Often, costs and other
disadvantages like concerns about unauthorized access are reasons against the
introduction of EDI. Especially small and medium-sized companies are worried
about the costs. For this target group, web-EDI solutions have been developed by
now. They require only small investments in hard and software and only limited
specialized EDI system know-how. With this, it is possible to profit from EDI
advantages with a manageable additional manual effort for small data volumes.
Table 9.2 shows and contrasts positive and negative effects of EDI application.5
Besides the costs for introduction and operation and the resulting saving potentials,
there are indirect costs and saving potentials that are difficult to measure. Further-
more, the arguments against EDI application as well as the operative and strategic
advantages in competition resulting from EDI application must be assessed as
qualitative factors. Gaining a competitive advantage usually does not result from
EDI application alone but from realizing a full strategy like ECR or CFPR that has
EDI as an elementary prerequisite.
As a result of the spread of Internet and the available e-commerce solutions
(Internet data exchange, e-procurement, Internet market places etc.), the web based
XML standard has become very important.
One can assume that EDIFACT and EANCOM® will remain important for
electronic data exchange because of their presence and standardization. By
Supplier Customer
Bank
Service provider
Price lists/catalogue (PRICAT)
Orders (ORDERS)
Despatch advice (DESADV)
Confirmation of receipt (RECADV)
Invoice (INVOIC)
Note of arrival (IFTMAN)
Payment order (PAYMUL)Credit note (CREMUL)
Transport status (IFTSTA)
Transport order (IFTMIN)
Fig. 9.2 Information flow in logistics with EANCOM® standards
(Cf. GS1 Germany (2006a), p. 7)
5 Cf. Weid (1995), p. 59 et seq.
194 9 IT in Logistics

Table 9.2 Advantages and disadvantages of EDI
(Cf. Weid (1995), p. 129 et seq. and Gleißner (2000), S. 133 et seq)
EEDI employment
Negative effects Positive effects
Implementation costs Cost reductions(Staffi, equipment and capital commitment costs)
Collection of information
External EDI consulting costs
Coordination with future communication partners
Staffi training
Hard-and so�ware for data processing (computer etc.) and communication (modem etc.)
So�ware adaption/development for existing data processingsystems
Costs for initial connection to VAN services and systems (ISDN etc.)
Pilot or parallel operation in the introduction phase
Handling of documents
Recording incoming documents
Print and copy costs for outgoing documents
Transmission costs (postage, fax)
Reduction of the stock with shorter information flow (shorter time for replenishment)
Manual sorting, distributing, document storage
Correction effiorts in case of errors
Content comparison of diffierent data formats
Running costs
So�ware maintenance/development and error elimination
License fees to central institutions
So�ware maintenance
Connection costs
Staffi training
Other costs Saving potentials
Not exactly quantifiable Elimination of redundant jobs
Simplification of process organization
Reduction of the vulnerability to errors
Flaffening of hierarchies
Moving decision-making competence to lower levels
Integration and reintegration of processes
Higher staffi productivity (fewer routine jo bs)
Higher liquidity because of time advantages between invoicing and receipt of payment;possible lowering of costs of capital
Qualitative disadvantages Qualitative advantages or potential use
Data security hard to realize
Documentation of EDI transactions
Proof of complete and correct data receipt
Unauthorized access (internal/external hackers)
Insufficient reference data quality (products, addresses); missing management responsibility
Relying of technical DP infrastructure
Creation of barriers to entering/leaving a market with IT
Using time potentials by shortening the times for delivery, order processing, and handling
Increase in flexibility and efficiency in process organization
Increase in employee satisfaction
Higher transparency of business processes, improvement of information management
Increase in the available reaction time and quality in the logistics chain by earlier and more exact information availability
(continued)
9.1 Electronic Data Transmission 195
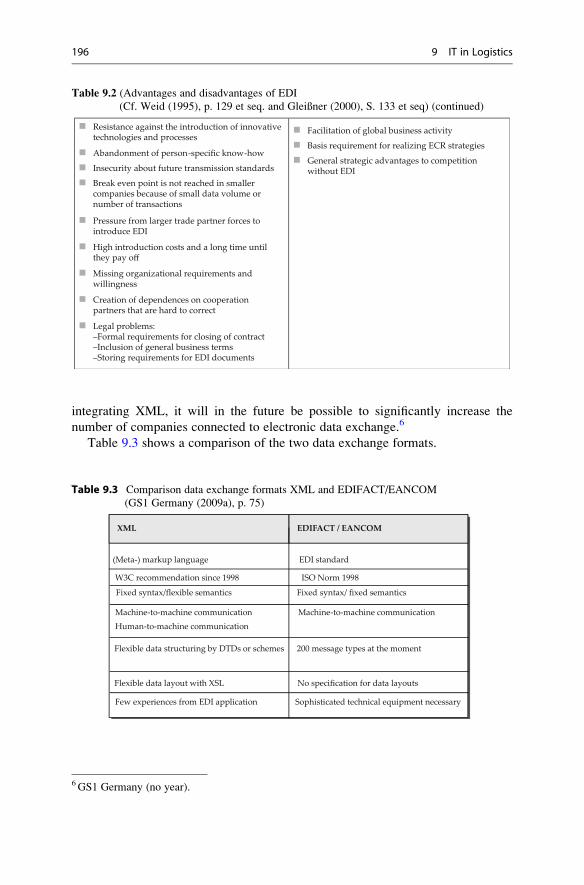
integrating XML, it will in the future be possible to significantly increase the
number of companies connected to electronic data exchange.6
Table 9.3 shows a comparison of the two data exchange formats.
Table 9.2 (Advantages and disadvantages of EDI
(Cf. Weid (1995), p. 129 et seq. and Gleißner (2000), S. 133 et seq) (continued)
Resistance against the introduction of innovative technologies and processes
Abandonment of person-specific know-how
Insecurity about future transmission standards
Break even point is not reached in smaller companies because of small data volume or number of transactions
Pressure from larger trade partner forces to introduce EDI
High introduction costs and a long time until they pay offi
Missing organizational requirements and willingness
Creation of dependences on cooperation partners that are hard to correct
Legal problems:–Formal requirements for closing of contract –Inclusion of general business terms –Storing requirements for EDI documents
Facilitation of global business activity
Basis requirement for realizing ECR strategies
General strategic advantages to competition without EDI
Table 9.3 Comparison data exchange formats XML and EDIFACT/EANCOM
(GS1 Germany (2009a), p. 75)
(Meta-) markup language EDI standard
XML EDIFACT / EANCOM
W3C recommendation since 1998 ISO Norm 1998
Fixed syntax/flexible semantics Fixed syntax/ fixed semantics
Machine-to-machine communication Machine-to-machine communication
Flexible data structuring by DTDs or schemes 200 message types at the moment
Flexible data layout with XSL No specification for data layouts
Few experiences from EDI application Sophisticated technical equipment necessary
Human-to-machine communication
6 GS1 Germany (no year).
196 9 IT in Logistics
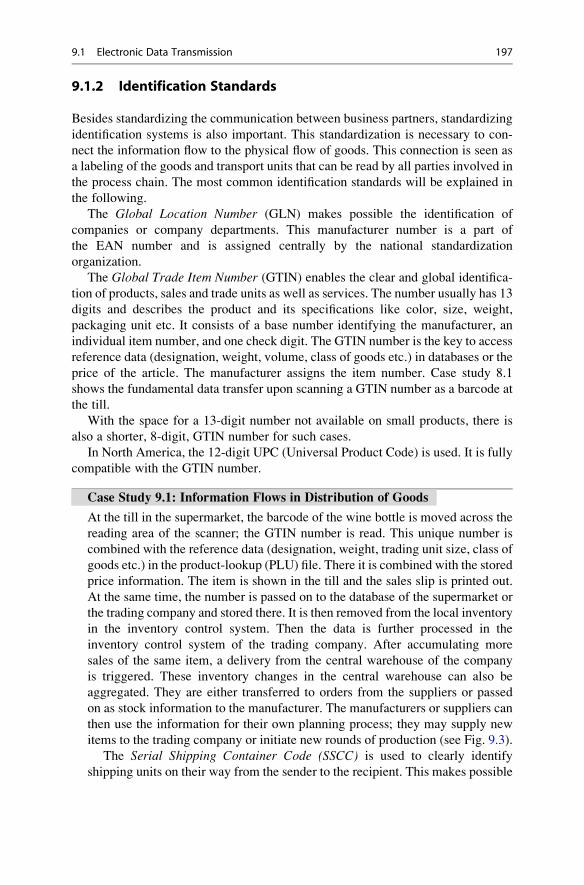
9.1.2 Identification Standards
Besides standardizing the communication between business partners, standardizing
identification systems is also important. This standardization is necessary to con-
nect the information flow to the physical flow of goods. This connection is seen as
a labeling of the goods and transport units that can be read by all parties involved in
the process chain. The most common identification standards will be explained in
the following.
The Global Location Number (GLN) makes possible the identification of
companies or company departments. This manufacturer number is a part of
the EAN number and is assigned centrally by the national standardization
organization.
The Global Trade Item Number (GTIN) enables the clear and global identifica-
tion of products, sales and trade units as well as services. The number usually has 13
digits and describes the product and its specifications like color, size, weight,
packaging unit etc. It consists of a base number identifying the manufacturer, an
individual item number, and one check digit. The GTIN number is the key to access
reference data (designation, weight, volume, class of goods etc.) in databases or the
price of the article. The manufacturer assigns the item number. Case study 8.1
shows the fundamental data transfer upon scanning a GTIN number as a barcode at
the till.
With the space for a 13-digit number not available on small products, there is
also a shorter, 8-digit, GTIN number for such cases.
In North America, the 12-digit UPC (Universal Product Code) is used. It is fully
compatible with the GTIN number.
Case Study 9.1: Information Flows in Distribution of Goods
At the till in the supermarket, the barcode of the wine bottle is moved across the
reading area of the scanner; the GTIN number is read. This unique number is
combined with the reference data (designation, weight, trading unit size, class of
goods etc.) in the product-lookup (PLU) file. There it is combined with the stored
price information. The item is shown in the till and the sales slip is printed out.
At the same time, the number is passed on to the database of the supermarket or
the trading company and stored there. It is then removed from the local inventory
in the inventory control system. Then the data is further processed in the
inventory control system of the trading company. After accumulating more
sales of the same item, a delivery from the central warehouse of the company
is triggered. These inventory changes in the central warehouse can also be
aggregated. They are either transferred to orders from the suppliers or passed
on as stock information to the manufacturer. The manufacturers or suppliers can
then use the information for their own planning process; they may supply new
items to the trading company or initiate new rounds of production (see Fig. 9.3).
The Serial Shipping Container Code (SSCC) is used to clearly identify
shipping units on their way from the sender to the recipient. This makes possible
9.1 Electronic Data Transmission 197
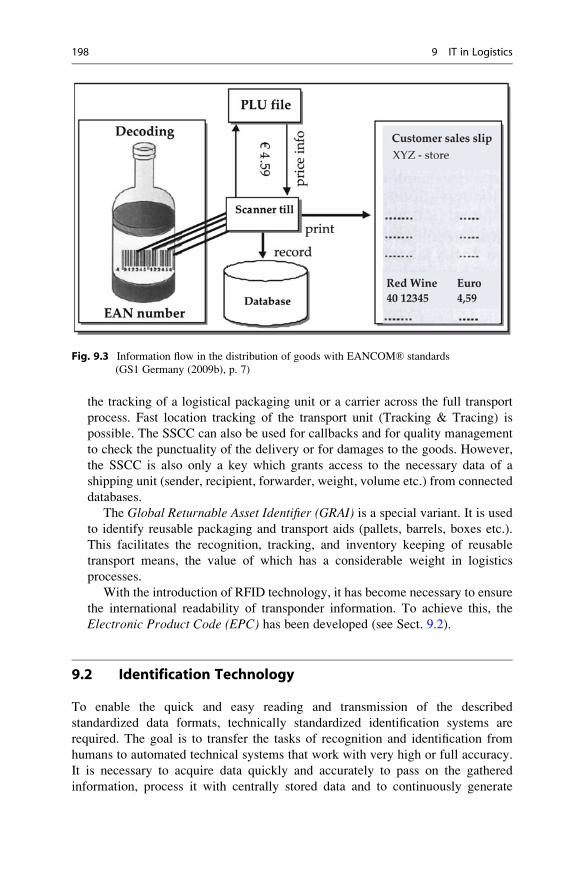
the tracking of a logistical packaging unit or a carrier across the full transport
process. Fast location tracking of the transport unit (Tracking & Tracing) is
possible. The SSCC can also be used for callbacks and for quality management
to check the punctuality of the delivery or for damages to the goods. However,
the SSCC is also only a key which grants access to the necessary data of a
shipping unit (sender, recipient, forwarder, weight, volume etc.) from connected
databases.
The Global Returnable Asset Identifier (GRAI) is a special variant. It is usedto identify reusable packaging and transport aids (pallets, barrels, boxes etc.).
This facilitates the recognition, tracking, and inventory keeping of reusable
transport means, the value of which has a considerable weight in logistics
processes.
With the introduction of RFID technology, it has become necessary to ensure
the international readability of transponder information. To achieve this, the
Electronic Product Code (EPC) has been developed (see Sect. 9.2).
9.2 Identification Technology
To enable the quick and easy reading and transmission of the described
standardized data formats, technically standardized identification systems are
required. The goal is to transfer the tasks of recognition and identification from
humans to automated technical systems that work with very high or full accuracy.
It is necessary to acquire data quickly and accurately to pass on the gathered
information, process it with centrally stored data and to continuously generate
Fig. 9.3 Information flow in the distribution of goods with EANCOM® standards
(GS1 Germany (2009b), p. 7)
198 9 IT in Logistics

controlling information for the logistical process from there. In turn, the processed
data should be available for all parties in the logistics chain in as little time as
possible. Besides the quick availability of controlling information, automatic data
acquisition has the advantage of rendering manual work like the recording of
shipment and status information on paper lists unnecessary, thus making it possible
to reduce staff costs.
There is a multitude of technical possibilities for the recording of goods today
(see Fig. 9.4). The easiest way is to identify the item by measuring its weight or
volume. Using information carriers is technically more challenging. Possibilities
include the mechanic recording using contacts attached to the item, and the reading
of magnetic stripes or opto-electronic information carriers like character, barcode
or QR-code scanning. The most advanced recording method is the communication
with electronic or electro-magnetic data carriers in the form of fixed or program-
mable electronic memory chips like RFID.
Besides mark readers, the easiest way for automatic identification in logistics is
optical character reading (OCR) with the so-called OCR code (see Fig. 9.5).
Reading devices are able to read labels attached to the items with a corresponding
Electro-magnetic Radio frequency-based
Mark reader
Character reader
Barcode reader
Magn. Writing reader RFID passive RFID active
Mechanical readingTransforming signs into digital signals for data processing
Optical
Document reader
Fig. 9.4 Mechanical reading in automatic data acquisition
Fig. 9.5 Characters for optical recognition
9.2 Identification Technology 199
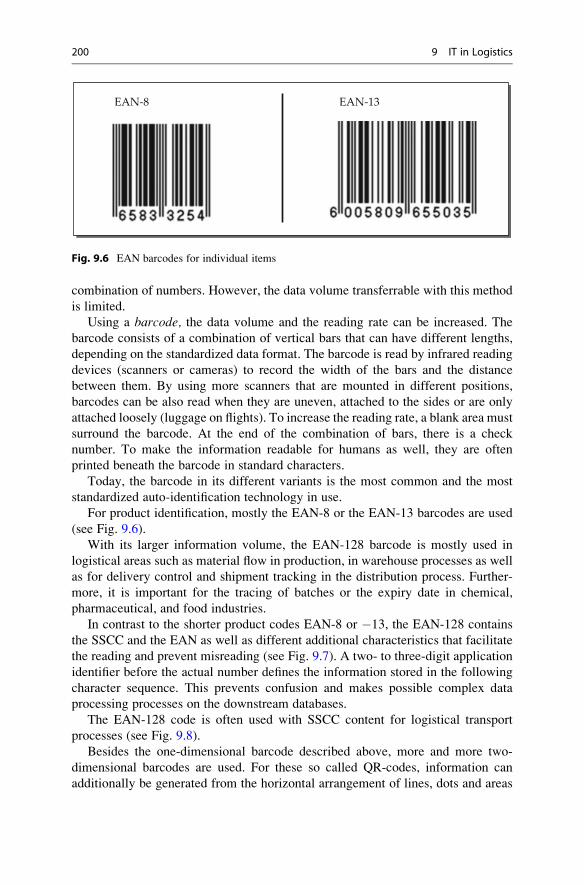
combination of numbers. However, the data volume transferrable with this method
is limited.
Using a barcode, the data volume and the reading rate can be increased. The
barcode consists of a combination of vertical bars that can have different lengths,
depending on the standardized data format. The barcode is read by infrared reading
devices (scanners or cameras) to record the width of the bars and the distance
between them. By using more scanners that are mounted in different positions,
barcodes can be also read when they are uneven, attached to the sides or are only
attached loosely (luggage on flights). To increase the reading rate, a blank area must
surround the barcode. At the end of the combination of bars, there is a check
number. To make the information readable for humans as well, they are often
printed beneath the barcode in standard characters.
Today, the barcode in its different variants is the most common and the most
standardized auto-identification technology in use.
For product identification, mostly the EAN-8 or the EAN-13 barcodes are used
(see Fig. 9.6).
With its larger information volume, the EAN-128 barcode is mostly used in
logistical areas such as material flow in production, in warehouse processes as well
as for delivery control and shipment tracking in the distribution process. Further-
more, it is important for the tracing of batches or the expiry date in chemical,
pharmaceutical, and food industries.
In contrast to the shorter product codes EAN-8 or �13, the EAN-128 contains
the SSCC and the EAN as well as different additional characteristics that facilitate
the reading and prevent misreading (see Fig. 9.7). A two- to three-digit application
identifier before the actual number defines the information stored in the following
character sequence. This prevents confusion and makes possible complex data
processing processes on the downstream databases.
The EAN-128 code is often used with SSCC content for logistical transport
processes (see Fig. 9.8).
Besides the one-dimensional barcode described above, more and more two-
dimensional barcodes are used. For these so called QR-codes, information can
additionally be generated from the horizontal arrangement of lines, dots and areas
EAN-13EAN-8
Fig. 9.6 EAN barcodes for individual items
200 9 IT in Logistics

as well as from their distances to each other. They are more and more used in the
fields of postage and address information, online tickets (see Fig. 9.9) and a wide
utilization range with mobile devices like smart phones.
Fig. 9.8 EAN-128 transport label – concrete example of SSCC (Cf. GS1 Germany (2009a), p. 25)
Fig. 9.7 EAN-128 as SSCC (Cf. GS1 Germany (2009a), p. 27)
9.2 Identification Technology 201
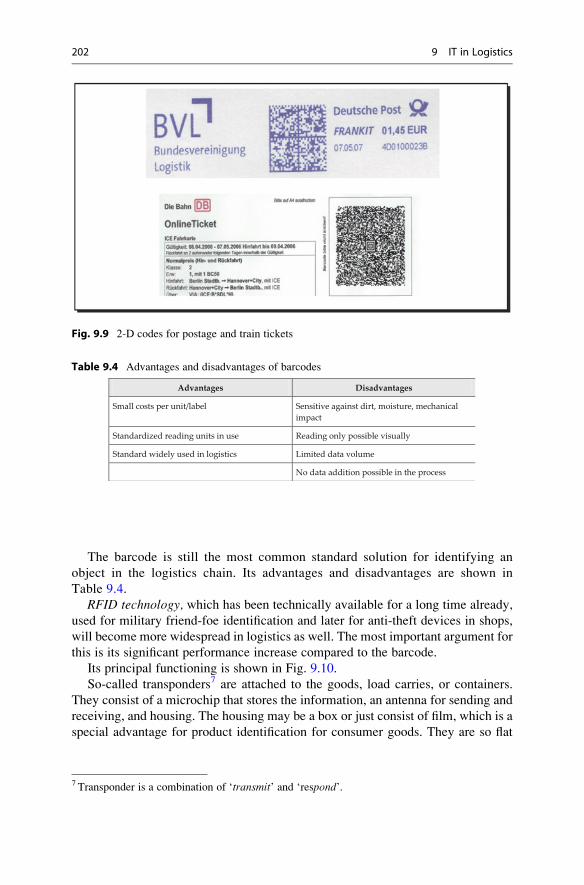
The barcode is still the most common standard solution for identifying an
object in the logistics chain. Its advantages and disadvantages are shown in
Table 9.4.
RFID technology, which has been technically available for a long time already,
used for military friend-foe identification and later for anti-theft devices in shops,
will become more widespread in logistics as well. The most important argument for
this is its significant performance increase compared to the barcode.
Its principal functioning is shown in Fig. 9.10.
So-called transponders7 are attached to the goods, load carries, or containers.
They consist of a microchip that stores the information, an antenna for sending and
receiving, and housing. The housing may be a box or just consist of film, which is a
special advantage for product identification for consumer goods. They are so flat
Fig. 9.9 2-D codes for postage and train tickets
Table 9.4 Advantages and disadvantages of barcodes
Advantages Disadvantages
Small costs per unit/label Sensitive against dirt, moisture, mechanical impact
Standardized reading units in use Reading only possible visually
Standard widely used in logistics Limited data volume
No data addition possible in the process
7 Transponder is a combination of ‘transmit’ and ‘respond’.
202 9 IT in Logistics

that they can be attached to the items as stickers (so-called smart labels; see
Fig. 9.11).
With respect to the energy supply, transponders are divided into active and
passive transponders. The active writing/reading device initiates the transmission
or reading of the information on the transponder. Active systems use the energy
from an integrated battery for controlling processes of the microchip and for
independently sending information. Passive systems, on the other hand, receive
their energy by induction – they drain energy from the (electro-) magnetic
frequency field. The capacity of an RFID transponder can reach up to 64 KB.
There are also models where the data can be complemented during the use or
deleted afterwards to make room for new information.
The advantages and disadvantages of RFID technology are shown in Table 9.5.
Basically, there are two methods to store data on an RFID transponder. The first
method is to directly store all relevant data of one article or a logistical unit on the
transponder. This is a decentralized approach to data storing and, through this
Fig. 9.11 Transponder (smart label) (Cf. GS1 Germany (2003), p. 13)
Radio interfaceLocal
RFIDreading device
Contactless data carrier
(transponder)
Application
Energy
Data
Pulse
Connection elements (coil, microwave antenna)
interface
Fig. 9.10 Logic of the RFID data flow
9.2 Identification Technology 203
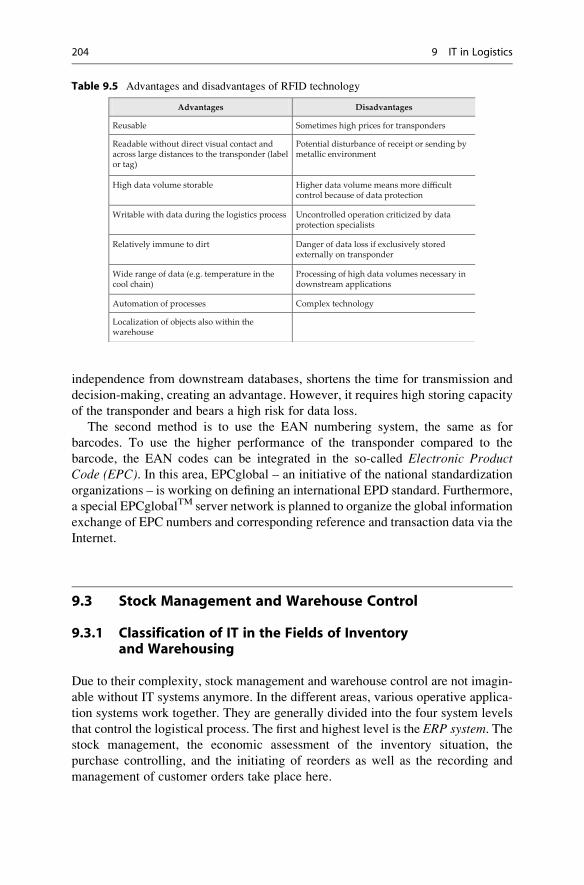
independence from downstream databases, shortens the time for transmission and
decision-making, creating an advantage. However, it requires high storing capacity
of the transponder and bears a high risk for data loss.
The second method is to use the EAN numbering system, the same as for
barcodes. To use the higher performance of the transponder compared to the
barcode, the EAN codes can be integrated in the so-called Electronic ProductCode (EPC). In this area, EPCglobal – an initiative of the national standardization
organizations – is working on defining an international EPD standard. Furthermore,
a special EPCglobalTM server network is planned to organize the global information
exchange of EPC numbers and corresponding reference and transaction data via the
Internet.
9.3 Stock Management and Warehouse Control
9.3.1 Classification of IT in the Fields of Inventoryand Warehousing
Due to their complexity, stock management and warehouse control are not imagin-
able without IT systems anymore. In the different areas, various operative applica-
tion systems work together. They are generally divided into the four system levels
that control the logistical process. The first and highest level is the ERP system. Thestock management, the economic assessment of the inventory situation, the
purchase controlling, and the initiating of reorders as well as the recording and
management of customer orders take place here.
Table 9.5 Advantages and disadvantages of RFID technology
Advantages Disadvantages
Reusable Sometimes high prices for transponders
Readable without direct visual contact and across large distances to the transponder (label or tag)
Potential disturbance of receipt or sending by metallic environment
High data volume storable Higher data volume means more difficult control because of data protection
Writable with data during the logistics process Uncontrolled operation criticized by data protection specialists
Relatively immune to dirt Danger of data loss if exclusively stored externally on transponder
Wide range of data (e.g. temperature in the cool chain)
Processing of high data volumes necessary in downstream applications
Automation of processes Complex technology
Localization of objects also within the warehouse
204 9 IT in Logistics

The second level is the warehouse management system (WMS). Its tasks are localstock management, the storage area management and assignment as well as the
stocktaking and replenishment planning.
The material flow system (MFS) is the third level. It controls the internal
transports, orders of goods coming into and going out of the warehouse as well as
the individual procedures for replenishment, picking, and stocktaking.
The fourth, lowest and purely operative level is the lower-level control systemby programmable logic control unit (PLC). Their elements control the handling
technology and data transmission systems as well as peripheral devices like printers
for receipts and barcodes.8 The network of IT systems used in or bordering the
warehouse is shown in Fig. 9.12.
9.3.2 ERP Systems
From the point of sale, the controlling and planning tasks of logistics processes are
handled by so-called Enterprise Resource Planning (ERP) systems. Mainly in the
trade sector, ERP systems considerably improve the information base for prognosis
procedures with an item-based sales data recording and stock management in
downstream, operative units. The sales forecast of a stock-managing point (ware-
house) is not exclusively based on the own sales or delivery data anymore but can
work with data from the demanding points (branches).
In detail, those are:
¢ Sold volume with respect to time and space
¢ Recording of inventory data
¢ Recording of goods leaving and entering
¢ Calculation of stock range and
¢ Assessment of delivery potential and presence of items
ERP
WMS
MFS
lower-level control system
Fig. 9.12 Network of IT systems in the warehouse
8 Cf. Arnold et al. (2008), p. 4 ff.
9.3 Stock Management and Warehouse Control 205
The ERP system is based on the process logic shown in Fig. 9.13.
More exact information about stock, movement of goods, and current sales
forecasts can reduce the level of uncertainty. Traditionally, this is achieved by
storing goods, thus investing capital. The forecasts are the more exact the more they
are based on the sales data of the end customers in the value chain. Prognosis
methods can include many different influences, e.g. trends, seasonal factors,
calendar-related factors, or marketing activities.
The utilization and exchange of information in ERP systems depend on the
depth, i.e. the level of detail, of information that enters the system. The level of
detail is divided into time-related (data from days, weeks, months), item-related
(items and the item groups), and location-related (branch or site level of the
locations). The information process is furthermore determined by the degree of
automation of the data exchange and of the information exchange. From this, in
turn, come the timeliness and quality of the information as well as the costs of the
communication infrastructure.
With respect to the forms of ERP systems, four basic variants can be described,
as shown in the following Fig. 9.14.
Stock (list)
Requirements assessm.Order proposal
Automatic retrieval
OrderBack orders
Checking of invoice
Sales dataentry
Stock managementERP stock taking
Adjustment
Accounting
1
2
Incoming goodsLabeling Storing3
4
5
6
7
Fig. 9.13 Cycle of a closed ERP system (Cf. Hertel et al. (2005), p. 225)
206 9 IT in Logistics
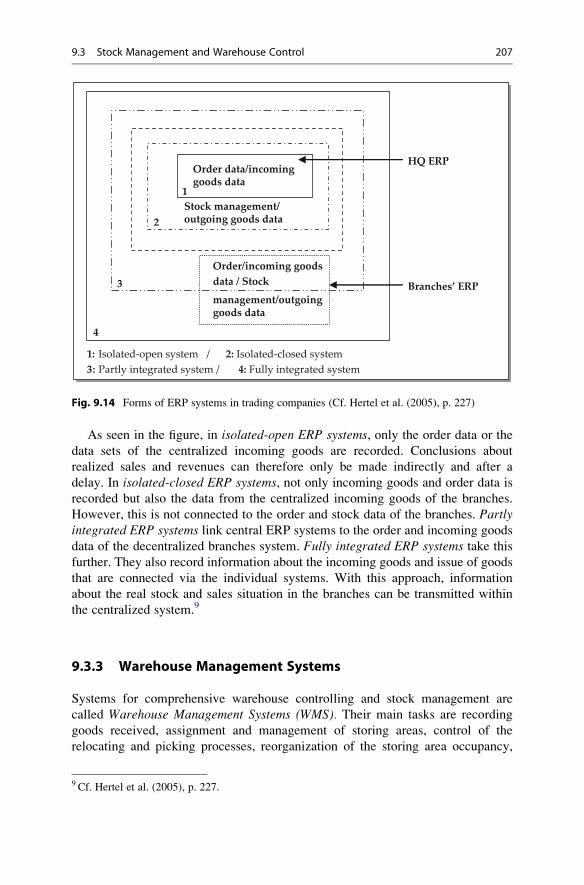
As seen in the figure, in isolated-open ERP systems, only the order data or the
data sets of the centralized incoming goods are recorded. Conclusions about
realized sales and revenues can therefore only be made indirectly and after a
delay. In isolated-closed ERP systems, not only incoming goods and order data is
recorded but also the data from the centralized incoming goods of the branches.
However, this is not connected to the order and stock data of the branches. Partlyintegrated ERP systems link central ERP systems to the order and incoming goods
data of the decentralized branches system. Fully integrated ERP systems take thisfurther. They also record information about the incoming goods and issue of goods
that are connected via the individual systems. With this approach, information
about the real stock and sales situation in the branches can be transmitted within
the centralized system.9
9.3.3 Warehouse Management Systems
Systems for comprehensive warehouse controlling and stock management are
called Warehouse Management Systems (WMS). Their main tasks are recording
goods received, assignment and management of storing areas, control of the
relocating and picking processes, reorganization of the storing area occupancy,
Order data/incoming goods data
Stock management/ outgoing goods data
Order/incoming goodsdata / Stock
management/outgoing goods data
HQ ERP
Branches’ ERP
1
2
3
4
1: Isolated-open system / 2: Isolated-closed system3: Partly integrated system / 4: Fully integrated system
Fig. 9.14 Forms of ERP systems in trading companies (Cf. Hertel et al. (2005), p. 227)
9 Cf. Hertel et al. (2005), p. 227.
9.3 Stock Management and Warehouse Control 207
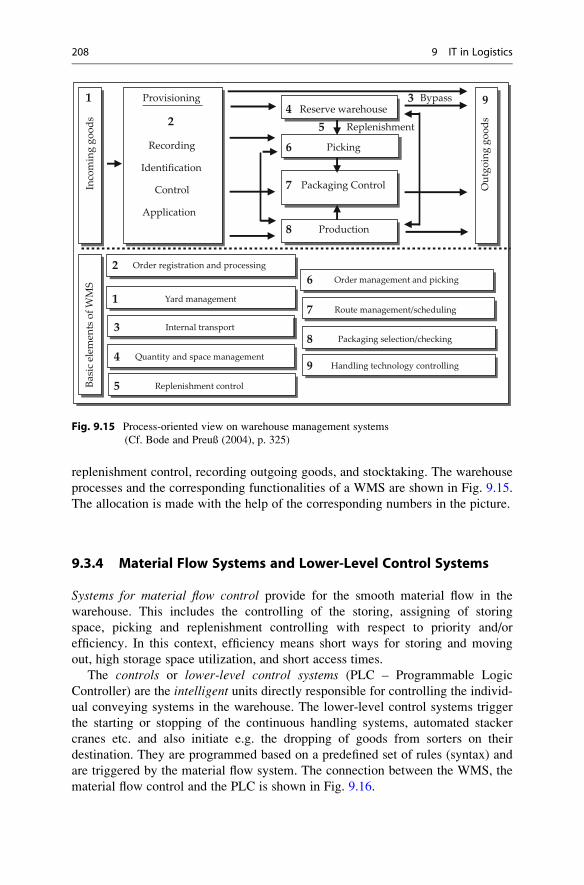
replenishment control, recording outgoing goods, and stocktaking. The warehouse
processes and the corresponding functionalities of a WMS are shown in Fig. 9.15.
The allocation is made with the help of the corresponding numbers in the picture.
9.3.4 Material Flow Systems and Lower-Level Control Systems
Systems for material flow control provide for the smooth material flow in the
warehouse. This includes the controlling of the storing, assigning of storing
space, picking and replenishment controlling with respect to priority and/or
efficiency. In this context, efficiency means short ways for storing and moving
out, high storage space utilization, and short access times.
The controls or lower-level control systems (PLC – Programmable Logic
Controller) are the intelligent units directly responsible for controlling the individ-
ual conveying systems in the warehouse. The lower-level control systems trigger
the starting or stopping of the continuous handling systems, automated stacker
cranes etc. and also initiate e.g. the dropping of goods from sorters on their
destination. They are programmed based on a predefined set of rules (syntax) and
are triggered by the material flow system. The connection between the WMS, the
material flow control and the PLC is shown in Fig. 9.16.
Reserve warehouse
Picking
Packaging Control
Production
Basi
c el
emen
ts o
f WM
SIn
com
ing
good
sProvisioning
Recording
Identification
Control
Application
Out
goin
g go
ods
1
2
Order registration and processing2
3 Bypass4
5 Replenishment
6
7
8
9
Handling technology controlling
Yard management
Internal transport
Quantity and space management
Replenishment control
Packaging selection/checking
Route management/scheduling1
3
4
5
7
8
9
Order management and picking6
Fig. 9.15 Process-oriented view on warehouse management systems
(Cf. Bode and Preuß (2004), p. 325)
208 9 IT in Logistics
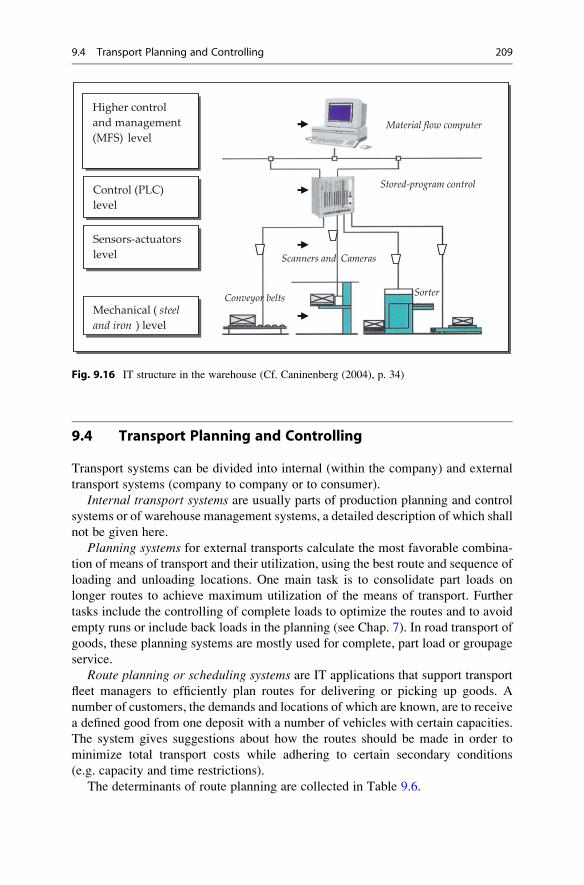
9.4 Transport Planning and Controlling
Transport systems can be divided into internal (within the company) and external
transport systems (company to company or to consumer).
Internal transport systems are usually parts of production planning and control
systems or of warehouse management systems, a detailed description of which shall
not be given here.
Planning systems for external transports calculate the most favorable combina-
tion of means of transport and their utilization, using the best route and sequence of
loading and unloading locations. One main task is to consolidate part loads on
longer routes to achieve maximum utilization of the means of transport. Further
tasks include the controlling of complete loads to optimize the routes and to avoid
empty runs or include back loads in the planning (see Chap. 7). In road transport of
goods, these planning systems are mostly used for complete, part load or groupage
service.
Route planning or scheduling systems are IT applications that support transport
fleet managers to efficiently plan routes for delivering or picking up goods. A
number of customers, the demands and locations of which are known, are to receive
a defined good from one deposit with a number of vehicles with certain capacities.
The system gives suggestions about how the routes should be made in order to
minimize total transport costs while adhering to certain secondary conditions
(e.g. capacity and time restrictions).
The determinants of route planning are collected in Table 9.6.
Higher control and management(MFS) level
Control (PLC) level
Sensors-actuators level
Mechanical ( steel and iron ) level
Stored-program control
Conveyor belts Sorter
Scanners and Cameras
Material flow computer
Fig. 9.16 IT structure in the warehouse (Cf. Caninenberg (2004), p. 34)
9.4 Transport Planning and Controlling 209
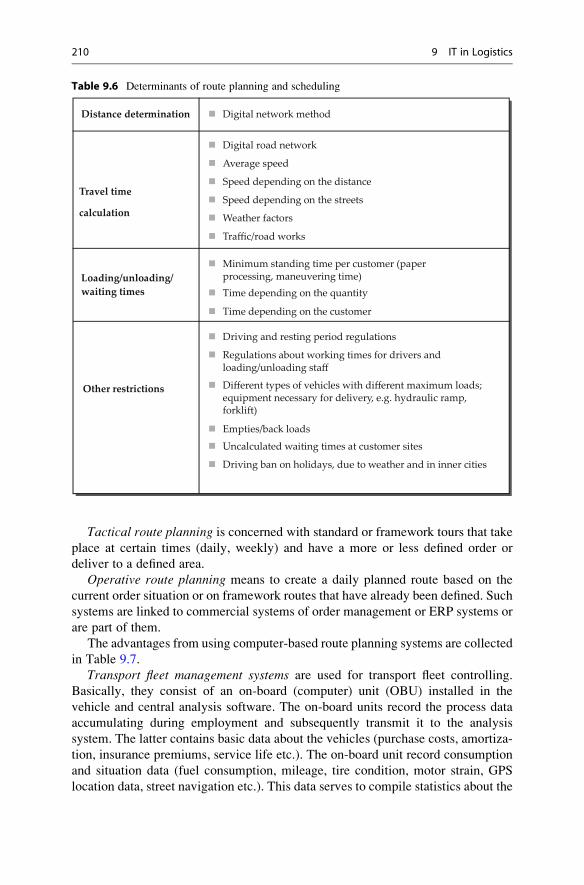
Tactical route planning is concerned with standard or framework tours that take
place at certain times (daily, weekly) and have a more or less defined order or
deliver to a defined area.
Operative route planning means to create a daily planned route based on the
current order situation or on framework routes that have already been defined. Such
systems are linked to commercial systems of order management or ERP systems or
are part of them.
The advantages from using computer-based route planning systems are collected
in Table 9.7.
Transport fleet management systems are used for transport fleet controlling.
Basically, they consist of an on-board (computer) unit (OBU) installed in the
vehicle and central analysis software. The on-board units record the process data
accumulating during employment and subsequently transmit it to the analysis
system. The latter contains basic data about the vehicles (purchase costs, amortiza-
tion, insurance premiums, service life etc.). The on-board unit record consumption
and situation data (fuel consumption, mileage, tire condition, motor strain, GPS
location data, street navigation etc.). This data serves to compile statistics about the
Table 9.6 Determinants of route planning and scheduling
Digital road network
Distance determination Digital network method
Travel time
calculation
Average speed
Speed depending on the distance
Speed depending on the streets
Weather factors
Traffic/road works
Minimum standing time per customer (paper processing, maneuvering time) Loading/unloading/
waiting times Time depending on the quantity
Time depending on the customer
Driving and resting period regulations
Other restrictions
Regulations about working times for drivers and loading/unloading staffi
Diffierent types of vehicles with diffierent maximum loads; equipment necessary for delivery, e.g. hydraulic ramp, forkli�)
Uncalculated waiting times at customer sites
Empties/back loads
Driving ban on holidays, due to weather and in inner cities
210 9 IT in Logistics

vehicle utilization and strain, indication for vehicle use (e.g. fuel-saving driving,
temperature of cooling or freezing systems), repair intervals, the ideal time of use,
and source-based cost information for individual transport activities, including the
deduction of road tolls. Transport fleet management systems are offered by vehicle
manufacturers, technical testing companies, and independent software vendors.
So-called Fleet Monitoring Systems support transport fleet management. These
systems establish a connection between the driver and the fleet management
(headquarters) via mobile communication. This connection can be used to send
the current position as well as changes to the status (driving, waiting for unloading,
unloading completed) from the vehicle. The fleet manager can assign new orders to
the most favorable vehicle based on this information; the job can be directly
assigned via mobile communication. The on-board units for road tolls in use
today generally feature the components necessary for fleet monitoring: GPS locat-
ing with digital net as well as mobile communication with the GSM net.
Tracking & tracing systems make possible the more or less complete tracking
of transported goods and vehicles and, at the same time, ensure later traceability.
Information about the current location of a shipment are important for interventions
in the transporting process or for initiating counter-measures like a substitute
delivery in case of delay, loss, or changes to the location of receipt. Transparency
of the status during the transport process is also an important quality factor for
Table 9.7 Potential advantages of route planning
Rationalizing potential between three and five per cent of the transport costs Transparency across the full transport process
Competent information for tactical and strategic decisions
Competent scheduling in the available time
Transparency across the full transport process
Reduction of administrative effiorts
Facilitation of the process
Systematization of the planning process
Reduction of risks during holidays or absence due to illness
Same workloads for all drivers
Beffer adherence to delivery times
More information about orders and trips
Beffer delivery service by increasing the order timeBeffer compliance with delivery restrictions
Potential advantages of trip planning
For executives/management
For transport fleet managers
For drivers
For customers
9.4 Transport Planning and Controlling 211
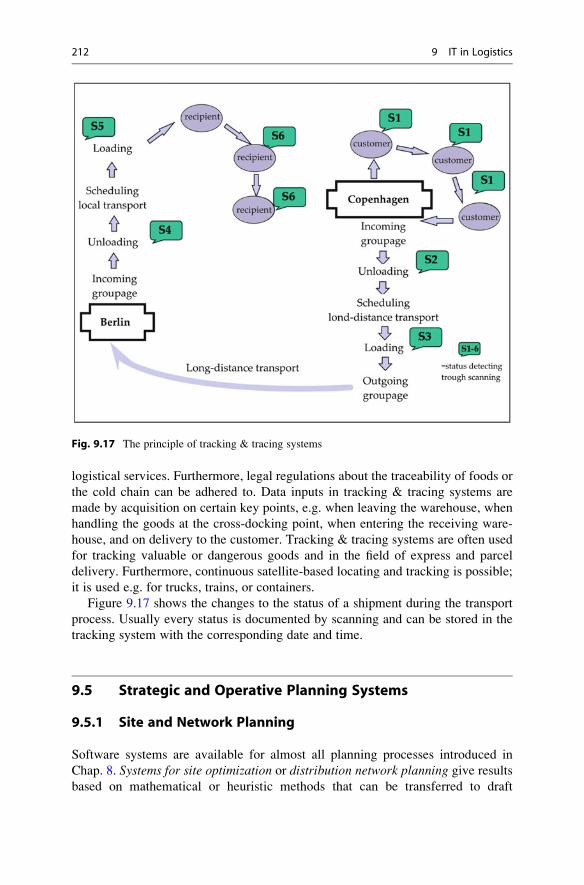
logistical services. Furthermore, legal regulations about the traceability of foods or
the cold chain can be adhered to. Data inputs in tracking & tracing systems are
made by acquisition on certain key points, e.g. when leaving the warehouse, when
handling the goods at the cross-docking point, when entering the receiving ware-
house, and on delivery to the customer. Tracking & tracing systems are often used
for tracking valuable or dangerous goods and in the field of express and parcel
delivery. Furthermore, continuous satellite-based locating and tracking is possible;
it is used e.g. for trucks, trains, or containers.
Figure 9.17 shows the changes to the status of a shipment during the transport
process. Usually every status is documented by scanning and can be stored in the
tracking system with the corresponding date and time.
9.5 Strategic and Operative Planning Systems
9.5.1 Site and Network Planning
Software systems are available for almost all planning processes introduced in
Chap. 8. Systems for site optimization or distribution network planning give results
based on mathematical or heuristic methods that can be transferred to draft
Fig. 9.17 The principle of tracking & tracing systems
212 9 IT in Logistics
decisions after a qualitative assessment. The quality of the results from IT
applications largely depends on the possibilities to include parameters and
influencing factors. The bases of such systems are always mass data in the form
of individual business events (number of shipments, locations of dispatch and
receipt, size, volume etc.) from which ideal warehouse locations or distribution
networks can be calculated after different iteration processes under the same
conditions. These optimization systems support management decisions; but with
soft and non-quantifiable decision factors always having to be taken into account aswell; they cannot replace them.
9.5.2 E-procurement
On the operative level, the Internet has been responsible for considerable changes to
the purchasing process; this is described by the term e-procurement. The data
exchange between suppliers and buyers had been realized via EDI. The Internet,
however, has made possible unlimited and easy contact. All business processes take
place electronically, ideally without documents. Decentralized ordering of goods
by the buyer who also overviews the process is possible. All of this takes place on a
virtual market place which is used as a transaction platform that ensures the
information supply between sellers and buyers and supports the initiation and,
where possible, the realization of transactions. Market places can be divided into
horizontal – i.e. for trans-sector products and services, e.g. for energy and
office material – and vertical, sector specific – e.g. for the automobile or healthcare
sector – trading places. Solution concepts are mostly simple B2B approaches
(market place or catalog solutions). Catalog solutions are favorable for standardized
products with little complexity. The Internet ensures a high market transparency.
Low prices or at least low price volatility and a regular demand are assumed.
Sometimes, configuration via catalog systems is possible.10 There is a certain
price level where price comparison or explicit tendering is better. Such tendering
processes assume a buyer market situation. The goal is to get the best acquisition
price. The specific requirements are tendered. After the pre-selection of suppliers,
the process is reduced to pure price negotiations. One problem is the taking
into account of unequal suppliers or quality. During the tendering, the price
development is downward. The best price at a certain point is shown to all suppliers
who can see potential for improvements from this.
The admission to these B2B platforms is defined by selection criteria like sector
specialization, market share, neutrality, transparency, and information services.
A further step towards integration is setting up a B2B desktop-purchasing
system which makes possible the automatic execution of many internal processes
with numerous market places and, if possible, all suppliers. The goal is to shape
all workflows within the company as well as to include the solution in existing
10 Cf. Stieglitz (2003), p. 266 ff.
9.5 Strategic and Operative Planning Systems 213

ERP/SCM software. Such systems enable companies to unbundle the processes.
The preparation of offers and the completing of order forms are no longer neces-
sary. If the payment is made with a purchasing card or a credit note, the same is true
for invoice checking, manual receipt of payment, or receipt archiving.
Beyond the purchasing sector, the term e-logistics has been established for the
strategic planning and realization of logistics systems for Internet-based business.
The operative and administrative controlling of logistics processes for supply to end
customers in Internet trade, cargo pools for setting up and bundling transport space,
but also pure information logistics services can be subsumed under the term
e-logistics. In this context, information logistics means the information supply
and the management of information flows to realize business processes.11
9.5.3 Enterprise Resource Planning
Based on Material Requirements Planning (MRP I) systems, systems for sequential
material requirements and capacity planning, called Manufacturing Resource
Planning (MRP II), developed mainly in production areas. A further development
was Production Planning Systems (PPS). Following an integrated approach, Enter-prise Resource Planning (ERP) systems go beyond production and make possible
the supervision of all company resources. The functionalities of ERP systems
primarily have an operative character. However, they also supply data for strategic
planning decisions. Using these transaction-oriented ERP systems, company
resources like raw materials, finished goods, staff, and financial means are
connected to achieve the company goal; and efficient suggestions are made for
the process and dimensioning of transactions. Following guidelines by the manage-
ment and initiated by the order habits of the customers, ERP software solutions
manage and control all business processes of a company in the commercial sense.
An ERP system can include the function areas sales, order processing, purchas-
ing, materials management and logistics, finance and controlling, human resources,
quality management and, finally, production. It is crucial that the data storage and
the process handling in an ERP solution takes place cross-functionally. ERP
systems specifically adapted for logistics connect, manage, control, and monitor
the logistical sub-processes from the order handling to the delivery or even to the
invoicing and monitoring of the receipt of money. WMS and ERP systems can be
independent software packages, e.g. in grown IT structures in a company. However,
they should be closely connected to each other. In case of purchasing new equip-
ment in this area, it is sensible to opt for an integrated WSM/ERP solution.
11 Cf. Straube (2004), p. 69 ff.
214 9 IT in Logistics

9.5.4 Supply Chain Planning
Leaving the organizational parts of an individual company that maps the different
business processes – maybe across several sites – with ERP, Supply Chain Man-
agement (SCM) is the bordering field. SCM systems work on three different levels:
¢ Supply Chain Design (SCD)
¢ Supply Chain Planning (SCP)
¢ Supply Chain Execution (SCE)
The aim of SCM systems is to design, plan, and control the flow of materials and
the cross-company processes during the complete logistical chain, from raw
materials and production, to trade and, eventually, to the customer. Doing so, a
multitude of connections between interfaces with different characters takes place
(see Fig. 9.16). Like ERP systems, SCM systems tend to have an operative
character.
The main task of Supply Chain Design is the designing of logistics networks andthe valuing of the necessary investments.
In the field of Supply Chain Planning, IT systems realize consumption or
requirements planning, stock planning, transport planning etc. in the logistics
chain and calculate them for coming periods. Such calculations and plans for
logistical capacities derived from them are realized by specialist AdvancedPlanning and Scheduling Systems (APS).
Supply Chain Execution (SCE) systems use IT functionalities to support the
operative realization in the fields of order processing, production, warehousing, and
transport.
The connections between Supply Chain Design, Supply Chain Planning and
Supply Chain Execution are shown in Fig. 9.18.
Case Study 9.2: Enterprise Resource Planning for Supply Chain Processes
This case study describes the implementation and the employment of an ERP
system at a warehousing services provider. Because of the detailed description,
topics from the other chapters come up as well. This can be seen as proof of the
wide-reaching character of IT systems for logistical tasks.
1. The CompanyAarau storehouses plc, in Switzerland, offers logistics services as well as
integrated logistics solutions for nationally and internationally (cross-borders)
active clients. Besides classic logistics services like transporting, warehousing,
and handling, services like stock management, quality control, packing, label-
ing, and customizing are offered. The company realizes crucial parts of their
clients’ logistics processes.
These offers are connected with certain requirements:
¢ Universal business processes, across company borders between industry,
logistics and trade
9.5 Strategic and Operative Planning Systems 215
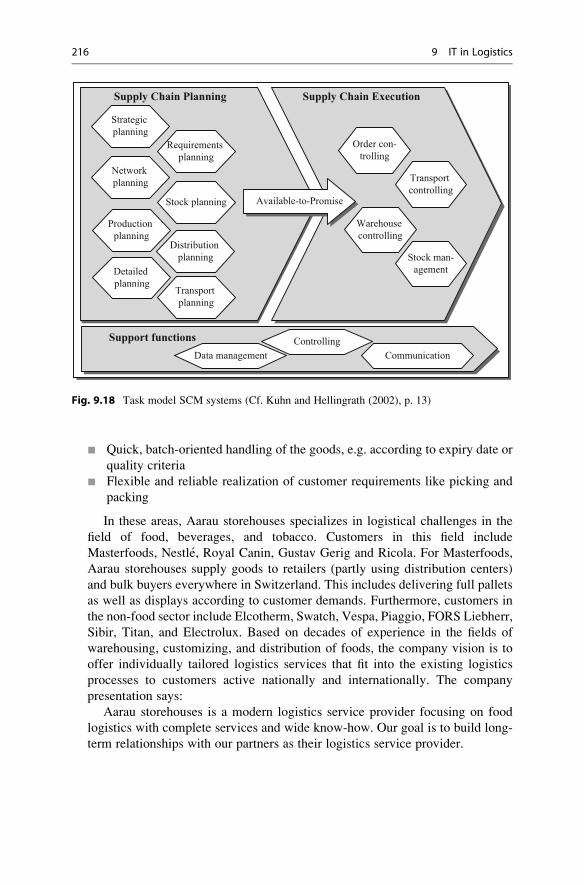
¢ Quick, batch-oriented handling of the goods, e.g. according to expiry date or
quality criteria
¢ Flexible and reliable realization of customer requirements like picking and
packing
In these areas, Aarau storehouses specializes in logistical challenges in the
field of food, beverages, and tobacco. Customers in this field include
Masterfoods, Nestle, Royal Canin, Gustav Gerig and Ricola. For Masterfoods,
Aarau storehouses supply goods to retailers (partly using distribution centers)
and bulk buyers everywhere in Switzerland. This includes delivering full pallets
as well as displays according to customer demands. Furthermore, customers in
the non-food sector include Elcotherm, Swatch, Vespa, Piaggio, FORS Liebherr,
Sibir, Titan, and Electrolux. Based on decades of experience in the fields of
warehousing, customizing, and distribution of foods, the company vision is to
offer individually tailored logistics services that fit into the existing logistics
processes to customers active nationally and internationally. The company
presentation says:
Aarau storehouses is a modern logistics service provider focusing on food
logistics with complete services and wide know-how. Our goal is to build long-
term relationships with our partners as their logistics service provider.
Supply Chain Planning
Strategic planning
Network planning
Production planning
Detailed planning
Requirements planning
Stock planning
Transport planning
Distribution planning
Order con-trolling
Warehouse controlling
Transport controlling
Stock man-agement
Supply Chain Execution
Support functionsData management Communication
Controlling
Available-to-Promise
Fig. 9.18 Task model SCM systems (Cf. Kuhn and Hellingrath (2002), p. 13)
216 9 IT in Logistics
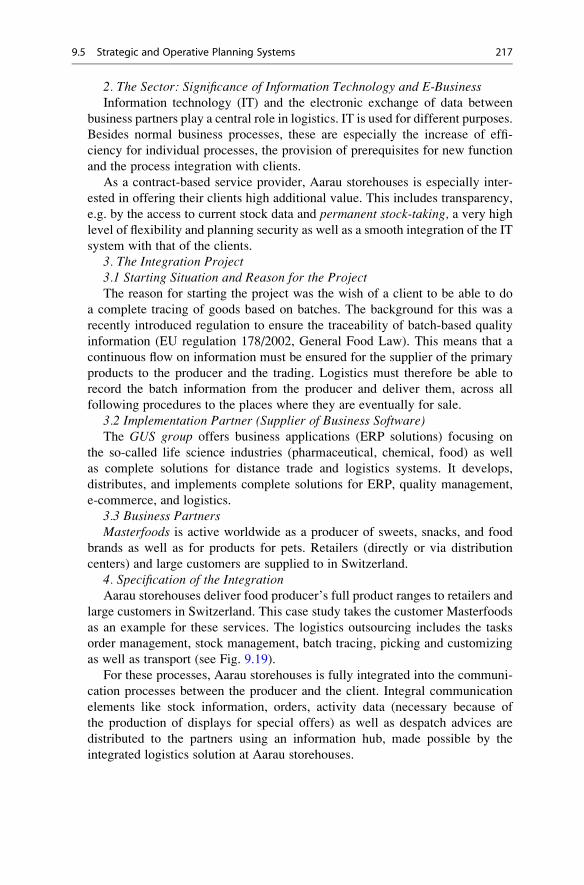
2. The Sector: Significance of Information Technology and E-BusinessInformation technology (IT) and the electronic exchange of data between
business partners play a central role in logistics. IT is used for different purposes.
Besides normal business processes, these are especially the increase of effi-
ciency for individual processes, the provision of prerequisites for new function
and the process integration with clients.
As a contract-based service provider, Aarau storehouses is especially inter-
ested in offering their clients high additional value. This includes transparency,
e.g. by the access to current stock data and permanent stock-taking, a very high
level of flexibility and planning security as well as a smooth integration of the IT
system with that of the clients.
3. The Integration Project3.1 Starting Situation and Reason for the ProjectThe reason for starting the project was the wish of a client to be able to do
a complete tracing of goods based on batches. The background for this was a
recently introduced regulation to ensure the traceability of batch-based quality
information (EU regulation 178/2002, General Food Law). This means that a
continuous flow on information must be ensured for the supplier of the primary
products to the producer and the trading. Logistics must therefore be able to
record the batch information from the producer and deliver them, across all
following procedures to the places where they are eventually for sale.
3.2 Implementation Partner (Supplier of Business Software)The GUS group offers business applications (ERP solutions) focusing on
the so-called life science industries (pharmaceutical, chemical, food) as well
as complete solutions for distance trade and logistics systems. It develops,
distributes, and implements complete solutions for ERP, quality management,
e-commerce, and logistics.
3.3 Business PartnersMasterfoods is active worldwide as a producer of sweets, snacks, and food
brands as well as for products for pets. Retailers (directly or via distribution
centers) and large customers are supplied to in Switzerland.
4. Specification of the IntegrationAarau storehouses deliver food producer’s full product ranges to retailers and
large customers in Switzerland. This case study takes the customer Masterfoods
as an example for these services. The logistics outsourcing includes the tasks
order management, stock management, batch tracing, picking and customizing
as well as transport (see Fig. 9.19).
For these processes, Aarau storehouses is fully integrated into the communi-
cation processes between the producer and the client. Integral communication
elements like stock information, orders, activity data (necessary because of
the production of displays for special offers) as well as despatch advices are
distributed to the partners using an information hub, made possible by the
integrated logistics solution at Aarau storehouses.
9.5 Strategic and Operative Planning Systems 217
¢ Based on the sales planning between Masterfoods and the retailer, Aarau
storehouses daily receives shipping order information from the Masterfoods
headquarters.
¢ From this, Aarau storehouses creates the picking and delivery jobs for
internal logistics and distribution in Switzerland.
¢ Based on the delivery data, the retailers receive dispatch advices.
¢ Masterfoods receives regularly updated stock information (permanent stock-
taking).
¢ Uncalculated waiting times at customer locations:
Based on the stock data and the sales planning, Masterfoods generates
production orders in their own sites and delivers to Aarau storehouses.
Aarau storehouses stores a stock from few days to 3 months, depending on the
product. Usually, the products are delivered within 24–48 h after an order
requiring high delivery precision and quality.
The quality orientation made possible by the integrated logistics and IT
concept is aimed most of all at the batch traceability required in the food,
beverage and tobacco sector. As a result, Masterfoods can see which product
was delivered to which customer with the batch number of a product. This also
makes possible the quick and targeted realization of possible product recalls.
4.1 View ProcessAarau storehouses divides the logistical process into receipt of goods/storing,
order management, picking, and customizing. Customizing includes services
like creating product display with a defined mixture of goods. Additionally,
quality management accompanying the process and batch tracing takes place.
The task, jointly completed by Masterfoods and Aarau storehouses, secures a
high level of delivery precision. It has to be noted that the stock management
Fig. 9.19 Integration of Masterfoods and retailing
218 9 IT in Logistics

works according to FeFo: first expire, first out. The respective product with the
nearest expiry date is delivered first; the date of receipt is not taken into account.
This strict monitoring of batches and expiry dates ensures that no product that is
due too early will get into the client’s sales channel. The basic processes can be
individually adapted or expanded for each customer to fit into their own logistics
processes. The following describes the processes order management and
picking, as they have been adapted for Masterfoods.
4.2 Order Management and Picking
¢ Three times every day (5:00 a.m., 10:30 a.m., 4:30 p.m.), shipment order data
is sent from Masterfoods to the ERP system of Aarau storehouses, using a
leased line.
¢ If the goods are in stock, the order is passed on to picking and transport
pre-planning. Otherwise, an out-of-stock message is generated and sent to
Masterfoods.
¢ In pre-planning, the orders are assigned to a delivery zone. Detailed route
planning takes place after this in the transport department.
¢ The dispatch message is automatically sent by EDI or fax to the retailer.
¢ The processes shipping orders and reported stock data is reported to
Masterfoods with each daily closing.
¢ Picking and handling of reorders.
¢ From the order data from Masterfoods, picking orders are generated and
realized in a two-shift system.
¢ Sorted to optimize routes, the picking orders are transmitted via radio data
transmission to the picking machines. The ERP system, in dialogue with the
radio terminal, automatically confirms the orders and gives the remaining
quantity to update the stock information.
¢ If a minimum stock quantity is not met in the picking warehouse, a relocating
order from the main warehouse (according to FeFo) is automatically sent to
the displays of the forklift drivers.
¢ Every physical movement (storing, replenishment, outgoing) is monitored
within the warehouse area by the ERP system. This guarantees complete
control over the flow of goods and the expiry dates.
¢ Every picking order is completed with the automatic printing of a pallet label
(EAN 128) at a printer in the area.
4.3 The ApplicationThe described business processes and the corresponding cross-company
communication largely rely on the adapted, batch-oriented ERP system GUSERP CHARISMA as the central logistics system. The system performs the
following tasks:
¢ Keeping of customer data, order data, stock lists as well as stock information,
batch information and performance data
¢ Automatically transforming incoming orders to picking or customizing
orders and controlling the picking
9.5 Strategic and Operative Planning Systems 219
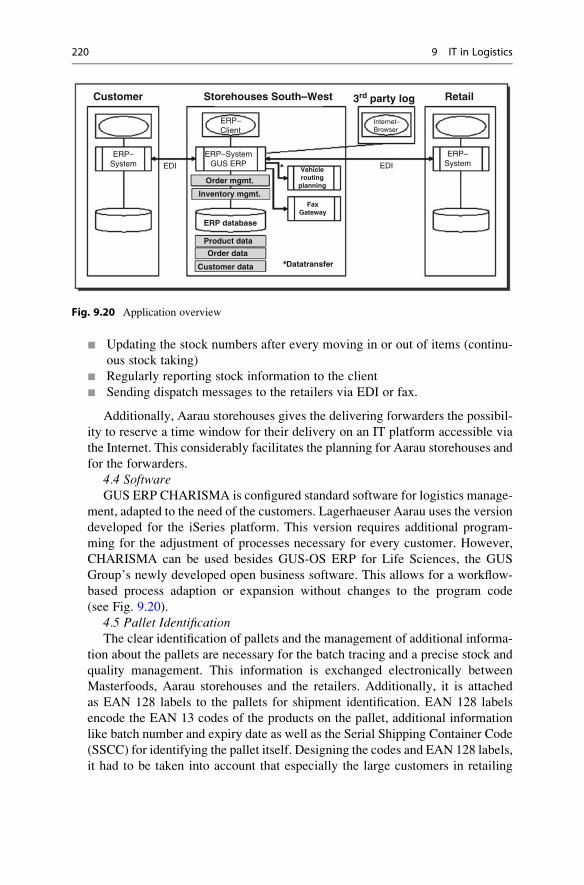
¢ Updating the stock numbers after every moving in or out of items (continu-
ous stock taking)
¢ Regularly reporting stock information to the client
¢ Sending dispatch messages to the retailers via EDI or fax.
Additionally, Aarau storehouses gives the delivering forwarders the possibil-
ity to reserve a time window for their delivery on an IT platform accessible via
the Internet. This considerably facilitates the planning for Aarau storehouses and
for the forwarders.
4.4 SoftwareGUS ERP CHARISMA is configured standard software for logistics manage-
ment, adapted to the need of the customers. Lagerhaeuser Aarau uses the version
developed for the iSeries platform. This version requires additional program-
ming for the adjustment of processes necessary for every customer. However,
CHARISMA can be used besides GUS-OS ERP for Life Sciences, the GUS
Group’s newly developed open business software. This allows for a workflow-
based process adaption or expansion without changes to the program code
(see Fig. 9.20).
4.5 Pallet IdentificationThe clear identification of pallets and the management of additional informa-
tion about the pallets are necessary for the batch tracing and a precise stock and
quality management. This information is exchanged electronically between
Masterfoods, Aarau storehouses and the retailers. Additionally, it is attached
as EAN 128 labels to the pallets for shipment identification. EAN 128 labels
encode the EAN 13 codes of the products on the pallet, additional information
like batch number and expiry date as well as the Serial Shipping Container Code
(SSCC) for identifying the pallet itself. Designing the codes and EAN 128 labels,
it had to be taken into account that especially the large customers in retailing
Customer Storehouses South–West 3rd party log Retail
ERP–System EDI
ERP–Client
ERP–SystemGUS ERP
Order mgmt.
Inventory mgmt.
ERP database
Product data
Order data
Customer data Datatransfer
FaxGateway
Vehiclerouting
planning
EDI
Internet–Browser
ERP–System
Fig. 9.20 Application overview
220 9 IT in Logistics

have, respectively, own requirements for the code structure within the relatively
open standard.
4.6 Reference DataIt is essential for the realization of batch tracing and a precise stock manage-
ment that even parts of pallets can be clearly identified. This requires informa-
tion about the layout of pallets (reference data) to know e.g. how many layers
a pallet has and how many units (boxes) are stacked per layer. This data is
generally provided to Aarau storehouses. However, the incoming goods do not
always correspond to the expected formats. In such cases, the goods are
standardized during the checking of incoming goods. This makes possible the
realization of processes according to the requirements in the following logistics
chain.
4.7 The TechnologyThe ERP system at Aarau storehouses is operated at the Schafisheim site on
an IBM iSeries AS/400 system. Due to the starting situation, a centralized
solution with access via Internet or VPN was chosen. GUS ERP Charisma can
be fully operated via Internet access. Additionally, various password-protected
areas are available (see Fig. 9.21).
The security of EDP applications and the availability of data and information
is a top priority for Aarau storehouses. To achieve this, all relevant data is
mirrored on the central system in the Aarau storehouses company headquarters
in Lausanne, in the central distribution center in Spreitenbach as well in the
regional warehouse in Schafisheim. Communication with customers and
retailers takes place by Internet and EDI, in some cases still via fax.
5. EvaluationUpon introduction of the system, some adaptions had to be made to the
processes, mostly in picking. A higher discipline is required for recording
Fig. 9.21 System overview
9.5 Strategic and Operative Planning Systems 221
remaining quantities and handling sub-quantities. Despite this, the process
adaption could be realized smoothly. The requirements set by Masterfoods
could be met.
The realized integrated logistics concept means an increase in efficiency,
more transparency, and cost reduction for Masterfoods:
¢ Storing space Masterfoods needs does only have to hold the preliminary
products and the connected interim spaces
¢ Delivery to retailers is realized from a central location, despite the goods
coming from different sites
¢ Processing time in the warehouse can be significantly reduced
¢ Direct transfer of order data prevents mistakes
¢ Error rate was reduced to few per mils
¢ Delivery reliability was increased
¢ Batch traceability was completely realized; EU regulation 178/2002 is
constantly met
¢ Average weight per order was significantly increased, reducing the transport
costs
¢ Permanent stock taking renders the expensive yearly process partly
unnecessary
¢ Logistics costs can be analyzed based on transactions down to the level of the
delivery note. With this, the client has a tool for detailed cost analysis of their
sales channels
6. Success FactorsThe most important success factor is for the logistics service provider to
record and map the customer requirements as precisely as possible. This means
that the business model of the service provider must be designed in a way that it
can flexibly take over sub-processes from different clients’ logistics and create
synergy effects despite the differences. Aarau storehouses has designed their
business processes and ERP system in a way that it can be connected to or even
integrated in the process and system architecture of their clients.
The key to this is an information system that automates, records, and controls
the individual processes. With every sector, every client and even every client’s
customer introducing requirements to the complete system, there is not just one
correct process for the food industry but there are many. And these variants
create the differentiation potentials of the clients.
The competence of Aarau storehouses is, on the one hand, to include the
diversity but, on the other hand, to make it into standardized and, in the sense of
a defined quality, unified sub-processes. The business software is a central
component for this; the diversity can only be mapped if the data model is
correspondingly expandable and if the processes can be mapped flexibly.
222 9 IT in Logistics
Review Questions
1. What is information logistics?
2. Explain the term ‘communication standard’.
3. Describe the EDI principle.
4. Outline the informational connections in ERP systems.
5. What are the differences between open and closed ERP systems?
6. What are the central functions of a warehouse management system?
7. State the difference between the fleet monitoring- and tracing & tracking
systems and route planning.
8. What is the difference between enterprise resource planning and supply
chain planning?
9. What is the number of the shipping unit?
10. What are the advantages of transponders?
Additional Literature
Arnold, D., Kuhn, A., Isermann, H., & Tempelmeier, H. (2008). Handbuch Logistik. Heidelberg:Springer-Verlag.
Franke, W., & Dangelmaier, W. (Ed.). (2006). RFID – Leitfaden fur die Logistik. Wiesbaden:
Gabler.
Kopfer, H., & Bierwirth, C. (Ed.). (1999). Logistik Management: Intelligente I + K Technologien.Berlin/Heidelberg: Springer.
Scheer, A. W. (Ed.). (2008). Rechnungswesen und EDV. Heidelberg: Springer.Schutte, R., Vering, O., & Wiese, J. (2000). Erfolgreiche Geschaftsprozesse durch standardisierte
Warenwirtschaftssysteme. Heidelberg/Berlin: Springer.Stadtler, H., & Kilger, C. (2007). Supply chain management and advanced planning. Berlin:
Springer.
Straube, F. (2004). E-Logistics – Ganzheitliches Logistikmanagement. Berlin: Springer.ten Hompel, M., & Schmidt, T. (2009). Warehouse management. Berlin: Springer.ten Hompel, M., et al. (2004). Software in der Logistik 2004. Munchen: Huss-Vlg.
Wildemann, H. (2002). Distributionslogistik. Munchen: TCW.
Additional Literature 223
Investment and Financing in Logistics 10
Learning Objectives
Establishing and maintaining the logistics systems is capital-intensive. This is true
for systems in both macro-logistics and micro-logistics. Therefore, issues of
investment and financing play a central role in logistics. A cross-company view
on supply chain management, on additional financial and investment figures, and –
as a consequence – on the capital flows and payment processes in the financial
supply chain offers additional approaches to optimize fragmentation and collabo-
ration within value chains.
This chapter aims to familiarize the reader with the management of capital
requirement, capital utilization, and net working capital. Different forms of
investment financing will highlight the strategic significance of financing.
Established and novel concepts relating to this will be presented and service
providers for financing stock inventory, logistics real estate, and logistics
movables will be introduced. By considering the various agents in logistics
chains, the reader will be provided with guidelines as to the optimization of
financing and of financing processes, and insights into the strategic and opera-
tional relationship between financing and logistics will be given.
Keywords
¢ Fixed assets
¢ Current assets
¢ Working capital
¢ Supply-chain finance
¢ Cash-to-cash-cycle
¢ Capital tie-up
¢ Leasing
¢ Pay on production
H. Gleissner and J.C. Femerling, Logistics, Springer Texts in Business and Economics,
DOI 10.1007/978-3-319-01769-3_10, # Springer International Publishing Switzerland 2013
225
10.1 The Basics
10.1.1 Managing Capital Requirement, Origin of Capitaland Capital Utilization
Investment and financing are areas of financial management within a company.
Essentially, finance is the management of capital requirement, origin of capital(financing), and capital utilization (investment).1 Financing is defined as the
procurement of required capital to make necessary operating investments.
Depending on the kind of capital procurement, we can distinguish between external
and internal financing. In cases of external financing, a company raises capital
through individuals, banks, or through the capital market. Internal financingdistinguishes between self-financing, provisions-based financing, and restructuring
of assets through released capital. It is vital that internal financing be closely
aligned with the operational performance processes and sales processes. As a
consequence and in contrast to the management of external financing, internal
financing must not solely be managed by the financial department of a company.
Instead, the management of working capital, of capital requirement, and of capital
utilization needs to be integrated into the management and leadership process of all
other operational functions along the value chain in a goal-oriented manner. This
also includes logistical functions and supply chain management, as illustrated in
Fig. 10.1.2
Forms of financing and financial instruments can be differentiated according to a
variety of criteria. In cases of external financing, these instruments are commercial
credits and bank loans, credit substitutes, and special forms of financing of current
assets. A company may also rely on short-term financing in the form of e.g. bank
overdrafts, trade credits, or loans to customers (commercial credits) (see Sect. 10.2.1).
Regardless of the forms of financing, all credit and capital relationships of a company
are usually recorded on the balance sheet on a specific balance sheet date. The balance
sheet itemizes a company’s assets and liabilities and shows its equity and capital as the
sum of all financial obligations towards owners and creditors. The asset side of a
balance sheet discloses how the assets have been utilized while the liabilities side
reveals the source of funds, i.e. it lists all claims of equity providers and debt capital
providers.
Investments are made to acquire or provide capacities in the areas of procure-
ment, production, distribution, and disposal, which are all closely intertwined with
logistic functions. We can distinguish between real investments (manufacturing
plants, semi-finished and finished products), immaterial investments (investments
in research and development) and financial investments (equity rights, legal
claims). Further distinctions can be drawn between original or initial investments
for the (initial) generation of capacities and investments in expansion, replacement,
1 Cf. Peridon et al. (2009), p. 10.2 Cf. Pfohl et al. (2003), p. 21.
226 10 Investment and Financing in Logistics

and maintenance. The latter types may also be categorized as rationalization
investments, conversion investments, or diversification investments, depending
on the desired changes in the provision of services and the service portfolio.3
The most important financing requirements of logistical investments are:
¢ Inventory and transport
¢ Purchase, construction, and furnishing of logistics real estate
¢ Utilization of logistics real estate
If logistical capital spending decisions are being made, investment calculating
procedures may help assess the profitability of an investment in, for example, fixed
assets. These procedures can either involve static investment calculations (pay-off
method, cost comparison method) or dynamic investment calculations (annuity
method, internal rate of return method, net present value method). If investments
are made in current assets – e.g. to enhance the service level of delivery through
increased stock – the effects on the company value need to be calculated.
Instruments of the cash flow statement or the discounted cash flow calculation
(DCF), for instance, may be used to this end.4 Yield analyses also needs to be
applied to supply chains. A key figure in assessing the effectiveness and analysing
Fig. 10.1 Financial processes in logistics and supply chain management
(Cf. Jehle and von Haaren (2008), p. 4)
3 Cf. Thomen and Achleitner (2006), p. 602 et seq.4 Cf. Pfohl et al. (2003), p. 12.
10.1 The Basics 227
the profitability of supply chains is the return on investment (ROI) (see case study11.2). Especially assets in the form of current assets decrease profits as they entail
interest expense from capital tie-up. In addition, they also lock up capital which
then cannot be used for other purposes. Logistics costs have a bearing on profit
margins, too. These are costs such as order processing costs, transport costs,
warehousing costs, and inventory costs. The speed of capital turnover is determined
by the financing alternatives for the assets needed.
10.1.2 Managing Fixed Assets and Current Assets
Fixed assets comprise all durable assets (goodwill, company value), long-term
financial assets (interests or bonds), and tangible assets (properties, buildings, plants
and equipment, machinery). Their purpose is to support the on-going business. From
a logistical viewpoint, fixed assets mainly include logistics real estate, machinery
(high-bay warehouses, packing machines), equipment (conveyors, picking systems)
and means of transport (vehicles, ships, planes) (see Sect. 5.4.2).5 The management
of fixed assets aims at the least possible capital tie-up in these tangible assets. This
can be achieved, for example, through:
¢ Efficient utilization of existing fixed assets
¢ Amortization of assets which are not necessary for business (anymore) or which
do not yield the capital costs
¢ Avoiding an outflow of funds as a result of a purchase
Current assets comprise all items that remain in the company for a short period
of time, such as the inventory of finished and semi-finished products, bank balances,
or cash balances. The optimization of current assets has its primary aim in reducing
stock and (customer) claims so that tied-up capital is freed up. Reducing current
assets allows a company to at least partly finance their capital requirements from
their own resources. Approaches in reducing current assets include6:
¢ Efficiently structured and improved operational financing processes and money
processes
¢ Integrated business planning in regard to customers, suppliers, financial institutes,
and investors
¢ Goal-oriented collaboration across all departments involved in the value chain
The working capital is calculated as current assets minus short-term liabilities
from deliveries and services and other (possible) current liabilities. Figure 10.2
shows the working capital as displayed on a company’s balance sheet.7
5 Cf. Gomm (2008), S. 106.6 Cf. Hofmann (2005), p. 206 et seq.7 Cf. Klepzig (2010), p. 18.
228 10 Investment and Financing in Logistics
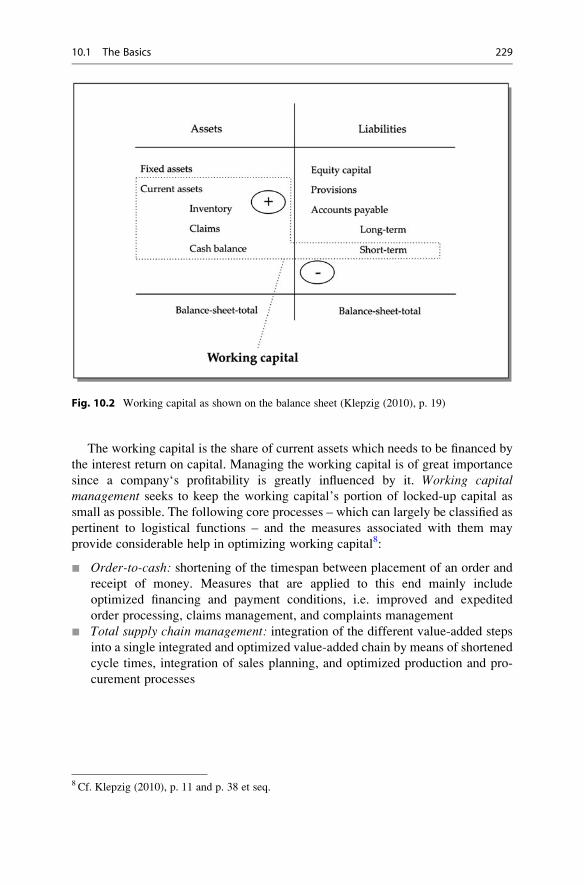
The working capital is the share of current assets which needs to be financed by
the interest return on capital. Managing the working capital is of great importance
since a company‘s profitability is greatly influenced by it. Working capitalmanagement seeks to keep the working capital’s portion of locked-up capital as
small as possible. The following core processes – which can largely be classified as
pertinent to logistical functions – and the measures associated with them may
provide considerable help in optimizing working capital8:
¢ Order-to-cash: shortening of the timespan between placement of an order and
receipt of money. Measures that are applied to this end mainly include
optimized financing and payment conditions, i.e. improved and expedited
order processing, claims management, and complaints management
¢ Total supply chain management: integration of the different value-added steps
into a single integrated and optimized value-added chain by means of shortened
cycle times, integration of sales planning, and optimized production and pro-
curement processes
Fig. 10.2 Working capital as shown on the balance sheet (Klepzig (2010), p. 19)
8 Cf. Klepzig (2010), p. 11 and p. 38 et seq.
10.1 The Basics 229
¢ Purchase-to-Pay: optimization of the timespan between purchase and payment
by means of changes made to financing and payment conditions, through a
favourable choice of suppliers, through optimized order processing and audit,
through optimizations in the incoming goods department, and by means of
liabilities management.
10.1.3 Financial Supply Chain Concept
While supply chain management has so far only been concerned with the optimi-
zation of the flows of material, goods, and information (see Sect. 3.2), the concept
of financial supply chains also includes cash flows during production and along
supply chains. The management activities dealing with cash flows are termed
supply chain finance or financial supply chain.9
Examining the flow of financial means allows us to outline the non-monetary
service processes of a supply chain from a financial viewpoint. Trade relationships
with suppliers and customers usually entail cash flows that are in reverse to the flow
of goods. Financial supply chain management aims to10
¢ Increase the transparency of financial flows
¢ Improve the analysis and planning of cash flows
¢ Reduce tied-up current assets
¢ Optimize financial process costs
Furthermore, the number of parties and persons involved increases when exam-
ining financial supply chains. Traditional supply chains are made up of stakeholders
such as suppliers, producers, logistics service providers, customers, and consumers.
Financial supply chains, however, may also include internal players such as the
financial department and external players such as banks (large banks, direct banks,
investment banks), financial service providers (leasing or factoring companies) and
investors (credit institutions, insurance companies, enterprises, private persons,
institutional investors).11 It is important that all of these players be considered in
a supply chain since payment defaults may occur at one stage if delivery has failed
at the previous stage. This would have an effect on the financial flows of all
stakeholders involved in the supply chain.
Along with the examination and assessment of investments and finance
functions, an analysis of the fixed and current assets and of the capital costs should
be carried out and cash flows and returns should be tracked. A suitable instrument
for this is the cash-to-cash-cycle (cash-conversion-cycle, cash-flow cycle, cash-to-
9 Cf. Skiera and Pfaff (2004), p. 1399; Gomm (2008), p. 58 et seq.10 Cf. Brandt (2004), p. 118; also Sarbach (2006), p. 12.11 Cf. Hofmann (2005), p. 206 et seq.; Gomm (2008), p. 155 et seq.
230 10 Investment and Financing in Logistics
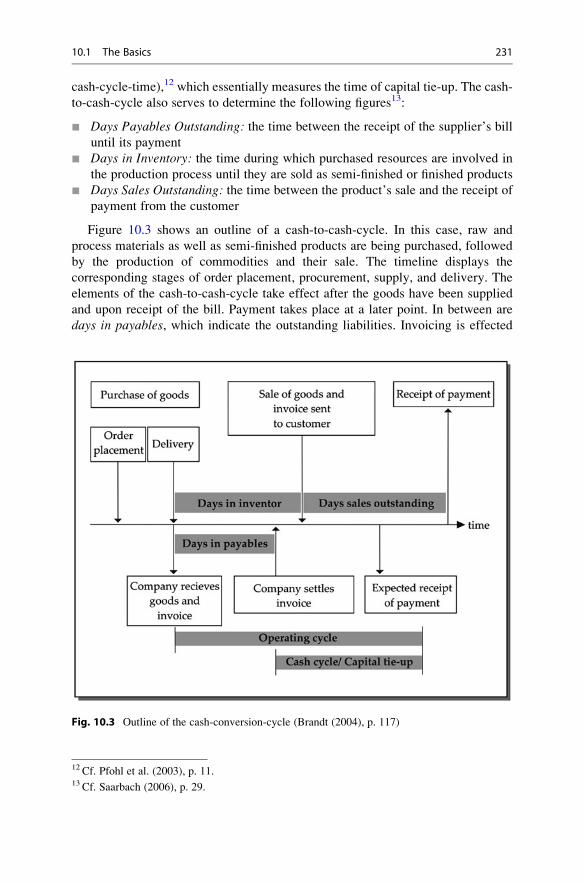
cash-cycle-time),12 which essentially measures the time of capital tie-up. The cash-
to-cash-cycle also serves to determine the following figures13:
¢ Days Payables Outstanding: the time between the receipt of the supplier’s bill
until its payment
¢ Days in Inventory: the time during which purchased resources are involved in
the production process until they are sold as semi-finished or finished products
¢ Days Sales Outstanding: the time between the product’s sale and the receipt of
payment from the customer
Figure 10.3 shows an outline of a cash-to-cash-cycle. In this case, raw and
process materials as well as semi-finished products are being purchased, followed
by the production of commodities and their sale. The timeline displays the
corresponding stages of order placement, procurement, supply, and delivery. The
elements of the cash-to-cash-cycle take effect after the goods have been supplied
and upon receipt of the bill. Payment takes place at a later point. In between are
days in payables, which indicate the outstanding liabilities. Invoicing is effected
Fig. 10.3 Outline of the cash-conversion-cycle (Brandt (2004), p. 117)
12 Cf. Pfohl et al. (2003), p. 11.13 Cf. Saarbach (2006), p. 29.
10.1 The Basics 231
upon delivery and the payment due is determined. In between invoicing and the
effected payment are the days in receivables, indicating the outstanding debts.14
The cash-to-cash-cycle is calculated by adding days in inventory and days salesoutstanding minus days payables outstanding. Thus, the timespan can be deter-
mined within which a company has invested money in a specific business case, i.e.
the time during which the current assets are tied-up.15 For companies it is important
to know how long a specific amount of capital cannot be used otherwise so that no
additional tie-up of current assets unnecessarily compromises the company’s
liquidity. This tie-up keeps companies from obtaining financial income which
could have been realized using the tied-up capital.
In order to reduce the working capital, cash-out activities should be carried out
as late as possible while cash-in activities should take place as early as possible.
Both of these activities are dependent on the way in which the processes that trigger
payment are stipulated.16 On the procurement side this becomes possible if the
supplier is to be paid at the latest possible point, which can, for example, be
achieved through:
¢ Supply of high-quality materials only shortly before demand arises
¢ Passing of ownership of materials from consignment warehouses only shortly
before demand arises
¢ Payment is not effected immediately but only as part of the monthly payment
run
¢ Payment is only effected after assembly of the delivered part or after sale of the
finished product
Conversely, cash-in is most beneficial if the customer pays at the earliest
possible point, which can, for example, be achieved through:
¢ Adherence to delivery dates
¢ Delivery of faultless products that do not give cause for complaint
¢ More frequent payment runs
¢ Cash before delivery or delivery against deposit
¢ Early dunning
The entire supply chain can thus be optimized within the financial supply chain
through the optimization of a specific company’s internal financing in the sense of a
cash-to-cash-cycle. However, this does not mean that each company would strive to
shorten their cash-to-cash-cycle. Instead, collaborative solutions need to be found
14 Cf. Klepzig (2010), S. 46 et seq.15 Cf. Gomm (2008), p. 12516 Cf. Klepzig (2010), p. 47 et seq.
232 10 Investment and Financing in Logistics
which shorten the cash-to-cash-cycle of the supply chain as a whole, even though
individual companiesmay not be fully optimized this way. The potential for increased
efficiency of the capital tied-up in the supply chain may thus be realized through17:
¢ Optimized cash management by cooperatively maxing out credit lines
¢ Introducing credit note procedures throughout the supply chain to expedite
financial flows
¢ Improved capital requirement forecasts for all cash flows
10.2 Financing Deliveries of Goods and Inventory
10.2.1 Overdraft Facilities and Supplier’s Credit
The financing of raw and process materials as well as of semi-finished and finished
goods necessary for production and the transport thereof is called operating
resources funding or inventory financing. Inventory financing is usually carried
out by granting short-term credit lines in the form of overdraft facilities, supplier’s
credits, or consumer credits.18
By means of a current account, banks or financial institutions provide a
borrower with funds. The borrower is granted a credit line which constitutes the
credit limit. This credit can be used on demand by the borrower. On-going payment
transactions repay the amount that has been used of this credit to the bank. Interest
is only payable on funds that have actually been used. During its period, the loan
can be used up to its limit at any time again.
With regards to inventory financing, we can further distinguish between a
committed inventory credit facility – where the inventory is assigned to the bank
as security – and an uncommitted short-term operating credit, which can be used
flexibly. Inventory financing is always shown on the liabilities side of the balance
sheet, regardless of its form.
A supplier’s credit (also called accounts receivable loan) allows for the short-
term use of financial means. Upon purchase the supplier grants the buyer a certain
time for payment free of interest. Usually, this is a period of grace of 30–90 days or
in individual cases even considerably more. A supplier’s credit is usually granted
informally and without collateral. This type of credit, however, generally
constitutes an expensive financing alternative.
Consumer credits in the form of deposits are a type of credit that is used apart
from supplier’s credits. These credits are especially popular in the capital goods and
construction industries. The customer pays pre-agreed instalments of the purchasing
price (advance payment, part payment) upon order placement and/or after production.
17 Cf. Pfohl et al. (2003), p. 47.18 Cf. Thommen and Achleitner (2006), p. 556 et seq.
10.2 Financing Deliveries of Goods and Inventory 233
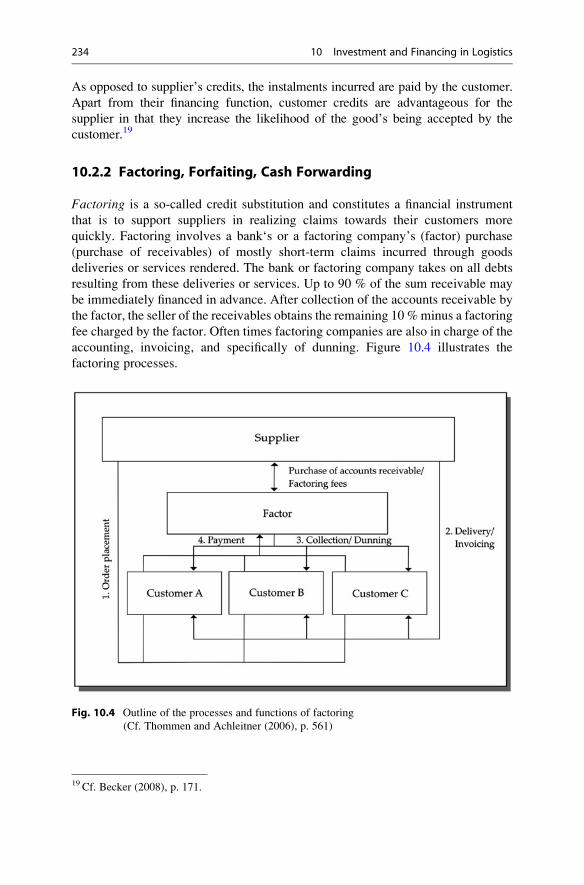
As opposed to supplier’s credits, the instalments incurred are paid by the customer.
Apart from their financing function, customer credits are advantageous for the
supplier in that they increase the likelihood of the good’s being accepted by the
customer.19
10.2.2 Factoring, Forfaiting, Cash Forwarding
Factoring is a so-called credit substitution and constitutes a financial instrument
that is to support suppliers in realizing claims towards their customers more
quickly. Factoring involves a bank‘s or a factoring company’s (factor) purchase
(purchase of receivables) of mostly short-term claims incurred through goods
deliveries or services rendered. The bank or factoring company takes on all debts
resulting from these deliveries or services. Up to 90 % of the sum receivable may
be immediately financed in advance. After collection of the accounts receivable by
the factor, the seller of the receivables obtains the remaining 10 %minus a factoring
fee charged by the factor. Often times factoring companies are also in charge of the
accounting, invoicing, and specifically of dunning. Figure 10.4 illustrates the
factoring processes.
Fig. 10.4 Outline of the processes and functions of factoring
(Cf. Thommen and Achleitner (2006), p. 561)
19 Cf. Becker (2008), p. 171.
234 10 Investment and Financing in Logistics

Another form of financing tailored to inventory financing is forfaiting. This formof financing is mainly employed in medium-term and long-term export financing.
It involves the sale of export receivables to a special institution (forfaiter) without
recourse. The default risk and foreign exchange risk are borne by the forfaiter.
The level of costs is accordingly high. Figure 10.5 shows the processes of forfaiting.
Central to forfaiting are aval credits (bills of exchange) which act as suretyship.
These are used nationally and internationally if delivery obligations, warranty
obligations, and payment obligations need to be backed by collateral security.
Mostly, companies obtain these credits from a bank since none of the companies
involved (exporter, importer) wants to take the risk associated with advance
payments. The forfeiter acts as payee and collector of the receivables from the
exporter’s delivery. The exporter obtains a bill of exchange from the importer,
which is made to the exporter (promissory note).20 In adition to aval credits, there
are customs guarantees and freight guarantees which do not require collateral
securities in cash (warranty guarantee).
Fig. 10.5 Outline of the processes and functions of forfaiting
(Cf. Thommen and Achleitner (2006), p. 564)
20 Cf. Thommen and Achleitner (2006), p. 563.
10.2 Financing Deliveries of Goods and Inventory 235

Cash forwarding is a variation of factoring. As opposed to conventional factoring,cash forwarding involves an undertaking of 90 % of the invoice amount upon
acceptance of the goods from the supplier.21
Apart from factoring companies and banks, logistics service providers also offer
additional claims management services in collaboration with banks. These may
include accounting services, which are offered by debtor companies especially set
up for these purposes. Outsourcing these functions to logistics service providers
offers more transparency for the acceptance of goods, collection, delivery and
invoicing. Service providers such as Deutsche Post World Net (DPWN) offer
such services in collaboration with Postbank under the label Financial LogisticSolutions. 22
10.2.3 Inventory Management and Off-Balance Sheet InventoryFinancing
It is the primary aim of inventory management to reduce working capital by
reducing inventories (see Chap. 7). Inventories essentially comprise raw materials,
process materials, and finished goods, which are stored in warehouses as part of a
procurement, production, and distribution system of a company (see Sect. 8.3).
Reduction of inventory should bring about a reduction of capital costs, which need
to be used for the (pre-) financing of inventories. If inventories are to be reduced to
lower the capital costs, however, one must consider the risk of decreased delivery
capability. Approaches in reducing inventory are23:
¢ Negotiations with supplier to enhance delivery service
¢ Differentiation of delivery service according to products
¢ Differentiation of delivery service according to customers and customer
profitability
At the same time, inventory cannot be reduced within a supply chain simply by
transferring the storage functions to upstream or downstream steps in the value
chain, i.e. to suppliers and customers. Instead, it should be the aim to intensify the
relationships between suppliers and consumers. This may be effected, for instance,
through cross-company approaches in inventory financing, as opposed to
companies relying on their individual financing approaches within a value chain.
This can potentially result in lower interest costs.
Well-directed inventory allocation can result in financial advantages at certain
points of the supply chain.24 This process involves goods being received by the
supplier at the latest possible time or delivered to the consumer as early as possible.
21 Cf. von Eisenhardt-Rothe and Jutte (2003), p. 163.22 Cf. von Eisenhardt-Rothe and Jutte (2003), p. 163.23 Cf. Pfohl et al. (2003), p. 38 et seq.24 Cf. Pfohl et al. (2003), p. 39; Klepzig (2010), p. 129.
236 10 Investment and Financing in Logistics
A suitable means to reduce inventory through inventory allocation on the supplier’s
side is to establish a consignment warehouse or to implement vendor-led inventory
management (e.g. VMI) (see Sect. 7.5).
Inventory financing can take place both on the supplier’s and on the consumer’s
side. On the respective company’s balance sheet, the inventory is shown as part of
the working capital and capital tie-up. Inventory financing may also be taken on by
logistics service providers. This is particularly sensible if procurement and distri-
bution logistical services are also carried out by service providers. Depending on
the level of risk-taking, the logistics service provider may assume ownership of the
inventory (authority to disposition) or carry out interim financing (vendor hubfinancing).25 A vendor hub is a warehouse managed by a logistics service provider.
This includes the management of transfer of ownership from supplier to consumer
(see Sect. 7.4.2). Vendor hub financing can utilize factoring.26 Such concepts,
however, require partnership-like concepts within which customers, suppliers,
logistics service providers, and financial service providers cooperate to reach the
most favourable solutions possible. Usually, this results in the set-up of a new
company which takes charge of the balancing of accounts (off-balance inventoryfinancing), along with the entire goods management (purchase, logistics, debtor
management).
10.3 Financing of Logistics Real Estate
10.3.1 Self Financing and External Financing
Logistics real estate may be provisioned through purchase, rent, or leasing of an
existing object or through the building of a new one. If the property is owned by the
company, they have the sole right of disposition over it for an unlimited period of
time. Property financing of logistics real estate can be self-financed or externally
financed. Self-financing enables a company to set up the property or sell it at any
time without having to make its size, location, and facilities dependent on a bank.
This, however, requires the company to be able to finance the property exclusively
from their cash flow or from an increase in capital. Moreover, the capital tied up in
the property will not be available for other investments. Property financing can be
carried out using self-financed equity capital (e.g. accumulated profits), externally
financed equity capital (e.g. stocks), or borrowed capital.
A common way of externally financing logistics real estate is mortgagefinancing at a fixed interest rate with annuity amortization.27 This involves repay-
ment rates which cover the interest payments and the external capital that needs to
be paid off. These repayment rates may be linked to business success and thus, for
25 Cf. Stenzel (2003), p. 145 et seq.26 Cf. von Eisenhardt-Rothe and Jutte (2003), p. 168.27 Cf. Stenzel (2003), p. 142.
10.3 Financing of Logistics Real Estate 237
example, to the property’s capacity utilization. This way they can follow the cash
flow development (pay as you earn).28 This makes it possible to adapt the financing
to the peculiarities of a logistical project, as is the case in contract logistics, for
example. Banks and credit institutions are lenders for mortgage credits. The
financing is collateralized by an encumbrance (mortgage, land charge/annuity
land charge) on the property.
For industrial companies and trade companies, investment in their own logistics
real estate used to be the most common form of provisioning real estate. The actual
utilization of the real estate used to be the main reason for this kind of investment,
which means that logistics real estate was only rarely purchased for capital invest-
ment purposes. Companies still use approximately 50 % of all logistics real estate in
Germany for their own logistics.29 The remaining 50 % of existing real estate are
run by logistics service providers. Alternative ways of real estate provisioning are
available for logistics service providers. If an existing property with sufficient
capacity is owned by the client, the service provider will rent and make use of the
real estate for the duration of the contract. Should the contract stipulate that the
logistics property needs to be provided by the service provider, the service provider
may draw on their own property resources. If these resources do not suffice, the
service provider may also provision the real estate within the framework of a (new)
project. The basic decision here is whether to buy, rent, or lease the property.
Alternatively, a joint venture between the client and the logistics service provider is
conceivable.30
10.3.2 Rent and Leasing
Rent is to be understood as a landlord’s permission for a tenant to use a property
(rental object) for the duration of the rental period in exchange for money.31
Commercial rental contracts – as used for logistics real estate – are usually made
for a period of several years. The contractual design criteria include, above all,
periods of notice, renewal clauses and rent adjustment clauses. In practice, a variety
of rent options have established themselves, as for example sale and rent back,build and rent, or buy and rent.32
Logistics real estate may also be provisioned based on a lease contract (plant
leasing). Leasing is a form of tenancy which is 100 % externally financed. Owners,
tenants or lessees of the property may be industrial enterprises, trading companies,
or logistics service providers. The lessor is a leasing company acting as intermedi-
ary. The lessor purchases or builds the property on behalf of the lessee by means of
28 Cf. Bjelicic and Kostka (2000), p. 167.29 Cf. Nehm et al. (2009), p. 46.30 Cf. Nehm and Schryver (2007), p. 237 et seq.31 Cf. }535 (1) and (2) German commercial code.32 Cf. Ockens (2003), p. 206.
238 10 Investment and Financing in Logistics

a bank loan. It is assumed that the lessor will at least partly earn back the capital
expenditure plus interests and profit. The lessee merely has to pay lease instalments.
This excludes the lessee’s reliance on credit lines and providing of collateral
through the company’s assets, which may significantly improve a company’s rating
for other financing transactions.
From a fiscal point of view, it is important in what way lease contracts affect thebalance sheet and taxation. Depending onwhether the investment risk is borne by the
lessor or lessee and to whom beneficial ownership is assigned, we can distinguish
between operative leasing and finance leasing.33 In cases of finance leasing, thebrunt of the risk is borne by the lessee and the leasing item will show on the lessee’s
balance sheet. All other cases are referred to as operate leasing, whichmeans that the
lessor will include the item on their balance sheet. Therefore, only operate leasing
offers the possibility of off-balance financing and thus of balance-sheet contraction.
Regardless of the specifications in the contract, an item cannot be accounted by
the lessor if the property is tailored to the lessee’s needs (specialty leasing) and onlythe lessee could use it in an economically reasonable way upon expiration of the
lease contract. However, most (standard) logistics properties can be used in a variety
of ways which is why specialty leasing is not usually carried out.
Depending on the initial situation and the goals of the lessee, we can make a
distinction between new-building leasing, buy-and-lease, and sale-and-lease-back34 (see Sect. 7.3.2). Especially the sale-and-lease-back of logistics real estate
is an up-to-date option for logistics service providers. It entails the lessor’s purchase
of an existing property from the lessee in order to subsequently lease it back to the
lessee. Since the outsourcing of logistics services to logistics service providers is
associated with increasingly shorter contract periods, service providers need to
align their capacities more and more with the duration of service agreements.
With regard to the provision of logistics real estate, this requires them to rent or
lease real estate according to demand and to ideally sell their own real estate in
order to subsequently rent or lease it back.35
10.4 Financing of Logistics Movables
10.4.1 Internal and External Financing
Logistics movables comprise equipment and chattels of storage and transshipment
facilities. This includes conveying technology, racks, packing machines, and other
(intralogistical) objects, any kind of vehicle in logistics facilities (industrial trucks),
33 Cf. Becker (2008), p. 190.34 Cf. Feinen (2003), p. 191.35 Cf. Stenzel (2003), p. 141; Mahler (2008), p. 40 et seq. and p. 199 et seq.
10.4 Financing of Logistics Movables 239
and every means of transport of the different transport modes in road freight traffic,
sea freight traffic, inland waterway traffic, and air freight traffic (see Sect. 4.2).
Specifically equipment such as high racks, conveying technology, and picking
installations are frequently tailored to the real estate in which they are installed
and operated. Despite their building-like character, high racks are therefore not
considered real estate but are classified as machine.36
The forms of financing for logistics movables are largely the same as for logistics
real estate (purchase, rent, leasing). However, flexible financing of provisioning and
usage are even more important for logistics movables. On the one hand, the
employment of the different capacities is dependent on capacity utilization.
On the other hand, the service provision for logistic processes and the resulting
cost structures greatly depend on the technological standard of the equipment and
vehicles used.
Thus, changes to e.g. the IT infrastructure (release changes, cloud computing) or
changes of engine (soot filter, hush kits) for vehicles and planes have a significant
impact on the economic operating life (investment security). For economic reasons,
it is therefore not advisable to finance, for example, vehicles and IT systems from
one’s own resources.
As with logistics real estate, logistics service providers need to consider the
operating life of logistics movables with a view to contract periods. Here, high
flexibility when renting or leasing items has to be weighed against increased costs
for usage.37
10.4.2 Leasing
The leasing of mobile capital equipment (equipment leasing) involves the lessor’s
ordering of goods which had been requested by the lessee. Make, special design
options, and supplier are determined by the lessee. Lessee and supplier also agree
on a price. Procurement costs and the financing of the leasing item are borne by the
lessee.
The distinction between credit purchase and leasing is much more difficult to
draw for logistics movables than for logistics real estate. This is partly due to the
fact that there are numerous mixed forms (hire purchase, externally financed
purchase) and partly because the lessee has the option of purchasing the leasing
item at a later point. The lease contract may already stipulate this (leasing with
purchase option). Depending on the leasing item, such option rights are frequently
made use of for logistics movables. This is especially true if the market value of the
leasing item is higher upon expiration of the contract than the purchasing price was
at the beginning of the contract. Thus, utility vehicles are acquired by the user and
used for different purposes, depending on their mileage and distance travelled.
36 Cf. Mahler (2008), 104.37 Cf. Steinmuller (2007), p. 553.
240 10 Investment and Financing in Logistics
As opposed to hire purchase, leasing involves that – for the term of the contract –
the investment good remains the property of the lessor, who also bears the residual
value risk. The lessee only pays for the usage of the leasing item and need not
include it on the balance sheet (off-balance-sheet treatment). The advantages
resulting from this include improved liquidity since no capital is tied up, transparent
cost structure (fixed payments), and fiscal advantages (tax-deductible operating
costs). In addition, leasing makes it possible to keep abreast of the latest technolog-
ical developments since switches to new products and technical solutions (e.g.
hardware upgrades) may also be implemented during the term of the leasing
agreement for a fee (migration fee) and at changed conditions.38
(Full) service leasing is an extended form of leasing, where the lessor offers
additional services apart from financing. Examples of this are vehicle leasing and
fleet leasing, where different services related to vehicles and fleets can be individually
combined and offered to the customer. Among these services are39:
¢ Maintenance and repair
¢ Provision of replacement vehicles
¢ Payment of vehicle tax, toll charges and other charges
¢ Accounting of fuel cards and gas station services
¢ Analysis of gas consumption and other vehicle data
¢ Offering insurance services
¢ Handling of claims
Another form of service leasing is fleet leasing. With this type of leasing, an
entire fleet consisting of several vehicles is the subject-matter of the leasing
agreement. Fleet leasing can include services such as the provision of replacement
vehicles as well as services related to fleet management. This is due to a trend
followed by more and more transport companies – especially from the road freight
transport sector – resulting in an outsourcing of their fleet management. Even
aircraft fleets and ships can be the object of leasing agreements. This is referred
to as large-scale-project leasing, for which a leasing company is often especially
set up. Such a company only leases the specific object and deals with all procure-
ment and financing processes.
10.4.3 Build-Operate-Transfer Models
Another way to finance fixed and current assets in logistics and supply chains is
build operate transfer. This is a financing model based on public private partnership
that has become very common among private-sector companies for infrastructure
projects in the energy sector, waste disposal industry, telecommunications sector,
and for airports or road construction.40 The manufacturer acts as the client of the
38 Cf. von Eisenhardt-Rothe and Jutte (2003), S. 155 et seq.39 Cf. Mangold (2001), S. 223 et seq.40 Cf. Donier (2006).
10.4 Financing of Logistics Movables 241
operating company. Investment in production facilities and technological infra-
structure is made by the operating company (SPC – Special Purpose Company)
which is the owner of the production plant. The operating company is also in charge
of designing, building, and operating the plant, including maintenance, replacement
investment, and spare parts logistics. Since the investment is non-capitalized on the
client’s balance sheet (according to the German Code of Commercial Law HGB),
the costs associated with the provision of the services vary for the client.
Other stakeholders involved in an SPC are investors, plant manufacturers,
project managers, financial service providers, and works managers. The set-up of
an operating company constitutes a case of project financing, which means that
payment is usually effected on availability or upon production (pay on production,
pay to production).41 Minimum order quantities are frequently associated with
build operate transfer. This offers the client the advantages of low capital tie-up
for stocks and fixed assets as well as prefinancing by the operating company.
Build operate transfer has not only been applied to technical equipment and
production plants but has also increasingly become applicable to supply chain
management. The aim is to allocate logistic tasks to specialized service providers
within the logistics chain. These tasks may include storage, transport, and goods
handling as well as the entire inventory management.
Case Study 10.1: Build-Operate-Transfer Models in the Industry
Automobile Industry and Utility Vehicle Industry
Since 2002, parts of the production facilities and conveying technology at the
Ford plant in Koln-Niehl have been operated through a build-operate-transfer
model by EISENMANN AG, Boblingen. These include, amongst other things, the
final-assembly line for the models Fiesta and Fusion. The build-operate-transfermodel comprises the operation and maintenance of all conveying systems.
Invoicing takes place on the basis of readily assembled cars.
Production at MMC Smart in Hambach (see case study 6.3) is based on a
build-operate-transfer model which involves numerous suppliers. Due to the low
vertical range of manufacture of only 10 % at MMC Smart, system suppliers do
not only undertake 90 % of production but they have also borne roughly 50 % of
the production plant’s investment costs amounting to 400 million Euros.
The painting plant at the utility vehicle production site ofMAN Latin America
is also operated through a build-operate-transfer model by EISENMANN.
EISENMANN is in charge of varnishing the driver’s cab, which includes full
responsibility for the plant and personnel.
Airline industry
A build-operate-transfer model has been realized between FlughafenMunchen GmbH and Lufthansa AG for Terminal II at Munich airport. Lufthansa
AG took on 40 % of the investment costs. In return, the terminal was designed
according to Lufthansa’s specifications.
41 Cf. Gomm (2008), p. 246 et seq.
242 10 Investment and Financing in Logistics
Review Questions
1. Which concepts suitable to finance logistical fixed and current assets do you
know?
2. Distinguish between capital costs and capital tie-up and explain how they
can be reduced.
3. Explain the concept of Supply Chain Finance.
4. Which stakeholders can provide financing in logistics?
5. Outline the significance of the cash-to-cash-cycle.
6. Assess equity financing and external financing from a financial perspective
and with a view to financial risks.
7. Name the differences between factoring and forfaiting.
8. What are the advantages of pay on production?
9. Explain the importance of capital budgeting, using the example of an
intralogistical investment.
10. How are build-operate-transfer models different from purchase or leasing?
Additional Literature
Bowersox, J. D., Closs, D. J., & Cooper, M. B. (2012). Supply chain logistics management.New York/London: McGraw-Hill.
Buxton, C. (1999). The financial-logistics connection: Supply chain financing. In Finlistics(no. 23, 1999).
Feinen, K. (2002). Das Leasinggeschaft, 4. neubearbeitete Edition. Frankfurt: Knapp.Hartley-Urquhart, R. (2006). Managing the financial supply chain. Supply Chain Management
Review, 10(6), 18–25.Hofmann, E. (2011). Supply chain finance solutions: Relevance – propositions – market value.
St. Gallen/London: Springer.
Jacob, D., & Schroter, N. (2009). Bedeutung von PPP fur ein modernes Infrastrukturmanagementim offentlichen Sektor. Wiesbaden: Springer.
Palmia, S. (2009). Financial supply chain. New York: McGraw-Hill.
Skiera, B., Pfaff, D., &Weiss, J. (2004). Financial supply chain management. Bonn: Galileo Press.Stock, J. R., & Lambert, D. M. (2001). Strategic logistics management. Boston: McGraw-Hill.
Timme, S. G., & Williams-Timme, C. (2000). The financial-SCM connection. Supply ChainManagement Review, 4, 32–43.
Wildemann, H. (2010). Betreibermodelle: Leitfaden zur Berechnung, Konzeption und Einfuhrungvon Betreibermodellen und Pay-on-Production-Konzepten, 9 Edition. Munchen: TCW.
Additional Literature 243

Logistics Controlling 11
Learning Objectives
Theoretical and practical insights in modern accounting suggest that the rating of
logistics services and costs as well as comprehensive controlling in logistics and
supply chain management are a central prerequisite for Logistics Controlling
and Performance. The following chapter gives an overview about the current
situation and the development of cost and performance accounting in logistics.
Additionally, key figures and key figure systems will be introduced with respect
to logistical tasks. Apart from these basics, more elaborate approaches to
comprehensive supply chain controlling and performance management in the
field of logistics will introduce the reader to current challenges in company
practice. The author introduce the prevalent German appellation Controlling as asynonym for Managerial Accounting which is rather used in Anglo-American
literature
Keywords
¢ Cost and performance accounting
¢ Functions and the process of Controlling
¢ Key figure systems
¢ Key Performance Indicators (KPI)
¢ Supply Chain Controlling
¢ Cost drivers and cost effects
¢ Process costs and process performance
¢ Balanced scorecard
H. Gleissner and J.C. Femerling, Logistics, Springer Texts in Business and Economics,
DOI 10.1007/978-3-319-01769-3_11, # Springer International Publishing Switzerland 2013
245

11.1 Conceptual Basics
In today’s complex and widely connected world and its multitude of quantitative
and qualitative data and information, successful company management requires
tools to rate, plane, and control processes. All measures to acquire, develop, assess,
and rate such control information and transfer them to concrete courses of action
can be summed up as the instrument of Controlling. In this context, Controlling is
not only to be understood as an instrument of control but as one of information and
management for executive levels.1 Planning, control, and analysis as well as
information derived from them are elementary functions of Controlling for man-
agement (see Fig. 11.1). These Controlling functions can be used in all areas and on
all levels of a company. They are as useful for the whole company as they are for
the logistics department.
In academics as well as in business practice, the term Controlling has a very
wide area of application and various contents. Additionally, the form of Controlling
depends largely on the size of the company. The acquisition, preparation, and
control of the data and information happen in the company process according to
an hierarchical order: from the individual operative and administrative business
processes, and the accounting for cost and performance accounting to, eventually,
the Controlling, resulting in detailed assessment and proposals for action.
Missing data to evaluate processes and an overrating of the significance of
data about business process results or an unreflecting focus on insights from
Controlling instruments have repeatedly led to wrong management decisions in
the past.
This shows the challenges Controlling faces in business practice. Its quantitative
results clearly have a supporting function in business process rating and controlling.
However, it should not limit management decisions with respect to their flexible
Planning functions(objectives)
Control function(target-performance)
Analysis function (internal/external effects)
Information function (investments/strategies)
Controlling
(Management)
Fig. 11.1 Basic functions of controlling
1 Cf. Weber (2002b), p. 5.
246 11 Logistics Controlling
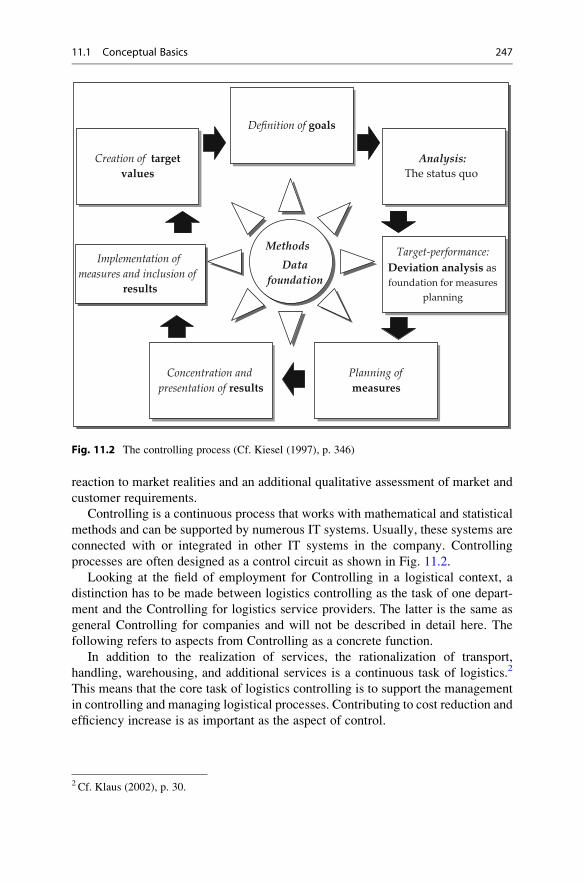
reaction to market realities and an additional qualitative assessment of market and
customer requirements.
Controlling is a continuous process that works with mathematical and statistical
methods and can be supported by numerous IT systems. Usually, these systems are
connected with or integrated in other IT systems in the company. Controlling
processes are often designed as a control circuit as shown in Fig. 11.2.
Looking at the field of employment for Controlling in a logistical context, a
distinction has to be made between logistics controlling as the task of one depart-
ment and the Controlling for logistics service providers. The latter is the same as
general Controlling for companies and will not be described in detail here. The
following refers to aspects from Controlling as a concrete function.
In addition to the realization of services, the rationalization of transport,
handling, warehousing, and additional services is a continuous task of logistics.2
This means that the core task of logistics controlling is to support the management
in controlling and managing logistical processes. Contributing to cost reduction and
efficiency increase is as important as the aspect of control.
Methods
Data foundation
Planning ofmeasures
Analysis:The status quo
Target-performance:Deviation analysis as foundation for measures
planning
Implementation of measures and inclusion of
results
Creation of targetvalues
Definition of goals
Concentration and presentation of results
Fig. 11.2 The controlling process (Cf. Kiesel (1997), p. 346)
2 Cf. Klaus (2002), p. 30.
11.1 Conceptual Basics 247
The use of Controlling instruments for logistical processes in business practices
is not yet adequate. The problem that occurs most often is the unsatisfying level of
precision in assigning logistics costs to the logistics services that caused them.3 One
reason for this is the high effort and the difficulty that is necessary to acquire data
for logistical processes. A second reason is the increased difficulty to establish
stable systems for data acquisition because of tasks changing quickly with varying
customer requirements. Due to the strong influence of shareholders and financial
investors, individual parts of the logistics process may be affected by events or
measures such as mergers or outsourcing.
Owing to the diversity of logistical processes, it is not possible to define
Controlling concepts that apply to logistics as a whole. Such concepts must always
be tailored to the special requirements and the individual situation in which
logistics processes take place.4
The goals of logistics controlling can be defined as:
¢ Formulating and specifying logistical goals and their integration in the context
of the whole company
¢ Budgeting and creating targets for logistics
¢ Making available instruments with operational value to create targets and,
subsequently, measure success
¢ Supporting and coordinating strategic and operative logistics planning like
e.g. investment decisions
¢ Regulations and information transparency for cost and performance accounting
for logistics and its processes
¢ Foundation for cost control and efficiency increase (performance) in logistics
¢ Formulating further management information, e.g. concerning the organiza-
tional structure or staff leadership
Analogue to the process- or network-oriented logistics in supply chains,
additional logistics controlling must be active across steps in the value chain.
To assess the economic efficiency of a full supply chain or a complex logistics
network, Controlling instruments must be universally used. Such cases are
called Supply Chain Controlling; it is a controlling instrument of Supply Chain
Management.5 The fact that the Controlling process must be viewed across
numerous steps in the value-adding process which means across companies or
even countries is another challenge for the unified source-based assignation of
logistics services and costs.
3 Cf. Straube et al. (2005), p. 26.4 Cf. Weber (2002b), p. 13.5 Cf. St€olzle and Otto (2003), p. 29 et seq.
248 11 Logistics Controlling
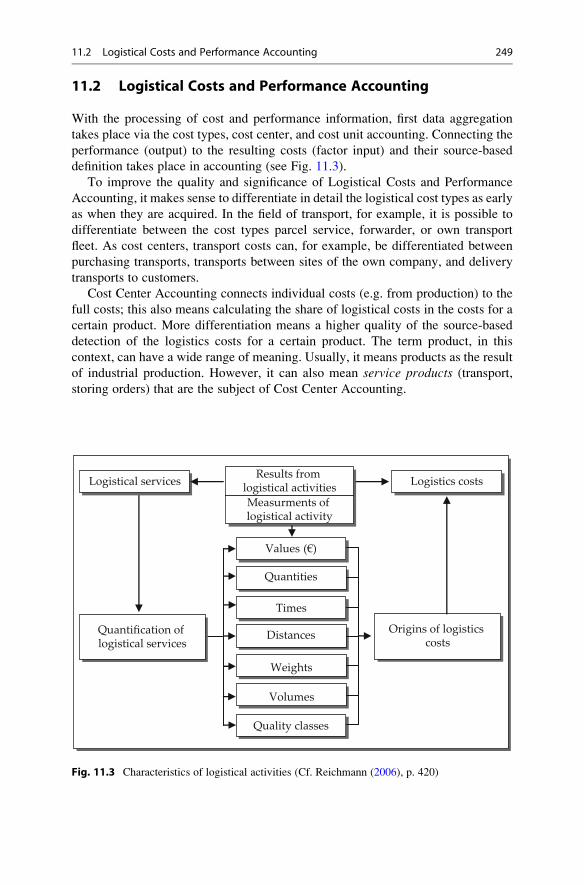
11.2 Logistical Costs and Performance Accounting
With the processing of cost and performance information, first data aggregation
takes place via the cost types, cost center, and cost unit accounting. Connecting the
performance (output) to the resulting costs (factor input) and their source-based
definition takes place in accounting (see Fig. 11.3).
To improve the quality and significance of Logistical Costs and Performance
Accounting, it makes sense to differentiate in detail the logistical cost types as early
as when they are acquired. In the field of transport, for example, it is possible to
differentiate between the cost types parcel service, forwarder, or own transport
fleet. As cost centers, transport costs can, for example, be differentiated between
purchasing transports, transports between sites of the own company, and delivery
transports to customers.
Cost Center Accounting connects individual costs (e.g. from production) to the
full costs; this also means calculating the share of logistical costs in the costs for a
certain product. More differentiation means a higher quality of the source-based
detection of the logistics costs for a certain product. The term product, in this
context, can have a wide range of meaning. Usually, it means products as the result
of industrial production. However, it can also mean service products (transport,
storing orders) that are the subject of Cost Center Accounting.
Values (€)
Quantities
Times
Distances
Weights
Volumes
Quality classes
Quantification of logistical services
Origins of logistics costs
Measurments of logistical activity
Results from logistical activitiesLogistical services Logistics costs
Fig. 11.3 Characteristics of logistical activities (Cf. Reichmann (2006), p. 420)
11.2 Logistical Costs and Performance Accounting 249

These results are directly included into calculating the contribution margin or
into price calculation. They may also be the foundation of activity-based costing
(see Sect. 11.4.1) (see Fig. 11.4).
Basic elements of logistics costs are:
¢ Order processing costs
¢ Transport costs for covering distances in the logistical process
¢ Warehouse costs, for covering time in the logistical process
¢ Stock costs
¢ Control and system costs, for logistical control, administration and IT used in
logistics
The following Table 11.1 outlines the logistical cost blocks and their
characteristics regarding their variability for changes in the logistics volume.
Logistics costs are mostly accounted for in external accounting from a perspec-
tive of taxes or financial accounting. However, logistics performance must be dealt
with by internal accounting. The key to a high-quality result is the precise recording
of performance in logistical processes. Prior to such a performance recording, the
goal of this measure should always be clarified.
Cost Accounting
Costs for external logisticalservices (e.g. freights)
Direct logistical costs
Costs of logistical production factors (e.g. warehouse staff, fuel)
Primary costsof internally realized logis-tics services
Secondary costsmore steps in set-tling between these and other logistical cost centers
Indirect logistical costs
Cost Unit AccountingDirect and indirect logistics costs in products
Fig. 11.4 Traditional integration of logistics in cost accounting (Cf. Weber (2002b), p. 107)
250 11 Logistics Controlling
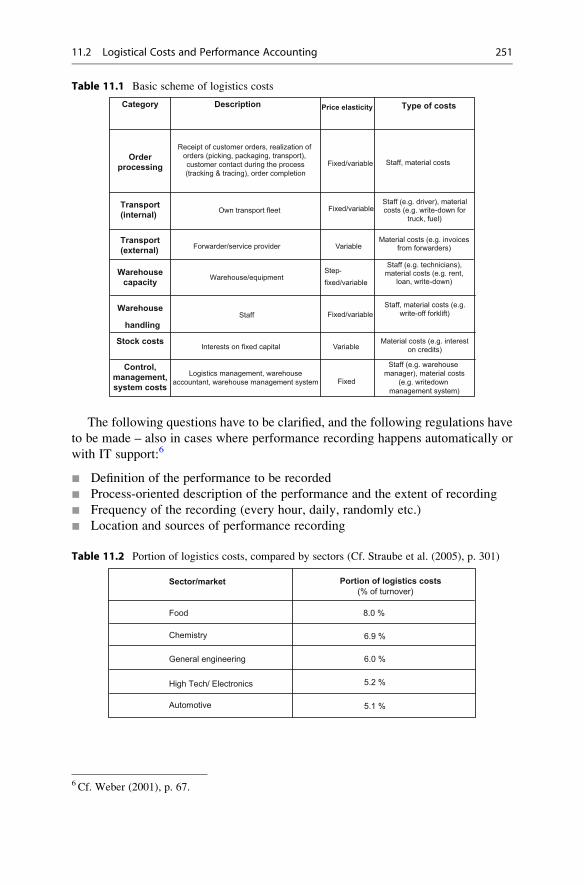
The following questions have to be clarified, and the following regulations have
to be made – also in cases where performance recording happens automatically or
with IT support:6
¢ Definition of the performance to be recorded
¢ Process-oriented description of the performance and the extent of recording
¢ Frequency of the recording (every hour, daily, randomly etc.)
¢ Location and sources of performance recording
Table 11.1 Basic scheme of logistics costs
Category Description Price elasticity Type of costs
Orderprocessing
Receipt of customer orders, realization of orders (picking, packaging, transport), customer contact during the process(tracking & tracing), order completion
Fixed/variable Staff, material costs
Own transport fleetTransport(internal)
Transport(external)
Fixed/variable
Forwarder/service provider VariableMaterial costs (e.g. invoices
from forwarders)
Warehousecapacity Warehouse/equipment
Step-fixed/variable
Staff (e.g. technicians), material costs (e.g. rent,
loan, write-down)
Warehouse
handling
Stock costs
Fixed/variableStaffStaff, material costs (e.g.
write-off forklift)
Interests on fixed capital VariableMaterial costs (e.g. interest
on credits)
Control,management,system costs
Logistics management, warehouseaccountant, warehouse management system
Staff (e.g. warehouse manager), material costs
(e.g. writedown management system)
Fixed
Staff (e.g. driver), material costs (e.g. write-down for
truck, fuel)
Table 11.2 Portion of logistics costs, compared by sectors (Cf. Straube et al. (2005), p. 301)
Sector/market
Food
Portion of logistics costs(% of turnover)
Chemistry
General engineering
High Tech/ Electronics
Automotive
8.0 %
6.9 %
6.0 %
5.2 %
5.1 %
6 Cf. Weber (2001), p. 67.
11.2 Logistical Costs and Performance Accounting 251
A study by the Bundesvereinigung Logistik (German Logistics Association)
gives ideas about the size of logistics costs in different sectors. On average, the
share of logistical costs in the complete turnover of a company is between 5 and 8 %
(see Table 11.2).
11.3 Key Figure Systems
The data acquired from Logistical Cost and Performance Accounting often have
a large volume. To be able to use this information for control or analysis as
continuing control information or as a foundation for management decisions, it
has to be compressed. Usually, the results from compression are key figure systems.
All information and key figures about the overall system company and its parts are
collected in a reporting system. In this context, the term Performance Managementis often used. It shows the performance of the logistics system and the costs
connected to this.
In particular, ratio systems describe the result of logistics from a compilation of
actual data. However, they can also be prepared as planning or target values for a
certain business period. In order to gain significance, key figures must never be
created and assessed individually but should always have the form of a system
consisting of more key figures. They should be comparable with respect to their
content, the calculation method, and the time period during which they were
acquired.
In a company in general, but also in specific for the logistics department, a key
figure system performs the following tasks7:
¢ Quantification of company and logistics goals as guidelines to comply with the
budget, increase efficiency, or lower costs in logistical processes and as a
foundation for target agreements with the management (operationalization
function)
¢ Continuous comparison of the logistical processes (actual values) with the given
target values as a part of internal control (control function)
¢ Systematic analysis of the deviation between actual and target values as well as
of the periodic or aperiodic internal vulnerability and efficiency analysis
(analyzing function)
¢ Analysis of external developments
¢ Analysis of the company situation compared to that of other companies or
comparable logistical processes
¢ Support for decisions about countermeasures in case of deviations between
target and actual values; assessment of possibilities to expand the logistical
capacity (regulation function)
7 Cf. Grochla (1983), p. 51.
252 11 Logistics Controlling
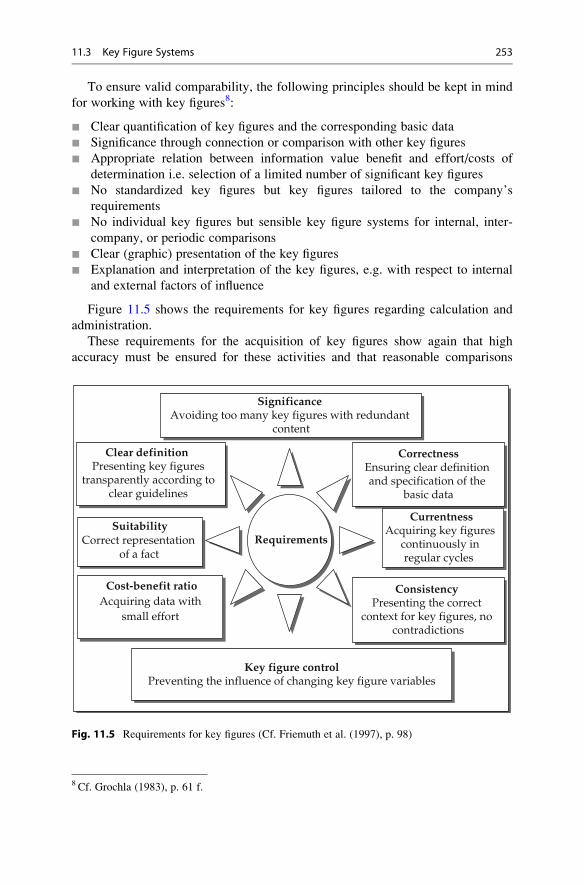
To ensure valid comparability, the following principles should be kept in mind
for working with key figures8:
¢ Clear quantification of key figures and the corresponding basic data
¢ Significance through connection or comparison with other key figures
¢ Appropriate relation between information value benefit and effort/costs of
determination i.e. selection of a limited number of significant key figures
¢ No standardized key figures but key figures tailored to the company’s
requirements
¢ No individual key figures but sensible key figure systems for internal, inter-
company, or periodic comparisons
¢ Clear (graphic) presentation of the key figures
¢ Explanation and interpretation of the key figures, e.g. with respect to internal
and external factors of influence
Figure 11.5 shows the requirements for key figures regarding calculation and
administration.
These requirements for the acquisition of key figures show again that high
accuracy must be ensured for these activities and that reasonable comparisons
Significance Avoiding too many key figures with redundant
content
CorrectnessEnsuring clear definition and specification of the
basic data
CurrentnessAcquiring key figures
continuously in regular cycles
Suitability Correct representation
of a fact
Clear definition Presenting key figures
transparently according toclear guidelines
Requirements
Key figure controlPreventing the influence of changing key figure variables
Cost-benefit ratio Acquiring data with
small effort
Consistency Presenting the correct
context for key figures, no contradictions
Fig. 11.5 Requirements for key figures (Cf. Friemuth et al. (1997), p. 98)
8 Cf. Grochla (1983), p. 61 f.
11.3 Key Figure Systems 253
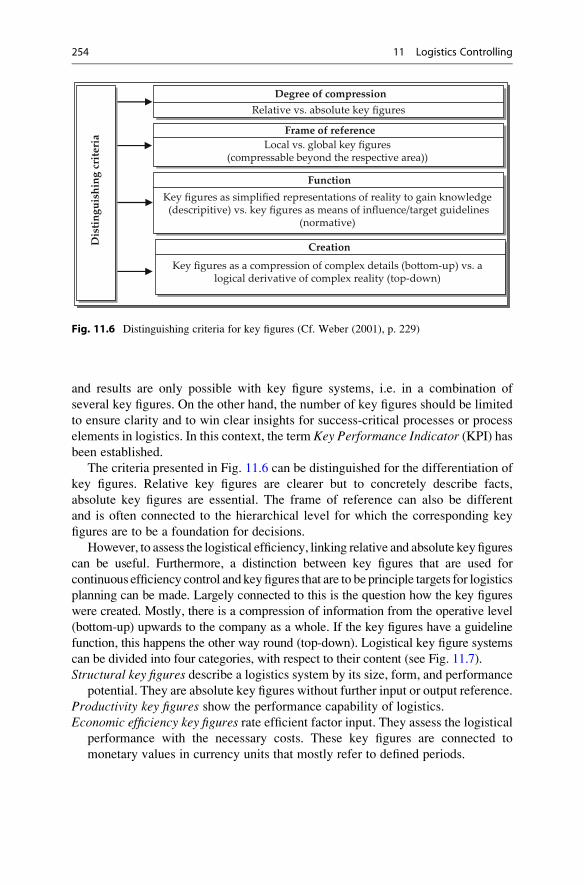
and results are only possible with key figure systems, i.e. in a combination of
several key figures. On the other hand, the number of key figures should be limited
to ensure clarity and to win clear insights for success-critical processes or process
elements in logistics. In this context, the term Key Performance Indicator (KPI) hasbeen established.
The criteria presented in Fig. 11.6 can be distinguished for the differentiation of
key figures. Relative key figures are clearer but to concretely describe facts,
absolute key figures are essential. The frame of reference can also be different
and is often connected to the hierarchical level for which the corresponding key
figures are to be a foundation for decisions.
However, to assess the logistical efficiency, linking relative and absolute key figures
can be useful. Furthermore, a distinction between key figures that are used for
continuous efficiency control and keyfigures that are to be principle targets for logistics
planning can be made. Largely connected to this is the question how the key figures
were created. Mostly, there is a compression of information from the operative level
(bottom-up) upwards to the company as a whole. If the key figures have a guideline
function, this happens the other way round (top-down). Logistical key figure systems
can be divided into four categories, with respect to their content (see Fig. 11.7).
Structural key figures describe a logistics system by its size, form, and performance
potential. They are absolute key figures without further input or output reference.
Productivity key figures show the performance capability of logistics.
Economic efficiency key figures rate efficient factor input. They assess the logisticalperformance with the necessary costs. These key figures are connected to
monetary values in currency units that mostly refer to defined periods.
Degree of compression
Relative vs. absolute key figures
Frame of referenceLocal vs. global key figures
(compressable beyond the respective area))
Function
Key figures as simplified representations of reality to gain knowledge (descripitive) vs. key figures as means of influence/target guidelines
(normative)
Creation
Key figures as a compression of complex details (boffiom-up) vs. a logical derivative of complex reality (top-down)
Dis
tin
guis
hin
g cr
iter
ia
Fig. 11.6 Distinguishing criteria for key figures (Cf. Weber (2001), p. 229)
254 11 Logistics Controlling
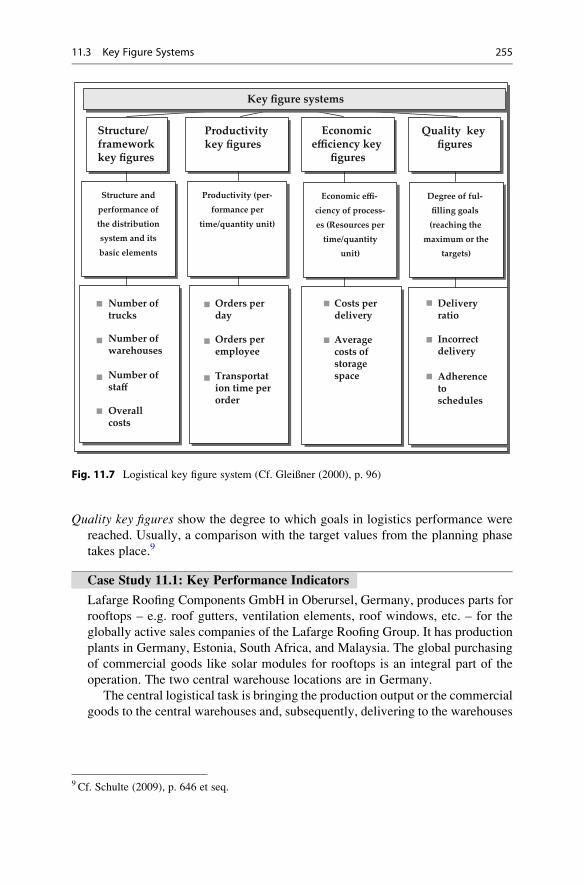
Quality key figures show the degree to which goals in logistics performance were
reached. Usually, a comparison with the target values from the planning phase
takes place.9
Case Study 11.1: Key Performance Indicators
Lafarge Roofing Components GmbH in Oberursel, Germany, produces parts for
rooftops – e.g. roof gutters, ventilation elements, roof windows, etc. – for the
globally active sales companies of the Lafarge Roofing Group. It has production
plants in Germany, Estonia, South Africa, and Malaysia. The global purchasing
of commercial goods like solar modules for rooftops is an integral part of the
operation. The two central warehouse locations are in Germany.
The central logistical task is bringing the production output or the commercial
goods to the central warehouses and, subsequently, delivering to the warehouses
Structure/ framework key figures
Structure and performance of the distribution system and itsbasic elements
Productivity (per-formance per
time/quantity unit)
Productivity key figures
Economic efficiency key
figures
Economic effi-ciency of process-es (Resources per
time/quantity unit)
Quality key figures
Degree of ful-filling goals (reaching the
maximum or the targets)
Key figure systems
Costs per delivery
Average costs of storage space
Delivery ratio
Incorrect delivery
Adherence to schedules
Orders per day
Orders per employee
Transportation time per order
Number oftrucks
Number of warehouses
Number of staff
Overall costs
Fig. 11.7 Logistical key figure system (Cf. Gleißner (2000), p. 96)
9 Cf. Schulte (2009), p. 646 et seq.
11.3 Key Figure Systems 255

of the sales companies worldwide. The terms of delivery are usually ex works,i.e. the costs must be borne by the sales companies. To control the logistics
system, a key figure system is employed. It is divided into three parts:
¢ Costs
¢ Delivery Capacity Indicators
¢ Working Capital
The goal of this representation is the creation of cost transparency for the
logistical processes in the organization.
The most important framework key figures are the absolute costs per time
unit, i.e. the sum of all incoming and outgoing freight (shuttles from the plant to
the warehouse, delivery to the sales companies); the capacity costs (rent for the
external warehouse, write-downs for the internal warehouse); the handling costs
(costs per incoming/outgoing goods for the external warehouse, staff costs for
the internal warehouse, packaging); and the costs for central management
functions (strategic purchasing, planning and scheduling, warehouse manage-
ment). The costs are compared to the corresponding planning values and those
from the previous year. In case of significant differences, additional ad-hoc
analyses are conducted to clarify the reasons for this. Doing so, values,
e.g. quantity, productivity, and price effects are shown separately (productivityand economic efficiency key figures).
The most important quality key figure is called WOTIF (Work on Time in
Full). It shows to which percentage the goods were ready to be picked up in a
warehouse location at the agreed time. It is calculated for every production site
or commercial good and can be broken down to the level of individual items.
Also in this case, significant deviation from the target values is analyzed.
Subsequently, controlling measures are drawn up with the production planners
of the sites or the suppliers.
Another key figure to assess delivery quality is the planning accuracy of theindividual sales companies (deviation ordered quantity to actually picked-up
quantity in per cent per time unit). If it deviates from the standard tolerance, it
can also influence theWOTIF key figure. The key figure planning accuracy is the
subject of controlling meetings with the sales companies.
The actual stock quantity is compared to the target values and those from the
previous year to assess working capital (see Chap. 10). For this, raw materials,
semi-finished products, and finished products are assessed individually per
production site. The separate assessment of the actual values corresponds to
the different persons responsible for different stocks within the organization. For
example, the raw material management department or the production-planning
department in the plants is responsible for the raw material and semi-finished
goods stock; the logistics-planning department is responsible for the so-called
make-to-stock items.
256 11 Logistics Controlling
Days of Stock (DOS) is another key figure for stock controlling. It is calcu-
lated as follows:
DOS daysð Þ ¼ size of stock €ð Þ=turnover €ð Þ � 360 daysð ÞCompared to planning values and values from the previous year, this key
figure provides information about the warehouse handling frequency or the
range of the stock.
When the results from the Logistical Cost and Performance Accounting are
prepared and available for Controlling, the structure described above is sufficient to
create a multitude of key figures about the logistical process or the logistical
environment. That is why a systematic approach to working with key figures is
necessary; their use should be limited to a small number of key figures that are
directly aimed at the target KPI.
While working with KPI’s certain limits to the use of key figures should be
considered:10
¢ Key figure inflation, i.e. when too many key figures with largely the same
content are created; often, the creation effort and the significance do not have
a favorable ratio
¢ Mistakes because of imprecise definition and specification of the basic data
¢ A lack of consistence of key figures; contradicting statements or key figures that
clearly do not have a connection to each other
¢ Problems with the direct or indirect key figure control, i.e. it is possible to
manipulate key figures by changing activity variables, e.g. during the acquisi-
tion, in a way that critical insights can be covered
To avoid key figure inflation, to make the results from Controlling easy to use for
the management, and to present interpretation approaches to the management, the
Balanced Score Card (BSC) system was developed.11 The BSC is a structured and
balanced key figure system that usually looks at a company from four different
perspectives with a cause-effect relationship:12
¢ Financial perspective (turnover, ROI, logistics costs, transport fleet costs etc.)
¢ Customer perspective (degree of delivery service, incorrect delivery ratio, loss
ratio etc.)
¢ Business process perspective (order processing time, average warehouse
handling time, average stock etc.)
¢ Learning and development perspective (fluctuation ratio, employee satisfaction,
proposals for improvement etc.)
10 Cf. Schulte (2009), p. 667 et seq.11 Cf. Kaplan and Norton (1997), p. 7 et seq.12 Cf. Vahrenkamp (2007), p. 432.
11.3 Key Figure Systems 257
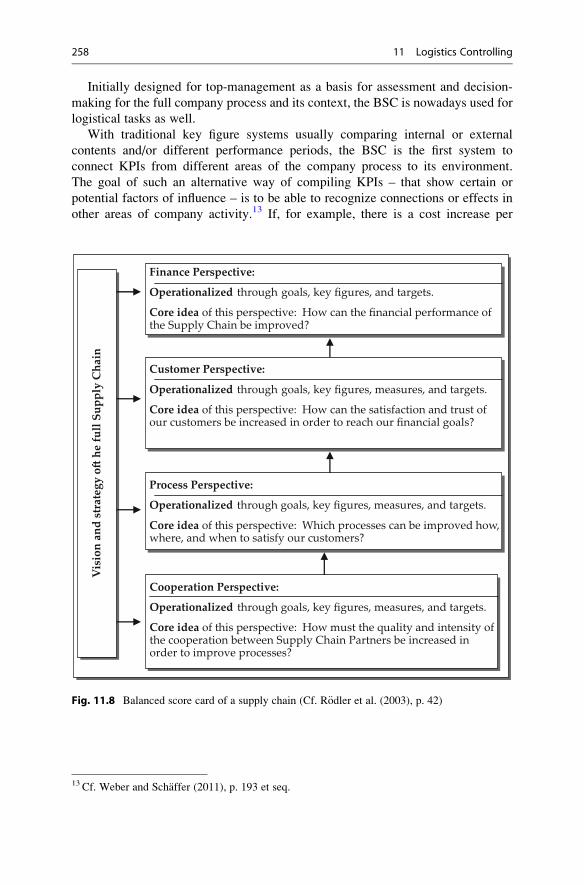
Initially designed for top-management as a basis for assessment and decision-
making for the full company process and its context, the BSC is nowadays used for
logistical tasks as well.
With traditional key figure systems usually comparing internal or external
contents and/or different performance periods, the BSC is the first system to
connect KPIs from different areas of the company process to its environment.
The goal of such an alternative way of compiling KPIs – that show certain or
potential factors of influence – is to be able to recognize connections or effects in
other areas of company activity.13 If, for example, there is a cost increase per
377
Finance Perspective:
Operationalized through goals, key figures, and targets.
Core idea of this perspective: How can the financial performance of the Supply Chain be improved?
Vis
ion
and
stra
tegy
o�
he fu
ll Su
pply
Cha
in
Customer Perspective:
Operationalized through goals, key figures, measures, and targets.
Core idea of this perspective: How can the satisfaction and trust of our customers be increased in order to reach our financial goals?
Process Perspective:
Operationalized through goals, key figures, measures, and targets.
Core idea of this perspective: Which processes can be improved how, where, and when to satisfy our customers?
Cooperation Perspective:
Operationalized through goals, key figures, measures, and targets.
Core idea of this perspective: How must the quality and intensity of the cooperation between Supply Chain Partners be increased in order to improve processes?
Fig. 11.8 Balanced score card of a supply chain (Cf. R€odler et al. (2003), p. 42)
13 Cf. Weber and Schaffer (2011), p. 193 et seq.
258 11 Logistics Controlling
handled shipment for a defined period without a decrease of shipment volume or
an increase in external costs in logistics, this can be explained by a growth rate
of the KPI in the HR department Costs per Staff Hour due to a higher number of
employees on sick leave.
A characteristic of the BSC is its compact and clear layout (which may also
be graphical). This is achieved through the aggregation of the individual
perspectives to one minimum that is relevant for decision-making (KPI).14 The
BSC of a Supply Chain shown in Fig. 11.8 shows the quality and intensity of the
Supply Chain parties’ cooperation and that customer satisfaction is directly
connected to this.
Case Study 11.2: ROI Scenario Calculation
The DuPont System of Financial Control is one of the most well known key
figure systems. It is aimed at the company goal profit maximization and works
with the Return on Invest (ROI), i.e. the amount of money gained or lost on
invested capital, as its top key figure. The ROI is divided into its individual
elements and mathematically fully linked.15 The individual elements are the
adjusting screws of management activity. This visualizes the effects of measures
on the ROI – also in the field of logistics – and the proportions thereof.
Figure 11.9 shows an initial scenario.
The effects of individual measures in logistics on the ROI will be calculated
in the following.
(a) Decrease in operative logistics costsFrom the initial scenario, it is now assumed that the management is success-
ful in reducing logistic costs by 10 %. The share of logistics costs in other
costs is 20 %.
(b) Reduction of stockIt is assumed that the management is successful in reducing the stock and the
necessary operating capital by 20 %.
(c) Increase in salesThe company is able to increase its sales by 10 %. This was only made
possible by investing 10 % more into other costs and material costs.
Calculate the changes to the ROI for all three scenarios! Use the
procedure from Fig. 11.10.
14 Cf. Karrer and Petzold (2004), p. 91 et seq.15 Cf. Weber and Schaffer (2011), p. 190. und Meyer (2011), p. 141 et seq.
11.3 Key Figure Systems 259
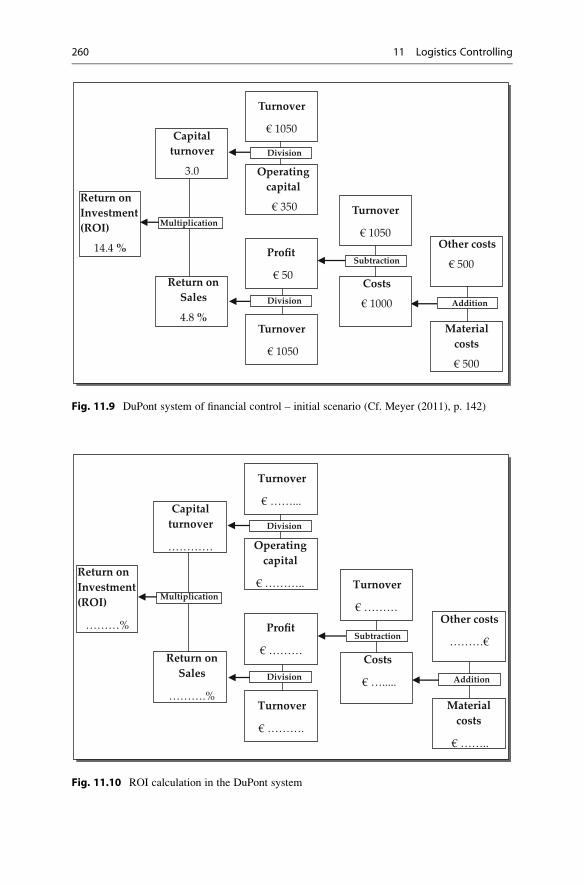
Other costs
………€
Material costs
€ ……..
Return on Investment (ROI)
………%
Addition
Costs
€ ….....
Turnover
€ ………
Subtraction
Operating capital
€ ………..
Turnover
€ ……...
Division
Capital turnover
…………
Return on Sales
……….%
Multiplication
Profit
€ ………
Turnover
€ ……….
Division
Fig. 11.10 ROI calculation in the DuPont system
Other costs
€ 500
Material costs
€ 500
Return on Investment (ROI)
14.4 %
Addition
Costs
€ 1000
Turnover
€ 1050
Subtraction
Operating capital
€ 350
Turnover
€ 1050
Division
Capital turnover
3.0
Return on Sales
4.8 %
Multiplication
Profit
€ 50
Turnover
€ 1050
Division
Fig. 11.9 DuPont system of financial control – initial scenario (Cf. Meyer (2011), p. 142)
260 11 Logistics Controlling
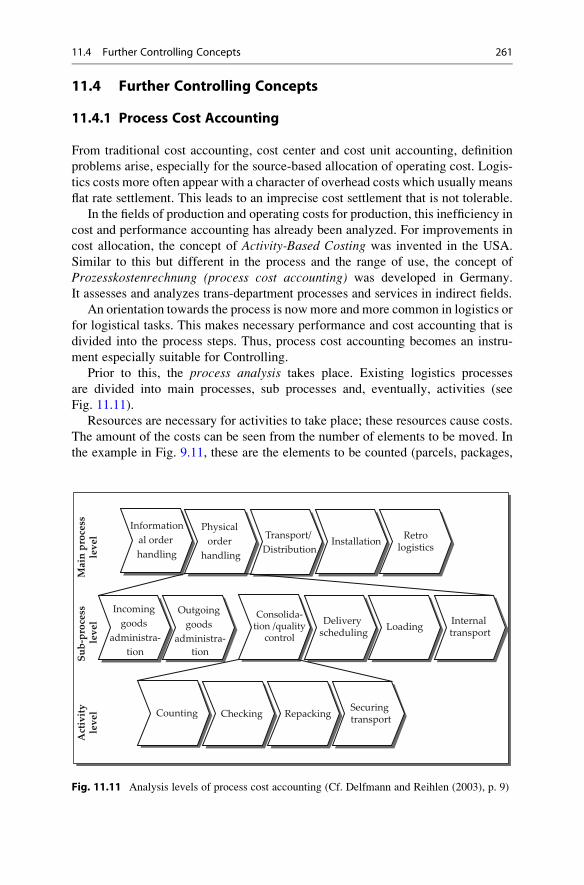
11.4 Further Controlling Concepts
11.4.1 Process Cost Accounting
From traditional cost accounting, cost center and cost unit accounting, definition
problems arise, especially for the source-based allocation of operating cost. Logis-
tics costs more often appear with a character of overhead costs which usually means
flat rate settlement. This leads to an imprecise cost settlement that is not tolerable.
In the fields of production and operating costs for production, this inefficiency in
cost and performance accounting has already been analyzed. For improvements in
cost allocation, the concept of Activity-Based Costing was invented in the USA.
Similar to this but different in the process and the range of use, the concept of
Prozesskostenrechnung (process cost accounting) was developed in Germany.
It assesses and analyzes trans-department processes and services in indirect fields.
An orientation towards the process is nowmore and more common in logistics or
for logistical tasks. This makes necessary performance and cost accounting that is
divided into the process steps. Thus, process cost accounting becomes an instru-
ment especially suitable for Controlling.
Prior to this, the process analysis takes place. Existing logistics processes
are divided into main processes, sub processes and, eventually, activities (see
Fig. 11.11).
Resources are necessary for activities to take place; these resources cause costs.
The amount of the costs can be seen from the number of elements to be moved. In
the example in Fig. 9.11, these are the elements to be counted (parcels, packages,
Counting Checking Repacking Securing transport
Act
ivity
leve
l
Incoming goods
administra-tion
Outgoing goods
administra-
Consolida-tion /quality
control
Delivery scheduling Loading Internal
transport
Sub-
proc
ess
leve
l
Informational order handling
Physical order
handling
Transport/ Distribution
Installation Retrologistics
Mai
n pr
oces
sle
vel
tion
Fig. 11.11 Analysis levels of process cost accounting (Cf. Delfmann and Reihlen (2003), p. 9)
11.4 Further Controlling Concepts 261

pallets etc.). These elements are called cost drivers. For example, one logistics
employee needs 20 s to count the items (elements) for one order. The costs for the
employee can be calculated by Euros per second of his or her monthly wage and to
Euros per counted item. If such an analysis takes place for every process step that
contains different activities, the exact process costs can be calculated.
It is obvious that for a customer order that contains only one package or packing
unit of an item, different costs will accumulate for picking, provisioning, and
delivery than for an order with a full pallet of the same item. Then again, an
order with half a pallet of the same item and five packing units of different items
will create different costs. It is widely common to charge the customer a flat rate for
every order. This is the point where process cost accounting comes in: it enables
detecting the individual sets of costs for calculating the logistics costs for the
customer order.
11.4.2 Supply Chain Controlling
As already mentioned, logistics nowadays is not anymore limited to isolated,
functional elements such as transport or warehousing but sees itself as a designer
of logistics networks in Supply Chain Management. Controlling tasks must be
adjusted to this. Tasks like planning, efficiency control, and controlling for pro-
cesses across value creation steps and company limits are parts of Supply ChainControlling. It focuses on identification, assessment, and optimization of the overall
benefit of supply chain processes; subsequently, the profits from these benefits can
be allocated to the supply chain actors based on the source or the performance.16
The instruments for this are the same as the usual Controlling instruments.
Realizing Supply Chain Controlling across value creation steps and company
borders, however, is not without problems. In everyday work, the provision of the
necessary data material by the individual supply chain stakeholders is often diffi-
cult. Often, there is a lack of openness and trust between partners; exchanging
internal data about performance or, most of all, costs then does barely take place
within reasonable time. At this point, relationship management with instruments for
increasing trust must be used (see Sect. 3.4.2)
11.5 Costs and Cost Effects; Performance and PerformanceEffects
The costs and cost effects and the performance and performance effects in ware-
house and transport nets show how complex the mapping of logistical cost and
performance facts can be (see Chap. 8). In planning warehouse and transport
networks, great emphasis is placed on the tradeoffs between the network structures
16 Cf. Neher (2005), p. 29.
262 11 Logistics Controlling

and the logistical cost and performance figures because they make possible the
assessment of the performance capability and the economic efficiency of the
structures.
Cost figures of warehouse networks can be:
¢ Warehouse costs (staff, rent costs)
¢ Handling costs (handling, picking, packing)
¢ Stock costs (interests, obsolescence, storage space costs)
¢ Transport costs (between warehouse steps, transports to the branches)
¢ Process costs (controlling, coordination)
The warehouse cost structure mostly consists of fixed costs. Variable costs
include handling costs like incoming goods administration, moving goods in and
out of stock, internal transport, picking, and packaging tasks. Warehouse costseffects mostly occur when changes to the warehouse structure are made. If the
number of warehouses is reduced, there will be higher capacity requirements for the
remaining warehouses (space, design, technical equipment). On the other hand, cost
reductions can occur through balancing effects in employment of staff as well as
through synergies in the management.
Stock costs are a considerable cost driver because of the high capital employed
for stock. With stock management largely taking place based on prognosis about
potential demand, and replenishment times subject to fluctuations, the risk for
incorrect or excess stock increases; it is a considerable stock cost effect. The dangerof failures (Out of Stock) necessitates maintaining safety stocks, which, in turn,
leads to higher stock costs.
Transport costs occur in the form of freight costs for deliveries to production
plants, warehouses, or branches. The transport effects are mainly influenced by the
transport volume structure and the transport cost structure. The transport volume
structure depends on how widely vehicle utilization for warehouse deliveries can
be realized by bundling. All components of transport cost rates based on distance
and volume influence the transport cost structure. If the number of warehouses is
increased, there is a tendency for transport costs to warehouses to increase. This
effect grows with the elasticity of the transport rate regarding the quantity because
lower delivery quantities per warehouse have a stronger effect on the transport
costs. On the other hand, delivery costs to branches decrease with a growing
number of warehouses for transport costs with decreasing volume because the
number of expensive transport distances decreases.
As shown in the paragraphs on stock, warehouse, and warehouse supply costs,
central warehouse network structures have numerous cost advantages. The neces-
sary capacity for the same handling volume is higher in a full system with a
decentralized structure than with a centralized structure. A growing number of
warehouses, in turn, leads to higher fixed costs. However, it must be noted that the
overall costs are considerably influenced by individual cost categories. Further-
more, individual values are difficult to quantify because of the general difficulties in
collection, definition, and allocation of logistics costs. Figure 11.12 summarizes the
tendencies of cost effects of warehouse and network structures.
11.5 Costs and Cost Effects; Performance and Performance Effects 263

Mapping performance effects is equally difficult. Bundling effects through
centralization are contrasted with longer delivery times resulting from growing
transport distances to the branches. Additionally, the fluctuation in transport
reliability grows with larger distances, which makes necessary higher safety stocks.
Logistics controlling must support these – and more – interconnections of
logistical decisions.
Number of sites
Number of sites
Cos
ts
Transport costs
Number of sites
Cos
ts
Warehouse costs
Cos
ts
Stock costs
Number of sites
Cos
ts
Administration costs
Number of sites
Cos
ts
Shortage costs
Cos
ts
Overall costs
Optimum number of sites
Number of sites
Fig. 11.12 Cost effects of warehouse and network structures (Cf. Pfohl (2010), p. 61)
264 11 Logistics Controlling
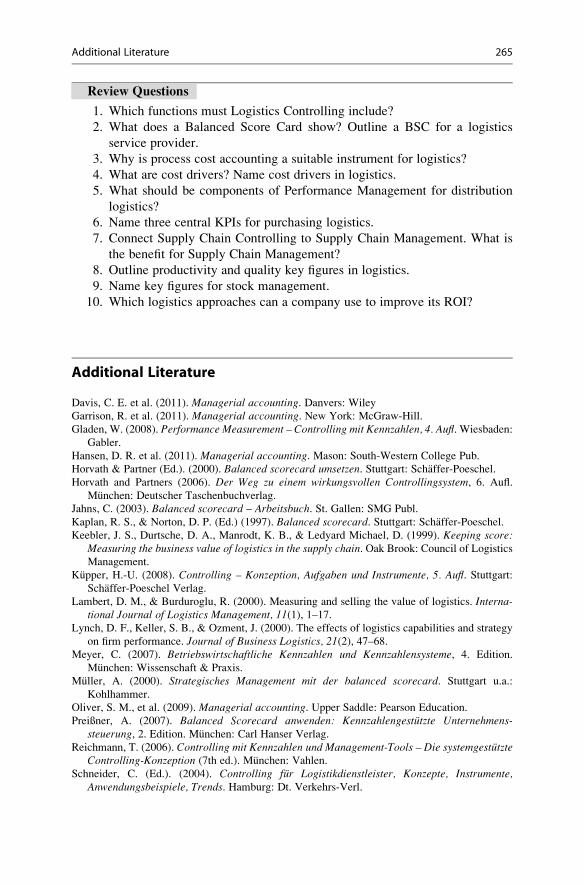
Review Questions
1. Which functions must Logistics Controlling include?
2. What does a Balanced Score Card show? Outline a BSC for a logistics
service provider.
3. Why is process cost accounting a suitable instrument for logistics?
4. What are cost drivers? Name cost drivers in logistics.
5. What should be components of Performance Management for distribution
logistics?
6. Name three central KPIs for purchasing logistics.
7. Connect Supply Chain Controlling to Supply Chain Management. What is
the benefit for Supply Chain Management?
8. Outline productivity and quality key figures in logistics.
9. Name key figures for stock management.
10. Which logistics approaches can a company use to improve its ROI?
Additional Literature
Davis, C. E. et al. (2011). Managerial accounting. Danvers: Wiley
Garrison, R. et al. (2011). Managerial accounting. New York: McGraw-Hill.
Gladen, W. (2008). Performance Measurement – Controlling mit Kennzahlen, 4. Aufl. Wiesbaden:
Gabler.
Hansen, D. R. et al. (2011). Managerial accounting. Mason: South-Western College Pub.
Horvath & Partner (Ed.). (2000). Balanced scorecard umsetzen. Stuttgart: Schaffer-Poeschel.Horvath and Partners (2006). Der Weg zu einem wirkungsvollen Controllingsystem, 6. Aufl.
Munchen: Deutscher Taschenbuchverlag.
Jahns, C. (2003). Balanced scorecard – Arbeitsbuch. St. Gallen: SMG Publ.
Kaplan, R. S., & Norton, D. P. (Ed.) (1997). Balanced scorecard. Stuttgart: Schaffer-Poeschel.Keebler, J. S., Durtsche, D. A., Manrodt, K. B., & Ledyard Michael, D. (1999). Keeping score:
Measuring the business value of logistics in the supply chain. Oak Brook: Council of LogisticsManagement.
Kupper, H.-U. (2008). Controlling – Konzeption, Aufgaben und Instrumente, 5. Aufl. Stuttgart:Schaffer-Poeschel Verlag.
Lambert, D. M., & Burduroglu, R. (2000). Measuring and selling the value of logistics. Interna-tional Journal of Logistics Management, 11(1), 1–17.
Lynch, D. F., Keller, S. B., & Ozment, J. (2000). The effects of logistics capabilities and strategy
on firm performance. Journal of Business Logistics, 21(2), 47–68.Meyer, C. (2007). Betriebswirtschaftliche Kennzahlen und Kennzahlensysteme, 4. Edition.
Munchen: Wissenschaft & Praxis.
Muller, A. (2000). Strategisches Management mit der balanced scorecard. Stuttgart u.a.:
Kohlhammer.
Oliver, S. M., et al. (2009). Managerial accounting. Upper Saddle: Pearson Education.
Preißner, A. (2007). Balanced Scorecard anwenden: Kennzahlengestutzte Unternehmens-steuerung, 2. Edition. Munchen: Carl Hanser Verlag.
Reichmann, T. (2006). Controlling mit Kennzahlen und Management-Tools – Die systemgestutzteControlling-Konzeption (7th ed.). Munchen: Vahlen.
Schneider, C. (Ed.). (2004). Controlling fur Logistikdienstleister, Konzepte, Instrumente,Anwendungsbeispiele, Trends. Hamburg: Dt. Verkehrs-Verl.
Additional Literature 265

St€olzle, W., & Otto, A. (Eds.). (2003). Supply Chain Controlling in Theorie und Praxis.Wiesbaden: Gabler.
Weber, J. (2002a). Logistik-und supply chain controlling (5th ed.). Stuttgart: Schaffer-Poeschel.
Weber, J. (2002b). Logistikkostenrechnung: Kosten-, Leistungs- und Erl€osinformationen zurerfolgsorientierten Steuerung der Logistik. Heidelberg: Springer.
Weber, J., & Schaffer, U. (2000). Balance scorecard & Controlling, Implementierung – Nutzen furManager und Controller – Erfahrungen in deutschen Unternehmen. Wiesbaden: Gabler.
Weber, J., & Schaffer, U. (2008). Einfuhrung in das Controlling (13th ed.). Stuttgart: Schaffer-
Poeschel.
266 11 Logistics Controlling
Business Models and Industry Solutions 12
Learning Objectives
Logistics plays a huge part in improving a company’s competitive position.
In many cases it is prerequisite for the creation of new business fields and for
opening up additional markets. This chapter deals with various existing business
models in the industry, trade, and service sectors; with the main focus on the
logistical requirements and structures, which will be further explained through
some exemplary industry solutions. In particular, the chapter illustrates the
effects on logistics resulting from internationalization and globalization, from
increasing division of labor and the forms of collaboration caused by this, and
from new procurement concepts and sales channels brought about by
e-commerce. The reader will gain insights into the consequences business
decisions can have on logistics – and why the functions of logistics should be
taken into account at an early planning stage.
Keywords
¢ Industry models, industry solutions
¢ Stationary trade, mail order business
¢ E-commerce
¢ Internationalization, globalization
¢ Automobile, textile, and electronics industries
¢ Procurement, production, and distribution strategies
¢ Contract logistics
H. Gleissner and J.C. Femerling, Logistics, Springer Texts in Business and Economics,
DOI 10.1007/978-3-319-01769-3_12, # Springer International Publishing Switzerland 2013
267
12.1 Business Models
A model is a simplified representation of reality. Hence, a business model is a
simplified representation of a commercial activity where several business partners
come together to exchange material or immaterial goods commercially. Business
transactions in the form of business processes – such as product offering, product
delivery, order and payment processing – can form a business model and are
necessary for this exchange.1
A business model not only can be the description of an individual company but
also of an entire industry or trading sector. This is also called industry solution.
In this sense, the term business model is applied to mature industries, in which a
dominant business model has become prevalent. Nevertheless, these models are
subject to ongoing innovation and change, which is fuelled by the need for
increased economic efficiency and cost reduction. Selected business models and
industry solutions with their respective logistics systems will be presented in the
following.
12.2 Logistical Industry Solutions
12.2.1 Industry Solutions in Manufacturing
Logistical industry concepts are as manifold in the manufacturing sector as the
individual industries themselves. Thus, only a few industries and their logistics
systems can be presented here. A key industry is the automotive industry includingthe supplying industry, which has taken on a leading role in the development and
application of logistics concepts since the beginning of logistics. Many logistics
concepts have been adopted from other industries, such as just-in-time delivery or
vendor managed inventory, area freight forwarding, external procurement
warehouses, and supplier parks (see Chap. 7).
The main logistical determinants of the automotive industry are:
¢ Strong fragmentation of value chains
¢ Decentralized manufacturing in networked production systems
¢ Increasingly globalized supply chains
Fragmented value chains generate widely ramified procurement-supply chains
between car producers and their direct suppliers. These suppliers are also termed
tier-1 suppliers. The integration of pre-suppliers (tier-2, tier-3 etc.) in these chains is
still the exception rather than the rule, which is why industry-specific and optimized
value chains in this field have hardly developed yet. In the future, the automotive
1 Cf. Berning (2002), p. 16.
268 12 Business Models and Industry Solutions
industry will direct their efforts towards this issue,2 thereby making this sector ever
more reliant on logistics.
The automotive industry greatly relies on purchased components, materials, and
primary products, which entails highly complex supplier–buyer relations. For this
reason, automobile manufacturers consistently seek to reduce their supplying
resources in terms of components, product lines, and locations.3 While in the past
e.g. European manufacturers collaborated with 500–1,000 suppliers, some producers
have already reduced this number to 350. The medium-term plan is to only collabo-
rate with 30–50 suppliers. This strategy of Single Sourcing is considerably driven bypurchasing pre-finished modules and systems.4
A module is defined as a self-contained functional unit that may consist of
several or many (individual) parts and components. A system is a functional and
technical-developmental unit oriented towards one main function. A system
supplier’s responsibilities, however, comprise more than merely procurement,
assembly, and test operations. They are also integrated into a company’s R&D,
product designing, and logistics. These suppliers are also called value-addingpartners.
The procurement strategies of modular and system sourcing lead to a regroupingof the supply chain (so-called tiering). The supply chain is enlarged by an additionaltier made up of module and system suppliers and now comprises components,
module, and system suppliers. Module suppliers autonomously coordinate the flow
of materials and components of the upstream suppliers in the supply chain and
assemble the pre-finished modules from the components.
One example is the cockpit of a car, which consists of an instrument carrier,
heating and air-conditioning, all control elements, a steering column and steering
wheel, safety installations (airbag), radio and navigation systems, and so on.
Another example is the chassis frame, where either front or rear axle module,
including undercarriage technology (springs, dampers) are available, as well as
wheel systems including rims, tires, pressure control, and so forth (see Fig. 12.1).
The procurement of modules and systems is not confined to the automotive
industry. Other sectors have also pursued this procurement-supply concept for some
time.5 Thus, computer manufacturers purchase complete hard drives and screens,
builders procure entire bathrooms and door, window, and facade elements. Watch
producers are supplied with clockworks while in the food industry spice blends and
ready-made fruit supplements for yogurt production are purchased as complete
modules.
With increased scope of delivery, modules correspond to the criteria of just-in-
time procurement (i.e. quality, diversity, and volume), which is why the supply of
modules takes the greatest share of just-in-time deliveries.6 In this case, the
2 Cf. Straube et al. (2005), p. 104.3 Cf. Wildemann (2010). p. 86 et seq.4 Cf. Ihme (2006), p. 276.5 Cf. v. Eicke and Femerling (1991), p. 59.6 Cf. Ihme (2006), p. 296.
12.2 Logistical Industry Solutions 269
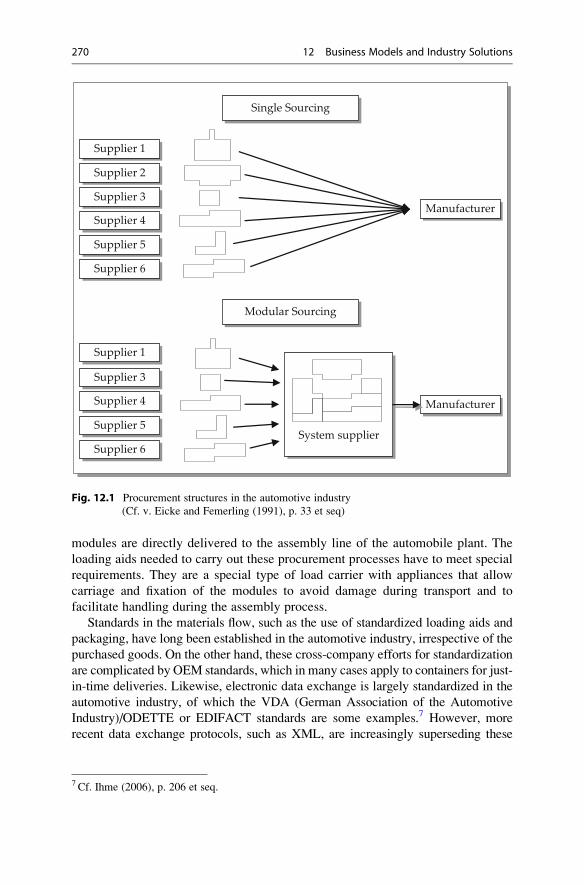
modules are directly delivered to the assembly line of the automobile plant. The
loading aids needed to carry out these procurement processes have to meet special
requirements. They are a special type of load carrier with appliances that allow
carriage and fixation of the modules to avoid damage during transport and to
facilitate handling during the assembly process.
Standards in the materials flow, such as the use of standardized loading aids and
packaging, have long been established in the automotive industry, irrespective of the
purchased goods. On the other hand, these cross-company efforts for standardization
are complicated by OEM standards, which in many cases apply to containers for just-
in-time deliveries. Likewise, electronic data exchange is largely standardized in the
automotive industry, of which the VDA (German Association of the Automotive
Industry)/ODETTE or EDIFACT standards are some examples.7 However, more
recent data exchange protocols, such as XML, are increasingly superseding these
System supplier
Supplier 1
Supplier 2
Supplier 3
Supplier 4
Supplier 5
Supplier 6
Supplier 1
Supplier 3
Supplier 4
Supplier 5
Supplier 6
Single Sourcing
Modular Sourcing
Manufacturer
Manufacturer
Fig. 12.1 Procurement structures in the automotive industry
(Cf. v. Eicke and Femerling (1991), p. 33 et seq)
7 Cf. Ihme (2006), p. 206 et seq.
270 12 Business Models and Industry Solutions
standards (see Chap. 9). If the information and communication technologies used
between producers and their direct suppliers can be regarded as good, upstream
suppliers and the involved logistics service providers are also in considerable demand
of such technologies.
Apart from the acquisition of external suppliers, the European automobile
industry is also characterized by a network of production and assembly sites that
is strongly interwoven. The Volkswagen Group, for example, operates over 50
production sites world-wide. Likewise, premium car manufacturers have numerous
production sites at their disposal, often located in the most important markets.
On the one hand, foreign exchange fluctuations can thus successfully be offset.
On the other hand, foreign markets are in many cases much more important than the
car producer’s own domestic market. BMW, for instance, now sells more cars in the
USA than in Germany. This has led to the set-up of a new production site in
Spartanburg, North Carolina, where the X5 and Z4 series are built and the X3
series will be built in the future. These cars are entirely produced there. With a
car-specific vertical range of manufacture of about 30 %, most parts and
components are procured through the supply network of the BMW Group. Numer-
ous suppliers have relocated to the plant’s proximity since it is a common strategy
in the supplying sector to adopt the internationalization strategies of their
producers. The engines are procured through BMW’s production network and
mostly manufactured at the engine works in Graz/Austria. Other car manufacturers
employ similar procurement and production strategies.
Along with procurement and production, the importance of distribution is growing
for the automotive industry, too. Distribution of cars is mostly effected through multi-
level sales systems, which are brand-exclusive to many manufacturers. Via sales
companies the producers deliver the cars to their own subsidiaries, to contractors, and
to importers in the individual markets.
In the past, markets were supplied with cars according to a push strategy which
corresponded to existing production facilities, i.e. a certain stock of cars was
provided to the car dealers.8 Due to the great variety of types and designs, this
strategy of car distribution is now only suitable for volume manufacturers (Opel,Ford, VW). Premium manufacturers (Audi, BMW Group, Daimler, Porsche), havefor some time pursued higher production flexibility, which enables them to adopt a
pull strategy where the entire car production is aligned with customer orders.9 To
ensure high adherence to deadlines despite a great variety of types and designs and
thus fluctuating production complexity, the production sequence follows a pearl
chain principle, which does not allow for a change of design or delivery date after a
certain point.10
Logistics service providers assume an important role for the automotive industry
as well. With regard to procurement, they manage the transport-logistical and
8Cf. Sommer (2003), p. 240.9 Cf. Sommer (2003), p. 242.10 Cf. Feldkamp (2001), p. 175.
12.2 Logistical Industry Solutions 271
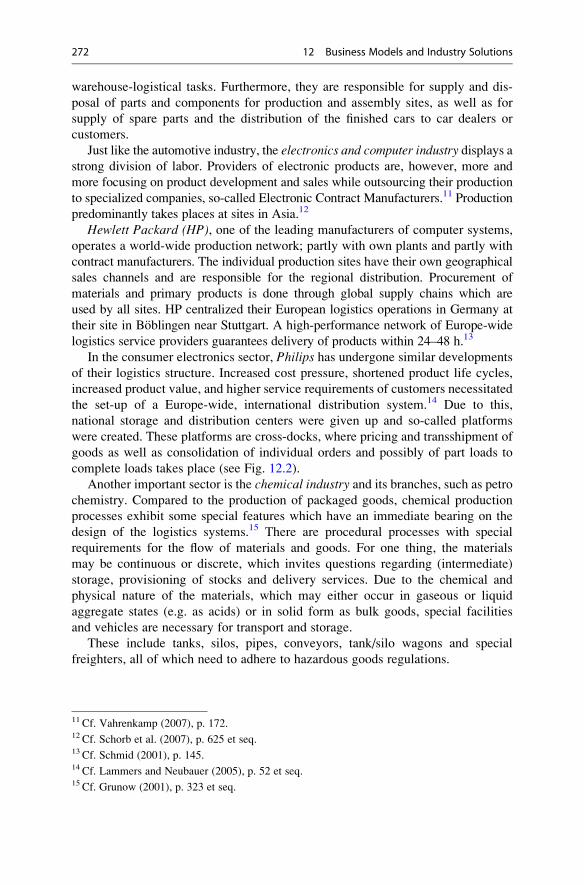
warehouse-logistical tasks. Furthermore, they are responsible for supply and dis-
posal of parts and components for production and assembly sites, as well as for
supply of spare parts and the distribution of the finished cars to car dealers or
customers.
Just like the automotive industry, the electronics and computer industry displays astrong division of labor. Providers of electronic products are, however, more and
more focusing on product development and sales while outsourcing their production
to specialized companies, so-called Electronic Contract Manufacturers.11 Production
predominantly takes places at sites in Asia.12
Hewlett Packard (HP), one of the leading manufacturers of computer systems,
operates a world-wide production network; partly with own plants and partly with
contract manufacturers. The individual production sites have their own geographical
sales channels and are responsible for the regional distribution. Procurement of
materials and primary products is done through global supply chains which are
used by all sites. HP centralized their European logistics operations in Germany at
their site in Boblingen near Stuttgart. A high-performance network of Europe-wide
logistics service providers guarantees delivery of products within 24–48 h.13
In the consumer electronics sector, Philips has undergone similar developments
of their logistics structure. Increased cost pressure, shortened product life cycles,
increased product value, and higher service requirements of customers necessitated
the set-up of a Europe-wide, international distribution system.14 Due to this,
national storage and distribution centers were given up and so-called platforms
were created. These platforms are cross-docks, where pricing and transshipment of
goods as well as consolidation of individual orders and possibly of part loads to
complete loads takes place (see Fig. 12.2).
Another important sector is the chemical industry and its branches, such as petrochemistry. Compared to the production of packaged goods, chemical production
processes exhibit some special features which have an immediate bearing on the
design of the logistics systems.15 There are procedural processes with special
requirements for the flow of materials and goods. For one thing, the materials
may be continuous or discrete, which invites questions regarding (intermediate)
storage, provisioning of stocks and delivery services. Due to the chemical and
physical nature of the materials, which may either occur in gaseous or liquid
aggregate states (e.g. as acids) or in solid form as bulk goods, special facilities
and vehicles are necessary for transport and storage.
These include tanks, silos, pipes, conveyors, tank/silo wagons and special
freighters, all of which need to adhere to hazardous goods regulations.
11 Cf. Vahrenkamp (2007), p. 172.12 Cf. Schorb et al. (2007), p. 625 et seq.13 Cf. Schmid (2001), p. 145.14 Cf. Lammers and Neubauer (2005), p. 52 et seq.15 Cf. Grunow (2001), p. 323 et seq.
272 12 Business Models and Industry Solutions
The special requirements of this business leads to a low level of outsourcing on
the one hand and causes a restrictive market offer on contract logistics services on
the other hand. Growing market pressure, globalization and hence newly structured
supply chains promoted the outsourcing process within chemical industry with
contract service providers. A number of logistics service providers specialized in
the chemical industry are available for storage and transport. Of major importance
are the transport modes of water, road, pipeline and rail.16
12.2.2 Industry Solutions in Trade
Several business models can be distinguished in the trading sector, which falls into
the categories of stationary trade, distance mail-order trade, and e-commerce. At a
first glance, the following business models can be listed for stationary trade:
¢ Subsidiary and non-subsidiary (retail) stores
¢ Department stores
¢ Consumer markets
¢ Self-service department stores
¢ Specialist stores and discounters
The structure and number of supply points and the range of products influence
the storage-logistical and transport-logistical structures of these business models to
a great extent.17 The physical nature of the goods (size, volume, weight, sensitivity)
Carrefour Lyon
Media Markt Berlin
Factory C
Factory B
Factory A
Tesco BristolPlatform
Cross-docking for consolidation of customer orders,
labelling, issuing of freight documents,
palletization
Complete pallets
Mixed pallets
Fig. 12.2 Platform concept of Philips (Cf. Lammers and Neubauer (2005), p. 53)
16 Cf. Buchholz et al. (1998), p. 87.17 Cf. Hardt and Kasch (2007), p. 641 et seq.
12.2 Logistical Industry Solutions 273

as well as the design and packaging have a bearing on the handling of the goods.
In particular, the logistical characteristics of these types of businesses are18:
Specialist stores without subsidiaries do in most cases not operate a logistics
system of their own. Generally, they are supplied directly by the producers or by
wholesalers.
The logistics of department stores depends on their articles’ properties and theirrange of products and is either effected as direct supply with decentralized storage
or differentiated according to products in a decentralized manner. In this way,
inventory risks can be minimized and costs may be saved by bundling goods for
the supply of the stores.
Consumer markets and self-service markets are often directly supplied. How-
ever, more and more parts of their product ranges are supplied from central
warehouses. Concepts of consolidation, such as cross-docking, are increasingly
employed as well (see Sect. 8.3.3). Subsidiary chains, for example Aldi, Lidl orDeichmann, are normally supplied directly from central warehouses.
Large discounters operate more than 60 central warehouses in Germany to
minimize the distances and thus the transport costs to the individual stores. This
indicates that the logistics of discounters is rather cost-oriented and characterized
by the simplicity of their inventory management and logistical processes.19 All the
more so as the product range of discounters is steadily growing and may comprise
approximately 700–1,000 products, which are mainly fast moving consumer goods.
Depending on their sales strategy and store size, full-range traders offer up to
15,000 articles, a large share of which are slow moving consumer products. The
logistics systems of full-range traders and discounters have to meet different
requirements due to the contrasting movement of their goods (fast/slow moving
consumer goods).20 The picking of slow moving goods is usually carried out on
picking vehicles, thereby largely separating the bundle units. Logistics systems for
fast moving goods, however, are rather designed for large quantities which are
mostly compiled to loading units on pallets. The storage systems vary accordingly.
Full-range traders pick their goods from the easily accessible lower shelves while
the buffer stock is placed on the upper shelves. The shipping of pallets with only
one type of article renders the storage and warehouse design of discounters rather
simple.
There are also a number of product-related business models, such as textiletrade. These models strongly rely on global procurement and production structures,
mainly to make use of considerable (labor) cost advantages abroad.21 The logistics
chains are in these cases often regulated by the trading companies. Thus, local
forwarders are commissioned with the pick-up and composition of shipments in the
country of origin. They then consolidate the shipments into container loads and
18 Cf. Merkel and Heymann (2003), p. 170 et seq.19 Cf. Brandes (2003), p. 202.20 Cf. Auffermann (2007), p. 26.21 Cf. Christopher et al. (2009), p. 112 et seq.
274 12 Business Models and Industry Solutions

carry out pre-carriage as well as on-carriage. The same applies to the takeover by
logistics service providers in the target country, which are responsible for separa-
tion, processing and tagging of the textiles as well as their delivery to the stores.22
These structures in the textile industry, however, are undergoing changes since
successful business models in textile trade are subject to shortening fashion cycles
with ever increasing demand for broad product ranges. This requires logistics
systems to offer shorter pre-carriage, processing and delivery times. The concept
of supplying stores directly from Asian production sites, for example, is supposed
to meet these requirements.23 Store-related picking, packing for export, and con-
solidation in containers for main carriage are all carried out at these production
sites. After de-consolidation of the containers in the country of destination, the
goods packages are delivered to the stores using the networks of the respective
delivery services. In comparison to traditional logistics systems, transit times are
reduced from 12 to 6 days for air freight and from 45 to 39 days for sea freight. The
logistics costs can be cut by close to 15 %.24
Inmail-order or distance trade, no delivery to business sites or stores takes placesince the goods are delivered directly from the warehouse to the customer.
Warehousing structures are normally organized centrally in the mail-order busi-
ness.25 Delivery services are critical for the success of a mail-order business. To
achieve the highest possible delivery service level, different warehouse and
shipping systems are used for different components of a product range. The
handling takes place in shipping hubs which are often highly automated to keep
operating costs low. For example, shelving racks, conveyors, cross-belt sorters, and
parcel machines are thus utilized. Handling capacities of more than 160 million
articles at one location per year can be achieved in high-rack warehouses.26
Reliable and flexible delivery – which is paramount for mail-order systems – is
greatly reliant on the technological equipment for storage and picking processes, on
the organization of the order processing and on the means of transport used. The
use of (partly) automated picking systems (Pick by Light, Pick by Voice) can
positively influence the picking reliability and overall speed. On the other hand,
manual picking strategies (pick lists) provide a high degree of flexibility against
fluctuating demands as well as speedy processing of urgent orders.27 Different
concepts are offered for delivery. These include 24 h service, desired date delivery,defined delivery windows, and evening or Saturday delivery. Moreover, further
delivery and collection concepts such as parcel shops integrate kiosks, gas stations,
or lottery shops in the delivery process. Parcel delivery systems at gas stations are
22 Cf. Buchholz et al. (1998), p. 90 et seq.; Nothardt et al. (2007), 688 et seq.23 Cf. Clausen et al. (2007), p. 26 et seq.24 Cf. Clausen et al. (2007), p. 28.25 Cf. Kloth (1999), p. 53.26 Cf. Witten and Karies (2003), p. 190.27 Cf. Femerling (2003), p. 217.
12.2 Logistical Industry Solutions 275

completely independent of opening hours. Track and tracing services make for a
better co-ordination of the delivery between customer and sender, by which more
accurate advance notifications can be issued and more reliability can be achieved.
The distribution of large goods – i.e. of white and brown goods such as washing
machines, refrigerators, TV sets, furniture and kitchens – is especially demanding
for mail-order businesses.
In approaching these challenges it is important to bring parallel distribution
channels together. In many cases distribution is effected within established
structures. White and brown goods while high-volume goods are delivered ex
works.28 These delivery structures, however, lead to varying service agreements
between sender and customer, which is met with less and less acceptance.
12.2.3 Industry Solutions in the Service Sector
Logistics for service providers is a business field for industry solutions that goes
beyond physical logistics processes. These service providers offer, for instance,
service for banks, insurance companies, public administration (back office), as well
as the administrations of industrial and trading companies. Accordingly, logistical
goals – such as providing the right persons, data, documents, information or even
materials at the right time, in the right quality and quantity at the right place of
demand – also play an important role in these areas. In particular, document and
information logistics are becoming increasingly important for the service sector as
they constitute an essential factor of production for immaterial products. Services of
physical and electronic postal logistics as well as physical and digital archiving
need to be rendered, including the necessary IT systems. Services like these are
more and more offered by logistics service providers.29
Postal logistics includes:
¢ Mail processing (incoming mail, outgoing mail, distribution)
¢ Letter shops (printing, enveloping, dispatch, courier services)
Archive logistics includes:
¢ Document reception, indexing, and management
¢ Document shredding according to legal regulations
¢ Archive management including scanning and integration into document man-
agement systems
¢ Process management using document management systems with workflows
Other service-sector industry solutions are available for health services. For
these purposes, procurement and distribution logistics are most important in hospital
wards where consumable articles (surgical dressings, syringes, medication etc.) and
28 Cf. Gleißner (2003), p. 202 et seq.29 Cf. Peters (2003), p. 109 et seq.
276 12 Business Models and Industry Solutions
reusable surgical instruments are needed. This includes purchasing processes, such as
price negotiations, framework contracts, standardization of product range and scope
of delivery and procurement processes, such as repeat orders, central warehouse
storage and fine distribution on the wards.30 Service providers specialized in this
segment are responsible for the coordination of the supply chain between suppliers,
producers, distributors and the hospital administration.
12.2.4 Industry Solutions in E-Business
Todays business models are significantly shaped by the Internet. Electronic man-agement of business processes not only helps optimize traditional business
processes but also forms the basis for entirely new business models. Prominent
examples of this are online marketplaces where supply and demand are aligned in
virtual space, where pricing processes are organized and where transactions are
supported by information-technology.31 E-business is above all carried out within
business-to-business (B2B) models for transactions both between companies and
their value-adding partners and between companies and their business clients.
E-commerce is mainly employed within business-to-consumer (B2C) models,
which describe transactions between companies and end consumers. Depending
on the organization of the (business) processes, e-business is also used to support
both procurement processes (Buy-Side or E-Procurement, E-Purchasing) and salesprocesses (Sell-Side or E-Commerce, E-Sales).
B2B and B2C business models describe markets or sales channels that are based
on marketplaces on which providers and consumers meet. Therefore, as a first step
it needs to be analyzed which markets or sales channels are to be targeted.32
In doing so, it is crucial to determine whether business is being made with an end
consumer or trading partner (wholesaler, retailer, subsidiary retailing business) and
which of the basic models of B2B and B2C need to be employed. Providers of
E-commerce can be:
¢ Multi-channel providers; established producers and trading companies which
make use of the Internet as an additional sales channel
¢ Exclusive Internet providers which use the Internet as their only sales platform
¢ Traditional mail-order businesses which offer Internet solutions to their
customers as a new communication and ordering medium, along with letter,
fax, and telephone
One of the most fundamental consequences of e-business is in any event a further
expansion of the markets. This is true both for the procurement markets, in which the
globalization of purchase and procurement is further accelerated, and for the sales
markets, where entirely new sales channels can be opened up. Since product ranges
30 Cf. Pintsch (2004), p. 252.31 Cf. Femerling (2003), p. 211 et seq.32 Cf. Femerling (2003), p. 208.
12.2 Logistical Industry Solutions 277
are offered on the Internet, a substantially larger distribution area than with traditional
mail-order trade is to be serviced. This directly affects delivery services, especially
with regard to delivery times. The advantages of global sourcing may lead to
increased costs in the procurement process due to longer transport distances, more
frequent transshipment and more complex processing (customs clearance, import
documents). On the other hand, cost advantages can be realized by utilizing the
Internet for purchasing activities (e-procurement) in the form of Desktop Purchasing
(DP) systems, especially for the purchase of standardized products.
E-business makes direct selling possible for producers but also for individual sales
stages. If such (intermediary) sales stages are skipped, the order structure is inevitably
affected. Few substantial orders, which had previously been delivered to businesses,
are then superseded by many small orders being sent directly to end customers. This
has direct effects on the logistics costs. The order processing costs rise since
economies of scales do no longer apply for storage and picking facilities. Costs per
transport item increase because deliveries involve many stops, few items are
delivered at each stop, and several delivery attempts sometimes have to be
undertaken, especially to private addresses (last-mile problem).33 The logistical
challenges are thus largely the same for distribution logistics as they are for the
mail-order business,34 where primarily small shipments need to be delivered to
customers within a narrow timeframe. However, e-commerce systems additionally
have to meet customer requirements with regard to speediness and reliability. This is
subsumed under the term fulfilment, which comprises the entire physical, informa-
tional, and monetary order processing.35 To this end, all existing systems of parcel
services, mail organizations or forwarders and carriers are called into action. Equally
important to order processing is the processing of return deliveries, subsequent
deliveries in cases of shortfall quantities, wrong deliveries, or technical complaints.
All the statements made about the structures of distribution networks (see Chap. 8)basically hold true for the B2B and B2C concepts discussed here. Especially impor-
tant are the substitutionary relations between the number of warehouses and storage
stages and the delivery time. The more warehouses are operated in a specific area, the
shorter become the possible delivery times, and the higher are the infrastructure costs
of the network. Considering the costs, a centralization of the warehouse structure is
suitable especially also for e-commerce solutions and can thus frequently be observed
in B2C systems.36 A decentralized network of warehouses, however, brings with it
the advantage of extremely quick delivery times. Segmentation of the network
structure specific to the product range is also favourable for the e-commerce sector.
Depending on the product and customer requirements, parts of the product range can
thus be stored centrally while other articles are stored in regional warehouses or are
delivered via stock-less transshipment points. Moreover, more and more producers
33 Cf. Witten and Karies (2003), p. 193.34 Cf. Bretzke (1999), p. 228.35 Cf. Schubert (2001).36 Cf. Lasch and Lemke (2002), p. 3.
278 12 Business Models and Industry Solutions

and suppliers as well as wholesalers are integrated with their distribution logistics.
Such differentiations may appear sensible if e-commerce offers from (centralized)
European distribution networks are to be taken advantage of. From a cost and
delivery-service perspective, however, part deliveries should be avoided.
12.3 International and Global Business Models
International and global business models may refer to procurement, production, and
distribution and show effects on the respective logistics systems. The frameworks
for international business models are continually changing while internationali-
zation strategies and logistics strategies can be mutually dependent. Amongst
others, the key factors for this development are37:
¢ Continued globalization through open borders
¢ Development of new growth markets in Eastern Europe and Asia
¢ Increasing offer range of logistics service providers
¢ High volatility and tendency towards falling transport prices
¢ World-wide differences in factor costs and, above all, labor costs
In designing international distribution systems, the contents about warehouse
management and transport network planning explained in Chap. 8 can be
extrapolated to the challenges of global logistics systems. Most important in
doing so are the target values of delivery service and logistics costs.38 Regarding
the delivery service, it is of major importance to reach destinations within a
reasonable time while distributing internationally. The requirements for this vary
in different geographical regions. For example, within the EU, in large cities or
agglomeration areas the same requirements apply, regardless of national borders.
Compared to national structures, the number of stakeholders and institutions in
global logistics systems is on the rise.
Thus, several transport modes and a multitude of forwarders and logistics service
providers are integrated into world-wide logistics chains.
Existing national logistics structures often distribute goods internationally, as is
the case of Eurologistics systems or when opening up new markets. This, however,
entails a significant (re)structuring of the existing institutions and structures.39
Several phases can be distinguished. In the first phase, finished products are exported
from the country of origin to the country of importation. Distribution in the individual
regions is carried out by importers, wholesalers or wire a own central warehouse of
the manufactors (OEM). Depending on the state of development, this results in a
multi-tier distribution system with one central warehouse for one sales region and
regional warehouses for the respective countries. In another phase, the production or
37 Cf. Neher (2005), p. 34 et seq.38 Cf. Freichel (2002), p. 267.39 Cf. Freichel (2002), p. 264.
12.3 International and Global Business Models 279
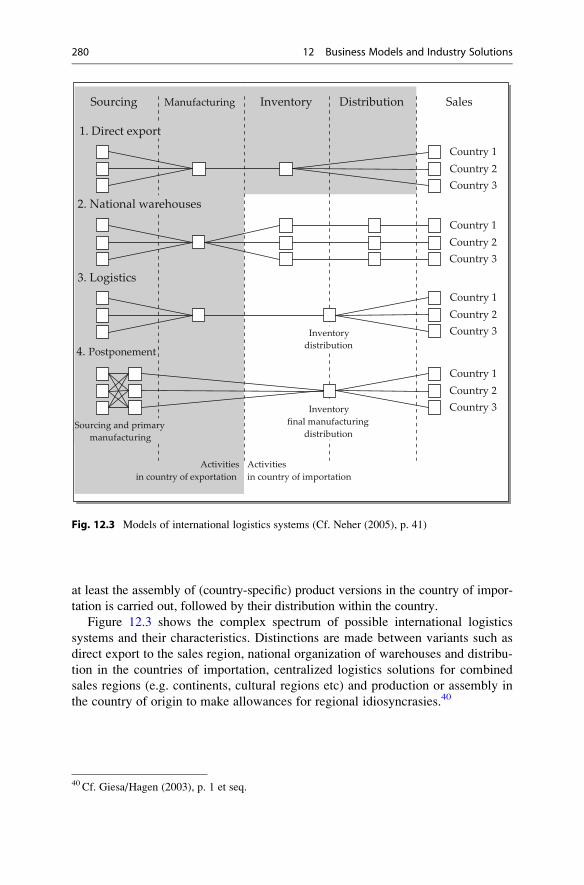
at least the assembly of (country-specific) product versions in the country of impor-
tation is carried out, followed by their distribution within the country.
Figure 12.3 shows the complex spectrum of possible international logistics
systems and their characteristics. Distinctions are made between variants such as
direct export to the sales region, national organization of warehouses and distribu-
tion in the countries of importation, centralized logistics solutions for combined
sales regions (e.g. continents, cultural regions etc) and production or assembly in
the country of origin to make allowances for regional idiosyncrasies.40
Activitiesin country of exportation
Activitiesin country of importation
Sourcing Manufacturing Inventory Distribution Sales
2. National warehouses
3. Logistics
4. Postponement
1. Direct export
Country 2Country 3
Country 1Country 2Country 3
Country 1Country 2Country 3
Country 1Country 2Country 3
Inventory distribution
Inventory final manufacturing
distributionSourcing and primary
manufacturing
Country 1
Fig. 12.3 Models of international logistics systems (Cf. Neher (2005), p. 41)
40 Cf. Giesa/Hagen (2003), p. 1 et seq.
280 12 Business Models and Industry Solutions

12.4 Development of Logistics Services Offers
On the basis of business solutions in the industry, service, and trading sectors,
different business models have been developed for logistics service providers. With
increased outsourcing of logistical activities to service providers, new concepts are
continually arising, which incorporate contract-logistical services along with trans-
port and storage tasks (see Sect. 5.5.3). With regard to sector-specific business
models, a distinction can be drawn between services focusing on consumer goods
and industrial, contract-logistical services.41 The characteristics of consumer goodsdistribution are:
¢ Staple goods (which can be placed on a pallet) in cardboard boxes
¢ Use of barcodes
¢ Not labeled for distribution to a particular receiver; instead, article-specific
distribution
¢ Sell-by dates and production batches (which both are controlled)
¢ Distribution from production sites and central warehouses of the producers to
the warehouses and stores of the trading sector
¢ Single-User-Systems for individual customers or Multi-Client-Warehouses for
several customers from one or several sectors
Through consumer goods contract logistics, leading logistics service providers
offer comprehensive distribution networks with corresponding storage facilities,
transshipment, and cross-docking points. To operate distribution centers, ware-
house management systems and integrated order processing systems are available.
Other critical success factors include a regional or even national truck-distribution
system, access to transport networks, high IT competence, qualified staff, and high-
quality technical equipment.
The following success factors are prevalent in industrial contract logisticsbusiness models42:
¢ IT competence and capability of IT integration
¢ Willingness to offer additional non-logistical services
¢ Customer-specific and sector-specific know-how
¢ Innovation skills to improve business models of clients
The service portfolio in industrial contract logistics mainly includes non-
logistical tasks, apart from the merely logistical ones. Examples of this are assem-
bly and mounting services, packaging, operation of call centers for customer
service, and quality inspections in production logistics. IT competence plays an
essential role in this business model since suppliers, producers and logistical service
providers need to be information-technologically connected according to sector-
specific standards.43
41 Cf. Tripp (2004), p. 12 et seq., Klaus (2007), p. 97 et seq.42 Cf. Tripp (2004), p. 24.43 Cf. Giesa and Hagen (2003), p. 43 et seq.
12.4 Development of Logistics Services Offers 281
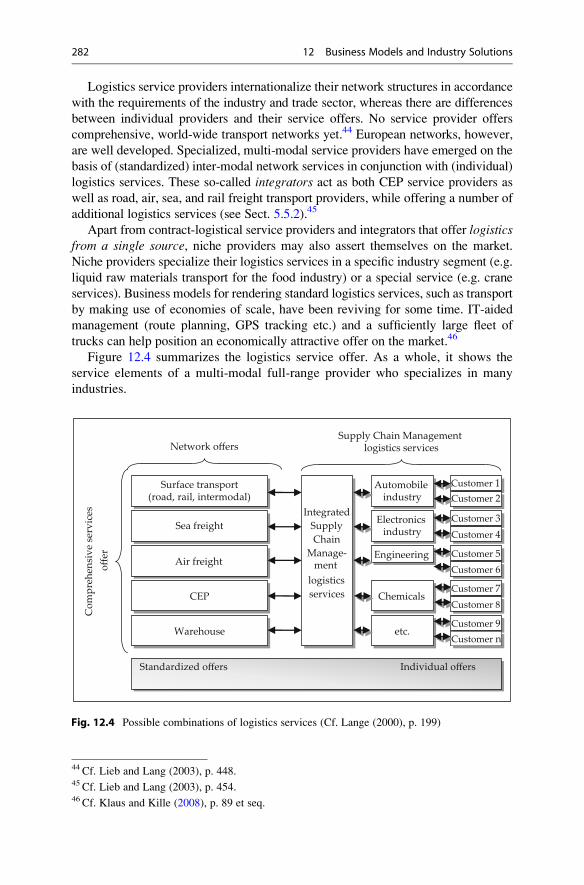
Logistics service providers internationalize their network structures in accordance
with the requirements of the industry and trade sector, whereas there are differences
between individual providers and their service offers. No service provider offers
comprehensive, world-wide transport networks yet.44 European networks, however,
are well developed. Specialized, multi-modal service providers have emerged on the
basis of (standardized) inter-modal network services in conjunction with (individual)
logistics services. These so-called integrators act as both CEP service providers as
well as road, air, sea, and rail freight transport providers, while offering a number of
additional logistics services (see Sect. 5.5.2).45
Apart from contract-logistical service providers and integrators that offer logisticsfrom a single source, niche providers may also assert themselves on the market.
Niche providers specialize their logistics services in a specific industry segment (e.g.
liquid raw materials transport for the food industry) or a special service (e.g. crane
services). Business models for rendering standard logistics services, such as transport
by making use of economies of scale, have been reviving for some time. IT-aided
management (route planning, GPS tracking etc.) and a sufficiently large fleet of
trucks can help position an economically attractive offer on the market.46
Figure 12.4 summarizes the logistics service offer. As a whole, it shows the
service elements of a multi-modal full-range provider who specializes in many
industries.
Surface transport(road, rail, intermodal)
Sea freight
Air freight
CEP
Warehouse
Integrated Supply Chain
Manage-ment
logistics services
Automobile industry
Electronics industry
Engineering
Chemicals
etc.
Customer 1Customer 2
Customer 3Customer 4
Customer 5Customer 6
Customer 7Customer 8
Customer 9Customer n
Standardized offers Individual offers
Network offersSupply Chain Management
logistics services
Com
preh
ensi
ve s
ervi
ces
offer
Fig. 12.4 Possible combinations of logistics services (Cf. Lange (2000), p. 199)
44 Cf. Lieb and Lang (2003), p. 448.45 Cf. Lieb and Lang (2003), p. 454.46 Cf. Klaus and Kille (2008), p. 89 et seq.
282 12 Business Models and Industry Solutions
Review Questions
1. What are logistical industry solutions?
2. Name business models for the distribution of consumer goods.
3. What are the logistical requirements for the mail-order business?
4. How does the Internet change business models and logistics systems?
5. What internationalization strategies and logistics strategies associated with
them do you know?
6. How are Europe-wide and global distribution systems designed?
7. What requirements do business models have to meet in industrial contract
logistics?
8. Which business models are supported by logistics service providers?
9. Explain the supply chain of the textile trade.
10. What are the logistical requirements of e-commerce?
Additional Literature
Buchholz, J., Clausen, U., & Vastag, A. (Ed.) (1998). Handbuch der Verkehrslogistik. Heidelberg:Springer.
David, A., & Stewart, R. (2010). International logistics: The management of international tradeoperations. Mason: Cengage Learning.
Frunzke, H., Boldt, O., & Garbisch, O. (2004). Management und Kundenbeziehungen in der
Logistikdienstleistungsbranche. In H.-C. Pfohl (Ed.), Netzkompetenz in Supply Chains.Grundlagen und Umsetzung. Wiesbaden: Gabler.
Giesa, F., & Kopfer, H. (2000). Management logistischer Dienstleistungen der Kontraktlogistik.
In: Logistik Management, Nr. 1, Nurnberg.Klaus, P., & Kille, C. (Ed.) (2008). Die TOP 100 der Logistik. Hamburg: DVV.
Mangan, J., Lalwani, C., Butcher, T., & Javadpour, R. (2011). Global logistics and supply chainmanagement. Chichester: Wiley.
Piontek, J. (1994). Internationale Logistik. Stuttgart: Kohlhammer.
Stroh, M. (2006). A practical guide to transportation and logistics (3rd ed.). Dumant: Logistics
Network.
Tripp, C. (2003). Chancen und Risiken mittelstandischer System-Stuckgutkooperationen in
Deutschland. Eine Untersuchung der Fraunhofer ATL Nurnberg im Auftrag der bayrischen
Hypo-Vereinsbank AG Munchen. Nurnberg: a study of the institute of Fraunhofer.
Tripp, C. (2004). Kooperationen und Kontraktlogistik. Nurnberg: Fraunhofer Institut fur
Integrierte Schaltungen.
Wolters, H. (1995). Modul- und Systembeschaffung in der Automobilindustrie – Gestaltung der
Kooperation zwischen europaischen Hersteller- und Zulieferunternehmen, Wiesbaden:
Deutscher Universitatsverlag.
Zimmermann, B. (2004). Kontraktlogistik als Zukunftsmarkt der Logistikdienstleistungswirtschaft?
Mittelstandskongruenz und Entwicklung eines mittelstandsgerechten Vertriebsmodells,
Nurnberg: University of Erlangen-Nurnberg.
Additional Literature 283

Outline Solutions to Case Studies 13
13.1 Solution to Case Study 6-1
aPallet shelving Live storage
shelvingBlock storage
Base area of Euro pallet 1.2 x 0.8 m = 0.96 m²
Requirement for 6,000 pallets
5,760 m² 5,760 m² 5,760 m²
Number of storage levels possible with 13 m clearance height given
1m+0.5 m clearance
13 m : 1.5 m = 8.6
= 8 levels = 8 levels = 1 level
Space requirements 5,760 m² : 8 levels
= 720 m²
5,760 m² : 8 levels
= 720 m²= 5,760 m²
Allowance for the level of storage space utilization
45 %
Additional space for structures, aisles etc. needs to be taken into consideration
= 1,600 m²
65 %
= 1,108 m²
80 %
= 7,200 m²
Alternative with the least space requirements
X
bDue to the broadrange of products and since items are stocked on and retrieved from opened pallets, pallet shelving is the most advisable option. This is also true since pallet shelving has only marginally higher space requirements than live storage shelving.
H. Gleissner and J.C. Femerling, Logistics, Springer Texts in Business and Economics,
DOI 10.1007/978-3-319-01769-3_13, # Springer International Publishing Switzerland 2013
285
13.2 Solution to Case Study 6-2
Time required per pallet: 311 m/2 m/s ¼ 155.5 s
Net time required for transport ¼ 155.5 s � 5,190 pallets ¼ 807,045 s
Utilization time per forklift truck per week ¼ 15 h � 5 days ¼ 75 Std.
Conveying capacity utilization ¼ 40 %
Net time available for pallet transport ¼ 75 h � 40 % ¼ 30 h
Net time ¼ 30 h ¼ 30 � 3,600 s ¼ 108,000 s
Number of forklift trucks: 807,045 s/108,000 s ¼ 7.5 i.e. approximately 8 fork-
lift trucks are required
13.3 Solution to Case Study 6-6
(a) 2 � 3 storages spaces when minimum stock quantity is reached + 2 � 6
storages spaces for replenishment ¼ 18
(b) 2 � average stock quantity ((3 + 9)/2 ¼ 6) ¼ 12
An average stock quantity is used for the calculation within a chaotic storage
strategy since it is assumed that not all articles of a warehouse are re-ordered at
the same time.
13.4 Solution to Case Study 8-2
In the case of hub-and spoke systems: 10 connections (with n ¼ 10 depots plus
1 hub)
Point-to-point: 9 + 8 + . . . + 2 + 1 ¼ 45 connections (with n ¼ 10 depots
without hub)
or: [10 * (9)]/2 ¼ 45 (with n ¼ 10 depots without hub).
Investments in a hub must amortize within the operating life and the structure
must be expandable, i.e. integration of additional depots must be possible.
13.5 Solution to Case Study 8-5
13.5.1 Selective Inventory
Decentralized storage of fast-moving goods at subsidiaries and customized delivery
with slow-moving goods from the central warehouse. This results in a reduction of
inventory within the distribution network while the number of regional warehouses
stays the same and transport costs may increase.
286 13 Outline Solutions to Case Studies
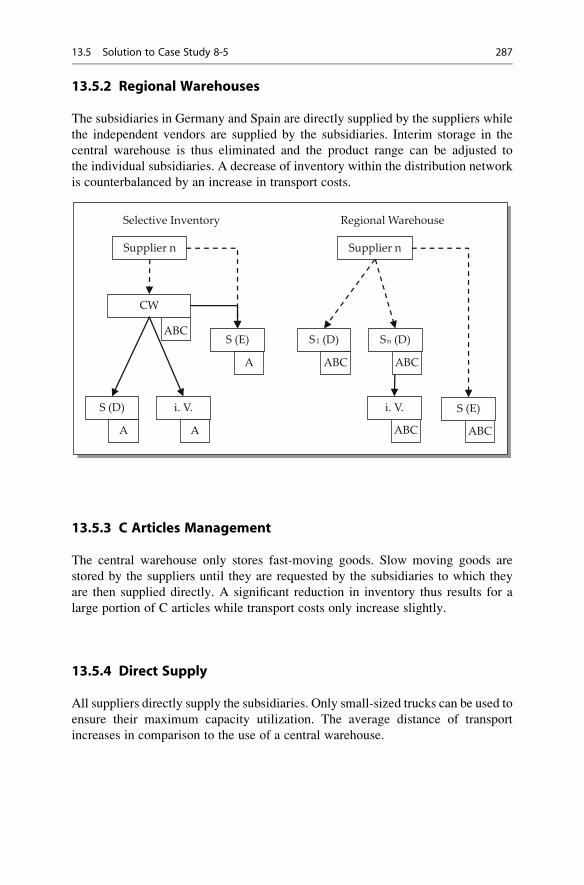
13.5.2 Regional Warehouses
The subsidiaries in Germany and Spain are directly supplied by the suppliers while
the independent vendors are supplied by the subsidiaries. Interim storage in the
central warehouse is thus eliminated and the product range can be adjusted to
the individual subsidiaries. A decrease of inventory within the distribution network
is counterbalanced by an increase in transport costs.
Supplier n
CW
A
S (D)
A
S (E)
i. V.
ABC
Supplier n
ABC
S1 (D)
S (E)
Sn (D)
i. V.
A
ABC
Selective Inventory Regional Warehouse
ABC ABC
13.5.3 C Articles Management
The central warehouse only stores fast-moving goods. Slow moving goods are
stored by the suppliers until they are requested by the subsidiaries to which they
are then supplied directly. A significant reduction in inventory thus results for a
large portion of C articles while transport costs only increase slightly.
13.5.4 Direct Supply
All suppliers directly supply the subsidiaries. Only small-sized trucks can be used to
ensure their maximum capacity utilization. The average distance of transport
increases in comparison to the use of a central warehouse.
13.5 Solution to Case Study 8-5 287
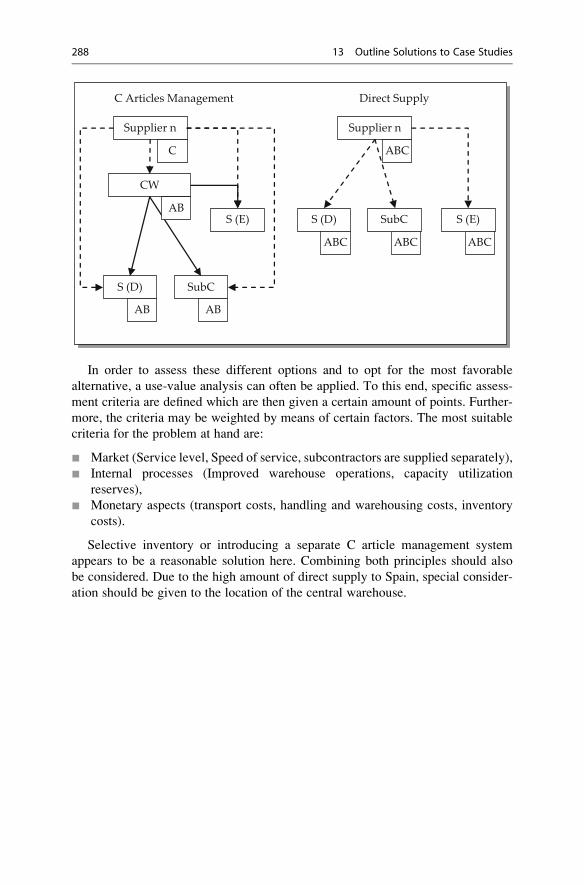
Supplier n
CW
S (D)
S (E)
SubC
AB
Supplier n
S (D) S (E)SubC
C ABC
C Articles Management Direct Supply
ABC ABC ABC
AB AB
In order to assess these different options and to opt for the most favorable
alternative, a use-value analysis can often be applied. To this end, specific assess-
ment criteria are defined which are then given a certain amount of points. Further-
more, the criteria may be weighted by means of certain factors. The most suitable
criteria for the problem at hand are:
¢ Market (Service level, Speed of service, subcontractors are supplied separately),
¢ Internal processes (Improved warehouse operations, capacity utilization
reserves),
¢ Monetary aspects (transport costs, handling and warehousing costs, inventory
costs).
Selective inventory or introducing a separate C article management system
appears to be a reasonable solution here. Combining both principles should also
be considered. Due to the high amount of direct supply to Spain, special consider-
ation should be given to the location of the central warehouse.
288 13 Outline Solutions to Case Studies
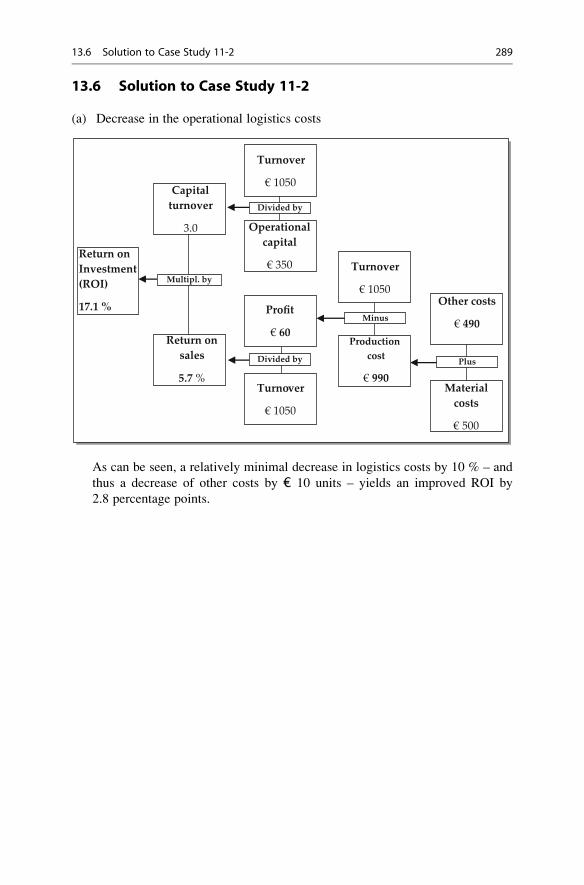
13.6 Solution to Case Study 11-2
(a) Decrease in the operational logistics costs
Other costs
€ 490
Material costs
€ 500
Return on Investment (ROI)
17.1 %
Plus
Production cost
€ 990
Turnover
€ 1050
Minus
Operational capital
€ 350
Turnover
€ 1050
Divided by
Capital turnover
3.0
Return on sales
5.7 %
Multipl. by
Profit
€ 60
Turnover
€ 1050
Divided by
As can be seen, a relatively minimal decrease in logistics costs by 10 % – and
thus a decrease of other costs by € 10 units – yields an improved ROI by
2.8 percentage points.
13.6 Solution to Case Study 11-2 289
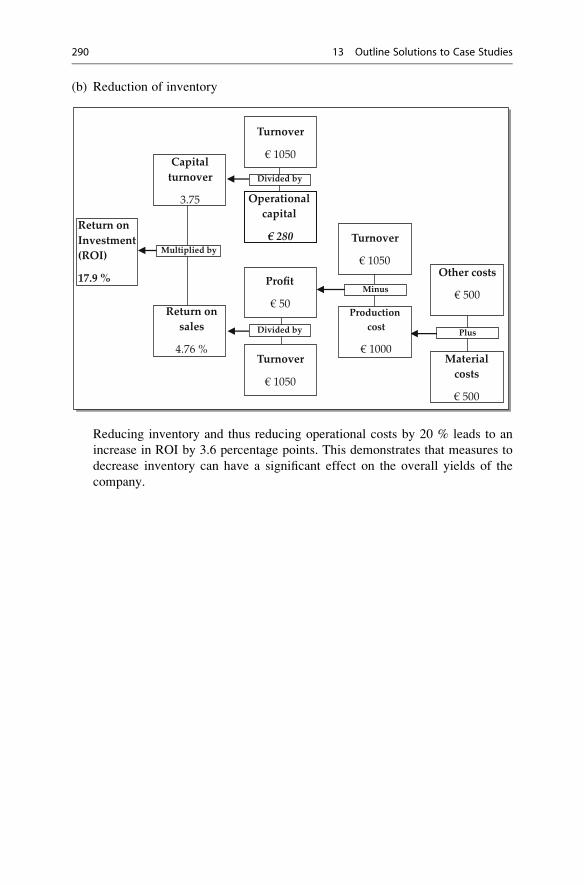
(b) Reduction of inventory
Other costs
€ 500
Material costs
€ 500
Return on Investment (ROI)
17.9 %
Plus
Production cost
€ 1000
Turnover
€ 1050
Minus
Operational capital
€ 280
Turnover
€ 1050
Divided by
Capital turnover
3.75
Return on sales
4.76 %
Multiplied by
Profit
€ 50
Turnover
€ 1050
Divided by
Reducing inventory and thus reducing operational costs by 20 % leads to an
increase in ROI by 3.6 percentage points. This demonstrates that measures to
decrease inventory can have a significant effect on the overall yields of the
company.
290 13 Outline Solutions to Case Studies
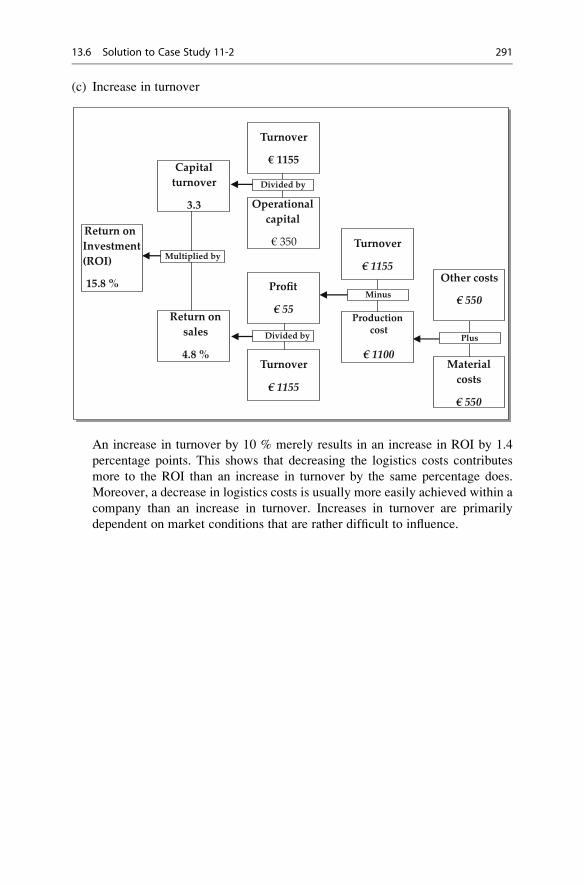
(c) Increase in turnover
Other costs
€ 550
Material costs
€ 550
Return on Investment (ROI)
15.8 %
Plus
Production cost
€ 1100
Turnover
€ 1155
Minus
Operational capital
€ 350
Turnover
€ 1155
Divided by
Capital turnover
3.3
Return on sales
4.8 %
Multiplied by
Profit
€ 55
Turnover
€ 1155
Divided by
An increase in turnover by 10 % merely results in an increase in ROI by 1.4
percentage points. This shows that decreasing the logistics costs contributes
more to the ROI than an increase in turnover by the same percentage does.
Moreover, a decrease in logistics costs is usually more easily achieved within a
company than an increase in turnover. Increases in turnover are primarily
dependent on market conditions that are rather difficult to influence.
13.6 Solution to Case Study 11-2 291
Erratum to: Logistics Systems
Erratum to:
Chapter 3 in: H. Gleissner and J.C. Femerling, Logistics, Springer Texts in Businessand Economics, DOI 10.1007/978-3-319-01769-3_3,
# Springer International Publishing Switzerland 2013
Chapter 3 unfortunately contains the German versions of Figures 3.2 and 3.3.The correct figures are given below.
The online version of the original chapter can be found under
DOI 10.1007/978-3-319-01769-3_3
H. Gleissner and J.C. Femerling, Logistics, Springer Texts in Business and Economics,
DOI 10.1007/978-3-319-01769-3_14, # Springer International Publishing Switzerland 2013
E1
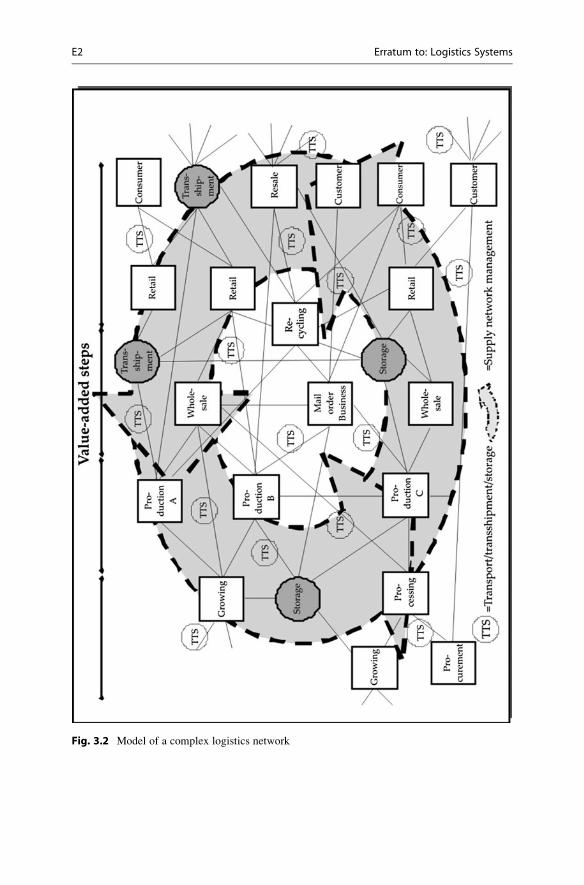
Fig. 3.2 Model of a complex logistics network
E2 Erratum to: Logistics Systems
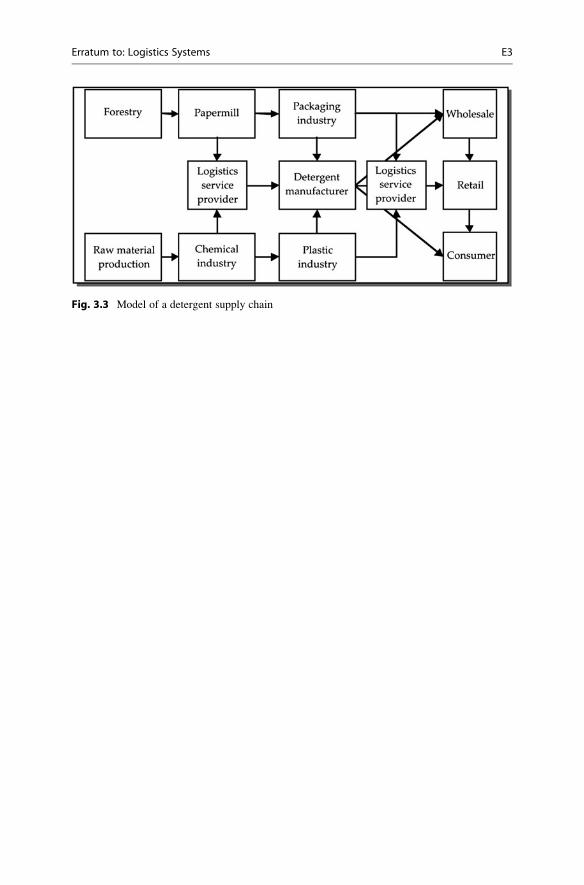
Fig. 3.3 Model of a detergent supply chain
Erratum to: Logistics Systems E3
Bibliography
Aberle, G. (2009). Transportwirtschaft: Einzelwirtschaftliche und gesamtwirtschaftlicheGrundlagen, Munchen/Wien.
Aden, D. (2001). Neue Chancen fur Logistik-Dienstleister durch die Globalisierung.
In H. Baumgarten (Ed.). Logistik im E-Zeitalter. Die Welt der globalen Logistiknetzwerke(S. 89–98). Frankfurt.
Alicke, K. (2005). Planung und Betrieb von Logistiknetzwerken: UnternehmensubergreifendesSupply Chain Management. Berlin.
Arminger, G. (2004). Absatz- und Bestellprognosen im CPFR-Prozess fur den Handel. In SupplyChain Management (S. 45–52), o. Jg., Nr. 3.
Arnold, D., Kuhn, A., Isermann, H., & Tempelmeier, H. (2008). Handbuch Logistik. Heidelberg:Springer.
Auffermann, C. (2007). Sinnvoller Schritt: Die Logistik fur Vollsortimenter und Discounter
unterscheidet sich grundsatzlich. In Log., o. Jg., Nr. 2, S. 24–27.
Baumgarten, H. (Ed.). (2001). Logistik im E-Zeitalter. Die Welt der globalen Logistiknetzwerke,Frankfurt.
Baumgarten, H., & Thoms, J. (2002). Trends und Strategien in der Logistik. Supply Chains imWandel, Berlin.
Baumgarten, H., & Walter, S. (2000). Trends und Strategien in der Logistik. Berlin.Baumgarten, H., et al. (Ed.). (2003). Springer Experten System Logistik-Management, Band 1.
Berlin.
Bea, F., & Haas, J. (2009). Strategisches Management (5. Edition). Stuttgart.Becker, H. P. (2008). Investition und Finanzierung: Grundlagen der betrieblichen
Finanzwirtschaft (2. Updated Edition). Wiesbaden.
Becker, T. (2006). Quo Vadis Zulieferpark? Neue Zusammenarbeitsmodelle in der automobilienZulieferkette. Dissertation, Universitat Kassel, Hamburg.
Beckmann, K. (2007). Logistik. Rinteln.Bender, W. F. (1997). In J. Bloech, & G. B. Ihde, (Ed.). Vahlens Großes Logistik Lexikon
(S. 295–297). Munchen.
Berg, C. C. (2003). Marketingkonzept fur Guterverkehrszentren. In InternationalesVerkehrswesen 55 (S. 417–418). Jg., Heft 9.
Berliner Flughafen. (2011). Berlin Brandenburg Airport Willy Brandt – Imagebroschure. Berlin.Berndt, T. (2001). Eisenbahnguterverkehr. Stuttgart u.a.Berning, R. (2002). Prozessmanagement und Logistik: Gestaltung der Wertschopfung. Berlin.Bjelicic, B. (2005). Unterlagen zur Vorlesung Verkehrsbetriebslehre I: Landverkehr und
Schifffahrt. Universitat Mannheim.
Bjelicic, B., & Kostka, G. (2000). Moderne Finanzierungskonzepte fur Logistikzentren.
In R. Hossner (Ed.). Jahrbuch der Logistik 2001 (S. 164–167). Monchengladbach.
Blom, F., & Harlander, N. A. (2003). Logistik-Management: Der Aufbau ganzheitlicherLogistikketten in Theorie und Praxis. Renningen.
H. Gleissner and J.C. Femerling, Logistics, Springer Texts in Business and Economics,
DOI 10.1007/978-3-319-01769-3, # Springer International Publishing Switzerland 2013
293
Bode, W., & Preuß, R. (2004). Intralogistik in der Praxis: Komplettanbieter der Intralogistik.Suhl.
Boeing (Ed.). (2006). Product Review 2007 – Commercial Airplanes,- Freighters. Chicago.B€orner-Kleindienst, M. (2006). Logistikimmobilien: Kategorien, Determinanten und
Marktteilnehmer. In B. Falk, & T. Momme (Ed.). Handbuch Gewerbe- und Spezialimmobilien(S. 447–472). K€oln.
Boysen, N. (2008). Uber die Synchronisierung von Guterstr€omen in der Umschlaglogistik.
In Zeitschrift fur Betriebswirtschaft 78 (S. 1285–1315). Jg. H. 12.
Boysen, N., & Tiedemann, S.-K. (2010). Design und Betrieb von Cross Docks: Planungsprobleme
fur einen effizienten Warenumschlag in lagerlosen Umschlagzentren. In WiSt, o. Jg. Heft 2,
S. 54–60.
Brandes, D. (2003). Was weg ist, muss hin: Im Discount hat Einfachheit Vorrang. In H. Merkel, &
B. Bjelicic (Ed.). Logistik und Verkehrswirtschaft im Wandel: UnternehmensubergreifendeVersorgungsnetzwerke verandern die Wirtschaft. Festschrift fur G€osta B. Ihde (S. 199–204),
Munchen.
Brecht, Gratkowski, v., Kuhlmann, & Sp€orker (1982). Gewinnung und Transport von Erdol undErdgas, Verarbeitung von Erdol (Raffinerietechnik). Munchen/Wien.
Bretzke, W.-R. (1999). Industrie- versus Handelslogistik: Der Kampf um die Systemfuhrerschaft.
In Logistik Management 1 (S. 81–95). Jg. Nr. 2.
Bretzke, W.-R. (2007). Bindung an Logistikdienstleister – Chance oder Gefahr durch
Abhangigkeit. In W. St€olzle, J. Weber, E. Hofmann, & C. M. Wallenburg (Ed.). HandbuchKontraktlogistik. Management komplexer Logistikdienstleistungen (S. 167–179). Weinheim.
Brinkmann, B. (2005). Seehafen – Planung und Entwurf. Berlin.Buchholz, J., Clausen, U., & Vastag, A. (Ed.). (1998).Handbuch der Verkehrslogistik.Heidelberg.BMVBS Bundesministerium fur Verkehr-, Bau- und Stadtentwicklung. (Ed.). (2009). Verkehr in
Zahlen 2009/2010. Hamburg.
BMVBS Bundesministerium fur Verkehr-, Bau- und Stadtentwicklung. (Ed.). (2011). Verkehr inZahlen 2010/201. Hamburg.
Caninenberg, W. (2004). Mit Software Software testen. In Software in der Logistik (S. 34–38).
Munchen.
Chopra, S., & Meindl, P. (2009). Supply Chain Management. Upper Saddle River.Christopher, M., Lowson, B., & Peck, H. (2009). Fashion logistics and quick response. In von
J. Fernie, & L. Sparks (Ed.). Logistics and retail management (3. Edition). London/Philadelphia: Kogan Page.
Clausen, U., Hein, A.-P., & Deymann, S. (2007). Potenziale globaler Direktbelieferung fur Textil-
logistikketten aus China. In G. Aberle (Ed.). Internationales Verkehrswesen, 59 (S. 25–29). Jg.,Nr. 1+2.
Corsten, H. (Ed.). (1994). Handbuch Produktionsmanagement. Wiesbaden.
Corsten, D., & G€ossinger, R. (2007). Einfuhrung in das Supply Chain Management. Munchen.
Dehler, M. (2001). Entwicklungsstand der Logistik. Messung – Determinanten –Erfolgswirkungen. Wiesbaden.
Delfmann, W. (1998). Hub-and-Spoke-Systeme. In P. Klaus, &W. Krieger (Ed.).Gabler –LexikonLogistik (S. 177–178). Wiesbaden.
Delfmann, W., & Reihlen, M. (Ed.). (2003). Controlling von Logistikprozessen. Stuttgart.Deutsche Bahn AG. (Ed.). (2008). Geschaftsbericht 2008. Berlin: Deutsche Bahn AG.
Deutsche Binnenreederei AG. (Ed.). (2007). Transportlogistik Innovativ Europaweit (Geschafts-broschure). Berlin.
Deutsche Post, AG. (Ed.). (2007). Geschaftsbericht 2006. Bonn.Deutscher Speditions- und Logistikverband (DSLV). (Ed.). (2010). Zahlen, Daten, Fakten aus
Spedition und Logistik 2010. Bonn 2011.
Deutsches Institut fur Normung (DIN) – Normen in ihrer jeweils aktuellen Fassung.
294 Bibliography
Donier Consulting GmbH. (2006). Erfolgsfaktoren und Bewertungsmoglichkeiten von PPP-Projekten fur Verkehrsinfrastruktur: Eine internationale und verkehrstragerubergreifendeAnalyse. Berlin.
Eichler, B. (2003). Beschaffungsmarketing und -logistik. Berlin.Eicke, H. v., & Femerling, J. C. (1991). Modular Sourcing: Ein Konzept zur Neugestaltung der
Beschaffungslogistik. Munchen.
Eisenhart-Rothe, F. von, & Jutte, S. (2003). Innovative Logistikfinanzierung rund um die supply
chain. In e. V. Bundesvereinigung Logistik (BVL) (Ed.). Finanzierung – eine neue Dimensionder Logistik (S. 151–170). Berlin.
Elsenbach, I. M. (2006). Tracking und Tracing – IT – Instrumente zum wertorientierten supply
chain management. In: C. Mauch, & H. Wildemann (Ed.). Handbuch IT-management (1. Edi-tion) (S. 437–463). Munchen.
European Logistics Association (ELA). (Ed.). (2005). Terminology in logistics – Terms anddefinitions. Brussel: European Logistics Association.
FedEx Corporation. (Ed.). (2006). 2006 Annual report. Memphis.
Feinen, K. (2003). Leasing von Logistik-Immobilien. In Bundesvereinigung Logistik (Ed.).
Finanzierung – eine neue Dimension der Logistik (S. 187–199). Berlin.Feldkamp, W. (2001). Logistik goes “glocal“ – Entwicklung und Trends aus der Sicht der
DaimlerChrysler AG, Logistik PKW. In H.-C. Pfohl (Ed.). Jahrhundert der Logistik: CustomerRelated-Glocal-E-Based (S. 167–184). Berlin.
Femerling, J. C. (2003). B2C- und B2B-Logistik als Erfolgsfaktor der New Economy.
In H. Merkel, & B. Bjelicic (Ed.). Logistik und Verkehrswirtschaft im Wandel: Unternehmen-subergreifende Versorgungsnetzwerke verandern die Wirtschaft. Festschrift fur G€osta B. Ihde(S. 199–204), Munchen
Fiege, H., Nowak, H., &Mayer, C. (2007). Kontraktlogistik in der Hightech-Industrie. InW. St€olzle,J. Weber, E. Hofmann, & C. M. Wallenburg (Ed.). Handbuch Kontraktlogistik. Managementkomplexer Logistikdienstleistungen (S. 657–677). Weinheim.
Fischer, W., & Dittrich, L. (2003).Materialfluss und Logistik. Optimierungspotenziale in Transportund Lagerwesen. Berlin.
Fortmann, K.-M., & Kallweit, A. (2007). Logistik. (2. Edition). Stuttgart.Franke, W., & Dangelmaier, W. (Ed.). (2006). RFID – Leitfaden fur die Logistik. Wiesbaden.
Freichel, S. L. K. (2002). Distributionsmanagement – Gestaltung internationaler Logistiksysteme.
In W. St€olzle, & K. Gareis (Ed.). Integrative Management- und Logistikkonzepte (S. 263–287).Wiesbaden.
Frese, E. (1987). Grundlagen der Organisation. Die Organisationsstruktur der Unternehmung.Wiesbaden.
Frese, E. (2005). Grundlagen der Organisation. Entscheidungsorientiertes Konzept der Organi-sationsgestaltung (9. Edition). Wiesbaden.
Friemut, U., Carl, H., Oster, M., & Seterhenn, J. (1997). Qualitatsregelkreise – Stellschraube fur
Dienstleister. In Logistik heute, 1997 (S. 96–100). Nr. 10.
Frunzke, H., Boldt, O., & Garbisch, O. (2004). Management und Kundenbeziehungen in der
Logistikdienstleistungsbranche. In H.-C. Pfohl Netzkompetenz in Supply Chains. Grundlagenund Umsetzung (S. 265–284). Wiesbaden.
Gabele, E., Dannenberg, J., & Kroll, M. (2001). Immobilien-Leasing: Vertragsformen, Vor- undNachteile, steuerliche Analyse (4. Updated Edition). Wiesbaden.
Giesa, F., & Hagen, N. (2003). Logistiknetzwerke in der global verteilten Automobilproduktion.
In H. Baumgarten, et al. (Ed.). Springer Experten System Logistik-Management, Band 1(S. 1–17). Berlin. Abschnitt 4/04/04.
Giesa, F., & Kopfer, H. (2000). Management logistischer Dienstleistungen der Kontraktlogistik.
In Logistik management (S. 43–53). Nr. 1.Gladen,W. (2011).Performancemeasurement – Controlling mit Kennzahlen (5. Edition).Wiesbaden.
Gleißner, H. (2000). Logistikkooperationen zwischen Industrie und Handel. G€ottingen.
Bibliography 295

Gleißner, H. (2003). Supply chain controlling fur die europaweite Endkundendistribution von
Großgutern und M€obeln im Versandhandel. In W. St€olzle, & A. Otto (Ed.). Supply chaincontrolling in Theorie und Praxis: Aktuelle Konzepte und Unternehmensbeispiele(S. 197–214). Wiesbaden.
Gomm, M. (2008). Supply Chain Finanzierung: Optimierung der Finanzflusse in Wertschop-fungsketten. Berlin.
G€opfert, I. (2005). Logistik Fuhrungskonzeption. Munchen.
Greschner, J. (1996). Lernfahigkeit von Unternehmen. In Schriften zur Unternehmensplanung,Band 38. Frankfurt a. M.
Grochla. (1983). Erfolgsorientierte Materialwirtschaft durch Kennzahlen. Baden-Baden.Grunow, M. (2001). Management von Produktions- und Distributionsnetzwerken in der
chemischen Industrie. In H.-J. Sebastian, & T. Grunert (Ed.). Logistik Management, SupplyChain Management und E-Business (S. 323–335). Stuttgart.
GS1 Germany GmbH. (Ed.). (o.J.) Positionspapier zur Nutzung von EANCOM® und GS1XML furdie elektronische Kommunikation. K€oln.
GS1 Germany GmbH. (Ed.). (2003). Management-Informationsbroschure RFID. K€oln.GS1 Germany GmbH. (Ed.). (2006a). EANCOM® – Der Motor fur EDI. K€oln.GS1 Germany GmbH. (Ed.). (2006b). EAN Identsysteme in der Anwendung. K€oln.GS1 Germany GmbH. (Ed.). (2009a). Die NVE und das GS1-Transportetikett in der Anwendung.
K€oln.GS1 Germany GmbH. (Ed.). (2009b). EDI/eCommerce Einfuhrung in den elektronischen
Datenaustausch. K€oln.Gudehus, T. (2010). Logistik: Grundlagen, Strategien, Anwendungen (4. Edition). Berlin.
Gunther, H. O., & Kim, K. H. (Ed.). (2005). Container terminals and automated transport systems:Logistics control issues and quantitative decision support. Berlin/Heidelberg: Springer.
Hahn, D., & Kaufmann, L. (2002). Handbuch Industrielles Beschaffungsmanagement (2. Edition).Wiesbaden.
Hardt, A., & Karsch, C. (2007). Kontraktlogistik in der Chemieindustrie. In W. St€olzle, J. Weber,
E. Hofmann, & C. M. Wallenburg (Ed.). Handbuch Kontraktlogistik. Management komplexerLogistikdienstleistungen (S. 639–656). Weinheim.
Heiserich, O.-E., Helbig, K., & Ullmann, W. (2011). Logistik: Eine paxisorientierte Einfuhrung(4. vollstandig uberarbeitete und erweiterte Edition). Wiesbaden.
Hertel, J., Zentes, J., & Schramm-Klein, H. (2005). Supply-Chain-Management undWarenwirtsch-aftssysteme im Handel. Berlin/Heidelberg/New York.
Herter, M. (2000). Strategisches Management der Logistik: Konzeptioneller Bezugsrahmen undempirische Analyse in deutschen und amerikanischen Industrieunternehmen. Berlin.
Hofmann, E. (2005). Supply chain finance: Some conceptual insights. In: R. Lasch, & C. G. Janker
(Ed.). Logistik-management – Innovative Logistikkonzepte (S. 203–214). Wiesbaden.
Hofmann, E., & Elbert, R. (2004). Collaboratives Cash flowManagement. Financial Supply Chain
Management als Herausforderung der Netzkompetenz. In H.-C. Pfohl (Ed.). Netzkompetenz inSupply Chains – Grundlagen und Umsetzung (S. 94–117). Wiesbaden.
Horvath & Partner. (Ed.). (2007). Balanced Scorecard umsetzen. Stuttgart.Horvath & Partners. (2009). Der Weg zu einem wirkungsvollen Controllingsystem (7. Edition).
Munchen.
Ihde, G. B. (2001). Transport, Verkehr, Logistik: Gesamtwirtschaftliche Aspekte und einzelwirtsch-aftliche Handhabung (3. Edition). Munchen.
Ihme, J. (2006). Logistik im Fahrzeugbau. Wien/K€oln.Isermann, H. (1994). Logistik. Beschaffung, Produktion, Distribution. Munchen.
Jahns, C. (2003). Balanced Scorecard – Arbeitsbuch. St. Gallen.Jansen, R. (1989). Alle Forderungen Berucksichtigen: Kostenerfassung und Leistungsverrechnung
in der Verpackungsplanung. In Beschaffung aktuell (S. 78–81).Janz, O. (2003). Integriertes Transportnetzmanagement: Angebots- und nachfrageorientierte
Planung und Steuerung komplexer Transportnetze. K€oln.
296 Bibliography

Jirasek, J. (1977). Das Unternehmen – ein kybernetisches System: Eine Einfuhrung fur dieWirtschaftspraxis. Berlin.
Junemann, R. (1989). Materialfluß und Logistik: Systemtechnische Grundlagen mitPraxisbeispielen. Berlin.
Junemann, R., & Schmidt, T. (1999).Materialflusssysteme: Systemtechnische Grundlagen (2. Edi-tion). Berlin.
Kaplan, R., & Norton, D. (1997). Balanced Scorecard – Strategien erfolgreich umsetzen. Stuttgart.Karrer, M., & Petzold, D. (2004). Performance Management bei Logistikdienstleistern- Steuerung
von Logistikprozessen mit der Balanced Scorecard. In C. Schneider (Ed.). Controlling furLogistikdienstleister, Konzepte, Instrumente, Anwendungsbeispiele, trends (S. 91–106).Hamburg.
Keller, A. (2011). Breitbandkabel und Zugangsnetze: Technische Grundlagen und Standards(2. v€ollig neu bearbeitete Edition). Heidelberg.
Kernler, H. (2007). Logistiknetze: Mit supply chain management erfolgreich kooperieren.Heidelberg.
Kiesel, J. (1997). Produktions-controlling. In A.-W. Scheer (Ed.). Rechnungswesen und EDV.Heidelberg.
Klaas, T. (2002). Logistik-organisation. Ein konfigurationstheoretischer Ansatz zur logistikor-ientierten Organisationsgestaltung. Wiesbaden.
Klaas, T. (2005). Jenseits des Organigramms: Grundsatzliche Uberlegungen zur ganzheitlichen
Gestaltung der supply chain. In H. Kopfer, & C. Bierwirth (Ed.). Logistik management, 7(S. 8–20). Jg., Nr. 3.
Klauenberg, J. (2009). Modellierung und Typisierung von Distributionszentren in Seehafen.Dissertation, Universitat Rostock, Hamburg.
Klaus, P. (2002). Die Dritte Bedeutung der Logistik – Beitrage zur Evolution LogistischenDenkens. Hamburg.
Klaus, P. (2007).Markt fur Kontraktlogistik – Volumen und Entwicklungen in Europa. InW. St€olzle,J. Weber, E. Hofmann, & C. M. Wallenburg (Ed.). Handbuch Kontraktlogistik. Managementkomplexer Logistikdienstleistungen (S. 89–112). Weinheim.
Klaus, P., & Kille, C. (2008). Die Top 100 der Logistik (5. Edition). Hamburg.
Klepzig, J. (2010). Working-Capitel und Cash Flow: Finanzstrome durch Prozessmanagementoptimieren (2. Edition). Wiesbaden.
Kloth, H. (1999). Neue Konzepte der Distributionslogistik von Handelsunternehmen. Dissertation,Duisburg.
Koch, B. (2006). Entwicklungsplanung fur Flughafengesellschaften: Entscheidungsunterstutzungdurch die integrierte Marktsprognose- und Finanzmodellierung. K€oln.
Koepke, R., & Frahne, K. (2010). Der Vermietungsmarkt fur Lager-/Logistikflachen,Logistikimmobilien-Report JonesLangLaSalle. Deutschland.
Kopfer, H., & Bierwirth, C. (Ed.). (1999). Logistik management: Intelligente I + K Technologien.Berlin/Heidelberg.
Korf, W. (Ed.). (2005a). Lorenz – Leitfaden fur Spediteure und Logistiker in Ausbildung undBeruf, Bd. 1 (20. Edition). Hamburg.
Korf, W. (Ed.). (2005b). Lorenz 2 – Leitfaden fur Spediteure und Logistiker in Ausbildung undBeruf, Bd. 2 (16. Edition). Hamburg.
Kotzab, H. (1997). Neue Konzepte der Distributionslogistik von Handelsunternehmen. Wien.
Kuhn, A., & Hellingrath, B. (2002). Supply chain management- Optimierte Zusammenarbeit in derWertschopfungskette (2. Edition). Berlin.
Kummer, S. (2010). Einfuhrung in die Verkehrswirtschaft. Wien.
Kupper, H.-U. (2008). Controlling – Konzeption, Aufgaben und Instrumente (5. Edition). Stuttgart.Lammers, S., & Neubauer, M. (2005). Integrale Logistik-Konzepte in Europa am Beispiel der Firma
Philips Consumer Electronics GmbH. In C. Neiberger, & H. Bertram (Ed.). Waren um die Weltbewegen: Strategien und Standorte imManagement globalerWarenketten. (S. 47–54).Mannheim.
Bibliography 297

Lange, U. (2000). Supply chain management und Netzwerkmanagement aus der strategischenSicht des Logistikdienstleisters am Beispiel eines multimodalen Vollsortimenters. Dusseldorf.
Lasch, R., & Lemke, A. (2002). Defizite der Logistiksysteme von E-Commerce-Anbietern –Losungsansatze fur ein besseres Logistikmanagement, Ergebnisse eine Studie unter online-Shops, Schlussfolgerungen und Empfehlungen. Dresden.
Laurent, M. (1996). Vertikale Kooperationen zwischen Industrie und Handel. Frankfurt.Lay, G. (2007). Betreibermodelle fur Investitionsguter: Verbreitung, Chancen, Auswirkungen und
Erfolgsfaktoren. Karlsruhe.Lieb, T. (1997). Seehafenhinterlandverkehr. In J. Bloech, & G. B. Ihde (Ed.). Vahlens Großes
Logistik Lexikon (S. 931–932). Munchen.
Lieb, T. C., & Lange, U. (2003). Strategien und Organisationsstrukturen global integrierter
Logistikdienstleister. In H. Merkel, & B. Bjelicic (Ed.). Logistik und Verkehrswirtschaft imWandel: Unternehmensubergreifende Versorgungsnetzwerke verandern die Wirtschaft. Fest-schrift fur G€osta B. Ihde (S. 446–459), Munchen.
Lufthansa Cargo AG. (Ed.). (2005). Cargo handling manual. Frankfurt.Mahler, K. (2008). Logistikimmobilien: Optimierung des Investment- und Logistikerfolges. K€oln.Mangold, K. (2001). Finanzierungs- und Leasingaktivitaten industrienaher Dienstleister.
In R.-E. Breuer (Ed.). Handbuch Finanzierung (3. Edition) (S. 227–248). Wiesbaden.
Marbacher, A. (2001). Demand and supply chain management. Bern et al. 2001
Maurer, P. (2003) Luftverkehrsmanagement: Basiswissen (3. uberarb. und erweiterte Edition).
Munchen/Wien.
Meeder, S. (2003). Flughafenwettbewerb und Flughafenstrategien. In H. Merkel, & B. Bjelicic
(Ed.). Logistik und Verkehrswirtschaft im Wandel: Unternehmensubergreifende Versorgungs-netzwerke verandern die Wirtschaft, Festschrift fur G€osta B. Ihde (S. 487–505), Munchen.
Mensen, H. (2007). Planung, Anlage und Betrieb von Flughafen. Berlin.Merkel, H., & Bjelicic, B. (Ed.). (2003). Logistik und Verkehrswirtschaft im Wandel: Unterneh-
mensubergreifende Versorgungsnetzwerke verandern die Wirtschaft. Festschrift fur G€osta B.Ihde, Munchen.
Merkel, H., & Heymans, J. (2003). Geschaftsmodelle im stationaren Handel. In H. Merkel, &
B. Bjelicic (Ed.). Logistik und Verkehrswirtschaft im Wandel: UnternehmensubergreifendeVersorgungsnetzwerke verandern die Wirtschaft. Festschrift fur Gosta B (S. 161–183).
Munchen: Ihde
Metro MGL GmbH. (2002). (Ed.). Ganzheitliche Handelslogistik-Innovation in der Supply Chaindurch einen “Internal 4 PL”. Dusseldorf.
Meyer, C. (2011). Betriebswirtschaftliche Kennzahlen und Kennzahlensysteme (6. Edition).
Munchen.
Ministerium fur Wirtschaft – NRW Landesinitiative Logistik. (Ed.). (2006). Mittelstand undEnergie des Landes NRW. Dusseldorf.
Morgenstern, O. (1955). Note of the formulation of the theory of logistics. In Naval ResearchLogistics Quarterly, Vol. 2, Issue 3. Princeton.
Muller, A. (2005). Strategisches Management mit der Balanced Scorecard. Stuttgart et al.Muller, J. & Ermel, R. (2007). Tendermanagement fur die Kontraktlogistik. In W. St€olzle,
J. Weber, E. Hofmann, & C. M. Wallenburg (Ed.). Handbuch Kontraktlogistik. Managementkomplexer Logistikdienstleistungen (S. 293–308). Weinheim.
Muller-Daupert, B., Gomm, F., Becker, J., & Zwissler, T. (2009). Logistik Outsorcing.Ausschreibung – Vergabe – Controlling (2. Edition). Munchen.
Muncke, G., Dziomba, M., & Walter, M. (2008). Standort- und Marktanalysen in der Immobilien-
wirtschaft. InK.-W. Schulte,&S. Bone-WinkelHandbuch Immobilien-Projektentwicklung. K€oln.Neher, A. (2005). Internationale Logistikstrategien von Industrieunternehmen im Wandel.
In C. Neiberger, & H. Bertram (Ed.). Waren um die Welt bewegen: Strategien und Standorteim Management globaler Warenketten (S. 33–45). Mannheim.
298 Bibliography

Nehm, A., & Schryver, C. (2007). Alternativen der Logistikimmobilien-Bereitstellung.
In B. Bohlmann, & T. Krupp Strategisches Management fur Logistikdienstleister: Grundlagenund Praxisberichte (S. 230–254). Hamburg.
Nehm, A., Veres-Homm, U., & Kille, C. (2009). Logistikimmobilien in Deutschland: Markt undStandorte, Fraunhofer-Arbeitsgruppe fur Technologien der Logistik-Dienstleistungswirtschaft(ATL). Nurnberg.
Nothardt, F., Schmitter, F., & Trede, T. (2007). Logistik in der Bekleidungsindustrie – quo vadis?
In W. St€olzle, J. Weber, E. Hofmann, & C. M. Wallenburg (Ed.). Handbuch Kontraktlogistik.Management komplexer Logistikdienstleistungen. (S. 679–700). Weinheim.
Nuhn, H. (2005). Internationalisierung von Seehafen Vom Cityport und Gateway zum Interface
globaler Transportketten. In C. Neiberger, & H. Bertram (Ed.). Waren um die Welt bewegen:Strategien und Standorte im Management globaler Warenketten (S. 109–124). Mannheim.
Nuhn, H., & Hesse, M. (2006). Verkehrsgeographie. Paderborn.Ockens, K. (2003). Investieren in Logistik-Immobilien. In Bundesvereinigung Logistik (Ed.).
Finanzierung – eine neue Dimension der Logistik (S. 201–215). Berlin.Osterreichische Wasserstraßen-Gesellschaft mbH. (Ed.). (2007). Manual of Danube navigation,
Wien.
Peridon, L., Steiner, M., & Rathgeber, A. W. (2009). Finanzwirtschaft der Unternehmung(14. Edition). Wiesbaden.
Peters, S. (2003). Dokumenten- und Informationslogistik fur Finanzdienstleister – Rhenus Office
Systems realisiert ganzheitliche L€osungen aus einer Hand. In Bundesvereinigung Logistik
(Ed.). Banklogistik – L€osungsansatze fur interne und externe Dienstleister (S. 105–119).
Berlin.
Pfaff, D., Skiera, B., &Weiss, J. (2004). Financial supply chain management. Bonn: Galileo Press.Pfohl, H.-C. (1972). Marketing-Logistik. Mainz: Distribution-Verlag.
Pfohl, H.-C. (1990). Logistiksysteme. Berlin/Heidelberg/New York.
Pfohl, H.-C. (2000). Logistiksysteme: betriebswirtschaftliche Grundlagen (6. neubearbeite und
Updated Edition). Berlin.
Pfohl, H.-C. (2004a). Logistikmanagement (2. Edition). Berlin.Pfohl, H.-C. (2004b). Netzkompetenz in Supply Chains. Grundlagen und Umsetzung. Wiesbaden.
Pfohl, H.-C. (2010). Logistiksysteme: Betriebswirtschaftliche Grundlagen (8. Edition). Berlin.
Pfohl, H.-C., Hofmann, E., & Elbert, R. (2003). Bedeutung der finanziellen Supply Chain in der
unternehmerischen Praxis. In Bundesvereinigung Logistik (BVL) e. V. (Ed.). Finanzierung –eine neue Dimension der Logistik (S. 65–105). Berlin.
Pintsch, S. (2004). Gesunde Logistikl€osungen fur den Healthcare-Markt. In H. Baumgarten,
I.-L. Darkow, & H. Zadek (Ed.). Supply Chain Steuerung und Services: Logistik-Dienstleistermanagen globale Netzwerke – Best Practices (S. 251–259). Berlin.
Piontek, J. (1994). Internationale Logistik. Stuttgart.Pompl, W., Schuckert, M., & M€oller, C. (2006). Luftverkehr: Eine okonomische und politische
Einfuhrung. Berlin.Porter, M. E. (1985). Competitive advantage. New York: Free Press.
Preißner, A. (2011). Balanced Scorecard anwenden Kennzahlengestutze Unternehmenssteuerung.Munchen.
Railion Deutschland AG. (Ed.). (2007). Guterwagenkatalog (CD-ROM). Mainz.
Reichmann, T. (2006). Controlling mit Kennzahlen und Management-Tools – Die systemgestutzteControlling-Konzeption (7. Edition). Munchen.
R€odler, E., R€odler, R., & Muller, S. (2003). Balanced Scorecard und MIS – Leitfaden zurImplementierung, Bonn.
Ruhl, M. (2008). Logistik in Westeuropa. In I. G€opfert, & D. Braun (Ed.). Internationale Logistikin und zwischen unterschiedlichen Weltregionen (S. 25–66). Wiesbaden.
Rumenapp, T. (2002). Strategische Konfigurationen von Logistikunternehmen, Ansatze zurkonsistenten Ausrichtung in den Dimensionen Strategie, Struktur und Umwelt. Wiesbaden.
Bibliography 299
Sarbach, P. (2006). Das Konzept des Financial Supply Chain Management: Entwicklungsstand,Auswirkungen und Nutzen bei Schweizer Grossunternehmen. Bern: Arbeitsbericht Nr. 175 desInstituts fur Wirtschaftsinformatik der Universitat Bern.
Scheer, A.-W. (Ed.). (2008). Rechnungswesen und EDV. Heidelberg.Scheer, A.-W., & Borowski, R. (1999). Supply Chain Management: Die Antwort auf neue
Logistikanforderungen. In H. Kopfer, & Chr. Bierwirth (Ed.). Logistik Management:Intelligente I + K Technologien (S. 3–14). Berlin/Heidelberg et al.
Schenk, M., Richter, K., Jumar, U., & Herrmann, A. (2011). Galileo-Testfeld Sachsen-Anhalt –
Anwen dungsschwerpunkte Verkehr und Logistik. In Th. Wimmer, & H. W€ohner (Ed.).
Intelligent wachsen, Kongressband 27. Deutscher Logistik-Kongress (S. 565–600). Hamburg.
Schmid, H. (2001). Die schnelle Fabrik, Planung und Realisierung einer Fabrik fur
Computersysteme und deren Einbindung in eine logistisches Netzwerk. In H.-C. Pfohl (Ed.).
Jahrhundert der Logistik: Customer-Related-Glocal-E-Based (S. 141–165). Berlin.
Schneider, C. (Ed.). (2004). Controlling fur Logistikdienstleister, Konzepte, Instrumente,Anwendungsbeispiele, Trends. Hamburg.
Schorb, U., Halsband, E., & Anders, F. (2007). Kontraktlogistik in der Automobilindustrie. In
W. St€olzle, J. Weber, E. Hofmann, & C. M. Wallenburg (Ed.). Handbuch Kontraktlogistik.Management komplexer Logistikdienstleistungen (S. 619–637). Weinheim.
Schubert, W. (Ed.). (2000). Verkehrslogistik: Technik und Wirtschaft. Munchen.
Schulte, G. (1996). Material- und Logistikmanagement (1. Edition). Munchen.
Schulte, G. (2001). Material- und Logistikmanagement (2. Edition). Munchen.
Schulte, C. (2009). Logistik: Wege zur Optimierung des Material- und Informationsflusses.Munchen.
Schutte, R., Vering, O., & Wiese, J. (2000). Erfolgreiche Geschaftsprozesse durch standardisierteWarenwirtschaftssysteme. Berlin/Heidelberg.
Sebastian H.-J., & Grunert, T. (Ed.). (2001). Logistik Management, Supply Chain Managementund E-Business. Stuttgart.
Seitz, R. (2004). Entwicklung eines Referenzmodells zur Erstellung eines Bewertungssystems furdie Planung von Rechenzentren. Diss, Universitat Leipzig.
Sommer, K. (2003). Fahrzeugdistribution in der Automobilindustrie. In H. Merkel, & B. Bjelicic
(Ed.). Logistik und Verkehrswirtschaft im Wandel: Unternehmensubergreifende Versorgungs-netzwerke verandern die Wirtschaft (S. 239–246). Munchen: Festschrift fur G. B. Ihde.
Spengler, T., Voß, S., & Kopfer, H. (Ed.). (2004). Logistik Management: Prozesse, Systeme,Ausbildung. Heidelberg.
Stadtler, H., & Kilger, Ch. (2002). Supply chain management and advanced planning. Berlin:Springer.
Stenzel, J. (2003). Finanzierung als Dienstleistungskomponente. In Bundesvereinigung Logistik
(Ed.). Finanzierung – eine neue Dimension der Logistik (S. 139–150). Berlin.Stieglitz, A. (1999). Die Reorganisation handelslogistischer Versorgungsketten. Munchen.
St€olzle, W. (1999a). Industrial relationships. Munchen.
St€olzle, W. (1999b). Dimensionen der Gestaltung des Organisationsproblems. In J. Weber, &
H. Baumgarten (Ed.). Handbuch Logistik: Management von Material- und Warenfluß-prozessen (S. 571–589). Stuttgart.
St€olzle, W., & Gareis, K. (2002). Konzepte der Beschaffungslogistik – Anforderungen und
Gestaltungsalternativen. In D. Hahn/L. Kaufmann (Eds.), Handbuch IndustriellesBeschaffungsmanagement (S. 402–423). Wiesbaden.
St€olzle, W., & Otto, A. (Ed.). (2003). Supply Chain Controlling in Theorie und Praxis: AktuelleKonzepte und Unternehmensbeispiele. Wiesbaden.
St€olzle, W., Heusler, K. F., & Karrer, M. (2004). Erfolgsfaktor Bestandsmanagement: Konzept,Anwendungen, Perspektiven. Duisburg.
St€olzle, W., Weber, J., Wallenburg, C. M., & Hofmann, E. (2007). Handbuch Kontraktlogistik:Management komplexer Logistikdienstleistungen (S. 35–54). Weinheim.
Straube, F. (2004). E-Logistics – Ganzheitliches Logistikmanagement. Berlin.
300 Bibliography

Straube, F., Dangelmaier, W., Gunthner, W. A., & Pfohl, H.-C. (2005). In Bundesvereinigung
Logistik e. V. (Ed.), BVL Trends und Strategien in der Logistik – Ein Blick auf die Agenda desLogistik-Managements 2010. Hamburg.
Sydow, J., & M€ollering, G. (2004). Produktion in Netzwerken: Make, buy& cooperate. Munchen:
Vahlen.
ten Hompel, M., & Schmidt, T. (2007). Warehouse management. Berlin: Springer.ten Hompel, M., et al. (2007). Software in der Logistik. Munchen.
TNT N. V. (Ed.). (2007). 2006 Annual report. Amsterdam.
Tripp, C. (2003). Chancen und Risiken mittelstandischer System-Stuckgutkooperationen inDeutschland. Eine Untersuchung der Fraunhofer ATL Nurnberg im Auftrag der bayrischenHypo-Vereinsbank AG Munchen. Nurnberg.
Tripp, C. (2004). Kooperationen und Kontraktlogistik. Nurnberg.United Parcel Service, Inc. (Ed.). (2007). UPS annual report 2006. Atlanta.Vahrenkamp, R. (2005). Logistik: Management und Strategien (5. fully updated and extended
edition). Munchen.
Vahrenkamp, R. (2007). Logistik: Management und Strategien. Munchen.
Vahrenkamp, R. (2008). Produktionsmanagement. Munchen/Wien.
Verein Deutscher Ingenieure (VDI) e. V. – VDI-code with respect to the up-to-date version.
Vis, I. F. A., & Harika, I. (2005). Comparison of vehicle types at an automated container terminal.
In H.-O. Gunther, & K. H. Kim (Ed.). Container terminals and automated transport systems:Logistics control issues and quantitative decision support. (S. 38–63). Berlin/Heidelberg.
Weber, J. (2001). Logistikcontrolling. Stuttgart: Springer.Weber, J. (2002a). Logistikkostenrechnung – Kosten-, Leistungs- und Erlosinformation zur
erfolgsorientierten Steuerung der Logistik. Heidelberg.Weber, J. (2002b). Logistik- und Supply Chain Controlling (5. Edition). Stuttgart.
Weber, J., & Schaffer, U. (2000). Balance Scorecard& Controlling, Implementierung – Nutzen furManager und Controller – Erfahrungen in deutschen Unternehmen. Wiesbaden.
Weber, J., & Schaffer, U. (2011). Einfuhrung in das Controlling (13.Edition). Stuttgart.
Weid, H. (1995). Wettbewerbsvorteile durch Elektronic Data Interchange (EDI). In H. Baumgarten,
& G. B. Ihde (Ed.). Schriftenreihe der Bundesvereinigung Logistik. Bremen.Wildemann, H. (2002). Distributionslogistik. Munchen.
Wildemann, H. (2007). Entscheidungsprozesse beim Outsourcing komplexer logistischer
Aufgaben. In W. St€olzle, J. Weber, E. Hofmann, & C. M. Wallenburg (Ed.). HandbuchKontraktlogistik. Management komplexer Logistikdienstleistungen (S. 133–149). Weinheim.
Wildemann, H. (2010). Logistik Prozeßmanagement. Munchen.
Witten, P., & Karies, R. (2003). Logistik im Distanzhandel. In H. Merkel, & B. Bjelicic (Ed.).
Logistik und Verkehrswirtschaft im Wandel: Unternehmensubergreifende Versorgungs-netzwerke verandern die Wirtschaft (S. 185–197). Munchen: Festschrift fur G€osta B. Ihde.
Wolters, H. (1995). Modul- und Systembeschaffung in der Automobilindustrie – Gestaltung derKooperation zwischen europaischen Hersteller- und Zulieferunternehmen. Wiesbaden.
Zentes, J. (2004). Marketing-Effektivitat vs. Logistik-Effizienz: Theoretische Uberlegungen und
empirische Befunde. In T. Spengler, S. Voß, & H. Kopfer (Ed.). Logistik Management:Prozesse, Systeme, Ausbildung (S. 255–270). Heidelberg.
Zimmermann, B. (2004). Kontraktlogistik als Zukunftsmarkt der Logistikdienstleistungswirtschaft?Mittelstandskongruenz und Entwicklung eines mittelstandsgerechten Vertriebsmodells.Nurnberg.
Bibliography 301

Index
A
ABC analysis, 142–145
Activity-based costing, 250, 261
Additional services, 7–10, 23, 33, 91, 241,
247, 281
Adjustment function, 141
Advanced Planning and Scheduling systems
(APS), 215
Agents, 10, 23, 26, 30, 31, 75
Agents of logistics, 10–12
Air cargo terminals, 44
Air network, 91, 92
Airports
industrial parks, 40, 75
logistics centers, 40
terminals, 40
Air transport, 39, 40, 44, 54, 73–75, 78, 85,
88, 282
All-cargo plane, 74, 85–87
Analyzing function, 252
Antwerp-Rotterdam-Amsterdam range
(ARA), 66
Automated guided vehicle (AGV), 109, 111
Automotive industry, 154, 192, 268–271
Auxiliary services, 54
B
Balanced score card (BSC), 257–259
Barcode, 118, 120, 134, 192, 197, 199, 200,
202, 204, 281
BASF SE, 64
Batch picking, 123
Bay shelves, 100, 103, 104, 126
Bay shelving warehouse, 133, 135
Belly capacity, 85
Belly cargo, 74
Belt conveyor, 44, 47, 112, 113, 117, 124, 127
Bin storage warehouse, 134
Block delivery, 150
Block storage, 98–100, 105
Block train traffic, 63
Broadband infrastructure, 50
Budgeting, 30, 248, 252
Buffer warehouse, 97
Building infrastructure, 38, 47, 50
Build operate transfer, 241–242
Bulk goods, 43, 44, 55, 60, 61, 63, 65, 112, 272
waterway transport, 69, 71
Bulk procurement, 149
Bulk ships, 81
Business
continuity, 50
enterprise, 12, 13
models, 2, 222, 267–282
Business-to-business (B2B), 213, 277
Business-to-consumer (B2C), 277, 278
By-pass concept, 177, 178
C
Cabotage, 58
Cantilever shelves, 101
Capacity planning, 169–170, 214
Capital relationships, 226
Capital requirement, 226–228, 233
Capital utilization, 226–228
Cargo
handling, 75
plane, 74, 85, 86
Carriers, 10, 12, 47, 51, 58, 63, 64, 68, 75, 80,
87–89, 91, 111, 115, 117, 120, 121, 124,
149, 179, 182–184, 190, 198, 199,
269, 278
haulage, 68, 87
Cash-conversion-cycle, 230, 231
Cash-flow cycle, 230
Cash flow statement, 227
Cash forwarding, 234–236
Cash-in, 232
H. Gleissner and J.C. Femerling, Logistics, Springer Texts in Business and Economics,
DOI 10.1007/978-3-319-01769-3, # Springer International Publishing Switzerland 2013
303
Cash-out, 232
Cash-to-cash-cycle, 230–233
Cash-to-cash-cycle-time, 230–231
Centralization, 166–169, 264, 278
Central warehouse (CW), 10, 33, 47, 55, 92,
145, 166–168, 176, 187, 197, 255, 263,
274, 277, 279, 281, 286–288
Chain conveyor, 113
Changes of logistics, 5–7, 30, 250
Chaotic storage, 131, 132, 286
Charterers, E.H., 71
Charter traffic, 67
Circular conveyor, 113, 114
City logistics concepts, 183
City terminals, 184
Closed load carriers, 122
Coast location, 66
Collaborative planning forecasting
replenishment (CPFR), 34, 158–159,
192
process model, 158
Co Managed Inventory (CMI), 157
Combined cargo, 46, 63, 85
Combined transport, 45, 63, 64, 78, 79, 89, 183
Commercial freight transport, 38, 60–64,
65–69, 71–74, 78, 80, 81, 85, 183, 282
Commercial road transport, 58
Communication
infrastructure, 38, 49–51, 206
standards, 190–198
Concessions, 58
Consolidation concepts, 177, 178
Consumer credits, 233
Consumer goods
contract logistics, 281
distribution, 24, 281
Consumption-led disposition, 145
Container
gantry cranes, 44, 66
ports, 67
shelving, 99
ships, 66, 81, 84
terminal, 44, 45, 64
traffic, 69
transport, 59, 68, 75, 80, 82, 84
Continuous conveyors, 105, 112–116
Contract logistics providers, 91–93, 176, 273,
282
Contractual partners, 92
Control and system costs, 250, 251
Control function, 246, 252
Controlling (managerial accounting), 2, 13, 21,
31, 34, 93, 111, 119, 180, 182, 190, 199,
203, 204, 207–212, 214, 219, 246–248,
256, 257, 261–264
Control system, 13, 40, 73, 119, 197, 205,
208–209
Conveyance, 80, 96, 105, 111, 112, 114, 120
Conveyors, 38, 44, 47, 76, 96, 99, 100, 103,
105–119, 124, 127–129, 133, 135, 228,
272, 275
Core services of logistics, 7, 9, 10
Corporate strategy, 20–21
Cost
advantage, 23, 25, 26, 153, 263, 274, 278
center accounting, 249
control, 248
differentiation, 20
leadership, 20
unit accounting, 249, 261
Counter frame, 87
Couriers, 87, 89–91, 276
CPFR. See Collaborative Planning Forecasting
Replenishment (CPFR)
Credit relationships, 226
Crossbelt sorter, 117, 118
Cross border transport, 39, 54
Cross-docking
points, 123, 179, 212, 281
principle, 179
terminal, 47, 181
Cross-docks, 272
Current account, 233
Current assets, 226–230, 232, 241
Customer relationship management
(CRM), 159
Cycle stock function, 141
Cycle time, 25, 31, 108, 229
D
Data center, 38, 50
parks, 50
Data flow, 123, 203
Data processing, 2, 163, 191, 193, 195,
200, 204
Days in inventory, 231, 232
Days in payables, 231
Days in receivables, 232
Days payables outstanding, 231, 232
Days sales outstanding, 231, 232
DB Schenker, 46, 63, 82, 83
Definition, 4–7, 12, 96, 162, 164, 166, 170,
184, 185, 191, 249, 251, 257, 261, 263
Delivery
flexibility, 16
quality, 16
time, 16, 25, 141, 151, 152, 167, 180, 211,
264, 275, 278
Demand chain management (DCM), 21
304 Index

Depots, 42, 46, 91, 172–175, 286
Deutsche Bahn AG, 45, 46, 60, 62–64
Direct logistical costs, 250
Direct-store delivery, 178, 180
Direct trains, 63
Direct transport, 43, 54, 58, 59, 61, 78, 172
Disaster recovery, 50
Discontinuous conveyors, 105–111, 114, 115
Discounted cash flow calculation (DCF), 227
Dispatch area, 133–135
Disposition, 9, 20, 27, 28, 33, 59, 70, 75, 87, 90,
143, 151, 153, 158, 159, 183, 237
procedures, 145–146
Distribution
centers, 20, 47, 75, 132, 134, 175, 176, 216,
217, 221, 272, 281
logistics, 10, 12–14, 20, 30, 63, 69, 88, 92,
96, 97, 140, 163, 177, 276, 278, 281
nets, 175–176
network planning, 212
networks, 12, 46, 174, 213, 279, 286, 287
structure, 55, 175, 180, 186, 187
warehouse(s), 47, 97, 123, 166, 186–187
Divisional organization structure, 28
Division of labour, 4, 6, 21, 28, 32, 55, 65, 272
Door-to-door logistics chain, 46
Drive-in racks, 99, 100
Drive-in shelves, 99
Drive-through rack, 100
DuPont system of financial control, 259, 260
Dynamic picking, 134
Dynamic provisioning, 126, 127
Dynamic storage systems, 97, 101–105
E
EAN barcodes, 200
E-business, 217, 277–279
E-commerce, 176, 194, 217, 273, 277, 278
Economic efficiency key figures, 254, 256
Economic infrastructure, 38
EDIFACT, 192–194, 196, 270
Efficient consumer response (ECR), 26, 34, 55,
155–157, 159, 192, 194, 196
Efficient replenishment, 156
Electric pallet ground conveyor, 114, 115
Electric telpher lines, 114
Electronic air waybill, 75
Electronic data interchange (EDI), 156,
191–196, 213, 219–221
principle, 191
Electronic product code (EPC), 192, 198, 204
Electronics and computer industry, 272
Elements of logistics, 5, 10–12, 27, 250
E-logistics, 214
Energy pipelines, 75, 76
Enterprise resource planning (ERP) system,
205–207, 210, 213–222
Environmental impact, 56, 59
E-procurement, 194, 213–214, 277, 278
E-purchasing, 277
Equipment leasing, 240
E-sales, 277
Eurologistics systems, 279
Euro pallet, 104, 121, 122, 285
European central warehouses, 55
European distribution centers (EDC), 176
European Railway Transport Management
System (ERMTS), 51
Express service providers, 91
External transport services, 54
Ex works (EXW), 153, 180, 256
F
Factoring, 230, 234–237
Feeder
services, 66
transport, 41
Finance leasing, 239
Financial instruments, 226, 234
Financial logistic solutions, 236
Financial processes, 227, 230
Financial supply chains, 2, 230–234
Financing, 2, 183, 225–242
First expired–first out (FeFo), 132, 219
First in–first out (FiFo), 98, 100, 102, 132
Fixed assets, 228, 242
Fixed storage, 131, 132
Flagging-out, 67
Fleet leasing, 241
Fleet monitoring systems, 211
Flexible schedules, 56
Floor-bound conveyors, 105
Floor-mounted drag chain conveyors, 115–116
Flow management, 6
Flow of goods, 12, 24, 30, 96, 97, 131, 163,
165, 170, 183, 197, 219
Flow of materials, 96, 120, 215, 272
Forfaiting, 234–236
Forfeiter, 235
Forklift truck, 286
Forwarders, 10, 16, 60, 63, 72, 75,
87–89, 91, 115, 183, 193, 220,
251, 274, 278, 279
Freedoms of the air, 74
Index 305
Free storage, 131
Freight traffic, 55, 60, 62, 64, 72, 240
Freight transport, 38, 44, 58–69, 73–75, 78, 80,
81, 85, 88, 183, 282
Freight villages, 47–49, 182, 183
Frontload truck, 47, 107
Full-load shipping, 89
Functional organization structure, 28
Function of packaging, 122
Functions, 1, 2, 4, 7, 8, 10, 12, 20, 26, 27, 30,
31, 34, 38, 40–42, 47, 48, 51, 88, 92, 93,
96, 97, 119, 120, 122, 124, 127, 128,
141–142, 145, 151, 163, 164, 166,
171–173, 175, 183, 185, 192, 214, 217,
226, 229, 230, 234–236, 246, 247, 252,
254, 256, 269
G
Gallery storage, 125, 133–135
Gas
pipelines, 75
tankers, 81
Gate houses, 130
Gate system, 130
Gateway, 42
General cargo
terminals, 44
waterway, 69
Global distribution, 55
Global location number (GLN), 197
Globalnaja Nawigazionnaja Sputnikowaja
Sistema (Glonass), 51
Global positioning system (GPS), 51, 210,
211, 282
tracking, 282
Global procurement, 274
Global production, 55
Global Returnable Asset Identifier
(GRAI), 198
Global sourcing, 278
Global System for Mobile (GSM), 50, 211
Global System for Mobile Communication
Railways (GSM-R-network), 48
Global Trade Item Number (GTIN), 197
Goods outgoing, 106, 115, 116, 128, 129, 131
Goods receiving, 105, 106, 111, 116, 123, 128,
130, 131, 133, 134, 136, 151–152, 207
Goods structure effect, 55, 60
Goods-to-man principle, 103
Grids nets, 172
Gross demand, 141
H
Handling, 7–9, 32, 38, 44, 47, 61, 63, 66, 69,
71, 75, 78, 88, 95–136, 159, 163, 166,
167, 169, 171, 173, 175, 177–183, 190,
195, 205, 208, 212, 214–216, 219, 222,
241, 242, 247, 251, 256, 257, 261, 263,
270, 274, 275, 288
Haulage contractors, 87
Head ramp, 129
High rack, 99, 114, 126, 240, 275
warehouses, 275
Hinterland
location, 66
ports, 66
Horizontal carousel, 103, 104
Hub and depot planning, 174–175
Hub-and-spoke nets, 39, 173, 174
Hub-and-spoke systems, 47, 91, 174, 175, 286
Hubs, 39, 40, 43, 64, 80, 91, 172–175, 217,
237, 275, 286
I
Identification standards, 197–198
Indirect logistical costs, 250
Individual procurement, 149
Industrial contract logistics, 281
Industrial logistics, 10, 64–65
Industrial pallet, 120, 121
Industry solutions, 2, 267–282
in trade, 273–276
Information infrastructure, 38, 49–51
Infra-and traffic suprastructure, 1
Infrastructural facilities, 38, 41, 44, 48
Infrastructure providers, 10, 12
Inland ports, 38, 39, 41–42, 66, 69
terminals, 44
Inland transport, 61
Inland waterway
networks, 39
transport, 39, 69–73, 78, 84
Inner-city transport, 184
Integration effect, 55
Integrators, 40, 74, 89–91, 282
Internal transport services, 54
International Air Transport Association
(IATA), 73
International Civil Aviation Organization
(ICAO), 73
International commercial terms, 180
International distribution, 272, 279
International logistics, 280
306 Index
Internet, 39, 50, 75, 191, 194, 204, 213, 214,
220, 221, 277, 278
providers, 277
Inter-operability, 64
Inventory
classification, 142
control systems, 13, 197
cost, 24, 25, 35, 140, 142–145, 228, 288
financing, 233–237
management, 8, 12, 46, 75, 93, 96, 136,
140, 141, 164, 236–237, 242, 274
Investment, 25, 32, 49, 76, 92, 97–99, 175, 176,
184, 194, 215, 225–242
ISO-containers, 122
Isolated-open ERP systems, 207
IT systems, 13, 131, 204, 205, 215, 240,
247, 276
J
Just-in-sequence delivery, 150
Just-in-time
concepts, 149–151
delivery, 48, 144, 150, 156, 193, 268, 269
K
KANBAN, 149
Key figures, 30, 227, 245, 252–260
Key Performance Indicator (KPI), 254–259
Kombiverkehr Deutsche Gesellschaft furkombinierten Guterverkehr GmbH &Co. KG, 63
L
Large-scale-project leasing, 241
Last in-first out (LiFo), 100, 102, 132
Last-mile problem, 278
Layout planning, 170
Lead logistics provider, 26
Leasing, 230, 238–241
Lift pallet trucks, 106, 107
Liner conferences, 67
Live storage
shelf, 101, 102, 105, 285
shelving, 102, 105, 285
Load and consignee acquisition, 177
Load carriers, 79, 102, 111, 119–123, 127, 152,
170, 270
Loading
aids, 80, 85, 97, 98, 152, 270
bridges, 129, 130
gates, 48, 116, 129, 135
ramps, 129
unit, 78–80, 89, 97–102, 108, 119–122,
126, 129, 131, 132, 186, 274
zone, 128, 129, 135
Local area networks (LANs), 50
Logistical concepts, 1, 48, 139
Logistical cost, 249, 250, 252, 257, 262
and performance
accounting, 249–252, 257
Logistical information services, 7–10
Logistical infrastructure, 37–51, 163
Logistical organization models, 29
Logistical problems and solutions, 5
Logistical service level, 126
Logistics
controlling, 2, 180, 245–264
effect, 55, 60, 180
movables, 239–242
network, 10, 13, 16, 22, 23, 163–165, 168,
169, 171, 215, 248, 262
network planning, 1, 161–187
organization structures, 27, 28
outsourcing, 184, 217
performance, 162, 250, 255
real estate, 2, 47–49, 225, 227, 228,
237–239
systems, 2, 7, 8, 12, 14, 19–34, 37, 38,
51, 53, 161, 181, 182, 214, 217,
219, 225, 252, 254, 268, 272, 274,
275, 279, 280
Logistics park, 47–49, 176
logistics chain, 46
Logistics services
centers, 47, 69
providers, 9, 10, 20, 27, 40, 54, 55, 69,
87–93, 115, 143, 152–153, 155,
156, 174, 176, 177, 180, 182, 184,
186, 192, 216, 222, 230, 236–240,
247, 271–273, 275, 276, 279,
281, 282
Long-distance traffic, 58
Long-haul transport, 59
Lot size calculation, 145
Lower deck, 74, 85, 87
M
Macrologistics, 10, 12
Mail-order businesses, 127, 275–278
Mail services, 89–91
Main carriage, 78, 80, 275
Main ports, 66
Index 307
Management, 1, 7, 8, 12, 13, 21, 23–27, 30–34,
46, 63, 92, 93, 131–136, 149, 151, 154,
156, 157, 194, 195, 198, 205, 207,
209–211, 213–215, 217–220, 226,
228–230, 233, 236, 237, 241, 246–248,
251, 252, 256–259, 262, 263, 276, 279,
281, 282, 287, 288
systems, 24–25, 133–136, 211, 251, 276,
281, 288
Managerial accounting (controlling), 2, 13, 21,
31, 34, 93, 111, 119, 180, 182, 186, 190,
199, 203–205, 207–212, 214, 219,
245–264
Man-to-goods, 123
Manual lift truck, 106, 127
Manufacturing Resource Planning
(MRP II), 214
Marshalling yards, 43
Mass-transport, 56, 60, 61, 71, 76
Material classification, 142
Material demand, 140, 141
Material flow control, 118–119, 208
Material flow system (MFS), 127, 128, 205,
208–209
Material management, 12, 214, 256
Material Requirements Planning (MRP I), 214
Matrix structure, 30
Means of transport, 38, 43, 54, 56, 62, 64, 75,
78–87, 89, 127, 152, 172, 177, 187, 209,
228, 240, 275
Merchant’s haulage, 68
Merge-in-transit concepts, 179
Metalogistics, 12
Micrologistics, 10, 12
Mobility of goods, 54
Modal split, 70, 183
Modes of transport, 44, 46, 54, 56–78, 123
Modular and system sourcing, 269
Modular sourcing, 55, 269
Mortgage financing, 237
Multi-channel providers, 277
Multi-client-warehouses, 281
Multidimensional process, 5
Multi-link transport chains, 78
Multi-modal manner, 51
Multi-modal traffic, 60
Multi-order picking, 135
Multi-pick concepts, 177, 178
Multi-stage order processing, 123
N
Narrow aisle trucks, 108, 109, 125
Navigation services, 51
Net demand, 141
Net structures, 172
Network
of air routes, 39
configuration, 172–176
forming capability, 56, 76
infrastructure, 49–50
planning, 1, 161–187, 212–213, 279
rationalization, 59
Non-vessel-operating common carriers
(NVOCC), 68
O
Object value, 7
Ocean shipping, 39, 81
Off-balance inventory financing, 237
Oil pipelines, 75
Oil tankers, 81
On-board units (OBU), 210, 211
On-carriage, 41, 44, 46, 68, 69, 74, 75, 78, 96,
116, 119, 126, 153, 275
Onward carriage, 89
Open-side-container, 82
Open-top-container, 45, 82
Operate leasing, 239
Operationalization function, 252
Operative route planning, 210
Operators, 41, 70, 75, 87, 109, 183
Optical character reading (OCR), 199
Order
picking, 91, 123, 124
policies, 146–148
processing, 7, 12, 20, 27, 28, 93, 123, 144,
156, 157, 170, 195, 214, 215, 229, 230,
251, 257, 275, 278, 281
processing costs, 228, 250, 278
Order rhythm-lot size procedure, 146
Order rhythm-order level procedure, 146
Order to cash cycle, 25
Origin of capital, 226–228
Out-of-stock, 142, 145, 150, 219
Outsiders, 67
Outsourcing, 20, 55, 91, 92, 176, 184–187, 217,
236, 239, 241, 248, 272, 273, 281
Overseas container transport, 68
P
Package, 8, 62, 87, 89, 97, 98, 105, 115,
119–122, 214, 261, 262, 275
Packaging, 8, 9, 23, 64, 74, 96, 97, 100,
119–122, 168, 170, 183, 186, 197, 198,
251, 256, 263, 270, 274, 281
Pallet rack, 98–100, 125
Pallet shelving, 99, 105, 285
308 Index
Pantograph reach truck, 108
Parcel centers, 118–119
Parcel service providers, 47, 87
Part-load shipping, 62, 89
Partly integrated ERP systems, 207
Partnerships, 31, 32, 69, 151, 156, 237, 241
Passenger plane, 85, 87
Performance accounting, 2, 246, 248–252,
257, 261
Performance effects, 262–264
Pick by light, 124, 275
Pick by voice, 124, 275
Picking, 1, 7–8, 10, 16, 20, 25, 38, 46–48, 91,
95–137, 143, 153, 177, 205, 207–209,
216–219, 221, 228, 240, 251, 262, 263,
274, 275, 278
Piggy-back transport, 63, 80
Pipeline network, 46, 54, 76–78
Pipeline transport, 60, 75–78
Plantrain, 63
Platform container, 82
Point-to-point connection, 50, 63
Port location, 66
Pre-carriage, 41, 68, 69, 74, 75, 78, 153, 275
Predictability, 56, 149, 150
Primary demand, 140–141, 145
Principles of picking systems, 124
Private haulage, 54, 58, 88
Process analysis, 261
Process cost accounting, 261–262
Procurement
logistics, 12–14, 30, 63, 88, 97, 140, 157,
180, 182,
supply chains, 268
Production
logistics, 12–14, 48, 97, 176, 281
synchronized provisioning, 149
Production planning systems (PPS), 150, 214
Production warehouse (PW), 166
Productivity key figures, 254
Product pipelines, 75
Program-led disposition, 145
Project financing, 242
Property financing, 237
Provisioning, 50, 105, 116, 123–128, 134, 136,
145, 149–153, 238, 240, 262, 272
management, 1, 139–159
Prozesskostenrechnung (process cost
accounting), 261
Public private partnership, 241
Public transport, 154, 184
Pull principle, 25, 149
Push-back shelf, 102
Push principle, 24, 149
Push sorters, 117
Q
Quality key figures, 255, 256
Quick change, 74, 85
Quick-change plane, 85
R
Rail freight transport, 60–65, 71, 78, 80,
88, 282
Rail infrastructure, 42, 43
Railroads
networks, 39, 45, 64
systems, 42–43, 46, 60, 61
transport services, 60
Rail sidings, 43
Rail stations, 42–43
Rail terminal, 45
Rail transport, 39, 54, 60, 64, 128
Railway wagons, 81, 83
Reach truck, 107, 108
Readiness to deliver, 17
Real estate, 1, 2, 47–49, 227, 228, 237–240
infrastructure, 38
Regional distribution centers, 175
Regional freight carrier concept, 152–153
Regional warehouse, 47, 145, 166–168, 221,
278, 279, 286, 287
Relationship, 23, 27, 31, 33, 49, 59, 157, 171,
193, 216, 226, 230, 236, 257, 262
Rent, 50, 237–239, 251, 256, 263
Reporting system, 252
Retail logistics, 10
Return on investment (ROI), 228, 257,
259–250, 289, 290
RFID, 120, 192, 198, 199, 202–204
data carrier, 120
River and maritime navigation, 69
Road feeder service (RFS), 74
Road freight transport, 58–60, 67, 78, 80, 81,
88, 183
Road networks, 39, 45, 49, 58, 64, 91, 92, 210
Road transport, 39, 45, 46, 58, 60, 61, 64, 209
Roller conveyor, 112, 113
Roll-on/roll-off, 45, 69, 80
S
Safety, 56, 65, 67, 71, 73, 79, 80, 105, 148, 269
stocks, 142, 145, 148, 150, 167, 263, 264
Sale-and-lease-back, 239
Satellite
navigation sea port, 51
storage, 103
systems, 51
SCE. See Supply chain execution (SCE)
Index 309
SCP. See Supply chain planning (SCP)
Sea freight transport, 65–69, 78
Sea front location, 66
Sea port terminals, 44
Sea transport, 39, 41
networks, 39
Secondary demand, 141, 145
Selective warehousing, 167
Semitrailer, 49, 59, 80
Serial shipping container code (SSCC), 197,
200, 201, 220
Service leasing, 241
Service level, 14–17, 97, 126, 148, 150, 227,
275, 288
Service logistics, 10
Seven R´s, 4
Shelving bay, 126
Short-distance traffic, 58
Shuttle trains, 63
Single sourcing, 269
Single-stage, 123–126
order processing, 123
Single wagon transport, 62–63
Site infrastructure, 38
Slat sorters, 117
Slide shelving, 104
Sliding sorters, 117
Small goods transport, 89, 90
Smart labels, 203
Social infrastructure, 38
Sorters, 105, 117–119, 135, 208, 275
Sorting machine, 135
Spare parts logistics, 168, 242
Spatial flexibility, 56
Special containers, 82
Specialty leasing, 239
Speediness, 56, 59, 61, 63, 89, 153, 278
SSCC. See Serial shipping container
code (SSCC)
Stackers, 106–108, 170
cranes, 109, 208
Static picking, 134
Static provisioning, 124–126
Static storage systems, 98–101
Stochastic disposition, 145
Stock costs, 142, 145, 150, 250, 251, 263
effect, 263
Stock-keeping, 140, 142
Stock management, 139–159, 204–209, 215,
217, 218, 220, 221, 263
Storage
facilities, 63, 97–105, 281
racks, 98, 109
systems, 48, 98–105, 126, 131, 274
warehouse, 97, 133, 134–135
zones, 111, 131, 134
Strategic network planning, 162–163
Structural key figures, 254
Supplementary information services, 8
Supplier’s credit, 233–234
Supply chain
event management, 156
finance, 230
management, 21, 25, 26, 32, 33, 93, 156,
163, 214, 215, 226, 227, 229, 230,
248, 262
Supply chain execution (SCE), 156, 215
Supply chain planning (SCP), 156, 215
Supplying industry, 122, 192, 268
Supply network, 23, 271
Supported conveyors, 105
Suspended conveyors, 105
Sustainability, 92
Systems
controlling, 13, 111
leadership, 26, 180, 182
service providers, 91–93
T
Tactical route planning, 210
Tank truck, 64
Tariff commitments, 58
Telecommunication infrastructure, 38,
49–50
Telematics systems, 39
Tendering, 184–187, 213
Terminals, 40, 43–47, 63, 105, 115, 135, 136,
175, 180, 181, 184
in railroad transport, 45
Tertiary demand, 141
Third meaning of logistics, 6
Tiering, 269
Tilt-tray sorters, 117, 118
Tonnage, 56, 57, 66, 132
Tracking & tracing systems, 198, 211,
212, 251
Trade-off, 33, 34
Trailer, 45, 46, 63, 80
Trajectory transport, 80
Transcontinental pipelines, 76
Transfracht, 63
Transit times, 103, 105, 124, 275
Transport
affinity, 56–58
capacity, 56, 75, 156
310 Index

chain, 54, 69, 78–80, 87, 89, 120, 177
consolidation, 89, 152, 176–182
costs, 65, 74, 89, 150, 153, 165, 180, 184,
209, 211, 228, 249, 250, 263, 274,
286–288
distance, 48, 58, 79, 88, 96, 167, 263, 264,
278, 287
effects, 263
fleet management, 210, 211
infrastructure, 38–49
logistics concepts, 182–187
modes, 39, 43, 46, 47, 51, 56–75, 78, 79, 87,
123, 240
network, 39, 142, 163, 171–184, 262, 279
network planning, 171–172, 279
routes, 39, 75, 174
services, 1, 40, 54–60, 63, 64, 73, 80, 85,
87, 88, 91, 92, 171, 182
systems, 40, 46, 53–93, 126, 192, 209
value, 56–58, 69, 71
volumes, 55, 56, 61–65, 71, 184, 263
Trans-regional distribution centers, 175, 176
Transshipment
halls, 47, 48
points, 43–45, 60, 78, 123, 278
terminals, 43, 45, 47, 63, 105, 115
Tray storage, 99, 133
Trimodal, 69
Truck, 9, 42, 44, 47–49, 54, 58–60, 63, 64, 69,
74, 80, 88, 106–109, 111, 114–116, 118,
125, 128–131, 133, 135, 136, 155, 170,
179, 181, 182, 212, 239, 251, 281, 282,
286, 287
Trucking, 74
Twenty-Foot Equivalent Unit (TEU), 82, 83
Two-step picking, 124
U
Universal Product Code (UPC), 197
Unloading ramps, 129
V
Value-added step, 1, 5, 23, 26, 27, 54, 229
Value-adding partners, 269, 277
Value advantage, 23
Value chains, 7, 21, 54, 140, 156, 206, 226,
228, 236, 248, 268
Variotrain, 63
Vendor hub financing, 237
Vendor managed inventory (VMI), 34, 55, 157,
159, 237, 268
Vertical carousel (paternoster), 103
Virtual Private Networks (VPN), 50, 221
Volume of goods effect, 55, 60
W
Wagon-load transport, 62
Wagon types, 63, 82
Warehouse(s)
control, 204–209
costs, 153, 250
costs effects, 263, 264
cost structure, 263
layout, 133
network, 165–170, 262, 263
organization, 128–136
Warehouse management system (WMS),
133–135, 205, 207–208, 214
Warehousing, 1, 7, 10, 12, 20, 48, 88, 92,
95–136, 140, 146–148, 163, 184, 204,
216, 228, 247, 262, 275, 288
strategies, 146–148
Waterway, 38, 39, 42, 46, 64, 70–73, 84, 128,
182, 240
transport, 68
Web-EDI, 194
Weight and balance, 87
Wide Area Networks (WAN), 50
Wilhelm Karmann GmbH, 111
Win-win-situation, 32, 151
Wire-mesh pallets, 121
Working capital, 226, 228, 229, 232, 236,
237, 256
X
XYZ analysis, 143, 144
Index 311