globalization and environment - united nations...
TRANSCRIPT

Globalization and Environment
Theodore Panayotou
CID Working Paper No. 53July 2000
Environment and Development Paper No.1
Copyright 2000 Theodore Panayotou and the President andFellows of Harvard College
at Harvard University Center for International Development Working Papers
Globalization and Environment
Theodore Panayotou
Abstract
Economic globalization impacts the environment and sustainable development in a wide varietyof ways and through a multitude of channels. The purpose of this paper is (a) to identify the keylinks between globalization and environment; (b) to identify the major issues addressed inmultilateral economic agreements in trade and finance that affect environmental sustainability;and (c) to review priority policy issues affecting the environment in multilateral economicagreements and environment, thus identifying incentives implicit in trade and investment policymeasures that affect environmental sustainability. The author categorizes these issues under theprimary areas of globalization: trade liberalization, investment and finance, and technologydiffusion, the latter including intellectual property rights.
In the case of the trade-environment interface, the paper examines the impact of both elements,and the causal relationship between them. It also pays special attention to multilateralenvironmental agreements and their potential effects on trade. An integrative section on theeffects of globalization and environmental policy and performance leads to domestic andinternational priority policy issues and recommendations.
The author concludes that globalization brings with it potentially large benefits as well as risks.The challenge is to manage the process of globalization in such a way that it promotesenvironmental sustainability and equitable human development. In short, the more integratedenvironmental and trade policies are, the more sustainable economic growth will be and the moreglobalization can be harnessed for the benefit of the environment.
Keywords: Environment, Globalization, International Trade
JEL Classification Codes: F18, O13______________________________________________________________________________
Theodore Panayotou is the Director of the Program on Environment and SustainableDevelopment at the Center for International Development. His recent research has focused onthe intersection between economic growth and environmental sustainability.______________________________________________________________________________
Background paper for the Human Development Report 1999 United Nations DevelopmentProgram (UNDP).
1
Globalization and Environment
Theodore Panayotou
Globalization has been the defining trend in the closing decade of the 20th century and thedawn of new millenium heralding a new era of interaction among nations, economies and people.Globalization is an on-going process of global integration that encompasses (i) economicintegration through trade, investment and capital flows; (ii) political interaction; (iii) informationand information technology and (iv) culture. While all dimensions of globalization affect thenatural environment and through it human development, for the purposes of tracing the mainlines between globalization and environment we will focus on the economic dimensions of trade,investment and capital flows. An unprecedented flow of capital, technology, goods and servicescrosses national borders daily. Nearly 20 billion US dollars in capital flows around the worldeach day.
Economic globalization impacts the environment and sustainable development in avariety of ways and through a multitude of channels. Globalization contributes to economicgrowth and thereby affects the environment in many of the same ways that economic growthdoes: adversely in some stages of development, favorably at others. Globalization acceleratesstructural change, thereby altering the industrial structure of countries and hence resource useand pollution levels. Globalization diffuses capital and technology; depending on their environ-mental characteristics relative to existing capital and technology, the environment may improveor deteriorate. Globalization transmits and magnifies market failures and policy distortions thatmay spread and exacerbate environmental damage; it may also generate pressures for reform aspolicies heretofore thought of as purely domestic attract international interest. While it improvesthe prospects for economic growth worldwide and increases overall global output, globalizationcould conceivably reduce economic prospects in individual countries, sectors and industries;such marginalization of economies and people may result in poverty-induced resource depletionand environmental degradation.
Globalization diffuses world product standards and, to the extent that environmentalstandards are higher in the dominant consumer markets, it may create a trend toward risingstandards globally; on the other hand, concerns over the possible loss of competitiveness due to"unfair practices" or lax standards may lead to a "race to the bottom." Economic globalizationchanges the government-market interface; it constraints governments and enhances the role ofthe market in economic, social and environmental outcomes; on the other hand, it creates newimperatives for states to co-operate both in managing the global commons and in coordinatingdomestic environmental policies.
The purpose of this paper is to (a) identify the key links between globalization andenvironment; (b) identify major issues included in multilateral economic agreements in trade,finance, investments and intellectual property rights that affect environmental sustainability; and(c) review priority policy issues affecting multilateral economic agreements and environment, toanalyze incentives implicit in trade and investment policy measures that affect environmentalsustainability.
2
Since this a vast area to cover, we have divided it into the main dimensions of economicglobalization: trade liberalization, investment and finance and technology diffusion andintellectual property rights. In the case of the trade-environment interface, we consider both theimpact of trade on the environment and of the environment on trade. An integrative section onthe effects of globalization on the environmental policy and performance leads to domestic andinternational priority policy issues and recommendations.
Trade and Environment
Trade liberalization and its outcome, freer trade, are both drivers and manifestations ofglobalization. They are also major channels through which globalization impacts the naturalenvironment and affects environmental quality. World trade has grown faster than world outputindicating a growing trade-intensity of the global economy. While global output grew at anaverage annual rate of 4% during 1950-94, the world merchandise trade grew at an averageannual rate of over 6% during the same period. As a result, over the 45 year period, worldmerchandise trade grew by 14 times compared to only 5.5 times for the world merchandiseoutput. The trade intensity of the global economy increased further during 1990-1995 (WTO1995).
Trade theory has demonstrated that free trade maximizes the efficiency of resourceallocation by channeling economic activities to least-cost producers; it thus produces a given levelof output at the least cost. If natural and environmental resources are efficiently priced (i.e. allrelevant social costs are accounted for), the global output resulting from free trade is also producedat the least environmental cost. Free trade maximizes social welfare. For example, countries withhigh levels of agricultural protection use more than ten times as much chemical fertilizers andpesticides per hectare as countries with low level protection (see Figure 1). In this case, tradeliberalization would reduce the use of agrochemicals and hence environmental degradation inprotectionist countries significantly and increase it marginally in low protection countries resultingin overall gains in environmental protection and sustainability. If, however, there are marketfailures (such as unpriced or underpriced resources or unaccounted for externalities), or policyfailures (such as environmentally-harmful subsidies) that are not removed, resources aremisallocated to start with and removal of barriers to trade may exacerbate this misallocation.Under such conditions, freer trade would not maximize social welfare. There would still beefficiency gains (positive effects) but there would also be welfare losses as wasteful resourcedepletion and environmental degradation are exacerbated (negative effects). The net effect onsocial welfare would depend on the relative magnitude of the positive and negative effects.
There are few studies attempting to estimate and compare the efficiency gains from tradeliberalization with the costs of increased environmental degradation or needed additionalenvironmental protection measures. Repetto (1993) attempted such a comparison and concludedthat there is no a priori case for giving trade policy a priority over environmental policy.Efficiency gains from trade liberalization were estimated to range from 1 - 2 percent of GDP to 3- 4 percent for economies with severe economic distortions. Environmental control costs andresidual environmental damage costs, on the other hand, range from 1 - 2 percent of GDP to 3 -5 percent of GDP in countries with lax environmental policies.

3
Figure 1: Relationship between agricultural producer subsidy equivalent (PSE) for 1979-89 and the use of chemical fertilizers and pesticides per hectare of cropland*
Fertilizer use
Pesticide use
Expon. (Pesticide use)
Expon. (Fertilizer use)
TrendlinesFertilizers y = 28.1e0.038x, R2=0.84Pesticides y = 0.65e0.024x, R2=0.44
ARGTHAI
INDIA
AUS NZBRAZ
CAN
USA
AUSTRIA
EC-10
EC-10
KOR
JAP SWI
FIN
NOR
SWE
FIN
SWI NOR
Che
mic
al fe
rtiliz
er p
er h
ecta
re (k
g)
450
400
350
300
250
200
150
100
50
0-40 -20 0 20 40 60 80
7.00
6.00
5.00
4.00
3.00
2.00
1.00
0.00
Pest
icid
e us
e pe
r hec
tare
(tons
of a
ctiv
e in
gred
ient
)
Agricultural PSE (%)
Source: Anderson (1992b, Figure 1) and World Resources Institute (1990, Table 18.2), in Anderon and Strutt (1994).
4
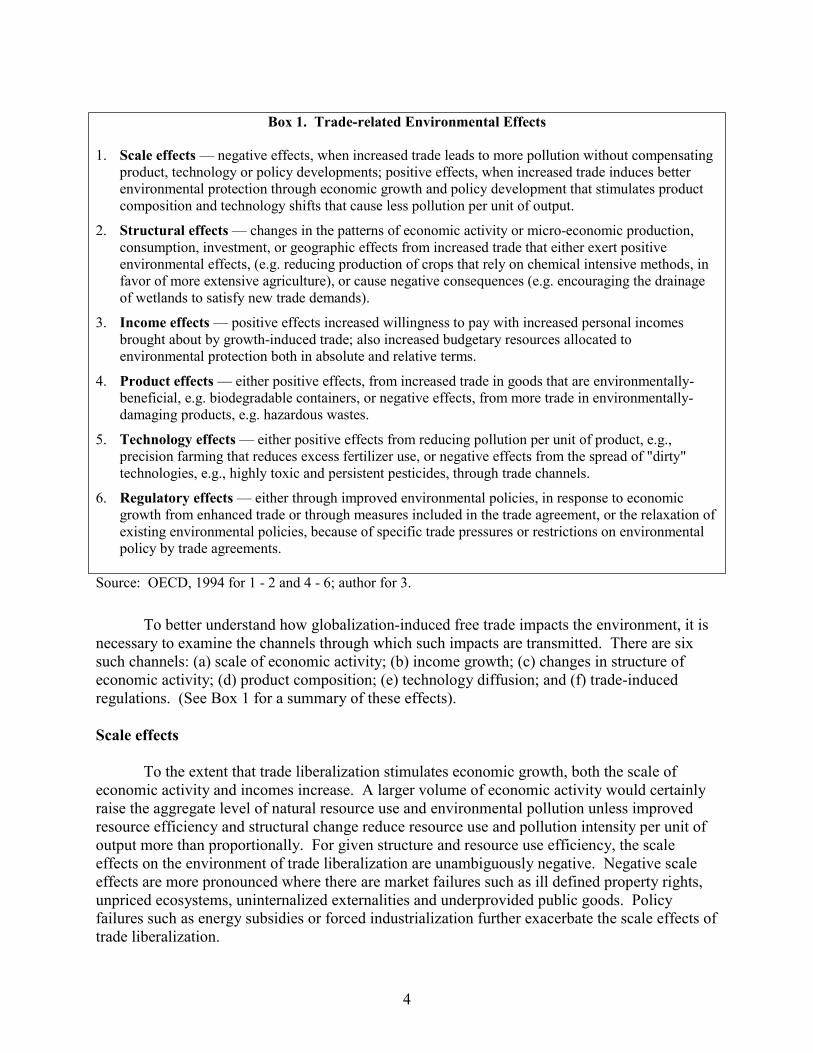
Box 1. Trade-related Environmental Effects
1. Scale effects — negative effects, when increased trade leads to more pollution without compensatingproduct, technology or policy developments; positive effects, when increased trade induces betterenvironmental protection through economic growth and policy development that stimulates productcomposition and technology shifts that cause less pollution per unit of output.
2. Structural effects — changes in the patterns of economic activity or micro-economic production,consumption, investment, or geographic effects from increased trade that either exert positiveenvironmental effects, (e.g. reducing production of crops that rely on chemical intensive methods, infavor of more extensive agriculture), or cause negative consequences (e.g. encouraging the drainageof wetlands to satisfy new trade demands).
3. Income effects — positive effects increased willingness to pay with increased personal incomesbrought about by growth-induced trade; also increased budgetary resources allocated toenvironmental protection both in absolute and relative terms.
4. Product effects — either positive effects, from increased trade in goods that are environmentally-beneficial, e.g. biodegradable containers, or negative effects, from more trade in environmentally-damaging products, e.g. hazardous wastes.
5. Technology effects — either positive effects from reducing pollution per unit of product, e.g.,precision farming that reduces excess fertilizer use, or negative effects from the spread of "dirty"technologies, e.g., highly toxic and persistent pesticides, through trade channels.
6. Regulatory effects — either through improved environmental policies, in response to economicgrowth from enhanced trade or through measures included in the trade agreement, or the relaxation ofexisting environmental policies, because of specific trade pressures or restrictions on environmentalpolicy by trade agreements.
Source: OECD, 1994 for 1 - 2 and 4 - 6; author for 3.
To better understand how globalization-induced free trade impacts the environment, it isnecessary to examine the channels through which such impacts are transmitted. There are sixsuch channels: (a) scale of economic activity; (b) income growth; (c) changes in structure ofeconomic activity; (d) product composition; (e) technology diffusion; and (f) trade-inducedregulations. (See Box 1 for a summary of these effects).
Scale effects
To the extent that trade liberalization stimulates economic growth, both the scale ofeconomic activity and incomes increase. A larger volume of economic activity would certainlyraise the aggregate level of natural resource use and environmental pollution unless improvedresource efficiency and structural change reduce resource use and pollution intensity per unit ofoutput more than proportionally. For given structure and resource use efficiency, the scaleeffects on the environment of trade liberalization are unambiguously negative. Negative scaleeffects are more pronounced where there are market failures such as ill defined property rights,unpriced ecosystems, uninternalized externalities and underprovided public goods. Policyfailures such as energy subsidies or forced industrialization further exacerbate the scale effects oftrade liberalization.

5
Income effects
The gains from trade and trade-induced economic growth result in substantial incomeincreases which impact the environment in a variety of ways. First, higher incomes result in bothhigher levels of consumption and associated environmental externalities, and in higherwillingness to pay for environmental improvement, and associated increases in both private andpublic environmental expenditures. There is considerable empirical evidence that environmentalquality is income elastic, in the sense that increases in income result in more than proportionateincreases in environmental expenditures. Second, economic growth makes more resourcesavailable for environmental protection, and raises environmental quality in a country's list ofpriorities, prompting governments to increase environmental expenditures both in absolute termsand as a percentage of GDP. This is true of virtually all the newly industrializing countries (fromChina and South Korea to Mexico and Brazil). The reverse is also true, when income growthslows down (as after the recent Asian financial crisis), environmental expenditures tend to fallmore than proportionally.
Third, to the extent that trade and growth benefits are widely distributed, tradeliberalization may help reduce the pressures placed by poverty on the environment through theencroachment of natural resources. If, on the other hand, poor people (either rural or urban) arefurther marginalized by global competition without access to technology, capital and othermeans to compete, encroachment and degradation of natural resources (forest, pastures, fisheries,public lands) are likely to intensify. Trade liberalization may actually reinforce the vicious circlebetween poverty and environmental degradation, especially when open access resources,heretofore poor people's last resort source of livelihood, are now being exploited for exports.Ironically, economic collapse may not reduce the pressure on natural resources, if impoverishedurban dwellers return to the rural areas reclaiming their traditional sources of livelihood asindeed happened in Thailand and Indonesia following the recent financial crisis. Finally,economic growth may result in reform of environmental policies and enactment of new laws andregulations and new institutions to enforce them.
Studies of the relationship between income levels and environmental degradation, notcontrolling for scale and structural change effects, found an inverted U-shape relationship,especially for localized effects. (Grossman and Krueger, 1995, Panayotou 1997a). At low-income levels (early stages of development), income growth is associated with higher levels ofenvironmental degradation until a turning point is reached (between US$5,000-10,000) beyondwhich further income increases result in environmental improvement. This finding came to beknown as the Environmental Kuznets Curve, tends to suggest that environmental degradation is a"growing up" problem to be overcome through rapid economic growth rather than throughtargeted environmental policies. To the extent that free trade speeds up economic growth andraises per capita incomes, any restrictions on trade or diversions of resources away from export-led growth slow down the transition to a positive income-environment relationship.
This is clearly a misinterpretation of an empirical relationship that is devoid of policysignificance in its reduced form. First, it ignores the role of market and policy failures indetermining the level of environmental damage cost per additional unit of GDP, and the scopefor policy reform to reduce it. Second, it ignores threshold effects and the risk of irreversibleenvironmental damages were environmental degradation to cross such thresholds before reaching
6
the turning point. Third, current income levels of developing countries are nowhere close to theturning point, hence environment-intensive production would continue for a long time, resultingin significant and possibly irreversible environmental damage.
Policy formulation calls for a more analytical and disaggregated approach to the income-environment relationship. Once such attempt (Panayotou 1997a) decomposed the income-environment relationship into: (a) a scale effect which was found to be unambiguously negative;(b) a pure income effect which was found to be unambiguously positive, and a composition orstructural change effect which was found to be negative at earlier stages of development (shiftfrom agriculture into industry) and positive at later stages of development (shift from industry toservices). The speed of income growth was also found to matter, resulting in somewhat higherlevels of environmental degradation per unit of GDP. However, it was also found that effectivepolicy intervention is a potent means to reducing the environmental cost of growth at all stagesof economic development. Thus, while some deterioration of environmental quality is inevitablealong a country’s development path up to the turning point, policy interventions to removedistortions and mitigate market failures can reduce the environmental cost of growth and henceof trade and keep it at reversible levels below critical ecological thresholds.
Structural or Composition Effects
Globalization in general and freer trade in particular result in a shift in industrial structuremore in line with a country's comparative advantage. In the absence of market and policyfailures, the composition of output under free trade would be better suited to a country'senvironmental resource endowment than under austerity. Controlling for scale effects and forstage of development, trade liberalization tends to make the structure of the economy lesspollution-intensive to speed up the transition from resource extraction and processing to lightmanufacturing and eventually services. Since most developing countries are more richlyendowed in low-cost labor than any other factor of production, trade liberalization tends to shiftlabor-intensive activities to developing countries. Indeed, Hettige, Lucas and Wheeler (1992)found that toxic intensity increased more rapidly in inward-looking developing countries, whileoutward-oriented, high-growth developing countries had a slowly increasing or declining toxicintensity of manufacturing. They found that highly protected economies had experienced rapidgrowth in capital-intensive smokestack sectors, while more open economies had experiencedhigh growth in less pollution-intensive, more labor-intensive activities.
Developing countries may also have significant national resource endowments andincome-constrained demand for environmental quality. The extent to which trade liberalizationwould contribute to sustainable development, under these conditions, depends critically onwhether environmental assets are properly valued, and these values are somehow been taken intoaccount by world markets. Otherwise, trade liberalization may result in structural shifts towardsincreased specialization in unsustainable activities. A recent study by Strutt and Anderson (1998),however, found that, even under business as usual scenario (i.e., no change in resource pricing orenvironmental regulation), implementation of the Uruguay Round trade reforms would have apositive impact on natural resource in developing countries and most other regimes of the worldexcept for Western Europe where resource policies are well developed and can cope with anyincrease in resource exploitation (see Table 1).

7
Product and Technology Effects
Liberalized trade facilitates the diffusion of products, technologies and processes acrossborders. The environmental impacts of this diffusion depends on the characteristics of theproducts and technologies that are being diffused. The trade in products that are patentlyharmful to the environment such as toxic chemicals, hazardous waste, endangered species anddisease bearing pests is strictly regulated or prohibited by international conventions. A veryimportant channel through which globalization impacts the environment is the trade inenvironmentally preferred “producer” and “consumer” goods. The global market forenvironmental goods and services is around $300 billion annually and is expected to growrapidly (OECD 1996). Trade liberalization expands the potential market for both more efficientcapital equipment and “cleaner” production technologies on the production side and “greener”products, such as organic foods, low-emission vehicles and recyclables, on the consumption side.
While other dimensions of globalization, such as investment, intellectual property rightsand economic integration have technology implications that impact the environment, three-quarters of all technology transfer arise from trade flows (OECD 1995), especially the trade inmachinery and equipment, which amounts to almost 40 percent of total global trade (UN 1996).These trade flows result in diffusion of more efficient (and one hopes cleaner) technologies:almost 80 percent of the global trade in machinery and equipment comes from developedcountries and about a third is imported by developing countries (UN 1996). Technologydiffusion also takes place through the trade in services such as engineering and consultingservices and technology licensing.
Table 1. Percentage changes in resource-sector output levels in various regions of theworld following Uruguay Round trade reform (including China), 2010
Indonesia Other APECdevelopingeconomies
Otherdeveloping &
transitioneconomies
APEC high-income
economies
Other high-income
economies(W. Europe)
Total World
Paddy rice -0.3 2.9 -1.3 -1.0 -3.1 0.48
Non-grain crops -4.6 4.3 -0.4 2.0 -2.9 0.59
Livestock 0.1 -1.4 -1.6 0.9 1.2 -0.06
Forestry -1.1 -0.7 -0.1 -0.0 1.9 -0.03
Fisheries -0.7 -7.4 0.1 -0.4 5.1 -0.21
Coal -7.1 -0.6 0.2 -0.3 1.0 -0.03
Oil -3.3 -2.9 0.2 0.1 0.4 -0.04
Gas -3.4 -1.4 0.1 0.5 0.1 0.06
Other minerals -5.2 -5.0 -1.4 -1.4 1.9 -0.39
Source: Strutt and Anderson (1998)
8
Liberalized trade contributes not only to technology diffusion and transfer but also totechnological progress through economies of scale, enhanced incentives to innovate and lessduplication of research and development efforts due to fewer protectionist barriers (Grossmanand Helpman 1995).
Does the trade-induced generation and diffusion of technology benefits or harms theenvironment? The technology-environment relationship is a complex one consisting of bothdemand and supply factors and policy effects. On the demand side, pressures by regulators,customers, shareholders and the community drive firms to demand technology withenvironmental characteristics such as "cleaner" production technology and pollution-abatementequipment. While regulatory and community pressures usually aim at process characteristics,customers pressure is directed towards product characteristics. Studies of firm behavior indeveloped countries tend to find regulatory pressure as the most potent driver ofenvironmentally-preferred technologies (e.g. Henriques and Sadorsky,1996) while studies offirm behavior in developing countries tend to find community pressures as the most importantdeterminant of firms' environmental behavior (Pargal and Wheeler, 1995; Panayotou et al 1997).On the supply side, environment-related technological change is driven by abatement costs andthe ability of innovating firms to benefit from environmental damage mitigation (which in turndepends on the regulatory regime) and to appropriate the benefits from innovation with widerapplications (which in turn depends on the intellectual property right regime). According toJohnstone (1997), in addition to these factors the level of industrial research and development islikely to be an important factor in the supply of environment-relevant technological innovations.Indeed, Nentjes and Wiersma (1987) found that the most active industries in environment relatedR&D were the chemicals, petroleum and machinery and vehicles.
Finally, environmental policy plays a key role in both the technological innovation.Clarity, predictability and stability of environmental policy are critical for the necessaryinvestments to take place. Equally important is the flexibility of the policy instruments to allowfirms to seek the least-cost methods of compliance, to take advantage of costs differentials inpollution abatement and to benefit from continuous innovation. In this regard, market-basedinstruments such as pollution taxes and tradable permits have significant advantage overcommand and control regulations. The case has also been made for a mixed system of pollutiontaxes to internalize the negative environmental externality of pollution and technologicalinnovation subsidies to encourage the positive technological innovation externality (Johnstone1997).
Regulatory effects
The regulatory effects of trade liberalization on the environment arise from (a) improvedenvironmental policies, standards and enforcement in response to economic growth fromenhanced trade; (b) environmental measures included in trade agreements; and (c) relaxation ofexisting environmental policies due to specific trade pressures or restrictions on environmentalpolicies by trade agreements.
With regard to the first effect above, World Bank research based on data from 145countries has found a positive association between economic growth and environmental

9
regulation and security of property rights. With regard to the second effect, NAFTAdemonstrates how trade liberalization can serve as a catalyst for improvements in both the leveland the enforcement of environmental regulations. Trade agreements in general may promoteharmonization of environmental standards and influence policies towards environmentalsubsidies and environment-related fiscal and trade measures. While the multilateral tradingsystem encourages the use of international standards, and allows for higher levels ofenvironmental protection, there is a widespread fear that trade liberalization and the resultingstrife for competitiveness would "drag down" environmental standards in a race towards thebottom. There is no evidence that this has happened thus far.
Empirical evidence
There are many analytical studies of the effects of trade liberalization on the environment(e.g. Bhagwati and Srinivasan 1997) but few empirical studies. A recent OECD (Sprenger,1997) study has simply indicated the likely direction of the various impacts. The scale ofeconomic activity has, as one would expect, unambiguously detrimental effects on theenvironment while technology and income have beneficial effects (see Table 2). Since theseeffects are in opposite direction and the remaining impacts (structural and product effects) areambiguous, it is not possible to determine the net effect of trade on the environment in theabsence of quantitative assessment of these impacts.
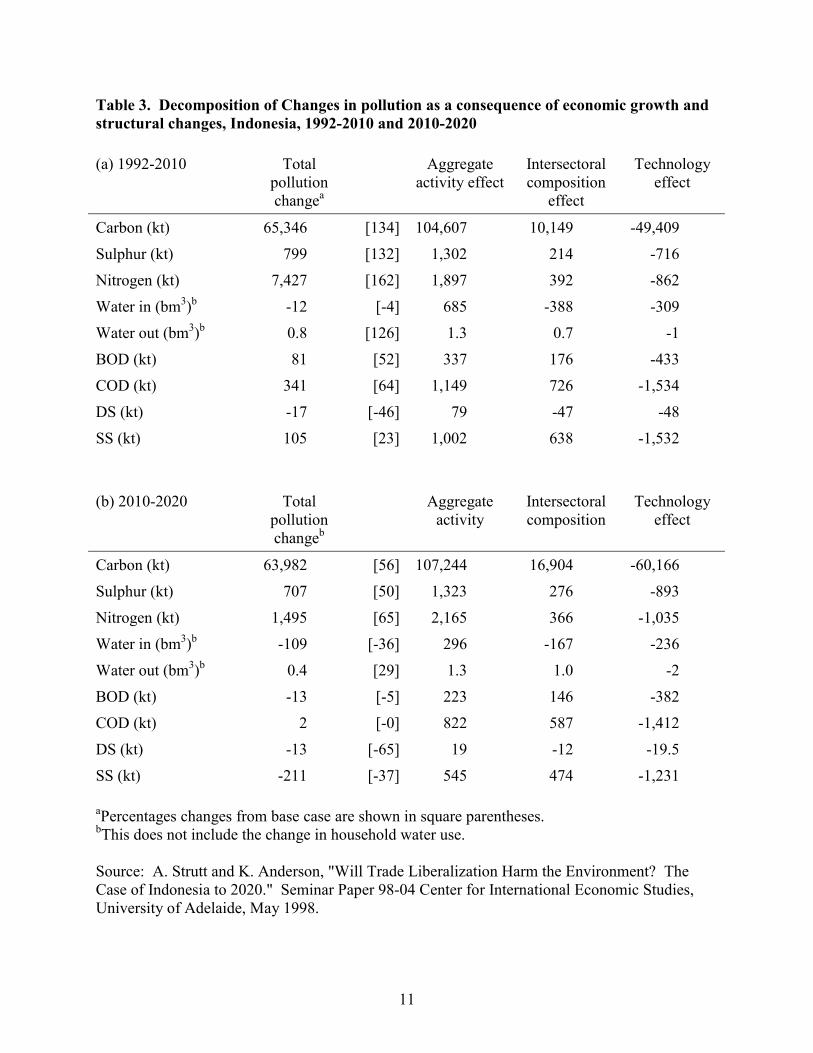
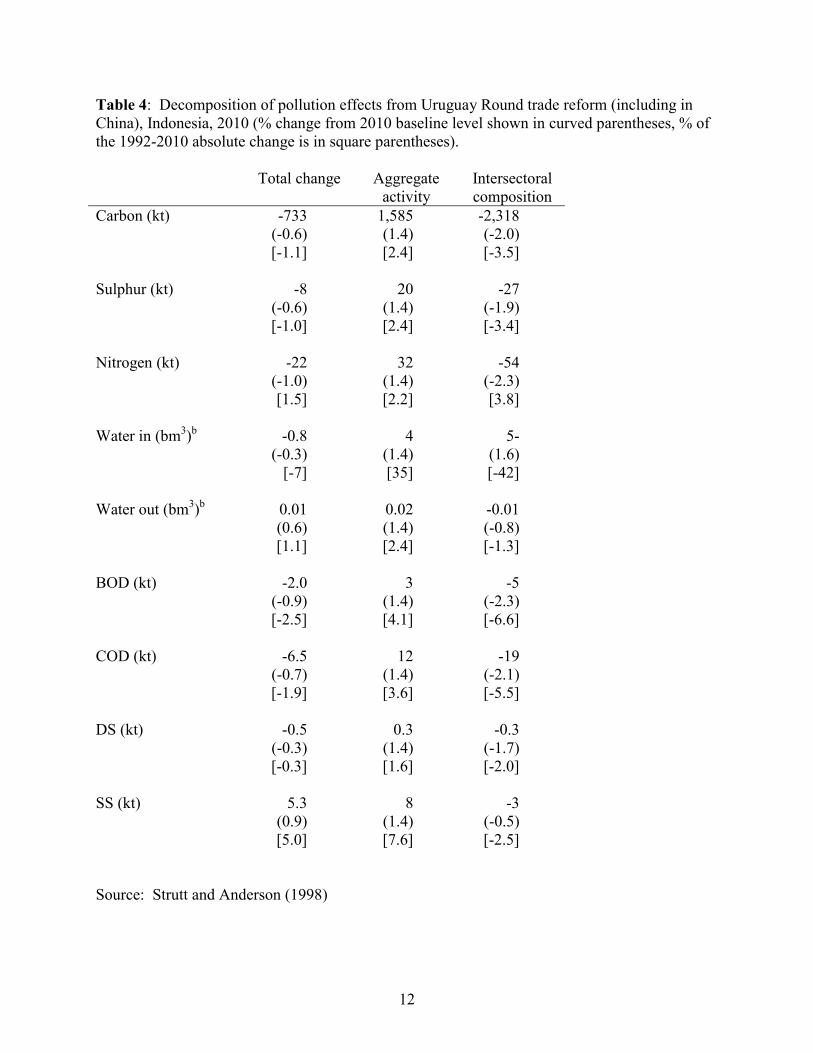
One attempt to quantify the effects of trade liberalization on the environment is a recentstudy by Strutt and Anderson (1998) on Indonesia. Using a modified version of the globalgeneral equilibrium model (GGE) known as GTAP they project the world economy to 2010 and2020 with and without trade reforms. The effects of trade liberalization on the Indonesianenvironment (air and water pollution) are traced through a special environmental moduleattached to the Indonesian part of the GTAP. They, then, identify the effects on key air andwater quality indicators of changes in the level and consumption of output and in productiontechnology arising from (a) full global implementation of Uruguay Round commitments by 2010and (b) additional move to MFN free trade by APEC countries by 2020. Without the tradereforms, the aggregate activity (scale) effects of economic growth on pollution are, as expected,positive and the technology effect negative; the intersectoral composition (or structural effectsare mixed but mostly positive (see Table 3). The scale effects dominate. The implementation ofthe Uruguay Round trade reforms result in intersectoral composition (structural change) effectsthat dominate the scale effect, and result in reduction in pollution levels except for suspendedsolids (see Table 4). The authors conclude for Indonesia that "trade policy reforms slated for thenext two decades in many cases would improve the environment (at least with respect to air andwater pollution) and reduce the depletion of natural resources, and in the worst cases add onlyslightly to environmental degradation and resource depletion even without toughening theenforcement of environmental regulations or adding new ones. The economic gains from thetrade reforms and the scope for adopting well-targeted environmental and resource policies toreduce any serious damage are such that the social welfare almost certainly is going to beimproved substantially by these liberalizations” (Strut and Anderson 1998, p. 13-14).

10
Table 2. "Most Likely" impacts of trade liberalization on employment and environment inOECD (home) countries
Anticipatedpollution/resource use
effects . . .Globalization-relatedactivity Anticipated economic effects
Anticipatedemployment
effects . . . athome
. . . ontransboundary
transportInternational Trade• Scale effects Change in the volume of exports
and imports; increase in cross-border transport
(+,-) (+) (+)
• Structural effects Change in the composition ofexports and imports; increase incross-border transport
(+,-) (+,-) (+,-)
• Product effects Change in the composition ofexports and imports; increase incross-border transport
(+,-) (+,-) (+,-)
• Technology effects Change in the composition ofexports and imports; increase incross-border transport
(+,-) (-) (-)
Source: Sprenger, Rolf-Ulrich "Globalization, Employment and Environment" OECD Proceedings,OECD Paris 1997.
11
Table 3. Decomposition of Changes in pollution as a consequence of economic growth andstructural changes, Indonesia, 1992-2010 and 2010-2020
(a) 1992-2010 Totalpollutionchangea
Aggregateactivity effect
Intersectoralcomposition
effect
Technologyeffect
Carbon (kt) 65,346 [134] 104,607 10,149 -49,409
Sulphur (kt) 799 [132] 1,302 214 -716
Nitrogen (kt) 7,427 [162] 1,897 392 -862
Water in (bm3)b -12 [-4] 685 -388 -309
Water out (bm3)b 0.8 [126] 1.3 0.7 -1
BOD (kt) 81 [52] 337 176 -433
COD (kt) 341 [64] 1,149 726 -1,534
DS (kt) -17 [-46] 79 -47 -48
SS (kt) 105 [23] 1,002 638 -1,532
(b) 2010-2020 Totalpollutionchangeb
Aggregateactivity
Intersectoralcomposition
Technologyeffect
Carbon (kt) 63,982 [56] 107,244 16,904 -60,166
Sulphur (kt) 707 [50] 1,323 276 -893
Nitrogen (kt) 1,495 [65] 2,165 366 -1,035
Water in (bm3)b -109 [-36] 296 -167 -236
Water out (bm3)b 0.4 [29] 1.3 1.0 -2
BOD (kt) -13 [-5] 223 146 -382
COD (kt) 2 [-0] 822 587 -1,412
DS (kt) -13 [-65] 19 -12 -19.5
SS (kt) -211 [-37] 545 474 -1,231
aPercentages changes from base case are shown in square parentheses.bThis does not include the change in household water use.
Source: A. Strutt and K. Anderson, "Will Trade Liberalization Harm the Environment? TheCase of Indonesia to 2020." Seminar Paper 98-04 Center for International Economic Studies,University of Adelaide, May 1998.
12
Table 4: Decomposition of pollution effects from Uruguay Round trade reform (including inChina), Indonesia, 2010 (% change from 2010 baseline level shown in curved parentheses, % ofthe 1992-2010 absolute change is in square parentheses).
Total change Aggregateactivity
Intersectoralcomposition
Carbon (kt) -733(-0.6)[-1.1]
1,585(1.4)[2.4]
-2,318(-2.0)[-3.5]
Sulphur (kt) -8(-0.6)[-1.0]
20(1.4)[2.4]
-27(-1.9)[-3.4]
Nitrogen (kt) -22(-1.0)[1.5]
32(1.4)[2.2]
-54(-2.3)[3.8]
Water in (bm3)b -0.8(-0.3)
[-7]
4(1.4)[35]
5-(1.6)[-42]
Water out (bm3)b 0.01(0.6)[1.1]
0.02(1.4)[2.4]
-0.01(-0.8)[-1.3]
BOD (kt) -2.0(-0.9)[-2.5]
3(1.4)[4.1]
-5(-2.3)[-6.6]
COD (kt) -6.5(-0.7)[-1.9]
12(1.4)[3.6]
-19(-2.1)[-5.5]
DS (kt) -0.5(-0.3)[-0.3]
0.3(1.4)[1.6]
-0.3(-1.7)[-2.0]
SS (kt) 5.3(0.9)[5.0]
8(1.4)[7.6]
-3(-0.5)[-2.5]
Source: Strutt and Anderson (1998)

13
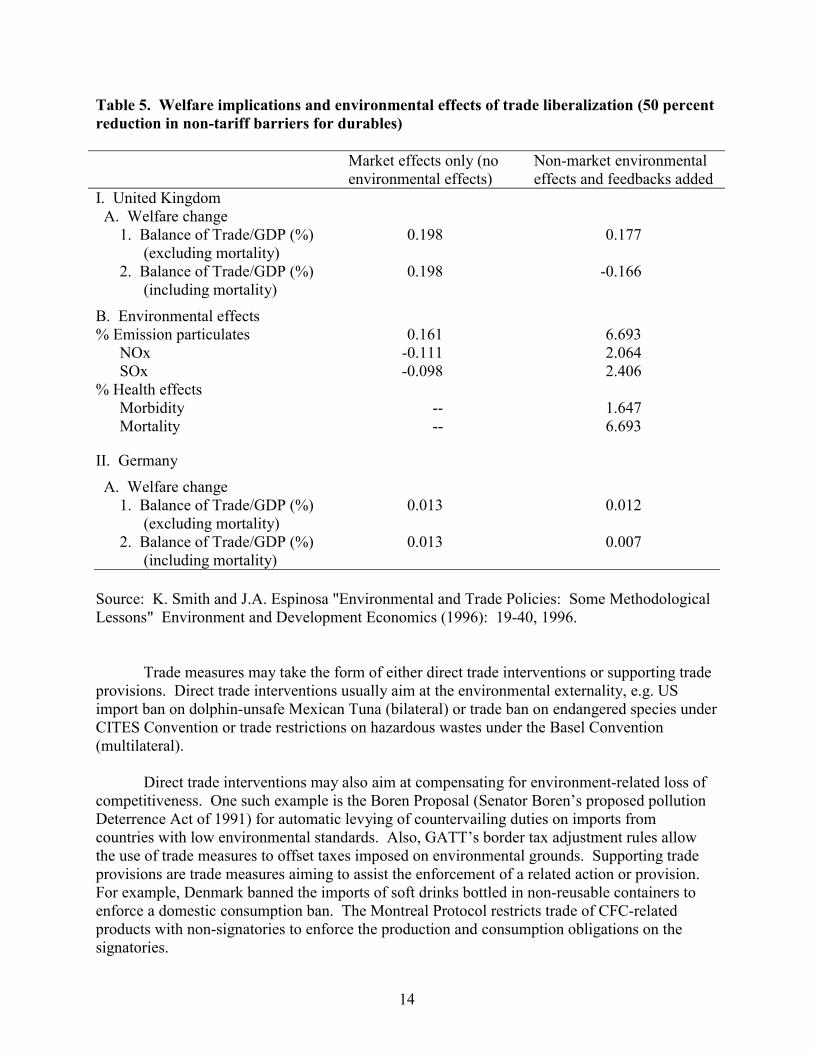
The commonly used Strut and Anderson approach of using a side environmental module,rather than a fully integrated emissions-damage-abatement feedback system, has been criticizedby Smith and Espinosa (1996). The latter using a new GGE model for the European Union thatincorporates local and transboundary externalities illustrates how environmental and tradepolicies become intertwined. The model is extended to include three air pollutants (PM, NOx,SOx) and their health effects on influences on household preferences. They then evaluate thewelfare implications of a 50 percent reciprocal reduction of non-tariff barriers for durables tradedbetween UK and each of its EU trading partners, combined with a 25 percent increase inemission rates reflecting the entry of marginal plants in response to trade liberalization. Whenthe effects of emissions on morbidity, and of morbidity on labor endowments and thresholddemand for services are ignored, the balance of trade to GDP ratio is positive. When the incomeand substitution effects of health damages from pollution are considered (including mortality) thewelfare implication of the 50 percent reduction in non-tariff barriers (as measured by the ratio ofbalance of trade to GDP) turns negative (see Table 5). Ignoring the air-pollution induced effectson morbidity results in 12 percent overstatement of the gains relative to GDP. Thus when thegains from trade are considered, trade liberalization enhances social welfare, if theaccompanying increase in air pollution and its health effects are considered, there may be netwelfare loss, depending on the magnitude of increase, the sector affected and the nature ofenvironmental impacts.
Allowing for the environmental impacts of emissions and their feedbacks to the economyvia revaluation of endowments or changes in rents and substitutions for other marketed goods,result also in larger increase in emissions. As shown in section B of Table 5, in the absence ofexogenously specified increase in emissions, trade liberalization (50 percent reduction in non-tariff barriers) result in 3 times higher increase in particulates and an increase rather than areduction in NOx and SOx. It is also of interest that Germany, a UK trading partner, enjoyssmaller welfare gains from trade when the impact of the increased output on emissions and thetransboundary effects of emissions from the UK on Germany are considered (see Table 5).
Is there a Case for Trade Measures to Protect the Environment?1
As GATT has gone beyond tariffs, quotas and other border instruments to be concernedwith internal policies and measures such as standards, production subsidies, and intellectualproperty rights, environmental concerns and policies began to be projected beyond nationalborders even when no transboundary or global impacts are involved. Whether the underlyingmotivation is to counter "unfair trade" practices, to disguise protectionism or to advance agenuine environmental concern, trade contraction, rather than trade expansion has come to beviewed as the way to go. For example, Subramanian (1992) reports that "of the 48 bills onenvironmental matters introduced in the 101st Congress in the United States, 33 includedprovisions affecting international trade of which 31 took the form of restrictive trade measures. "(p. 135).
1 It draws heavily on Subramanian (1992).
14
Table 5. Welfare implications and environmental effects of trade liberalization (50 percentreduction in non-tariff barriers for durables)
Market effects only (noenvironmental effects)
Non-market environmentaleffects and feedbacks added
I. United Kingdom A. Welfare change
1. Balance of Trade/GDP (%)(excluding mortality)
0.198 0.177
2. Balance of Trade/GDP (%)(including mortality)
0.198 -0.166
B. Environmental effects% Emission particulates 0.161 6.693
NOx -0.111 2.064SOx -0.098 2.406
% Health effectsMorbidity -- 1.647Mortality -- 6.693
II. Germany
A. Welfare change1. Balance of Trade/GDP (%)
(excluding mortality)0.013 0.012
2. Balance of Trade/GDP (%)(including mortality)
0.013 0.007
Source: K. Smith and J.A. Espinosa "Environmental and Trade Policies: Some MethodologicalLessons" Environment and Development Economics (1996): 19-40, 1996.
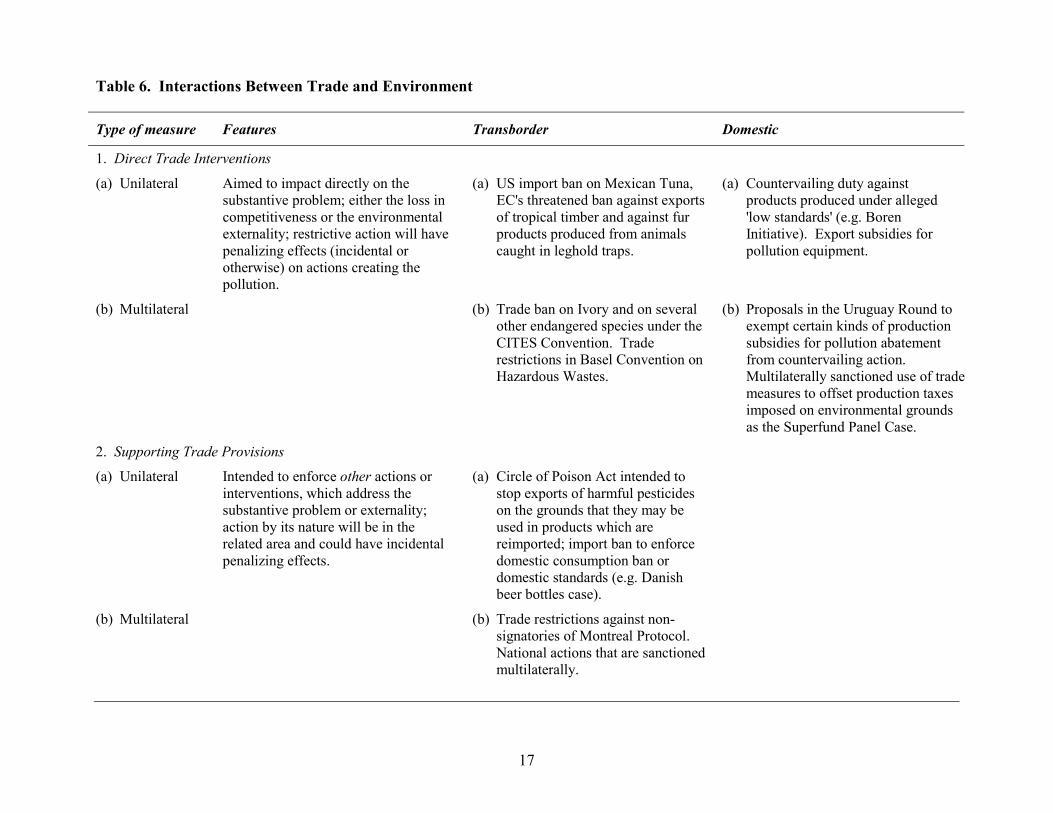
Trade measures may take the form of either direct trade interventions or supporting tradeprovisions. Direct trade interventions usually aim at the environmental externality, e.g. USimport ban on dolphin-unsafe Mexican Tuna (bilateral) or trade ban on endangered species underCITES Convention or trade restrictions on hazardous wastes under the Basel Convention(multilateral).
Direct trade interventions may also aim at compensating for environment-related loss ofcompetitiveness. One such example is the Boren Proposal (Senator Boren’s proposed pollutionDeterrence Act of 1991) for automatic levying of countervailing duties on imports fromcountries with low environmental standards. Also, GATT’s border tax adjustment rules allowthe use of trade measures to offset taxes imposed on environmental grounds. Supporting tradeprovisions are trade measures aiming to assist the enforcement of a related action or provision.For example, Denmark banned the imports of soft drinks bottled in non-reusable containers toenforce a domestic consumption ban. The Montreal Protocol restricts trade of CFC-relatedproducts with non-signatories to enforce the production and consumption obligations on thesignatories.

15
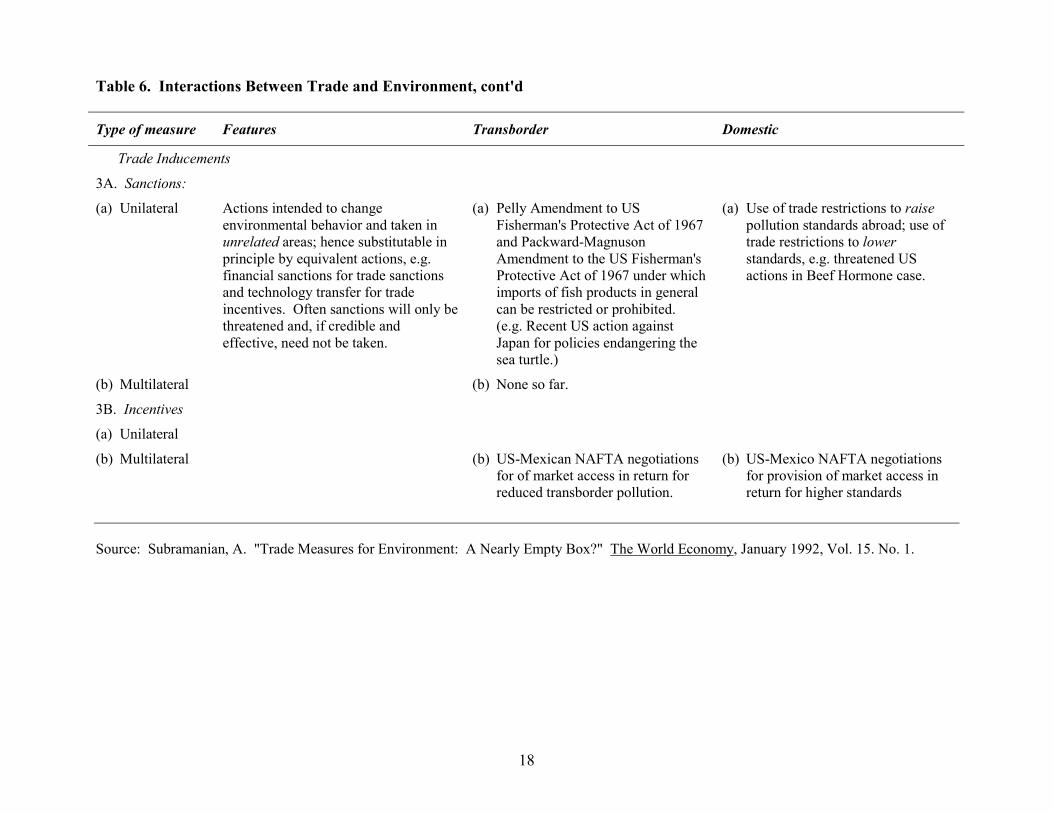
Trade measures may also be used as rewards and punishments for inducing achange in environmental behavior, participation in an international environmentalagreements or compliance with its provisions. They may take the form of sanctions as inthe case of the Pelly Amendment which authorizes trade measures against unrelatedproducts for failing to observe US tuna fishing methods. Sanctions have also beenthreatened against countries to force them to raise or lower their standards. For example,the US has threatened withdrawal of concessions to EU to force it to lower its hormonestandards on beef products. Finally trade inducements may take the form of incentives asin the case of NAFTA, whereby Mexico is provided with increased market access inexchange for raising its environmental standards, in general, and for reducing transborderpollution, in particular.
Are all the above uses of trade measures in the name of the environment(summarized in Table 6) justified or do they constitute disguised protectionism at worst, orinefficient instruments at best? Subramanian (1992) analyzed the use of trade measuresfor the environment and reached the following conclusions: First, with regards todomestic environmental problems, the use of trade measures aims to negate a source ofcomparative advantage which is legitimately "conferred by differences in environmentalendowments, pollution assimilation capacities, or social preferences regardingenvironmental outcomes" (Subramanian 1992, p. 151). Therefore the intent of trademeasures in relation to domestic environmental problems is largely protectionist.
Second, with regard to transboundary environmental problems trade measures areinefficient and often inequitable instruments for correcting market failures. Assignment ofproperty rights, creation of markets and production or consumption interventions aresuperior to trade interventions. Trade restrictions imply unilateral allocation of propertyrights which may also be unfair to poor countries and counterproductive for environmentaloutcomes if income and environmental quality are positively related.
Third, trade measures have, however, a useful role to play in securing participationin compliance with multilateral environmental agreements. The threatened use of tradesanctions may be sufficient to alter the behavior of would-be free riders. In general, theuse of trade restrictive measures for environmental purposes is generally more legitimatewhen it is multilateral and aims at enlisting participation and compliance for addressingglobal environmental problems. Appendix Table A.1 lists selected Multilateral TradeAgreements with possible trade effects or trade measures aiming to protect theenvironment (e.g. CITES) or to secure compliance (e.g. Montreal Protocol).

17
Table 6. Interactions Between Trade and Environment
Type of measure Features Transborder Domestic
1. Direct Trade Interventions
(a) Unilateral Aimed to impact directly on thesubstantive problem; either the loss incompetitiveness or the environmentalexternality; restrictive action will havepenalizing effects (incidental orotherwise) on actions creating thepollution.
(a) US import ban on Mexican Tuna,EC's threatened ban against exportsof tropical timber and against furproducts produced from animalscaught in leghold traps.
(a) Countervailing duty againstproducts produced under alleged'low standards' (e.g. BorenInitiative). Export subsidies forpollution equipment.
(b) Multilateral (b) Trade ban on Ivory and on severalother endangered species under theCITES Convention. Traderestrictions in Basel Convention onHazardous Wastes.
(b) Proposals in the Uruguay Round toexempt certain kinds of productionsubsidies for pollution abatementfrom countervailing action.Multilaterally sanctioned use of trademeasures to offset production taxesimposed on environmental groundsas the Superfund Panel Case.
2. Supporting Trade Provisions
(a) Unilateral Intended to enforce other actions orinterventions, which address thesubstantive problem or externality;action by its nature will be in therelated area and could have incidentalpenalizing effects.
(a) Circle of Poison Act intended tostop exports of harmful pesticideson the grounds that they may beused in products which arereimported; import ban to enforcedomestic consumption ban ordomestic standards (e.g. Danishbeer bottles case).
(b) Multilateral (b) Trade restrictions against non-signatories of Montreal Protocol.National actions that are sanctionedmultilaterally.
18
Table 6. Interactions Between Trade and Environment, cont'd
Type of measure Features Transborder Domestic
Trade Inducements
3A. Sanctions:
(a) Unilateral Actions intended to changeenvironmental behavior and taken inunrelated areas; hence substitutable inprinciple by equivalent actions, e.g.financial sanctions for trade sanctionsand technology transfer for tradeincentives. Often sanctions will only bethreatened and, if credible andeffective, need not be taken.
(a) Pelly Amendment to USFisherman's Protective Act of 1967and Packward-MagnusonAmendment to the US Fisherman'sProtective Act of 1967 under whichimports of fish products in generalcan be restricted or prohibited.(e.g. Recent US action againstJapan for policies endangering thesea turtle.)
(a) Use of trade restrictions to raisepollution standards abroad; use oftrade restrictions to lowerstandards, e.g. threatened USactions in Beef Hormone case.
(b) Multilateral (b) None so far.
3B. Incentives
(a) Unilateral
(b) Multilateral (b) US-Mexican NAFTA negotiationsfor of market access in return forreduced transborder pollution.
(b) US-Mexico NAFTA negotiationsfor provision of market access inreturn for higher standards
Source: Subramanian, A. "Trade Measures for Environment: A Nearly Empty Box?" The World Economy, January 1992, Vol. 15. No. 1.

19
Environment and Trade
Do environmental regulations act as barriers to trade? Do multilateral trade rules permitrestrictions of trade for environmental purposes?
Globalization in general and trade liberalization in particular has accorded previously purelydomestic policies international importance. Included among such policies are competition policy,intellectual property rights and environmental policy. Furthermore, the reduction of tariff barriershas heightened the relative importance of non-tariff barriers as potential constraints on trade. At thesame time, protectionist forces having lost the use of tariff barriers are inclined to focus theirattention on non-tariff barriers. Environmental concerns, because of their emotive nature are a primecandidate. This in turn has raised concerns that some environmental measures might be disguisedprotectionism? Sorting out legitimate environmental policy from disguised protectionism is noteasy. For example, some environmental regulations such a tax on imported large cars or a subsidyfor pollution abatement afford protection to domestic producers and reduce imports.
Multilateral trade rules make a fundamental distinction between (a) products standardsand (b) process and production methods (PPM’s). The two are treated very differently: nationalrequirements on product standards and product-related PPM’s are allowed, on non-productrelated PPM’s they are not. We examine these in turn.
Product Standards
Multilateral trade rules permit national requirements for products to meet certainenvironmental, safety, and health standards provided that they are transparent and non-discriminatory between domestic and foreign sources. Taxes and charges for environmental or otherresources are permitted to be imposed on important products and to except exports as an applicationof the principle of national sovereignty. Border adjustments are permitted: the consumption of aproduct that can cause environmental damage may be taxed provided that the tax is applied in atransparent and non-discriminatory manner. Packaging and recycling requirements are morecontroversial as they are part of a domestic-focused waste reduction policy that can impose highercosts on importers; as such it is acting as a non-trade barrier to trade. The trade effects of this policycan be mitigated by giving advanced notice to allow foreign suppliers to adjust.
Given their direct impacts on trade, product standards are prime candidates forharmonization. Two agreements of the WTP system, the Agreement on Technical Barriers toTrade and the Agreement on Application of Sanitary and Phytosanitary Measure encourageharmonization of product standards and where possible, adherence to international standards.
Process and Production Methods2
How natural resources are extracted or products are produced can have significantenvironmental impacts which countries attempt to control through harvesting restrictions,emission controls and specified production techniques. Extending such production-methods-
2 Based on Adams (1997).
20
based standards (or taxes and charges) to imported products raise trade issues and conflict withthe principle of national sovereignty: one country attempts to enforce a particular productionmethod (that does not affect the final product) on another country.
If the method of production affects the characteristic of the imported product, border taxadjustments are allowed under WTO rules, i.e. product-related PPM’s are treated in the sameway as product standards. Charges or standards on non-product related PPM's (i.e. onproduction methods that do not affect the product characteristics) violate the principle that “likeproducts” must be accorded “like treatment,” and are prohibited by WTO rules. Border taxadjustments or countervailing duties for non-product related PPM’s are not allowed, i.e. theprices of imported products cannot be adjusted for the extra cost incurred by the domesticindustry operating under such requirements.
Thus, differences in domestic environmental policies are seen as part of the manyvariations that constitute a country’s comparative advantage and do not justify compensatinglevies or export rebates to offset price differences. Where transboundary and globalenvironmental issues are concerned harmonization of non-product PPM requirements may benecessary, at least on a consensual basis, as in the context of regional or multilateral agreement.An interesting issue currently under consideration is the potential for using border taxadjustments in combination with domestic process taxes to reduce greenhouse gases (Adams1997).
In conclusion, unlike “product standards,” “methods standards” are not candidates forharmonization; it would be both more difficult to do so and less beneficial. While someconvergence is to be expected over time, production methods and solutions to localenvironmental problems are best tailored to local conditions. Yet the globalization ofenvironmental concerns such as tropical deforestation and biodiversity loss pits the emergingproduct life-cycle perspective whereby consumers want to know the overall environmentalcharacteristics of the products they buy against conventional notions of national sovereignty andof products as their physical characteristics (Adams 1997).
Does Environmental Policy Influence the Pattern of Trade?
Since differences in environmental policies and standards and their enforcement istranslated into production cost differences, it is a legitimate concern that such differences mayalter the pattern of trade. There is substantial evidence, however, that differences inenvironmental standards and environmental control costs have had very limited effect on tradepatterns. The main reason is that environmental control costs are a very small fraction ofproduction costs. Any comparative advantage created by lax environmental standards isoverwhelmed by other sources of comparative advantage such as differences in resourceendowments, technologies, human and physical capital, infrastructure and the macroeconomicpolicy environment. For example, Walter (1973) found that environmental control costs (ECC)amounted, on average, to 1.75% of the total value of US exports and 1.52% of US imports.Robison (1988) estimates the average EEC as a share of total exports as 0.37% in 1973 and0.72% in 1982 and finds that a doubling in EEC sots has negligible impacts on output and trade;the trade balance is reduced by only 0.67%. Low (1992) has found that the traditionally lenient

21
environmental standards in Mexico did not result in specialization in dirty industries. Grossmanand Krueger (1993) found that pollution abatement costs in the US have not affected US importsfrom Mexico. If this is the case with Mexico and the US, which share a long common border,have a large volume of trade, and have substantially different environmental standards, it isunlikely that environmental regulations have a significant impact on net exports in other caseseither.
Another test of the relationship between environmental regulations and competitivenessis whether an increasing share of trade in pollution-intensive products comes from developingcountries, which on the whole have more relaxed environmental laws (or more lax enforcement).While the share in world trade of pollution-intensive products from North America fell from 21to 14 percent and that of Southeast Asia rose from 3 to 8 percent during 1965-1988 (Low andYeats 1992), these trends are more indicative of increased demand for pollution-intensiveproducts in newly industrializing countries than any shift of pollution-intensive production todeveloping countries.
Capital Flows, Foreign Investment and Environment
Capital flows in general, and direct foreign investment in particular, are majorchannels through which globalization impacts the environment. Foreign investment is amajor vehicle of economic integration, technology diffusion and trade expansion. Globally,capital flows are larger than trade flows. Nearly 20 billion US dollars a day or 7 billiondollars a year cross national borders. Private capital flows to developing countries in 1996were six times the official development assistance (ODA), accounting for 86 percent of thetotal capital flows to these countries (World Bank 1997). Unlike ODA, which has beensteadily falling, private capital flows have been rising steadily right up to the recent financialcrisis. Private capital flows are driven by the opportunity to earn a commercial return. Theseopportunities have increased considerably in the past decade as an increasing number ofcountries assume a greater market orientation and began to privatize state enterprises and towelcome foreign investment.
However, private capital flows, being motivated by market opportunities rather thancapital needs or developing priorities, tend to be concentrated in a dozen or so emergingeconomies and to avoid poor countries with high risk and undeveloped institutions and poorinfrastructure. Moreover, private capital flows are not usually guided by sustainabilityconsiderations and are indeed very volatile and sensitive to changing market conditions.Furthermore, there is little information available about their environmental and social impacts.
Of the nearly 280 billion US dollars of private capital flows to developing countries, 45percent were accounted by foreign direct investment, 33 percent by debt finance and 19 percent byportfolio equity investments. Foreign direct investment (FDI) goes mostly into manufacturingplants, mining development, power stations, telecommunications, port development, airport androad construction, water supply, and sanitation, all of which have environmental and naturalresource use implications. As such, FDI has the most direct and pronounced links to and effects onthe environment and sustainable development. It is also a primary vehicle of technology transfer.Portfolio equity investments have only indirect links to the environment through their effect on the

22
value of companies that they are directed to. If they build up the value of companies with highenvironmental performance, they have positive impacts; if instead, they put pressure for short-termprofitability, they create disincentive for environmental performance. Debt financing orcommercial lending to private companies gives the lender a stake in the borrower's financialperformance, which may be affected by environmental risks. This is not usually the case withinvestors in government bonds since the governments' solvency is usually unrelated to itsenvironmental performance (Gentry et al 1996).
Private capital flows are highly concentrated (Table 7). Developing countries received onlyabout a quarter of global FDI and portfolio flows, and within the developing world, twelve countriesin Asia, Latin America and Eastern Europe received 80 percent of the total flows to developingcountries; sub-Saharan Africa, arguably the region with the greatest need for capital infusion, re-ceived only 2 percent of these flows. At the other extreme, China receives more than half of all FDIthat goes to Asia and a third of the global capital flows to developing countries.
What does the rapid growth of private flows mean for sustainable development? First, pri-vate capital flows are not a substitute for ODA, since poor countries that need them most attract theleast. Moreover, private investment is not automatically channeled to sustainable development ac-tivities. To the contrary, the social and environmental areas traditionally have been among the ac-tivities least attracted to foreign investors, partly because of government regulations that limitedforeign (and even domestic) private sector involvement. Moreover, without enforcement of envi-ronmental regulations and freedom to charge user fees or raise tariffs to cover costs (including anacceptable reform to capital), these sectors are not attractive to private capital.
However, during the past five to seven years, a number of positive changes, such as deregu-lation, privatization, and financial innovation have increased the availability and attractiveness ofthese sectors to both domestic and foreign private capital. The development of innovative financingstrategies such as build-own-transfer (BOT), build-own-operate (BOO), and build-own-lease (BOL),etc. have made it possible for the private sector to enter into infrastructure development, while theincreased use of competitive bidding, coupled with environmental performance bonds or bank guar-antees has improved the efficiency and environmental performance of FDI and hence its contributionsto sustainable development. The past five years have witnessed a strong trend toward privatization ofstate-owned enterprises and public utilities, concessions to private developers of infrastructureinducing power generation, transportation, water supply and sanitation, and waste treatment, amongothers. The privatization of electric utilities in Argentina and concessions to private developers forpublic transport and waste management in Thailand and for water and sanitation in the Philippines arecases in point. Indeed, there is a clear trend in the 1990s of FDI shifting from resource extractiveindustries to environmental services that are generally more environmentally benign.
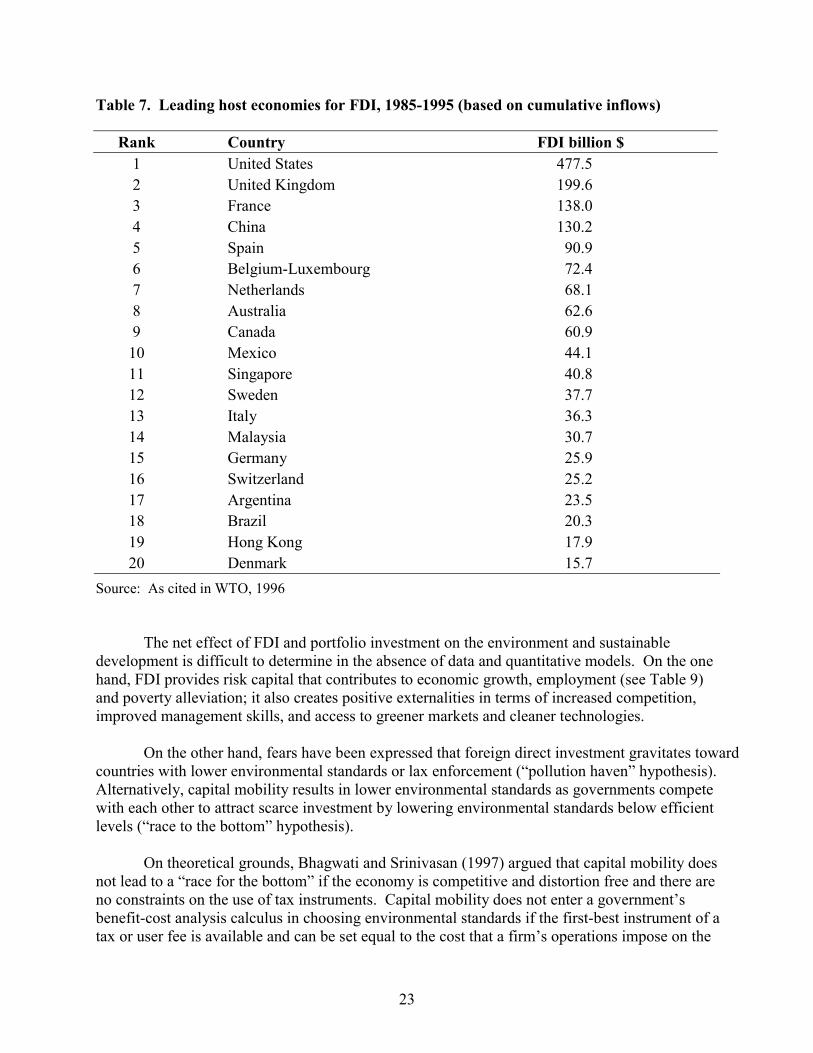
23
Table 7. Leading host economies for FDI, 1985-1995 (based on cumulative inflows)
Rank Country FDI billion $1 United States 477.52 United Kingdom 199.63 France 138.04 China 130.25 Spain 90.96 Belgium-Luxembourg 72.47 Netherlands 68.18 Australia 62.69 Canada 60.910 Mexico 44.111 Singapore 40.812 Sweden 37.713 Italy 36.314 Malaysia 30.715 Germany 25.916 Switzerland 25.217 Argentina 23.518 Brazil 20.319 Hong Kong 17.920 Denmark 15.7
Source: As cited in WTO, 1996
The net effect of FDI and portfolio investment on the environment and sustainabledevelopment is difficult to determine in the absence of data and quantitative models. On the onehand, FDI provides risk capital that contributes to economic growth, employment (see Table 9)and poverty alleviation; it also creates positive externalities in terms of increased competition,improved management skills, and access to greener markets and cleaner technologies.
On the other hand, fears have been expressed that foreign direct investment gravitates towardcountries with lower environmental standards or lax enforcement (“pollution haven” hypothesis).Alternatively, capital mobility results in lower environmental standards as governments competewith each other to attract scarce investment by lowering environmental standards below efficientlevels (“race to the bottom” hypothesis).
On theoretical grounds, Bhagwati and Srinivasan (1997) argued that capital mobility doesnot lead to a “race for the bottom” if the economy is competitive and distortion free and there areno constraints on the use of tax instruments. Capital mobility does not enter a government’sbenefit-cost analysis calculus in choosing environmental standards if the first-best instrument of atax or user fee is available and can be set equal to the cost that a firm’s operations impose on the

24
country. This cost includes the cost of providing public goods and services to the firm as well asthe use of the environment for waste disposal (environmental cost). Weaker environmentalstandards may attract additional (foreign) investment but this will neither benefit nor harm thecountry since firms subject to an optimal (Pigovian) tax fully and efficiently compensate thecountry for any environmental cost associated with their investment (Bhagwati and Srinivasan,1997). But of course, economies are neither fully competitive nor undistorted. The authors showthat even monopoly power in capital and product markets does not destroy this benchmarkefficiency; as long as the government can use tax instruments to exploit its market power, it isfree to set its environmental policy efficiently. It is only when governments fail to tax capitalefficiently that environmental policy becomes distorted; if governments overtax capital they mayhave an incentive to lower environmental standards to attract capital.
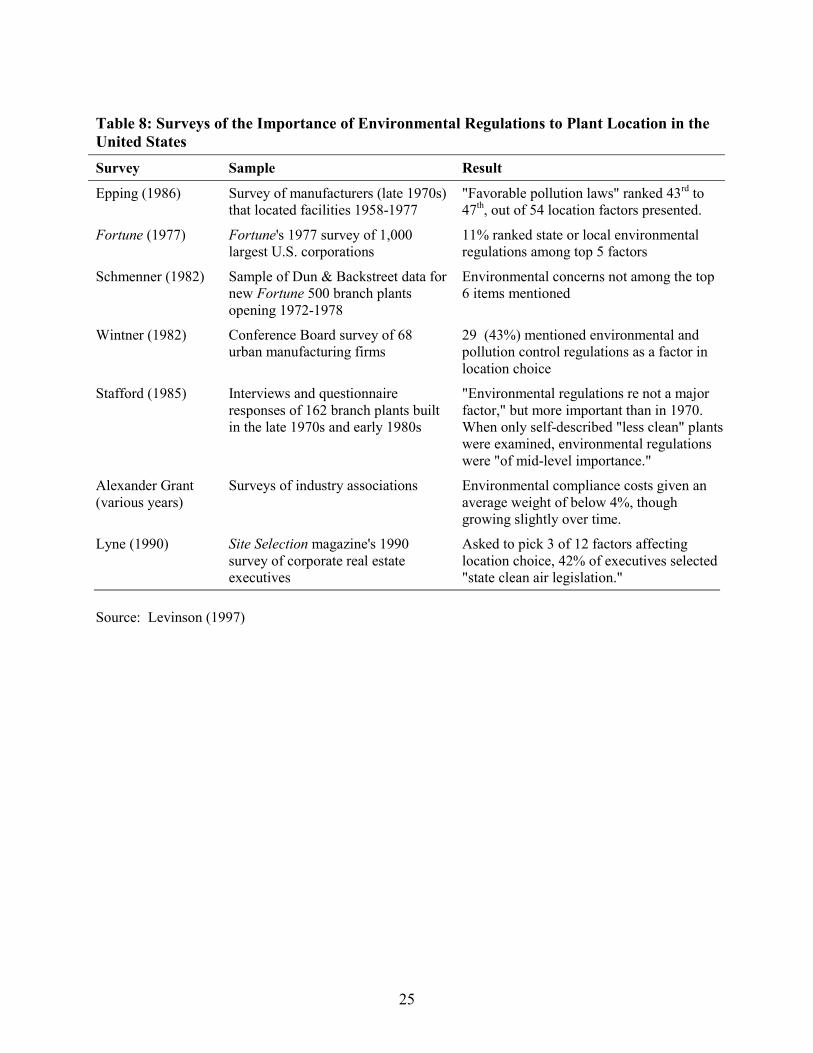
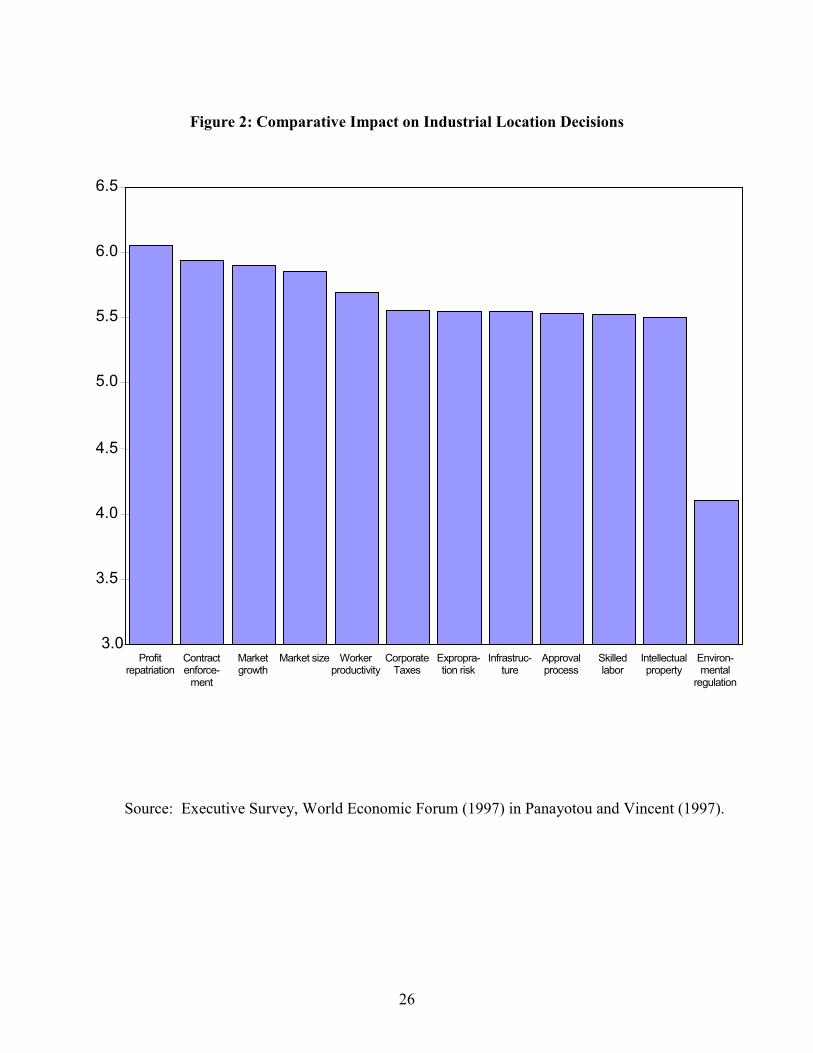
Is there evidence that lax environmental standards actually attract more foreigninvestment? Repeated tests of the "pollution haven" hypothesis failed to find evidence of asystematic tendency of manufacturing plants to be located in countries with lax environmentalstandards. In choosing how much to invest and where, firms take into account many factors inaddition to environmental regulations, such as size of the local market, the quality of the laborforce, the available infrastructure, ability to repatriate profits, political stability, and the risk ofexpropriation. In this context, evidence indicates that the stringency or laxity of environmentalregulations is insignificant as a determinant of location decisions. Indeed, Wheeler and Mody(1992) found that multinational firms base their investment decisions primarily on labor costsand market access, while corporate tax rates and, by extension, environmental control costs playlittle or no role. In a World Economic Forum survey in 1997, 3,000 business executives from 53countries were asked to rank environmental regulations and 26 non-environmental factors,ranging from government tax and investment policies to the quality of the workforce andinfrastructure as to their role in their investment location decisions. The stringency ofenvironmental regulations ranked 22nd. Figure 2 slows the importance attached to environmentalregulations compared to 11 of the non-environmental factions. (A complete list of factorsaffecting industrial locations is given in Figure 3.) Thus executives who actually makeinvestment location decisions report that environmental regulations do not figure significantly inthose decisions. Similar results have been obtained by many surveys of the importance ofenvironmental regulation in plant location decisions in the United States (see Table 8).
The results of these surveys are corroborated by ex post analysis of foreign directinvestment in pollution-intensive industry. If environmental regulations affect FDI locationdecisions, we would expect foreign direct investment in pollution-intensive sectors to account fora larger share of foreign direct investment from countries with stringent environmentalregulations today than it did in the 1960s or 1970s. Repetto (1995) showed that the reverse istrue. He concluded that, to the extent that “greener” countries seem to be exporting their “dirty”industries, they are predominantly sending them to each other, not to developing countries withweaker regulations. In 1995, only 5 percent of US direct investment in developing countries wasin pollution-intensive sectors, compared to 24 percent in developed countries with equallystringent (compared to the US) environmental regulations.
25
Table 8: Surveys of the Importance of Environmental Regulations to Plant Location in theUnited StatesSurvey Sample Result
Epping (1986) Survey of manufacturers (late 1970s)that located facilities 1958-1977
"Favorable pollution laws" ranked 43rd to47th, out of 54 location factors presented.
Fortune (1977) Fortune's 1977 survey of 1,000largest U.S. corporations
11% ranked state or local environmentalregulations among top 5 factors
Schmenner (1982) Sample of Dun & Backstreet data fornew Fortune 500 branch plantsopening 1972-1978
Environmental concerns not among the top6 items mentioned
Wintner (1982) Conference Board survey of 68urban manufacturing firms
29 (43%) mentioned environmental andpollution control regulations as a factor inlocation choice
Stafford (1985) Interviews and questionnaireresponses of 162 branch plants builtin the late 1970s and early 1980s
"Environmental regulations re not a majorfactor," but more important than in 1970.When only self-described "less clean" plantswere examined, environmental regulationswere "of mid-level importance."
Alexander Grant(various years)
Surveys of industry associations Environmental compliance costs given anaverage weight of below 4%, thoughgrowing slightly over time.
Lyne (1990) Site Selection magazine's 1990survey of corporate real estateexecutives
Asked to pick 3 of 12 factors affectinglocation choice, 42% of executives selected"state clean air legislation."
Source: Levinson (1997)
26
Figure 2: Comparative Impact on Industrial Location Decisions
3.0
3.5
4.0
4.5
5.0
5.5
6.0
6.5
Profitrepatriation
Contractenforce-
ment
Marketgrowth
Market size Workerproductivity
CorporateTaxes
Expropra-tion risk
Infrastruc-ture
Approvalprocess
Skilledlabor
Intellectualproperty
Environ-mental
regulation
Source: Executive Survey, World Economic Forum (1997) in Panayotou and Vincent (1997).
27
Figure 3: Industrial Location Factors
Market-related factors Production-and-cost-relatedfactors
"Soft" location factors
• Proximity to market• Preservation and/or expansion
of market share• Import restrictions and other
trade barriers• Developing of new market• Avoiding foreign exchange
risk
• Securing stable supply of rawmaterials and natural resources
• Social security contributions• Skills of foreign labor force• Business-related infrastructure• Corporate taxes• Energy costs• Transport costs• State Aids• Obtaining technological know-
how• Environmental stringency
• Political stability• General social conditions• Unionization• Risk of strikes• Public acceptance of new
technologies• Quality of living conditions• Environmental quality• Infrastructure for leisure
activities
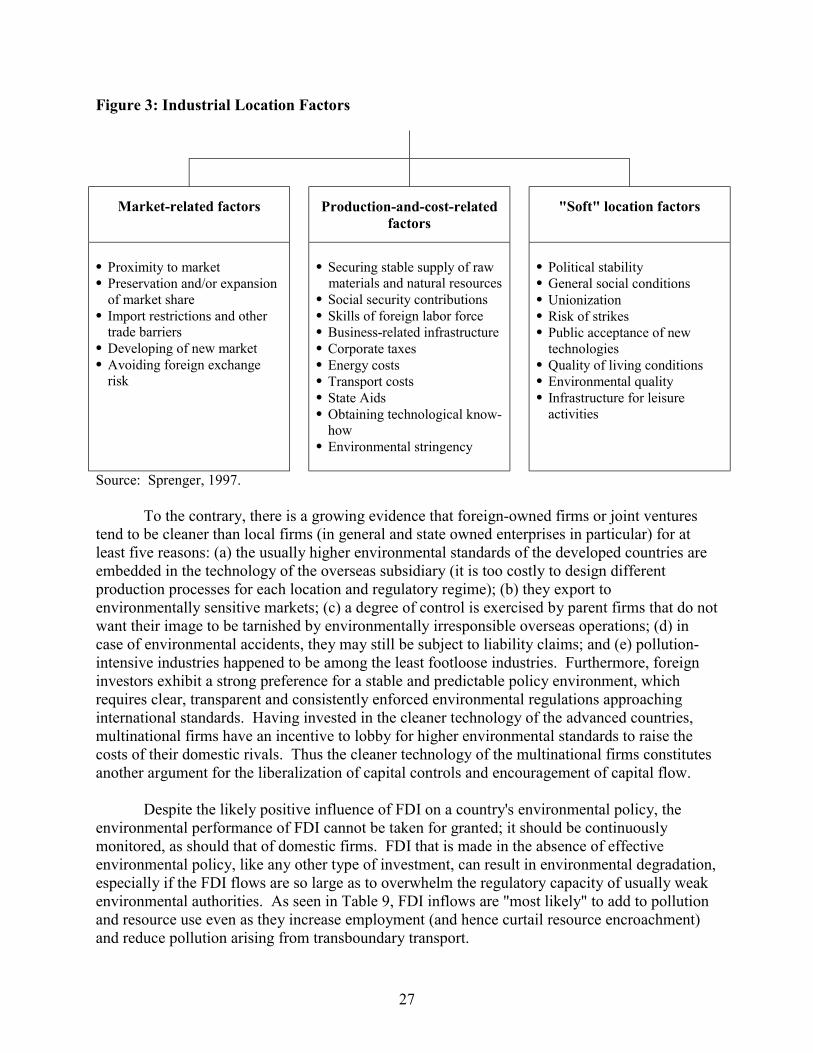
Source: Sprenger, 1997.
To the contrary, there is a growing evidence that foreign-owned firms or joint venturestend to be cleaner than local firms (in general and state owned enterprises in particular) for atleast five reasons: (a) the usually higher environmental standards of the developed countries areembedded in the technology of the overseas subsidiary (it is too costly to design differentproduction processes for each location and regulatory regime); (b) they export toenvironmentally sensitive markets; (c) a degree of control is exercised by parent firms that do notwant their image to be tarnished by environmentally irresponsible overseas operations; (d) incase of environmental accidents, they may still be subject to liability claims; and (e) pollution-intensive industries happened to be among the least footloose industries. Furthermore, foreigninvestors exhibit a strong preference for a stable and predictable policy environment, whichrequires clear, transparent and consistently enforced environmental regulations approachinginternational standards. Having invested in the cleaner technology of the advanced countries,multinational firms have an incentive to lobby for higher environmental standards to raise thecosts of their domestic rivals. Thus the cleaner technology of the multinational firms constitutesanother argument for the liberalization of capital controls and encouragement of capital flow.
Despite the likely positive influence of FDI on a country's environmental policy, theenvironmental performance of FDI cannot be taken for granted; it should be continuouslymonitored, as should that of domestic firms. FDI that is made in the absence of effectiveenvironmental policy, like any other type of investment, can result in environmental degradation,especially if the FDI flows are so large as to overwhelm the regulatory capacity of usually weakenvironmental authorities. As seen in Table 9, FDI inflows are "most likely" to add to pollutionand resource use even as they increase employment (and hence curtail resource encroachment)and reduce pollution arising from transboundary transport.
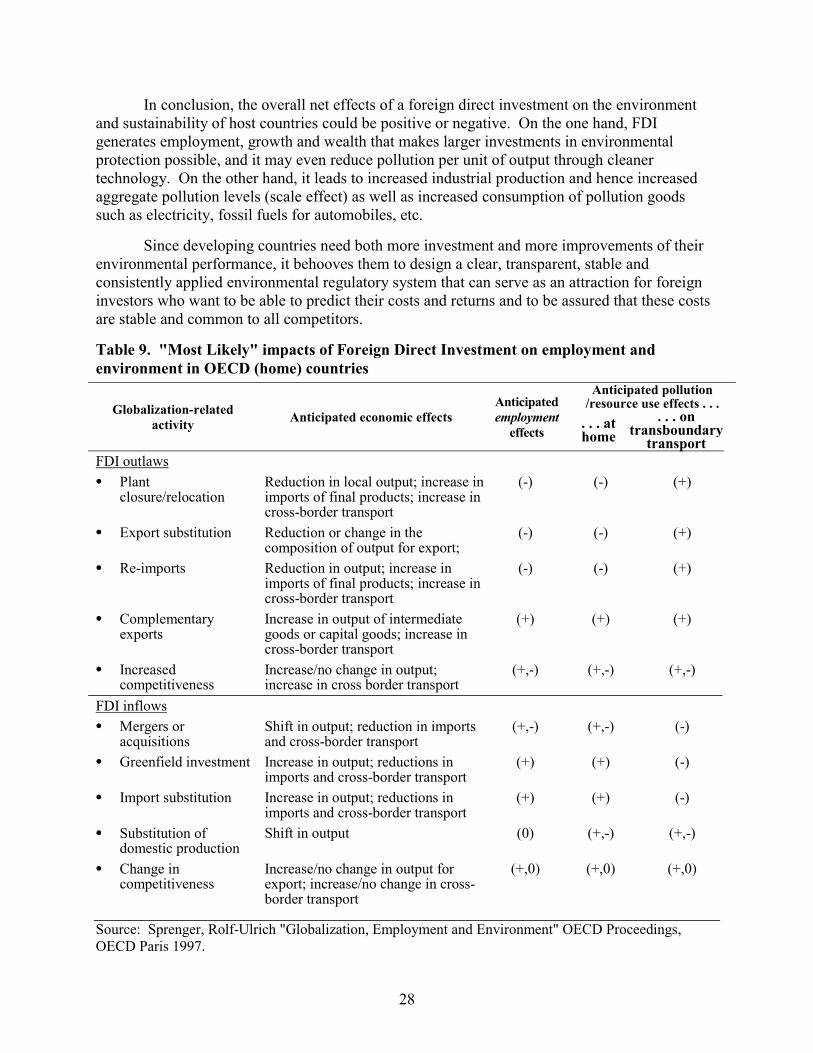
28
In conclusion, the overall net effects of a foreign direct investment on the environmentand sustainability of host countries could be positive or negative. On the one hand, FDIgenerates employment, growth and wealth that makes larger investments in environmentalprotection possible, and it may even reduce pollution per unit of output through cleanertechnology. On the other hand, it leads to increased industrial production and hence increasedaggregate pollution levels (scale effect) as well as increased consumption of pollution goodssuch as electricity, fossil fuels for automobiles, etc.
Since developing countries need both more investment and more improvements of theirenvironmental performance, it behooves them to design a clear, transparent, stable andconsistently applied environmental regulatory system that can serve as an attraction for foreigninvestors who want to be able to predict their costs and returns and to be assured that these costsare stable and common to all competitors.
Table 9. "Most Likely" impacts of Foreign Direct Investment on employment andenvironment in OECD (home) countries
Anticipated pollution/resource use effects . . .Globalization-related
activity Anticipated economic effectsAnticipatedemployment
effects. . . athome
. . . ontransboundary
transportFDI outlaws• Plant
closure/relocationReduction in local output; increase inimports of final products; increase incross-border transport
(-) (-) (+)
• Export substitution Reduction or change in thecomposition of output for export;
(-) (-) (+)
• Re-imports Reduction in output; increase inimports of final products; increase incross-border transport
(-) (-) (+)
• Complementaryexports
Increase in output of intermediategoods or capital goods; increase incross-border transport
(+) (+) (+)
• Increasedcompetitiveness
Increase/no change in output;increase in cross border transport
(+,-) (+,-) (+,-)
FDI inflows• Mergers or
acquisitionsShift in output; reduction in importsand cross-border transport
(+,-) (+,-) (-)
• Greenfield investment Increase in output; reductions inimports and cross-border transport
(+) (+) (-)
• Import substitution Increase in output; reductions inimports and cross-border transport
(+) (+) (-)
• Substitution ofdomestic production
Shift in output (0) (+,-) (+,-)
• Change incompetitiveness
Increase/no change in output forexport; increase/no change in cross-border transport
(+,0) (+,0) (+,0)
Source: Sprenger, Rolf-Ulrich "Globalization, Employment and Environment" OECD Proceedings,OECD Paris 1997.

29
In recognition of the growing importance of foreign direct investment, OECD hasattempted to negotiate a multilateral agreement on investment (MAI) among its members andnon-members willing and able to meet is obligations. (Argentina, Brazil, Chile, Hong Kong, andSlovak Republic joined the negotiations as observers.) MAI attempts to establish rules ofinvestment and to create an inclusive investment climate, analogous to what has been negotiatedand agreed upon for trade and services through GATT and GATS. The main objectives of amultilateral agreement on investment are to meet the foreign investors' need for (a) long-termstability of rules and procedures, (b) open markets and equal competitive opportunities withdomestic investors, (c) protection of existing investments and (d) an international mechanism forsettling disputes with national governments. OECD took the initiative of drafting MAI inrecognition of (1) its major stake in investment rules, as it accounts for 85 percent of FDIoutflows and 60 percent of inflows; (2) the common view of the benefits from free investmentflows; and (3) its need for more comprehensive and effective rules. MAI was intended toinclude direct investments, portfolio investment, real estate investments and rights undercontract. The main provisions of MAI were:
• Non-discrimination: foreign investors must be treated no less favorably than domesticinvestors (National Treatment) and all investors should be accorded the Most-Favored-Nation Treatment.
• Transparency of laws, regulations and procedures• Free transfer of funds to and from the host country• Expropriation only for public purpose and with full compensation• Dispute resolution through binding arbitration.
General exceptions were allowed for national security, and integrity and stability of the financialsystem; temporary safeguards in response to balance of payments crisis; and country specificexceptions and regulations as negotiated among the parties. Exceptions for culture were alsoconsidered.
With regard to the environment, MAI allowed freedom to governments to implementpolicies to protect the environment as long as these policies are not more stringent for foreigninvestors than for domestic ones, and MAI parties do not lower their environmental standards toattract foreign investment. The NAFTA provisions against environmental measures thatconstitute disguised restrictions on trade and investment were in effect expanded to include allOECD countries under MAI.
MAI has been heavily criticized on a variety of fronts, from national sovereignty andcultural protection to public health and the environment. The environmental criticism includedamong others: (1) concerns that corporate challenges to environmental regulations willaccelerate; (2) the intellectual property rights provisions giving patents full protection mayconflict with provisions of the biodiversity convention; (3) while logging concessions areprotected by MAI, acquiring land for preservation is not protected; and (4) governments areunduly constrained by provisions on rights from concessions, licenses, and permits in regulatingcorporations developing natural resources in their jurisdictions (Clarke 1998).
30
At the end, MAI did not receive the necessary support from key parties to come intoeffect. However, new efforts to negotiate a multinational agreement on investment areanticipated in coming years.
Globalization, Technology and Environment3
Economic globalization affects both the nature and the rate of technological innovationand diffusion through a variety of channels: (a) more liberalized international trade, (b) moreliberalized capital flows and a more favorable investment climate, (c) improved institutional andcommunication links, and (d) increased protection of intellectual property rights.
As we have already seen, 75 percent of international technology transfer arises from tradeflows and 18 percent from investment flows (OECD 1995). Technology transfer arises from thetrade of both goods and services including licensing of particular technologies through arms-length transaction with foreign firms. Expanded trade also advances the rate of technologicalinnovations by (a) enlarging the size of the market and generating economies of scale, (b) byrealizing more monopoly profits from successful innovation and (c) by reducing dislocation ofR&D efforts as protectionist barriers are removed. Capital flows, especially FDI, contribute totechnological innovations and diffusion by (a) generating greater finance from capital exportingcountries for financing investments in equipment, embodying more advanced technologies thatare available in the host country, (b) by investing in R&D overseas, and (c) by generatingtechnological spillover to national firms, through imitation, employment turnover, and bysupplying multinationals demanding higher quality standards. For at least two reasons, thetechnology transfer by multinationals tends to be more advanced than what already exists in thehost country: (a) 80 percent of FDI originates in countries that are primary sources oftechnological innovations such as the US, UK, Germany and Japan; (b) in order to overcomeinstitutional, regulatory, cultural, and other hurdles in the host country, multinationals tend toapply advanced technology which, along with management, tend to be their most importantcompetitive advantages (Grossman and Helpman 1995). It is estimated that 75 percent ofindustrial R&D is done by multinationals. Finally, the flow of technical expertise betweencountries encouraged by globalization results in international exchange of information whichreduces the costs of developing new technologies. Archibugi and Michie (1995) report that 75percent of patent applications in OECD countries come from outside OECD. However, again itis the middle-income and newly industrializing economies that have benefited most from theinternational flow of technology and knowledge. This creates a new source of inequality amongdeveloping countries as some converge technologically while others are left further behind.
Having established the link between globalization and technological innovation andtransfer, there remains to establish the link between technological change on the one hand andenvironmental quality and resource use on the other. What has been the environmental intensityof technological change? Table 10 indicates that the material intensity of output in all regions ofthe world was reduced during the period 1970-1988. This includes most basic material inputssuch as wood, metals, minerals, steel and raw agricultural materials: while world GDP during1970-1991 increased by only 38 percent (Young and Sachs 1995) and CO2 dioxide emissions
3 This section draws heavily on Johnstone (1997).

31
(WRI 1996) per unit of GDP also declined. This decline, or course, is only in part due totechnological change; and in part to structural change. Furthermore, the aggregate resource useand pollution levels continue to rise as the scale effect of global output growth outweighs thestructural and technological change effects.
Table 10. Technological Innovation with Significant Environmental Impact
Innovation Form of Change PrimaryInvestment
Secondaryenvironmentaleffect
Primarymotivation
Coal scrubbers End-of-pipe Reduced SO2emissions
Increased energyuse (-)
Environmental
Electric arcfurnace
Process Reduced energyconsumption
Increased use ofscrap (+/-)
Economic
HCFCs Input substitution Reduced ozonedepletion
Environmental
Biodegradablepackaging
Product change Reduced wasteaccumulation
Reduced wastefrom plasticsmanufacturing (+)
Environmental
Thermomech.pulping
Process Reduced wastewater discharges
Increased energyuse (-)
Economic
Low-solvent paint Product change Reduced smog Environmental
Reverse osmosispurification
End-of-pipe Reduced wastewater discharges
Increased solidwaste (-)
Environmental
Counter-currentrinsing
Process Reduced heavymetal waste
Reduced metalinputs (+)
Environmental/Economic
Source: Johnstone, N. "Globalization, Technology, and Environment" OECD, 1997
Is there a trend for technological innovations to be less environment-intensive or cleaner?Environmental intensity changes when there is a change in the product or the production process,when one input is substituted for another and when the technology is used more efficiently.There is no comprehensive analysis of recent technologies as to their environmental intensity.Table 11 presents a list of selected technological innovations with significant (positive)environmental impacts, which have been widely adopted in recent years and are spreadingthroughout the developing world. (For a discussion of the determinants of the environment-intensity of technology, see section on technology effects of trade liberalization.)
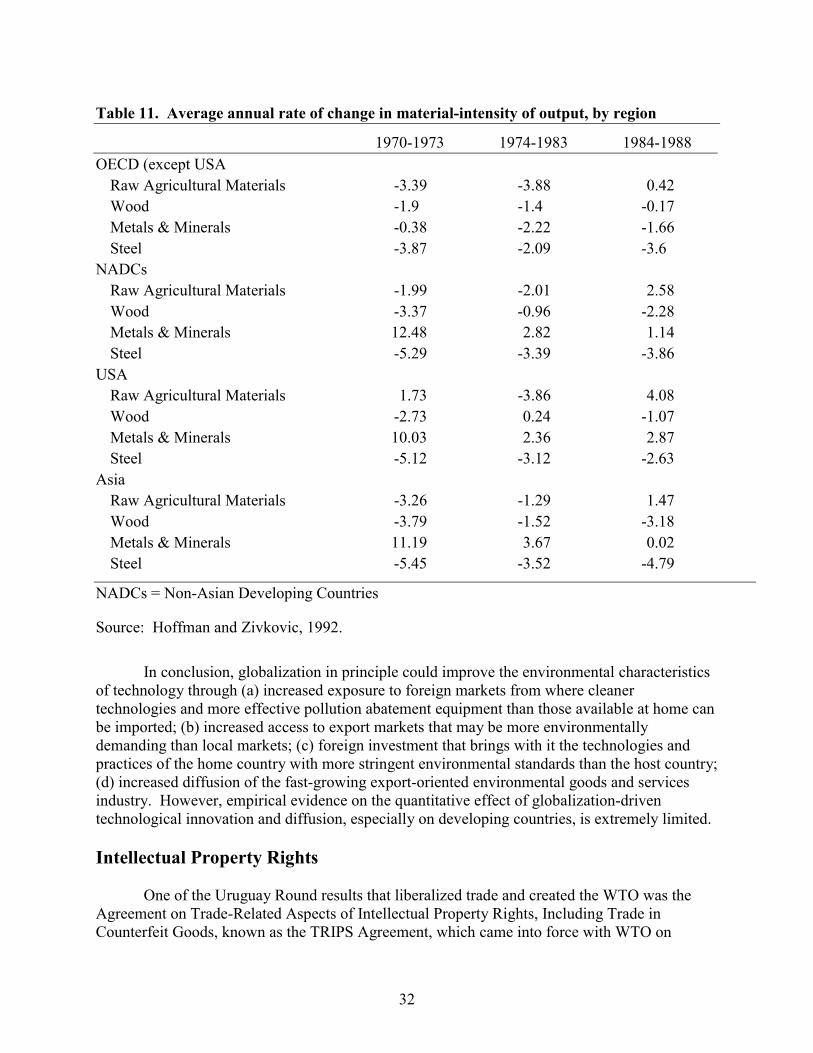
32
Table 11. Average annual rate of change in material-intensity of output, by region
1970-1973 1974-1983 1984-1988OECD (except USA
Raw Agricultural Materials -3.39 -3.88 0.42Wood -1.9 -1.4 -0.17Metals & Minerals -0.38 -2.22 -1.66Steel -3.87 -2.09 -3.6
NADCsRaw Agricultural Materials -1.99 -2.01 2.58Wood -3.37 -0.96 -2.28Metals & Minerals 12.48 2.82 1.14Steel -5.29 -3.39 -3.86
USARaw Agricultural Materials 1.73 -3.86 4.08Wood -2.73 0.24 -1.07Metals & Minerals 10.03 2.36 2.87Steel -5.12 -3.12 -2.63
AsiaRaw Agricultural Materials -3.26 -1.29 1.47Wood -3.79 -1.52 -3.18Metals & Minerals 11.19 3.67 0.02Steel -5.45 -3.52 -4.79
NADCs = Non-Asian Developing Countries
Source: Hoffman and Zivkovic, 1992.
In conclusion, globalization in principle could improve the environmental characteristicsof technology through (a) increased exposure to foreign markets from where cleanertechnologies and more effective pollution abatement equipment than those available at home canbe imported; (b) increased access to export markets that may be more environmentallydemanding than local markets; (c) foreign investment that brings with it the technologies andpractices of the home country with more stringent environmental standards than the host country;(d) increased diffusion of the fast-growing export-oriented environmental goods and servicesindustry. However, empirical evidence on the quantitative effect of globalization-driventechnological innovation and diffusion, especially on developing countries, is extremely limited.
Intellectual Property Rights
One of the Uruguay Round results that liberalized trade and created the WTO was theAgreement on Trade-Related Aspects of Intellectual Property Rights, Including Trade inCounterfeit Goods, known as the TRIPS Agreement, which came into force with WTO on
33
January 1, 1995. The TRIPS Agreement sets up the rules that WTO members must follow inestablishing a system to protect intellectual property rights within their borders. Unlike otherWTO rules that describe what countries may not do, TRIPS prescribes what countries must do.For example, it requires that any intellectual property rights granted to domestic innovators mustalso be granted to foreign innovators (national treatment) and no party should be favored overothers (non-discrimination). Contravening the TRIPS Agreement may bring "cross-retaliation"through goods covered by other agreements. Developing country members and economies intransition have five years and less-developed countries ten years to set up the required laws andmeet the standards set up in the TRIPS agreement. This is a challenge for countries that have norelated legislation in place or have entire sectors developed based on imitations of innovationsdeveloped elsewhere (e.g. India's pharmaceutical industry).
It is certain that complying with TRIPS will impose significant social and financial costson countries through higher prices (due to payment of royalties and industry concentration). Forexample, small-scale seed and pharmaceutical companies in India and other developing countriesare likely to go out of business and prices will rise beyond the reach of many poor people.
TRIPS also is likely to have significant but not easily predictable effects on theenvironment. For example, concentration of the seed market in the hands of a few majorproducers who specialize in a few strains may result in loss of biodiversity and impoverishmentof the genetic pool. The process of loss of thousands of land races that began with the GreenRevolution would accelerate. A narrow genetic base and extensive monocultures will be morevulnerable to pests and blight epidemics.
A related effect arises from the different treatment of formal and informal innovation.While varieties resulting from formal innovation resulting from scientific research by firms orindividuals is protected under TRIPS, no protection is rendered to varieties produced informallyby farmers by selecting the desired characteristics through traditional knowledge. This pitsbreeders' rights against farmers' rights and is criticized as unfair, especially since breeders andother formal innovators search for new crop traits and medicines by studying the products in useby traditional societies. As traditional medicines and land races developed over manygenerations do not fit the standard model of innovation, they are not protected by TRIPS, withthe consequence that a steady flow of information from South to North worth billions goesuncompensated (Runnalls 1998).
Another concern relates not just to cultivated crops but to biodiversity in general. Therelease of new life forms, such as genetically modified plants, animals and microorganisms,protected by TRIPS, raises concerns relating to the ability of such "new life forms' to multiply,mutate and migrate. Genetically modified organisms (GMO), once they have been released intothe environment, may multiply and spread widely, affecting existing species. Even harmlessGMOs without side effects may eventually mutate and assume unintended qualities or migrate toother organisms through pollination or sexual reproduction. Because of these concerns, theTRIPS Agreement allows for exceptions to patenting animals and plants, but the fact thatcountries can choose to patent life forms is considered contrary to the Precautionary Principlewhich is fundamental to sustainable development. These threats to biodiversity are expected to
34
be addressed in the Biodiversity Protocol to the Convention on Biological Diversity now undernegotiation.
Globalization and Environmental Policy and Performance
Economic globalization changes the "balance of power" between markets, nationalgovernments and international collective action. It enhances the influence of markets oneconomic, social, and environmental outcomes and reduces the degree of freedom and unilateralmanagement capabilities of national governments, and it creates the necessity for states tocooperate both in the management of the global commons and the coordination of domesticpolicies (Zarsky 1997). Globalization creates market driven political pressures to gain ormaintain competitiveness and this forces premature and not necessarily appropriate convergenceof environmental policy. In the presence of diversity of environmental endowments, assimilativecapacities and preferences efficient environmental management requires sensitivity to localecological and social conditions. Diversity of conditions calls for a diversity of policies. Yetglobalization leads to uniformity and inertia in environmental policy in the absence of collectiveaction.
The main channel through which globalization influences environmental policy isthrough the cost of production. To the extent that environmental policy raises or is perceived toraise the cost of production, globalization-inspired concerns about gaining or maintainingcompetitiveness, mitigate against any change of policy, that might change the cost parametersunless competitors are subject to the same policy. The creates the inertia, pressures towarduniformity and a shift of power from national governments to market and global governance.
Zarsky (1997) advanced the hypothesis that globalization creates forces that: (a) lead todomestic environmental "policy paralysis" and (b) puts the market in the driver's seat with regardto environmental policy and performance. On the one hand, diverse or weaker environmentalpolicies raise concerns among competitors that the country is somehow trying to subsidizeexports to attract foreign investors at their expense. On the other hand, any attempt to raiseenvironmental standards raise concerns among domestic producers about higher costs ofproduction and loss of competitiveness and hence loss of market share and foreign investment tocompetitors. Between the concerns of domestic producers and those of foreign competitors,environmental policy makers have a very narrow room to maneuver. This room has narrowedfurther as profit margins became smaller and smaller under the competitive pressures ofglobalization. Even if the increase in production costs is negligible and temporary, the fear orthreat of being priced out of the market or lose a hard-won export market or foreign investmentleads to "policy paralysis" and a strong bias towards the status quo. But the status quo does notfavor the environment, since "relative market prices and patterns of competitive advantageusually grow out of an institutional context in which environment is left out of the equation. Thepressures of globalization mean that improvements in environmental performance will be slow.Given the large new demands on global ecosystems posed by rapid economic growth indeveloping countries, slow progress—even if steady—points toward a pessimistic assessment ofthe prospects for global sustainability" (Zarsky 1997, p. 32).
35
The pressures to maintain the status quo or make only small gradual changes in step withcompetitors is not a temporary phenomenon but one that gathers momentum over time: as theshare of income denied from trade and foreign investment rises, the political pressures andlobbying not to disturb competitiveness intensify.
This "Zarsky hypothesis" leads to a number of testable predictions. First globalizationgenerated pressures to maintain competitiveness keep governments and enterprises from takingany initiatives to improve their environmental performance, if they entail significant costs ondomestic producers. Second, developing country product standards will be slowly pulled uptowards those of large markets and PPMs towards those of main competitors. Third, thebenchmark-setting developed country standards will improve only slowly and gradually out offear of loss of competitiveness to slowly converging developing countries.
There has been no direct test of the Zarsky hypothesis and its predictions, Zarsky presentssome indirect evidence that tends to support the hypothesis, at least in part:
• The proposed BTU tax in the US in 1993 was defeated on account of its perceived threatto US industry's international competitiveness despite the fact that (a) US energy pricesare about one-half of those of the rest of OECD; (b) the estimated impact on even theenergy intensive industries (aluminum, chemicals, fertilizers) was negligible (1-2 percentof the value of shipments); and (c) the economic and environmental benefits wereassessed to be substantial in terms of deficit reduction, improved energy efficiency,decreased pollution and reduced dependence on foreign oil.
• The proposed EU-wide carbon/energy tax in the early 1990s was postponed indefinitelyon the grounds that Japan, the US and other EU trading partners were not prepared toadopt similar measures. A similar greenhouse levy of on only $3 per ton of carbon wasdefeated in Australia in 1994 despite the exemption for transport fees and fossil fuelexports, and the estimated negligible impact on the other energy-intensive industries suchas aluminum. The industry's contention that the perceived effects, however small, coulddrive investment away towards low-energy-cost countries carried the day.
• China, India, and many other developing and transitional economies which continue tosubsidize fossil fuels and electricity to the order of 30-50 percent of the world prices arereluctant to remove these subsidies from fear of loss of competitiveness, despite thedisappearance of the original rationale of these subsidies—the promotion of state-ownedinternal oriented industrial growth.
The implication of the Zarsky hypothesis is that nation-states face a prisoners dilemmawith regard to environmental policy: pressures to compete for market and investments in aglobal economy compel them to pursue individual policies that result in lower pay-off than ifthey acted collectively. Cooperation and coordination of policy in internalizing environmentalcost while recognizing the need for diversity would result in greater welfare for all countries.The absence of effective global governance or enforceable coordination condemns countries to acollectively suboptimal policy of premature and inefficient convergence to slowly improvingenvironmental standards.
36
Yet there are counter-threads that tend to improve environmental performance even asenvironmental policy is caught in classic prisoners dilemma. Growing public environmentalawareness and rapidly spreading information about industry's environmental performance, bothspearheaded by the information technology, give rise to a global environmental ethic. Underpressure from communities, customer, shareholders and employees, industry self-regulation isadvancing ahead of formal regulations. Furthermore, the pressures of competition compel firmsto intensify their search for more efficient, resource-saving, waste-reducing technologies.Moreover, the cross-border flows of capital, commodities, people and ideas promotetechnological and managerial change—resources are better allocated, cleaner and more efficienttechnologies are disseminated and the environmental standards of worst performers are graduallypulled up. These trends are fully consistent with the Zarsky hypothesis that globalization makesmarkets, the drivers of environmental performance, at the same time as it tends to "paralyze"official environmental policy.
Managing the Process of Globalization to Protect the Environment andEnhance Sustainability
Countries and people have the potential to drive significant benefits from theglobalization process but there is still the problem of realizing this potential. Too much attentionhas been paid to the economic benefits of globalization and not enough to the social andenvironmental implications. As a result, the promise and potential of globalization as a force ofsustainable human development may not be realized. Furthermore, at the same time thatglobalization improves the prospects for economic growth worldwide, it may reduce theeconomic prospects in individual countries, sectors and communities. A variety of factorscontribute to wide disparities both within nations and between nations:• Lack of access to more efficient technologies• Lack of access to capital• Inadequate flexibility to respond to changes in market demand• Inability to manage structural change• Weak institutions and absence of effective safety nets.
To the extent that globalization marginalizes economies, sectors, and people, it results inpoverty-induced resource depletion and environmental degradation, which lead to further humandeprivation, disparity and dispowerment.
Globalization is likely to place significant stresses on the environment if perversesubsidies and other distortions are not removed and environmental costs fully internalized or if“social adjustment” policies are not in place to cushion economic dislocation and avertmarginalization of the poor. Globalization, by driving a wedge between what is produced andwhat is consumed in any given locations, alters the distribution of environmental impacts and thecosts of avoiding them within the current generation and between the current and futuregenerations.
The environmental consequences of globalization differ from the economic effects bothin time and space: (1) environmental impacts are more long-term, dynamic and cumulative andthey are beset with uncertainty; we don’t really know what the long-term damages are; and (2)
37
environmental impacts involve both physical and non-physical spillovers that may or may not betransmitted through markets such as cross-border pollution, aesthetics, ethical or moral concernsof parties not involved in the transaction. Globalization generates international interest in whattraditionally were considered purely domestic policies, since economic integration implies thattrade and investment are now being affected by such policies. Globalization increasingly bringsinto conflict notions of national sovereignty over production processes with globally-orientedlife-cycle perspectives, where consumers want to know the overall environmental impact of whatthey buy and consume.
In conclusion globalization brings with it potentially large benefits as well as risks. Thechallenge is to manage the process of globalization in such a way that it promotes environmentalsustainability and equitable human development. The ability of nation-states to manage risks,inequalities and change is severely restricted by taxation constraints and the need to remaincompetitive. Hence, the traditional instruments of trade barriers and command and controlregulations would not work because they would have unacceptably high costs in a globalizedworld and at the same time be less effective. To manage globalization in the interest of bothpeople and the environment, it would be necessary to implement more efficient and innovativepolicies domestically and more effective global governance internationally.
National Policies
1. Accelerate democratization and institutional development to keep in pace with globalization2. Increase accountability and transparency throughout the economy, and especially in the
formulation and implementation of public policy3. Channel more public investment to human capability formation4. Preserve as much as possible of the autonomy of the state to exercise fiscal and monetary
policies to achieve both macroeconomic stability and growth5. Reform domestic policies that both distort trade and have negative environmental impacts
(e.g. energy subsidies)6. Correct existing market failures though efficient incentive systems (economic instruments)
that internalize environmental costs, to avert their magnification by trade liberalization andeconomic integration.
7. Improve the effectiveness of environmental policy (benefit per dollar spent) through theinvolvement of businesses and local communities in monitoring and enforcement rather thanrelying on the state’s limited budget and weak regulatory enforcement capacity. Instrumentsof empowerment include information disclosure in environmental performance of firms, andprovision of training and other capacity building services to communities.
8. Institute social adjustment policies to cushion economic dislocation and avert themarginalization of the poor.
It must be recognized, however, that the autonomy of the state to act deliberately toprotect the environment or to cushion the impact on the poor of structural or other changesbrought about by globalization is limited by the need to compete in the global economy forcapital, jobs and markets, on the one hand, and by the interest that competitors and trade partnerstake on the country’s domestic environmental and social policies, on the other. Countries facing

38
financial crisis are further constrained by limitations imposed on their fiscal and monetary policyby creditors, the International Monetary Fund and the crisis itself.
International Policies
As we have seen, globalization constrains the state’s unilateral management capacitiesand creates new imperatives for states to coordinate their domestic environmental policies aswell as to cooperate in the management of the global commons. Without effective globalgovernance (or effective multilateralism as Zarsky calls it) nation-states, subject to the pressuresof globalization, drift towards a low-level environmental policy convergence that is insensitive tolocal ecological conditions and does not respect the diversity of preferences and priorities acrossand within nations. The challenge is to mobilize collective action among governments, firms andcivil societies to overcome the gravity towards the sterile uniformity and inertia created bynarrow competitiveness concerns and create a broader environmental policy framework, whichwill (a) recognize and allow for the diversity of environmental endowments and preferences; (b)raise the terms of environmental policy convergence; and (c) allow for continuous improvementin environmental performance. In such a framework policy coordination, harmonization andconvergence would not be understood as homogenization or standardization of the objectives andinstruments of environmental policy regardless of local circumstances, but a collective movetowards sustainable development at different speeds depending on stage of development,environmental endowments, etc.
Unfortunately, the one international “body” entrusted with the responsibility of building abridge between environmental and trade policy, WTO’s Committee on Trade and Environment(CTE), did not focus on finding “a synergy between environment and trade as two equal policyobjectives. Rather they have explored how to fit environmental concerns within the frameworkof existing trade regimes” (Ewing and Taresofsky, 1996). CTE saw its role as one of limitingunilateral state actions in the name of environmental protection in order to protect the tradingsystem rather than one of a paradigm shift from a negative to a positive trade-environmentrelationship and a “collective responsibility to promote sustainable trade, investment and growth(Zarsky 1991). Rather than focusing on how trade rules can promote sustainable developmentCTE focussed narrowly on (a) whether there should be a “safe harbor” within WTO for trade-restricting measures included in multilateral environmental agreements (MEA); and (b) onwhether eco-labelling schemes constitute non-tariff trade barriers. These issues are important asguidelines are urgently needed for both ecolabelling schemes and MEA negotiators but theycannot be resolved in isolation from other important issues in the interface of trade andenvironment and without an overarching framework of sustainable development in which bothenvironment and trade are critically important and synergistic. As Zarsky (1997) put it, “first,the Organization [WTO] as a whole needs to affirm its commitment to a developmentagenda…Among other things, this would entail abandoning the idea that the primary goal oftrade-environment diplomacy is to enhance the capacities of developed countries to restrictmarket access on environmental grounds (p. 41).”
Other unresolved issues besides MEA’s and ecolabelling, central to the trade-environment relationship are: (1) non-product-related process and production methods (PPMs)for which WTO rules have come increasingly in conflict with globally-oriented product life-

39
cycle perspectives; and (2) the gradual removal of domestic policies such as energy, chemicaland water subsidies that both distort trade and damage the environment; and (3) internalization ofenvironmental costs.
The latter two issues, while domestic in nature and unilaterally beneficial are politicallyunpalatable because of concerns about loss of competitiveness, not unlike the concerns thatlimited unilateral trade liberalization and necessitated several rounds of trade negotiations andcoordinated action, which culminated with the Uruguay Round. What is needed is a “GreenRound” to coordinate joint action on the elimination of environmentally damaging subsidies andinternationalization of environmental costs (with due recognition of diversity among countries).The question is whether WTO is up to the task of convening such a “Green Round” andcoordinating the implementation of multilateral agreements on resource subsidies andinternalization of environmental costs. WTO has thus far provided no evidence that is eitherprepared to view the trade-environment-relationship in a broader development context, or willingto address it in a more holistic manner.
A “Global Environment Organization” as called by Esty (1994) may be necessary to fillthe gap which in its absence is now partially filled by regional groupings such as NAFTA,APEC, OECD and other, which attempt policy coordination among their members. That suchregional initiatives are not a substitute for effective global governance and multilateralism can beseen from the now defunct efforts of OECD to negotiate a Multilateral Agreement on Investment(MAI) among is members. First, its main motivation was to promote foreign investor interestsby reducing political risk and ensuring “national treatment” rather than to encourage investmentfor good environmental management and sustainable development. Second, it was met withsuspicion by developing countries which viewed it as a run around WTO to conclude anagreement without their participation which, in letter, would bind only OECD members but ineffect would apply to them as well. This gave rise to calls for exceptions to MAI provisions toprotect the environment and ultimately for a much broader sustainable development investmentagreement. Belated offers by OECD negotiators to include a “pollution haven” clause and toappend environmental guidelines for multinationals did not constitute substitutes for effectivepolicy coordination.
Clearly, private capital flows into developing countries, especially emerging markets,will continue to grow rapidly into the foreseeable future. The challenge is to attract more foreigninvestment into the poorer countries and to direct it to sustainable development activities. In thisregards, Official Development Assistance (ODA) has a critical role to play in leveraging privatecapital flows, both directly and through encouragement of better policies (including prudentmacroeconomic policies and outward-oriented trade policies) in the recipient countries.Governments can ensure through regulations, incentives, and voluntary agreements that newinvestment is directed towards sustainable goals or, at a minimum, it does not jeopardizeenvironmental, social and long-term development goals.
At the multilateral level, there has been a clear trend since the early 1990s to take intoaccount more consistently the environmental and social effects of projects. This is true of boththe Multilateral Investment Guarantee Agency (MIGA) which guarantees funds to governmentsand the private sector to reduce risks, and the International Finance Corporation (IFC) that
40
provides loans, equity and other financial instruments to private sector in development. Incooperation with national governments, international organizations should support themonitoring and the development of a database for tracking the environmental impacts of foreigncapital flows on environmental quality and sustainability.
With regard to technology, globalization can play a key role in generating and diffusingresource-saving and cleaner production technologies to developing countries but, for this tohappen, several policy concerns must be resolved. First, the fact that developed countriesdominate the generation of technological innovations, means that some of these technologies andtheir environmental features are ill-suited to the factor endowments, and economic andenvironmental circumstances of developing countries. Second, developing countries may lackthe capacity to successfully absorb technological innovations, including those that aim tomitigate negative environmental impacts. It is, therefore, important that developing countriesthemselves develop their own institutional framework and capacity for adoption and adaptationof foreign technologies as well as for domestic generation of innovations (Johnstone 1997).Some domestic and foreign technological capacities tend to be complimentary than substitutable,domestic capacity should be coupled with removal of domestic barriers to diffusion of foreigntechnology, such as import tariffs on capital equipment, local content requirements, or foreignexchange restrictions. Lack of protection of intellectual property rights is another barrier todiffusion, since foreign firms may be concerned that transferring or licensing a technology mayresult in their losing their market advantage. Developing countries should undertake to increasetheir own capacity to assimilate transferred technology by fostering research and development,and improving their skills in negotiation and management with the aim to strengthen theirintellectual property rights.
International policies also have an important bearing on technology transfer. WhileMEAs such as the Montreal Protocol and the Basel Convention provide for transfer of bestavailable, environmentally safe technologies to developing countries, care must be taken so thatthe transferred technology reflects the economic and environmental conditions of the recipientcountry rather than those of the donor (Johnstone 1997). For this to happen, it is necessary todevelop cooperation between donors and recipient in R & D related to environmentaltechnologies. Tropical environments and materials differ fundamentally from temperate ones inways that affect the effectiveness and efficiency of environmental technologies designed fortemperate environments.
Finally, there is scope for governments to ease the terms of access to some cleanerproduction technologies for developing countries as a form of development assistance.Technologies, such as newly developed vaccines or clean coal technologies which benefitdiversity, the environment and human health, could be made freely available to developingcountries. Developed countries can soften the impacts of TRIPs on developing countries byspecifying very liberal terms of protection for environmental and clean production innovationsinvolving public financing.
There is a need for an Amendment or Understanding among WTO members that therights of informal innovators are also protected and for a broader interpretation of TRIPs toinclude patents for land races and other products of traditional knowledge in exchange for a

41
commitment by the developing countries to preserve these varieties. There are many innovativeideas including granting of special status, such as free or concessional access or royalty sharing,to source communities for commercial products "derived" from traditional knowledge orproducts in traditional use. The Convention on Biological Diversity already provides that thebenefits from commercial use of genetic resources should be shared with the country of origin ina "fair and equitable way."
Finally, with regard to the risks posed to the biodiversity of flora and fauna, any patentprotection afforded to the genetically modified organisms under TRIPs must incorporate thehighest standards of protection according to the "precautionary principle," which is fundamentalto sustainable development.
In conclusion, the more integrated environmental and trade policies are, the moresustainable economic growth will be and the more globalization can be harnessed for the benefitof the environment. At a rather modest level, this integration may take the form ofinstitutionalization of environmental issues in future bilateral, multilateral and regional tradeagreements. At a more ambitious level, new institutions of more effective and equitable globalgovernance can be created to bring together governments, the private sector and civil society in adialogue to achieve consensus for action in dealing with globalization-induced volatility,inequality and threats to environmental sustainability.

42
APPENDIX
Table A.1: Selected Multilateral Environmental Agreements with Possible Trade Impacts
Major Global EnvironmentalAgreements with Major TradeImpacts
Convention on the Prevention ofMarine Pollution by Dumping ofWastes and Other Matter, 29December 1972
Convention on InternationalTrade in Endangered Species, 3March 1973
Vienna Convention for theProtection of the Ozone Layer,22 March 1985
Montreal Protocol on Substancesthat Deplete the Ozone Layer, 16September 1987
Basel Convention on the Controlof Transboundary Movements ofHazardous Wastes and TheirDisposal, 22 March 1989
United Nations FrameworkConvention on Climate Change,9 May 1992
Convention on BiologicalDiversity, 5 June 1992
Global Commodity/Environmental Agreements withTrade Impacts
Treaty for the Preservation andProtection of Fur Seals, 7 July 1911
ILO Convention (#13) concern-ing the Use of White Lead inPainting, 25 October 1921
FAO Agreement for theEstablishment of the Indo-Pacific Fisheries Commission,26 February 1948 (amended andsuper-seded 20 January 1961)
Washington InternationalConvention for the North-WestAtlantic Fisheries, 8 February1949
Washington Convention for theEstablishment of an Inter-American Tropical TunaCommission, 31 May 1949
Paris International Conventionfor the Protection of Birds, 18October 1950
FAO International PlantProtection Convention, 6December 1951
Tokyo International Conventionfor the High Seas Fisheries of theNorth Pacific Ocean, 9 May1952
Washington InternationalConvention for the Regulationof Whaling and 1956 Protocol,10 November 1948; Protocol, 4May 1959
Convention on Fishing andConservation of the LivingResources of the High Seas, 29April 1958
London North-East AtlanticFisheries Convention, 24 January1959
Varna Convention concern-ingFishing in the Black Sea (asamended 30 June 1965), 7 July1959
Paris International Conventionon the Protection of New Varie-ties of Plants, 2 December 1961
Rio de Janeiro InternationalConvention for the Conservationof Atlantic Tunas, 14 May 1966
Phyto-sanitary Convention forAfrica South of the Sahara, 13September 1968
FAO Convention on theConservation of the LivingResources of the South-EastAtlantic, 23 October 1969
Canberra Convention on theConservation of AntarcticMarine Living Resources, 20May 1980
International Tropical TimberAgreement, 18 November 1983
Reykjavik Convention for theConservation of Salmon in theNorth Atlantic Ocean
Pacific Islands RegionalFisheries Treaty, 2 April 1987
Convention for the Establish-ment of a Latin American TunaOrganization, 1989
Wellington Convention on theProhibition of Driftnet Fishing inthe South Pacific, 24 November1989
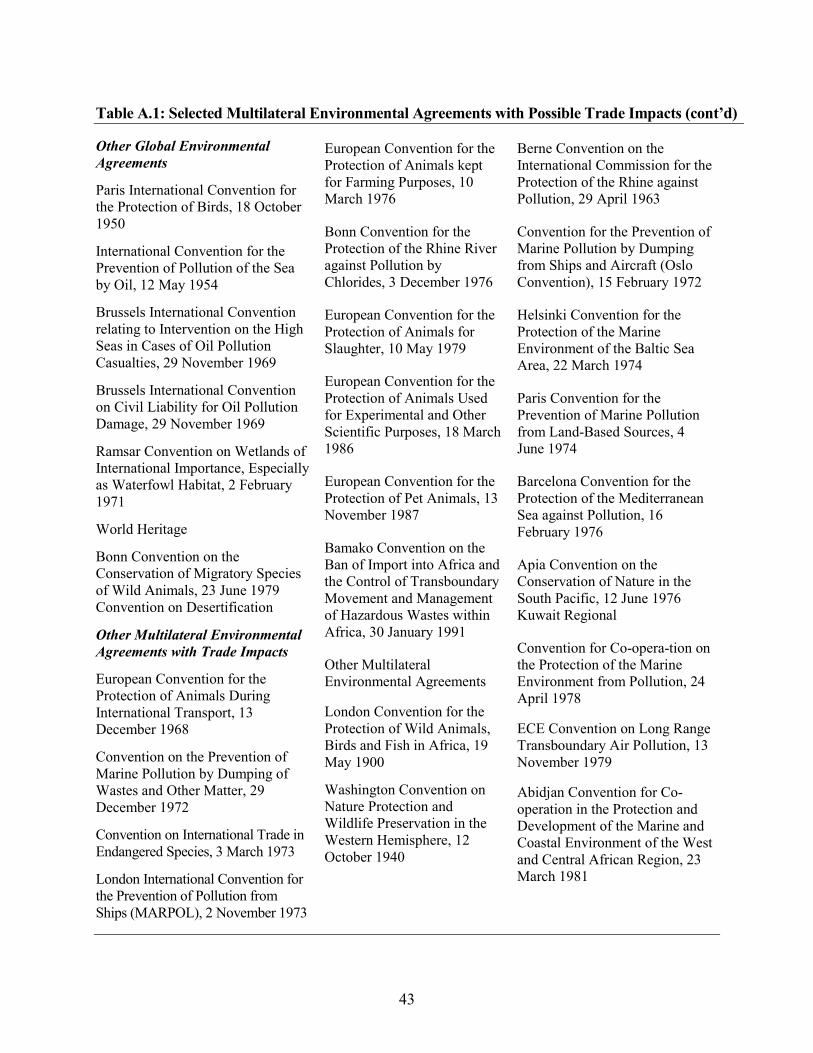
43
Table A.1: Selected Multilateral Environmental Agreements with Possible Trade Impacts (cont’d)
Other Global EnvironmentalAgreements
Paris International Convention forthe Protection of Birds, 18 October1950
International Convention for thePrevention of Pollution of the Seaby Oil, 12 May 1954
Brussels International Conventionrelating to Intervention on the HighSeas in Cases of Oil PollutionCasualties, 29 November 1969
Brussels International Conventionon Civil Liability for Oil PollutionDamage, 29 November 1969
Ramsar Convention on Wetlands ofInternational Importance, Especiallyas Waterfowl Habitat, 2 February1971
World Heritage
Bonn Convention on theConservation of Migratory Speciesof Wild Animals, 23 June 1979Convention on Desertification
Other Multilateral EnvironmentalAgreements with Trade Impacts
European Convention for theProtection of Animals DuringInternational Transport, 13December 1968
Convention on the Prevention ofMarine Pollution by Dumping ofWastes and Other Matter, 29December 1972
Convention on International Trade inEndangered Species, 3 March 1973
London International Convention forthe Prevention of Pollution fromShips (MARPOL), 2 November 1973
European Convention for theProtection of Animals keptfor Farming Purposes, 10March 1976
Bonn Convention for theProtection of the Rhine Riveragainst Pollution byChlorides, 3 December 1976
European Convention for theProtection of Animals forSlaughter, 10 May 1979
European Convention for theProtection of Animals Usedfor Experimental and OtherScientific Purposes, 18 March1986
European Convention for theProtection of Pet Animals, 13November 1987
Bamako Convention on theBan of Import into Africa andthe Control of TransboundaryMovement and Managementof Hazardous Wastes withinAfrica, 30 January 1991
Other MultilateralEnvironmental Agreements
London Convention for theProtection of Wild Animals,Birds and Fish in Africa, 19May 1900
Washington Convention onNature Protection andWildlife Preservation in theWestern Hemisphere, 12October 1940
Berne Convention on theInternational Commission for theProtection of the Rhine againstPollution, 29 April 1963
Convention for the Prevention ofMarine Pollution by Dumpingfrom Ships and Aircraft (OsloConvention), 15 February 1972
Helsinki Convention for theProtection of the MarineEnvironment of the Baltic SeaArea, 22 March 1974
Paris Convention for thePrevention of Marine Pollutionfrom Land-Based Sources, 4June 1974
Barcelona Convention for theProtection of the MediterraneanSea against Pollution, 16February 1976
Apia Convention on theConservation of Nature in theSouth Pacific, 12 June 1976Kuwait Regional
Convention for Co-opera-tion onthe Protection of the MarineEnvironment from Pollution, 24April 1978
ECE Convention on Long RangeTransboundary Air Pollution, 13November 1979
Abidjan Convention for Co-operation in the Protection andDevelopment of the Marine andCoastal Environment of the Westand Central African Region, 23March 1981

44
Table A.1: Selected Multilateral Environmental Agreements with Possible Trade Impacts (cont’d)
Other Global EnvironmentalAgreements (cont'd)
Lima Convention for theProtection of the MarineEnvironment and Coastal Areaof the South-East Pacific, 12November 1981
Jeddah Regional Convention forthe Conservation of the Red Seaand Gulf of Aden Environment,14 February 1982
Cartagena Convention for theProtection and Development ofthe Marine Environment of theWider Caribbean Region, 24March 1983
Nairobi Convention for theProtection, Management andDevelopment of the Marine andCoastal Environment of theEastern African Region, 21 June1985
Noumea Convention for theProtection of the NaturalResources and Environment ofthe South Pacific Region, 25November 1986
Voluntary InternationalEnvironmental Agreements withTrade Impacts
ISO 9,000
ISO 14,000
Source: von Moltke, Konrad. "International Environmental Management, Trade Regimes andSustainability." Paper prepared for the International Institute for Sustainable DevelopmentWinnipeg, Manitoba, Canada, January 1996
45
ReferencesAdams, J. (1997). "Globalisation, trade, and environment." Globalization and Environment,
OECD Proceedings, OECD: Paris.
Alexander Grant and Company. Various years. Annual Study of General ManufacturingClimates of the Forty-Eight Contiguous States of America. Alexander Grant and Company:Chicago.
Anderson, K. (1992). “Agricultural trade liberalization and the environment: A globalperspective,” The World Economy 15(1): 153-71, January.
Anderson, K. and A. Strutt (1994). “On measuring the environmental impacts of agriculturaltrade liberalization,” Center for International Economic Studies, Seminar paper 94-06,University of Adelaide: Adelaide.
Archibugi, D. and J. Michie (1995). "The globalisation of technology: A new taxonomy,"Cambridge Journal of Economics 19:121-140.
Bhagwati, J. and T.N. Srinivasan (1997). "Trade and the environment: Does environmentaldiversity detract from the case for free trade?" in Bhagwati, J. and Hudec, R., (eds), FairTrade and Harmonization: Prerequisites for Free Trade? Vol. 1: Economic Analysis MITPress: Cambridge, MA.
Clarke, T. (1998). “MAI-Day! The Corporate Rule Treaty: The Multilateral Agreement onInvestments (MAI) seeks to consolidate global corporate rule,”http://www.nassist.com/mai/mai(2)x.html.
Epping, M. (1986). "Tradition in transition: The emergence of new categories in plant location,"Arkansas Business and Economic Review, 19(3):16-25.
Esty, D.C. (1994). Greening the GATT, Trade, Environment, and the Future, Institute forInternational Economics: Washington, DC.
Ewing, K.P. and R.G. Taresofsky, (1996). The "Trade and Environment" Agenda: Survey ofMajor Issues and Proposals form Marakesh to Singapore. IUCN Environmental Law Centre,Bonn, December.
Gentry, B.S. et al (1996). Private Capital Flows and the Environment: Lessons from LatinAmerica. Yale Center for Environmental Law and Policy (draft report).
Grossman, G.M. and E. Helpman (1995). "Technology and trade." CEPR Discussion Paper1134: London.
Grossman, G.M. and A.B. Krueger (1993). "Environmental impacts of a North American FreeTrade Agreement." In P. Garber (ed.) The US-Mexico Free Trade Agreement. MIT Press:Cambridge, MA, 13-56.

46
Grossman, G.M. and A. Krueger (1995). "Economic growth and the environment," QuarterlyJournal of Economics 110(2): 353-77, May.
Henriques, I. and P. Sadorsky (1996). "The determinants of an environmentally responsive firm:An empirical approach," Journal of Environmental Economics and Management, 30: 381-95.
Hoffman, U. and D. Zivkovic (1992). "Demand growth for industrial raw materials and itsdeterminants: An analysis for the period 1965-1988." UNCTAD Discussion Paper No. 5:Geneva.
Johnstone, N. (1997) "Globalization, technology, and environment." Globalization andEnvironment, OECD Proceedings, OECD: Paris.
Levinson, A. (1997). "Environmental regulations and industry location: International anddomestic evidence," in in Bhagwati, J. and Hudec, R., (eds), Fair Trade and Harmonization:Prerequisites for Free Trade? Vol. 1: Economic Analysis MIT Press: Cambridge, MA.
Low, P. (ed.) (1992). "Trade and the environment: A survey of the literature,", in Low, P. (ed.)International Trade and the Environment. World Bank Discussion paper 159, The WorldBank: Washington DC.
Low, P. and A. Yeats (1992)., "Do 'dirty' industries migrate?" in Low, P. (ed.) InternationalTrade and the Environment. World Bank Discussion paper 159, The World Bank:Washington DC.
Lucas, R., P. Wheeler and H. Hettige (1992). "Economic development, environmental regulationand international migration of toxic pollution 1960-1988,: in Low, P. (ed.) InternationalTrade and the Environment. World Bank Discussion paper 159, The World Bank:Washington DC.
Lyne, J. (1990). "Service taxes, international site selection and the 'green' movement dominateexecutives' political focus." Site Selection, October.
Nentjes, A. and D. Wiersma (1987). "Innovation and pollution control," International Journalof Social Economics, 17(4): 247-65.
OECD (1995). Foreign direct Investment, Trade and Employment. OECD: Paris.
OECD (1996). Globalizaiton of Industry: Overview and Sector Reports. OECD: Paris.
OECD (1994a). The Environmental Effects of Trade, OECD: Paris.
OECD (1997). Globalization and Environment, OECD Proceedings, OECD: Paris.
Panayotou, T. (1997). "Demystifying the Environmental Kuznets Curve: Turning a Black Boxinto a Policy Tool." Environmental and Development Economics, 2(4): 465-484.
47
Panayotou, T. (1997). “Taking stock of trends in sustainable development since Rio.” In Financefor Sustainable Development: The Road Ahead: Proceedings of the Fourth Group Meetingon Financial Issues of Agenda 21, pp. 35-72, Santiago, Chile. United Nations, New York.
Panayotou, T. and J.R. Vincent. (1997). “Environmental regulation and competitiveness.”Global Competitiveness Report, World Economic Forum: Geneva.
Panayotou, T., T. Schatzki and Q. Limvorapitak. (1997). “Differential Industry Response toFormal and Informal Environmental Regulations in Newly Industrializing Economies: TheCase of Thailand.” A Case Study for the HIID Asia Environmental Economics PolicySeminar.
Pargal, S. and D. Wheeler (1995). "Informal regulation of industrial pollution in developingcountries." World Bank Policy Research Working Paper 1416. World Bank: Washington,DC.
Repetto, R. (1993). Trade and Environment Policies: Achieving Complemntarities and AvoidingConflicts, World Resources Institute: Washington, DC.
Repetto, R. (1995). Jobs, Competitiveness, and Environmental Regulation: What are the RealIssues? World Research Institute: Washington, DC, March.
Robison, H.D. (1988). "Industrial pollution abatement: The impact on the balance of trade."Canadian Journal of Economics 21(1).
Runnalls, (1998). “Shall we dance?” International Institute for Sustainable Development(IISD), Trade and Sustainable Development Research Guide,http://iisd1.iisd.ca/trade/dance.htm
Schmenner, R. (1982). Making Business Location Decisions. Prentice-Hall: Englewood Cliffs,NJ.
Smith, K. and J.A. Espinosa (1996). "Environmental and trade policies: Some methodologicallessons" Environment and Development Economics: 19-40.
Sprenger, R.U. (1992). Umweltschutz als Standortfaktor. Friedrich Erbert Stiftung: Bonn.
Sprenger, R.U. (1997). "Globalization, employment and environment" Globalization andEnvironment, OECD Proceedings, OECD: Paris.
Stafford, H.A. (1985). "Environmental protection and industrial location," Annals of theAssociation of American Geographers, 75(2):227-240.
Strutt, A. and K. Anderson, (1998). "Will trade liberalization harm the environment? The caseof Indonesia to 2020." Seminar Paper 98-04 Center for International Economic Studies,University of Adelaide, May.
48
Subramanian, A. (1992). "Trade measures for environment: A nearly empty box?" The WorldEconomy, January, 15(1).
United Nations (1996). World Economic and Social Survey, UN: New York.
von Moltke, K. (1996). "International environmental management, trade regimes andsustainability." Paper prepared for the International Institute for Sustainable DevelopmentWinnipeg, Manitoba, Canada, January.
Walter, I. (1973). "The pollution content of American trade," Western Economic Journal, 11:61-70.
Wheeler, D. and A. Mody (1992). "International investment location decisions: The case of USfirms," Journal of International Economics, 33: 57-76.
Wintner L. (1982). Urban Plant Siting, Conference Board: New York.
World Bank (1997). Can the environment wait? Priorities for East Asia.
World Resources Institute (1990). World Resources 1990-91, Oxford University Press: NewYork.
World Resources Institute (1996). World Resources: A Guide to the Global Environment. WRI:Washington, DC.
World Trade Organization (1995). International Trade Trends and Statistics, WTO: Geneva.
World Trade Organization (1996). Trade and Foreign Direct Investment. WTO: Geneva.
Young, J.E. and A. Sachs (1995). "Creating a sustainable materials economy," in L. Brown et al,(eds.) State of the World 1995. Earthscan: London.
Zarsky, L. (1991). Trade-Environment Linkages and Ecologically Sustainable Development,Report to Department of Arts, Sports, Environment, Tourism and Territories, EnvironmentalStrategy Branch, Australia, October.
Zarsky, L. (1997). "Stuck in the mud? Nation-states, globalization, and environment."Globalization and Environment, OECD Proceedings, OECD: Paris.