globalisation, employment and unemployment in india · globalisation, employment and unemployment...
TRANSCRIPT

© 2015, IJARCSMS All Rights Reserved 113 | P a g e
ISSN: 2321-7782 (Online) Volume 3, Issue 5, May 2015
International Journal of Advance Research in Computer Science and Management Studies
Research Article / Survey Paper / Case Study Available online at: www.ijarcsms.com
Globalisation, Employment and Unemployment in India Dr. Elena Philip
1
Head,
Dept of economics,
St. Aloysius College (Auto.),
Jabalpur - India
Anthonima K. Robin2
Asst. Professor,
Dept. of Management Studies,
St. Aloysius College,
Jabalpur - India
Abstract: India has witnessed an impressive and steadily rising rate of economic growth for about two decades now. The
prospects of a continuation of this high economic growth in the medium term are also high. The challenge of employment,
especially good quality and remunerative employment remains difficult. This implies a vast gap in incomes and productivity
between agriculture and non-agriculture sectors. India is moving towards an age composition that will be among the
youngest in the world. From the demographic point of view, the employment challenge is especially critical in India because
the young and the inexperienced usually find it even more difficult to find regular employment. This paper evaluates
changes in the level and structure of employment and unemployment in India, relating them to trends in productivity.
I. INTRODUCTION
Today there are 550 million people who work, but still live on less than US $1 a day. These “working poor” represent 20
per cent of total world employment. In spite of the record levels of global unemployment, the reality for most of the world’s
poor is that they must work – often for long hours, in poor working conditions and without basic rights and representation – in
jobs that are not productive enough to enable them to lift themselves and their families out of poverty. While it is clear that
employment is central to poverty reduction, it is “decent and productive” employment that matters, not employment alone. This
employment challenge has taken center stage in the global community, most recently in the Report of the World Commission on
the Social Dimension of Globalization, which drew attention to the need to make decent and productive employment a central
objective of macro-economic and social policies as a key endeavor to promote fairer globalization. Also, the centrality of decent
employment reaching the United Nations’ Millennium Development Goals, particularly in having the share of those in extreme
poverty in the total population by 2015, is widely accepted and becoming more and more integrated as a component of national
policy.
II. OBJECTIVE OF THE STUDY
To know the condition of employment in different sectors.
To provide suggestions for employment opportunities.
III. RESEARCH METHODOLOGY
The study has been based on secondary data. This study relies on data from the authorized Indian statistical database - RBI
Bulletin, Economic Survey of India, Working Papers, Review of World Economics, The Indian Journal of Labour Economics,
World Employment Report, NSSO, International Labour organizations and from the website of google.com and Government of
India.
The World Employment Report shows that bridging the “global productivity divide”, particularly in parts of the economy
where the majority of people work – such as in agriculture, small-scale enterprises or the urban informal economy – is essential
for fighting poverty and stimulating growth in both output and “decent and productive” employment. Decent work has many

Dr. Elena et al., International Journal of Advance Research in Computer Science and Management Studies
Volume 3, Issue 5, May 2015 pg. 113-122
© 2015, IJARCSMS All Rights Reserved ISSN: 2321-7782 (Online) 114 | P a g e
components; the fundamentally economic one of an income adequate enough to escape from poverty must ultimately come from
growth – growth in output, growth in productivity, and growth in jobs (World Employment Report – 2004-05). There is both
social and statistical evidence for the fact that the employment scene in India is dismal. For the very poor, it is not the luxury of
employment with a well-defined wage contract that hangs in the balance, but simply the question of having access to a
minimum livelihood. The malaise of a pattern of hopeless growth for a significant section of the poor population is becoming
increasingly apparent. Visible symptoms are appearing in both rural and urban areas of India. Disgruntled youth in urban and
semi-urban areas, who have just a few years of schooling, find little possibility of regular employment. In rural areas, shrinking
opportunities for livelihood are spreading despair among the people living there. The result is a desperate rage among the poor
that manifests itself in various forms of political extremism. The varying symptoms of discontent can no longer be wished away
in the name of high growth. For both political and economic reasons, it has become imperative now to examine closely the
reasons why India's high economic growth has failed to create adequate jobs for its people. India is moving towards an age
composition that will be among the youngest in the world. From the demographic point of view, the employment challenge is
especially acute in India because the young and the inexperienced usually find it even more difficult to find regular
employment, while they also form a more politically volatile group. Thus, open unemployment was the highest at nearly 28 per
cent (by current daily status) for young urban women (20-24 years) and at 19 per cent for urban males (15-19 years). Converted
into absolute numbers, the magnitude of the problem is easy to see. India might be growing at a high rate, but it is leaving out a
significant section of its youth from any benefits of that growth process, a particularly lamentable situation for the country
because it shows that it is unable to take advantage of its 'demographic dividend'.
India has witnessed an impressive and steadily rising rate of economic growth for about two decades now. The prospects of
a continuation of this high economic growth in the medium term are also high. And yet, the challenge of employment,
especially good quality and remunerative employment remains formidable. Over half of the workforce continues to depend on
agriculture even though it accounts for less than a fifth of the total gross domestic product. This implied a vast gap in incomes
and productivity between agriculture and non-agriculture sectors. This is mainly due to inadequate growth of productive
employment opportunities outside agriculture. The organized sector that offers work that would be considered decent employs
less than 10 per cent of the workforce and, in recent years, has been characterized by low and declining employment intensity of
output growth. An overwhelming majority of workers are currently employed in the unorganized sector where most of the new
jobs are also created. In addition, most new jobs that are being created in the organized sector are informal in nature. These jobs
are mostly characterized by low earnings, poor conditions of work and lack of social protection and organisation. A large
number of workers, whether wage-employed or self-employed earn below poverty line incomes and are Working Poor. Some of
these developments are dictated by the trajectories of technology, demand and structural constraints in the economy. The most
recent reports relating to employment trends were released by the NSSO in the closing weeks of 2006; these are based on the
61st Round of the NSS, covering 2004-05. Going by these reports, it would appear that there has been a revival of employment
growth, after the sharp deceleration in the late 1990s, both in rural and urban India, over the first half of the current decade.
Labour force participation rates, for both males and females, have recovered the lost ground and the aggregate employment
growth rates for both males and females in rural as well as urban areas were close to the rates achieved in the period 1987-88 to
1993-94. Nonetheless, in spite of the recovery, unemployment rates, both in rural and urban India (taking the current daily status
measure) have continued to rise. Moreover, possibly the most striking results from the latest survey relate to the shift in the type
of employment. Essentially, self-employment among major segments of the workforce has witnessed very significant increases.
For instance, annual compound growth rate of agricultural self-employment, which stood at -0.53 during 1993-94 to 1999-2000,
jumped to 2.89 between 1999-2000 and 2004-05, whereas the comparable rates for agricultural wage employment were 1.06
and -3.18 respectively. Likewise, over the same time period, the comparable rates for rural non-agricultural self-employment
almost doubled – from 2.34 percent to 5.72 per cent – whereas for rural non-agricultural wage employment the increase was of a
Dr. Elena et al., International Journal of Advance Research in Computer Science and Management Studies
Volume 3, Issue 5, May 2015 pg. 113-122
© 2015, IJARCSMS All Rights Reserved ISSN: 2321-7782 (Online) 115 | P a g e
smaller magnitude, i.e. from 2.68 to 3.79 per cent. The story is no different in urban areas, as there too self-employment
accounts for the dominant share of the increase in aggregate employment since 2000.
The 61st National Sample Survey (NSS) round reported the generation of 47 million additional employment opportunities
during 1999-2000 to 2004-05, implying an annual average of 9.4 million jobs against its 4.0 million annual average during
1993-94 to 1999-2000. Employment growth rate registered a 2.6 per cent per annum rise over the period, with labour force
growing at 2.8 per cent per annum (i.e., 0.2 per cent more than the work force), which resulted in increased unemployment rate
of 8.3 per cent in 2004-05. In terms of usual principal and subsidiary status (UPSS) number of persons, unemployment rate was
2.5 per cent in 2004-05. These reflected high rate of intermittent unemployment during the period (Ministry of Finance 2009).
The first country-wide survey of informal sector was conducted by the National Sample Survey Organization (NSSO) during
the 55th round (July 1999 – June 2000), which included all unincorporated, partnership and proprietary enterprises (NSS 2001).
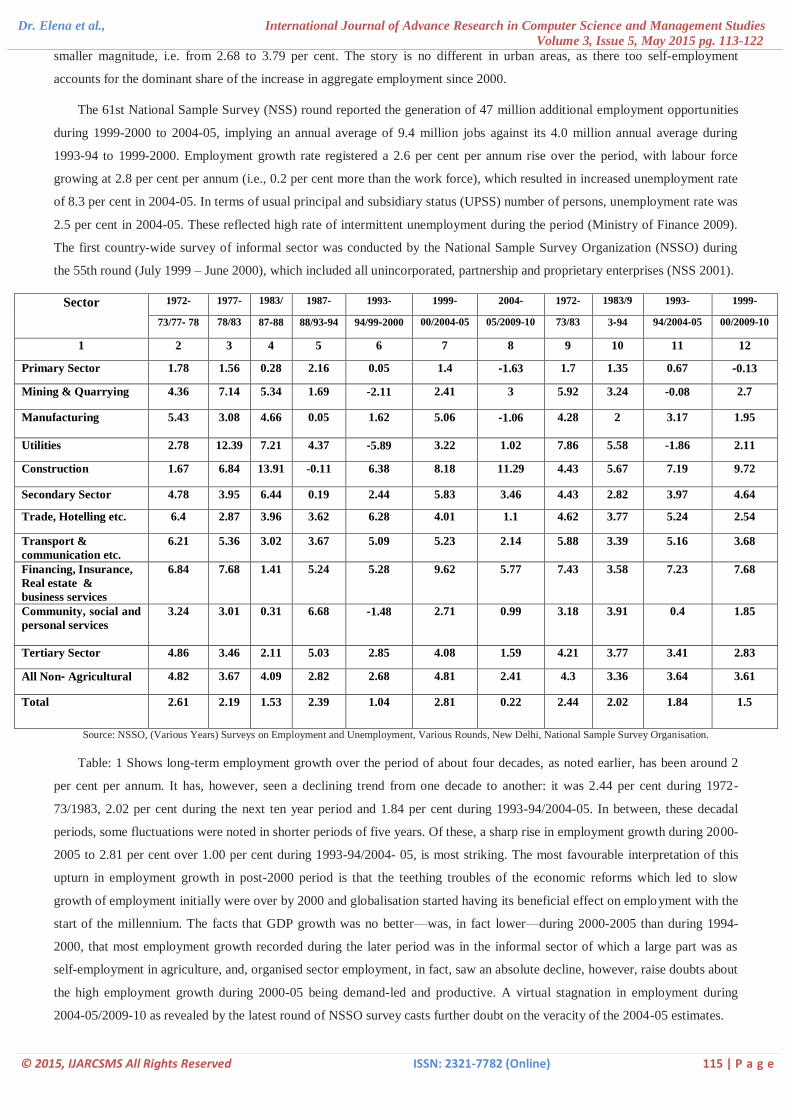
Sector 1972‐ 1977‐ 1983/ 1987‐ 1993‐ 1999‐ 2004‐ 1972‐ 1983/9 1993‐ 1999‐
73/77‐ 78 78/83 87‐88 88/93‐94 94/99‐2000 00/2004-05 05/2009-10 73/83 3‐94 94/2004-05 00/2009-10
1 2 3 4 5 6 7 8 9 10 11 12
Primary Sector 1.78 1.56 0.28 2.16 0.05 1.4 ‐1.63 1.7 1.35 0.67 ‐0.13
Mining & Quarrying 4.36 7.14 5.34 1.69 ‐2.11 2.41 3 5.92 3.24 ‐0.08 2.7
Manufacturing 5.43 3.08 4.66 0.05 1.62 5.06 ‐1.06 4.28 2 3.17 1.95
Utilities 2.78 12.39 7.21 4.37 ‐5.89 3.22 1.02 7.86 5.58 -1.86 2.11
Construction 1.67 6.84 13.91 -0.11 6.38 8.18 11.29 4.43 5.67 7.19 9.72
Secondary Sector 4.78 3.95 6.44 0.19 2.44 5.83 3.46 4.43 2.82 3.97 4.64
Trade, Hotelling etc. 6.4 2.87 3.96 3.62 6.28 4.01 1.1 4.62 3.77 5.24 2.54
Transport &
communication etc.
6.21 5.36 3.02 3.67 5.09 5.23 2.14 5.88 3.39 5.16 3.68
Financing, Insurance,
Real estate &
business services
6.84 7.68 1.41 5.24 5.28 9.62 5.77 7.43 3.58 7.23 7.68
Community, social and
personal services
3.24 3.01 0.31 6.68 ‐1.48 2.71 0.99 3.18 3.91 0.4 1.85
Tertiary Sector 4.86 3.46 2.11 5.03 2.85 4.08 1.59 4.21 3.77 3.41 2.83
All Non‐ Agricultural 4.82 3.67 4.09 2.82 2.68 4.81 2.41 4.3 3.36 3.64 3.61
Total 2.61 2.19 1.53 2.39 1.04 2.81 0.22 2.44 2.02 1.84 1.5
Source: NSSO, (Various Years) Surveys on Employment and Unemployment, Various Rounds, New Delhi, National Sample Survey Organisation.
Table: 1 Shows long-term employment growth over the period of about four decades, as noted earlier, has been around 2
per cent per annum. It has, however, seen a declining trend from one decade to another: it was 2.44 per cent during 1972-
73/1983, 2.02 per cent during the next ten year period and 1.84 per cent during 1993-94/2004-05. In between, these decadal
periods, some fluctuations were noted in shorter periods of five years. Of these, a sharp rise in employment growth during 2000-
2005 to 2.81 per cent over 1.00 per cent during 1993-94/2004- 05, is most striking. The most favourable interpretation of this
upturn in employment growth in post-2000 period is that the teething troubles of the economic reforms which led to slow
growth of employment initially were over by 2000 and globalisation started having its beneficial effect on employment with the
start of the millennium. The facts that GDP growth was no better—was, in fact lower—during 2000-2005 than during 1994-
2000, that most employment growth recorded during the later period was in the informal sector of which a large part was as
self-employment in agriculture, and, organised sector employment, in fact, saw an absolute decline, however, raise doubts about
the high employment growth during 2000-05 being demand-led and productive. A virtual stagnation in employment during
2004-05/2009-10 as revealed by the latest round of NSSO survey casts further doubt on the veracity of the 2004-05 estimates.
Dr. Elena et al., International Journal of Advance Research in Computer Science and Management Studies
Volume 3, Issue 5, May 2015 pg. 113-122
© 2015, IJARCSMS All Rights Reserved ISSN: 2321-7782 (Online) 116 | P a g e
IV. NATURE OF EMPLOYMENT
A part from the magnitude of employment, or the lack of it, one must also look at the nature and quality of the jobs that a
being available in the developing countries like India, especially in recent times. According ILO employment can be divided
into four components-Employers, Wage/Salaried Workers, Own Account Workers, and Family Labour. Of these, the first two
types are considered to be of better quality and more remunerative as compared to the other two. People with no other
employment opportunities either start a one-man enterprise or become engaged in the family enterprise. These types of
employment are mostly distress in nature, and productivity as well as the returns from them is observed to be badly low.
A number of scholars have analysed the results of the latest National Sample Survey (NSS), that is, the 61st Round,
covering 2004-05 (Bhalla 2008, Chandrasheker and Ghosh, 2007). It has been revealed that there was a surge in the
employment growth rate to an all-time high of 2.82 per cent per annum during the period 1999-2000 to 2004-05. Further, there
was revival of employment growth in all the sectors of the economy with the agriculture, secondary and tertiary sectors growing
at 1.49 per cent, 5.81 per cent and 3.92 per cent per annum, respectively.
Secondly, from 1993-1994 to 1999-2000, there was a growth of casual labours but during the period 1999-2000 to 2004-05
the number of casual labourers declined.
Thirdly, there was a very significant increase in the self-employment category during the period 1999-2000 to 2004-05 in
both the rural and urban areas.
Fourthly, the NSSO 61st Round (2004-05) data has revealed that half of the self-employed workers do not find their
employment to be remunerative. This shows that the growth of self-employment signifies nothing but a survival strategy
adopted by most of them due to the non-availability of regular paid jobs even though Unni (2005) has argued that self-
employed workers may enter the informal sector due to their entrepreneurial and human capability, not necessarily because
there were rationed out of the formal sector. Numerous factors influence the employment intensity of growth: the sectorial
composition of output, the productive technologies utilized, downstream and upstream linkages to other activities in the
domestic economy, and the size and trajectory of public employment. The unemployment rate is perhaps the most common
metric used, particularly in developed economies. However, the unemployment rate is sensitive to variations in the definition of
who is employed, who is unemployed and who is in or out of the labour force. The unemployment rate will fall when the
number of discouraged workers increases. Discouraged workers – a category, under which women often fall, are individuals
who have stopped looking for employment due to a sustained lack of opportunities. For this reason, many analysts prefer to use
the ratio of employment to the total population as an indicator of trend s in employment opportunities. It is important to note
that neither measure adequately captures the extent of underemployment among the employed, arguably the most significant
employment issue in developing countries with a large share of informal employment. Earnings are a central indicator of the
quality of employment opportunities. Although people may have a variety of reasons for engaging in paid work, earning income
is one of the most important. Most households around the world earn a living through some form of employment. Therefore,
employment income is also an important determinant of the income poverty status of households. Even if we take a broad view
of poverty - one that emphasizes capabilities and individual freedoms instead of just income (Sen, 1999) employment earnings
remain an important means to the ultimate goal of reducing poverty. Differentials in labour productivity explain much of the
variation in employment earnings observed – both across countries and over time. The relationship between higher earnings and
improvements in labour productivity has been well-established (ILO, 2004c; Rama 2002a; Rodrik, 1999; Trefler, 1993).
Long-run improvements in labour productivity are therefore necessary, but not sufficient, for sustainable increases in real
employment earnings. For example, workers in highly competitive environments may not be able to capture a share of the
benefits of productivity improvements. Instead, these benefits are captured elsewhere as lower consumer prices or higher
profits. In these, and similar cases, productivity gains do not translate into better employment earnings. However, without
improvements in average labour productivity, sustainable increases in average real earnings will remain unobtainable. In

Dr. Elena et al., International Journal of Advance Research in Computer Science and Management Studies
Volume 3, Issue 5, May 2015 pg. 113-122
© 2015, IJARCSMS All Rights Reserved ISSN: 2321-7782 (Online) 117 | P a g e
addition, a narrow focus on wage employment and formal wage employment specifically, excludes shifts in earnings associated
with growing informal employment and the changing composition of employment. The informal employment accounts for a
large share of total employment in many regions and the importance of informal employment appears to be growing over time,
at least for a significant number of countries. Informal employment is not homogenous, but encompasses a variety of labour
relationships and employment statuses. In particular, self-employment and own-account employment are widespread. Earnings
from informal self-employment and own-account work are not included in the analyses of real earnings described above, despite
being an important source of income for a large number of households. In addition, earnings in these forms of employment are
lower and more volatile on average than earnings from wage employment (Chen, 2005). If these forms of employment expand
rapidly relative to formal wage employment, then average real earnings from employment will fall, even if real wages are
increasing. By failing to take into account the shifting composition of employment, the analysis of changes in real wages fails to
provide us with a composite picture of what is happening to real earnings. Slow growth of employment in the organised sector
has been a major factor in the stagnancy in the proportion of regular wage and salary earners. This sector consisting of public
services and enterprises and large private firms, is the one that offers regular jobs. Employment growth in this sector has been
just about 0.5 per cent during 1994‐2000. In the post‐2000 period, organised sector employment has, infact, shown an absolute
decline; it declined by about one million from around 28 million to 27 million during 2000‐2003, (GOI, 2005a). of around 21
million new employment opportunities generated during 1994‐2000 only about 4 per cent has been in the organised sector, and
the rest 96 per cent in the unorganised sector (Planning Commission, 2002). Employment growth is a function of growth of
GDP and employment elasticity. Indian economy has sustained a relatively high growth of over 6 per cent for about two
decades and is expected to grow at that, if not a higher, rate in coming years. There are indications towards reversal of the
declining trend in elasticities, particularly in manufacturing and expectations of a growth structure in which sectors with higher
employment elasticity will grow faster. Thus overall employment elasticity is likely to increase from the low of 0.15
experienced during 1994‐2000. There is, therefore, a strong likelihood of growth rate of employment getting restored to over 2
per cent during the first decade of this century. In fact, the evidence from the limited sample survey of the NSSO suggests a
reversal of the trend already during the 2000‐2004 when employment growth is estimated to be around 2.70 per cent. This,
however, is still to be validated by the results of the larger sample survey (GOI, 2005b).
V. INFORMAL/UNORGANISED EMPLOYMENT AND FORMAL/ORGANISED EMPLOYMENT
The new concept of “informal employment” proposed by the ILO in its report to the International Labour Conference in
2002 and in a companion booklet of statistics on the informal economy defines informal employment as employment without
secure contracts, worker benefits or social protection (ILO, 2002a and 2002b). It is comprised of two basic components: self-
employment in informal enterprises and paid employment in informal jobs. The informal self-employed include, employers who
hire others, own account workers and unpaid contributing family members. Informal paid workers include casual day labourers,
domestic workers, industrial outworkers and various types of contract workers. The idea is that both types of informal
employment - self-employment and paid employment – are associated with the lack of secure contracts, worker benefits or
social protection, as well as low average earnings. Of course, there are differences between the two sub-groups. In general, the
self-employed face problems of exclusion from capital and product markets, while paid workers face unfavourable terms of
inclusion in labour markets. But both typically lack bargaining power in the markets within which they operate, both labour
markets and other factor markets, and are both typically excluded from social protection. Most self-employed, especially own
account workers, as well as informal paid workers, cannot afford to pay for their own social protection. Few informal paid
workers are likely to have employment-based protection. And few informal workers or producers are likely to receive much by
way of protection from the State.

Dr. Elena et al., International Journal of Advance Research in Computer Science and Management Studies
Volume 3, Issue 5, May 2015 pg. 113-122
© 2015, IJARCSMS All Rights Reserved ISSN: 2321-7782 (Online) 118 | P a g e
Table: 2 Percentage Distributions of Workers in Formal/Informal Sectors/Employment
Informal Workers (In Millions)
Year Informal Sector Formal Sector Total
1 2 3 4
1999‐00 93.6 6.4 100 362.75
2004‐05 93.1 6.9 100 422.61
2009‐10 91.2 8.8 100 423.17
Formal workers
1999‐00 5.3 94.7 100 33.64
2004‐05 4.1 95.9 100 34.85
2009‐10 4.5 95.5 100 37.25
Total workers
1999‐00 86.2 13.8 100 396.39
2004‐05 86.3 13.7 100 457.47
2009‐10 84.2 15.8 100 460.42
Source: NCEUS, 2009 and Kannan, 2011.
Table: 2 Shows formal or organised sector is defined to consist of the entire public sectorand the private sector enterprises
employing 10 or more workers. It accounted foronly about 14 per cent of total employment in 1999-2000 as also in 2004-05.
The proportion is found to have slightly increased to 16 per cent in 2009-10. Still that leaves 84 per cent of workers in the
‘unorganised’ or ‘informal’ sector, with no job security or social security. Even in the formal sector, over half the workers are in
‘informal’ category, with no secured tenure of employment, nor any protection against the contingent risks during or after
employment. What is further distressing to note is that their proportion has been rising: ‘informally’ employed workers
constituted 42 per cent of those employed in the formal sector in 1999-2000, the figure increased to 47 per cent in 2004-05 and
stood at 51 per cent in 2009-10. A small proportion (about half a per cent) of those employed in the informal sector enjoyed a
measure of job security and social security. Thus of all the workers in the formal and informal sectors together, 92 per cent were
in ‘informal’ employment. Only 8 per cent were in employment with secured job tenure and with social security against
contingent risks of work and life. Their proportion has remained more or less constant during the decade 1999-2000/2009-10.
By defining informality in terms of employment status or employment relationships, the new concept of informal
employment represents a major conceptual shift. To begin with, it transfers some of the responsibility for informality from the
informal workforce to formal structures (public and private). The thinking associated with the old concept of the informal sector
assumed that informal enterprises were avoiding formality, namely registration and taxation. The new thinking associated with
the concept of the informal economy assumes that those concerned would like the benefits of formality: namely, secure work,
Dr. Elena et al., International Journal of Advance Research in Computer Science and Management Studies
Volume 3, Issue 5, May 2015 pg. 113-122
© 2015, IJARCSMS All Rights Reserved ISSN: 2321-7782 (Online) 119 | P a g e
worker benefits, social protection and voice, but that formal enterprises or the formal regulatory system serve to “exclude” them
from these benefits. Under the new conceptualization, informal employment is seen as resulting from a process of exclusion
from the non-wage benefits of employment. The claim that the informal sector offers worse working conditions is controversial.
On one hand, several studies (Marcouiller, Ruiz de Castilla, and Woodruff (1997), Goldberg and Pavcnik (2003), Pavcnik
et. al (2004) documented that workers with otherwise comparable observable characteristics are paid lower wages in the
informal sectors of Peru, El Salvador, and Brazil, and Colombia; moreover, workers employed in the informal sector are
considerably less likely to receive non-wage benefits, and in household survey questionnaires they express less satisfaction with
their working environment and job quality. On the other hand, some individuals may choose to work in the informal sector
because they value the greater flexibility in work arrangements offered by this sector; to the extent that this is true, the observed
differences in pay between formal and informal jobs may be partly driven by selection of individuals based on unobservable
tastes or characteristics.
The usual argument that trade liberalization will increase informality is that foreign competition forces firms to cut costs,
which they in part do by employing a higher proportion of informal workers. Goldberg and Pavcnik (2003) presented a model
that formalizes this idea and shows that under certain theoretical assumption, firms within an industry may find it optimal to hire
relatively more informal workers after a permanent decline in industry tariffs. To the extent that jobs in the informal sector are
associated with relatively lower pay and worse working conditions, the relative expansion of the informal sector following a
trade liberalization episode, could contribute to growing inequality, especially since the informal sector tends to employ a higher
proportion of less-educated workers.
It may be further noted that informal sector employment is only a subset of informal employment (Papola, 1981, Mitra,
1994 and Sastry, 2004). The latter includes informal sector employment as well as those engaged informally in the formal or
organized sector. In the recent years both in the organized industry and organized tertiary sector, employment through private
contractors has taken place. Though the wage rate of such contract labour in the organized or the formal sector may be higher
than the wage rate prevailing in the informal sector, labour laws and several benefits that apply to regular wage or salaried
workers in the organized or formal sector are not applicable to the contract workers. The estimate of informal employment at the
city level turned out to be around 60 per cent several years ago, (Mitra, 1994), and this is expected to have gone up further in
the recent years. Use of contract labour through other labour agencies (labour intermediaries), sub-contracting and outsourcing
of activities by the main firm on piece rate basis and casualisation of work force are seen as a part of globalization process.
Firms in an attempt to avoid strict labour laws and reduce labour cost have taken recourse to these means in the absence of
labour market deregulation, and state governments in the fear of losing revenue have extended indirect support to these practices
(Tendulkar, 2004 and Uchikawa, 2003). Though employment growth in the organized industry in India has gone up in the
reform period, a large part of labour earnings is expropriated by the so called labour intermediaries. Amendments of labour laws
could have at least reduced such adverse outcomes (Mitra and Bhanumurthy, 2006).
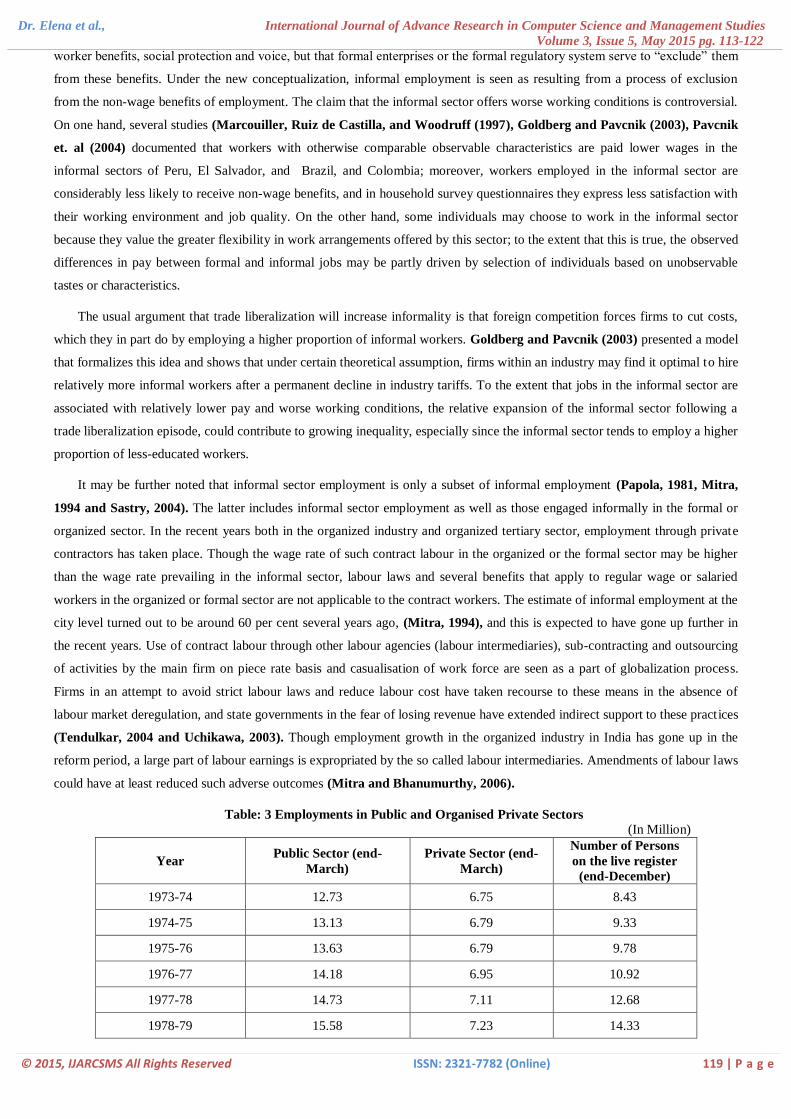
Table: 3 Employments in Public and Organised Private Sectors
(In Million)
Year Public Sector (end-
March)
Private Sector (end-
March)
Number of Persons
on the live register
(end-December)
1973-74 12.73 6.75 8.43
1974-75 13.13 6.79 9.33
1975-76 13.63 6.79 9.78
1976-77 14.18 6.95 10.92
1977-78 14.73 7.11 12.68
1978-79 15.58 7.23 14.33

Dr. Elena et al., International Journal of Advance Research in Computer Science and Management Studies
Volume 3, Issue 5, May 2015 pg. 113-122
© 2015, IJARCSMS All Rights Reserved ISSN: 2321-7782 (Online) 120 | P a g e
1979-80 15.12 7.24 16.2
1980-81 15.48 7.4 17.84
1981-82 16.28 7.53 19.75
1982-83 16.75 7.39 21.95
1983-84 17.22 7.36 23.55
1984-85 17.58 7.43 26.27
1985-86 17.68 7.37 30.13
1986-87 18.24 7.39 30.25
1987-88 18.32 7.39 30.05
1988-89 18.51 7.45 32.78
1989-90 18.77 7.58 34.63
1990-91 19.06 7.68 36.3
1991-92 19.21 7.85 36.76
1992-93 19.33 7.85 36.28
1993-94 19.45 7.93 36.69
1994-95 19.47 8.06 36.74
1995-96 19.43 8.51 37.43
1996-97 19.56 8.69 39.14
1997-98 19.42 8.75 40.09
1998-99 19.41 8.7 40.37
1999-00 19.31 8.65 41.34
2000-01 19.14 8.65 42
2001-02 18.77 8.43 41.17
2002-03 18.58 8.42 41.39
2003-04 18.2 8.25 40.46
2004-05 18.01 8.45 39.35
2005-06 18.19 8.77 41.47
2006-07 18 9.24 39.97
2007-08 17.67 9.88 39.11
2008-09 17.8 10.38 38.15
2009-10 17.86 10.85 38.83
2010-11 17.55 11.45 40.17 Source : Directorate General of Employment and Training. Ministry of Labour & Employment, Government of India.

Dr. Elena et al., International Journal of Advance Research in Computer Science and Management Studies
Volume 3, Issue 5, May 2015 pg. 113-122
© 2015, IJARCSMS All Rights Reserved ISSN: 2321-7782 (Online) 121 | P a g e
Table: 3 Shows the percentage distribution of the level of employment of the workers in the year 1990-91 in the Public
sector (end March) was 19.06% and 7.68% in the Private sector (end March). In 1991-92 it was 19.21% in the Public Sector and
7.85% in the Private sector. In the year 1992-93 the percentage was 19.33% in the Public sector and 7.85% in the Private sector.
The percentage distribution of the employment level in the year 1993-94 was 19.45% in the Public sector and 7.93% in the
Private sector. In 1994-95 it was 19.47% in the Public sector and 8.06% in the Private sector. In the year 1995-96 the percentage
distribution was 19.43% in the Public sector and 8.51% in the Private sector. In the year 1996-97 the level was 19.56% in the
Public sector and 8.69% in the Private sector. In 1997-98 the percentage distribution was 19.42% in the Public sector and 8.75%
in the Private sector. The percentage distribution of the workers in the year 1998-99 was 19.41% in the Public sector and 8.7%
in the Private sector. In the year 1999-00 it was 19.31% in the Public sector and 8.65% in the Private sector. In the year 2000-01
the percentage distribution of the workers in the Public sector was 19.14% and in the Private sector was 8.65%. In the year
2001-02 it was 18.77% in the Public sector and 8.43% in the Private sector. In 2002-03 the distribution of workers was 18.58%
in the Public sector and 8.42% in the Private sector. The percentage distribution of workers in the year 2003-04 in the Public
sector was 18.2% and in the Private sector it was 8.25%. In 2004-05 it was 18.01% in the Public sector and 8.45% in the Private
sector. In the year 2005-06 the percentage distribution of the workers in the Public sector was 18.19% and in the Private sector
was 8.77%. In 2006-07 it was 18% in the Public sector and 9.24% in the Private sector. The percentage distribution in the year
2007-08 in the Public sector was 17.67% and 9.88% in the Private sector. In the year 2008-09 the percentage distribution was
17.8% in the Public sector and 10.38% in the Private sector. In 2009-10 the percent was 17.86% in the Public sector and 10.85%
in the Private sector.
Organized sector employment has experienced a virtual stagnation over the period 1994-2000 showing a growth rate of
only 0.56% per annum, mainly in a few sectors—trade, hotels and restaurants, and finance and insurance, even as unorganized
sector employment has grown, in fact, at a more rapid rate. According to estimates provided by the Director General of
Employment and Training (DGET), organized sector employment saw an absolute decline of 9.1 lakh during the period March
1997 to March 2002; more than half of it in the manufacturing sector. During a single year 2001-2002, organized sector
employment declined by 4.2 lakh. Unorganized sector employment, on the other hand, has shown consistently higher growth
than the organized sector. The share of unorganized sector employment which was estimated to be around 93% earlier should,
therefore, have gone up and may further increase over the coming years. Thus, more and more people are dependent upon the
informal/unorganized sector, but its wages continue to be low. Moreover, “the organised-unorganised duality” in the labor force
has increased over the four decades (Tendulkar 2003). Directorate General of Employment and Training (DGET) defined
employment in the unorganized sector as a residual of total workers minus workers in the organized sector. Treating

Dr. Elena et al., International Journal of Advance Research in Computer Science and Management Studies
Volume 3, Issue 5, May 2015 pg. 113-122
© 2015, IJARCSMS All Rights Reserved ISSN: 2321-7782 (Online) 122 | P a g e
unorganized and informal sector as synonymous, the Task Force appointed by the commission formulated a set of harmonized
definitions of the sector and informal employment. It reported that unorganized/informal sector workers constituted 86 per cent
of the workforce, and informal employment in both unorganized and organized sector comprised 92 per cent in 2004-05. It also
developed a new direct method of computing the sector’s contribution to the national Gross Domestic Product (GDP), which
estimated its contribution to be nearly 50 per cent in 2004-05 as against 55.42 per cent in 1999-2000 (NCEUS 2008, p. 6).
VI. CONCLUSION
In India, open unemployment is very small. The major problem of the Indian economy is under-employment. Out of the
total unemployment of 7.32 percent, open unemployment was only 2.81 percent, whereas under-employment was of the order of
4.41 percent. It is very necessary that work should be provided to the already unemployment and new entrants to the labour
force, and for this purpose, employment strategies have to be woven within the growth strategy. But bulk of poverty line.
Employment generation programmes like the Jawahar Rozgar Yojna and the Prime Minister’s Gram Rozgar Yojana, do help to
reduce under-employment. In that sense, these programmes do have a role in poverty reduction. There is a need to make these
programmes better targeted so that the poor are helped in a genuine manner. But a more important action needs to be taken in
integrating the growth objective and the employment objective. Though this is not an easy task to accomplish, yet it is vitally
necessary. For this purpose, it would be desirable that those sectors of the economy which have relatively higher employment
elasticity should be promoted. A judicious mix of sectors with high employment potential and those with moderate or low
employment potential is made.
References
1. Bhalla, G.S. (2008), “Globalisation and Employment Trends in India”, The Indian Journal of Labour Economics, Vol.51, No.1.
2. Chandrasekhar, C.P. and Ghosh, Jayati (2007), “Recent Employment Trends in India and China: An unfortunate Convergence?”, The Indian Journal of
Labour Economics, Vol. 50, No.3.
3. Chen, M., Vanek, J., Lund, F., Heintz, J., Jhabvala, R., and Bonner, C. (2005), “Progress of theWorld’s Women 2005: Women, Work, and Poverty,” New
York: UNIFEM.
4. GOI (2005a), Economic Survey, 2005‐2005, Government of India, Ministry of Finance, Economic Division.
5. GOI (2005b): Employment and Unemployment Situation in India: January‐June, 2004, Government of India, National Sample Survey Organisation,
Report No. 506.
6. Goldberg, P. and N. Pavcnik (2003): “The Response of the Informal Sector to Trade Liberalization”, Journal of Development Economics, 72, 463-496.
7. ILO (2004c), World Employment Report 2004/5, Geneva: International Labour Office.
8. Marcouiller, D., V. Ruiz de Castilla, and C. Woodruff (1997): “Formal Measures of the Informal-Sector Wage Gap in Mexico, El Salvador, and Peru,"
Economic Development and Cultural Change, 45:2, pp. 367-392.
9. Mitra, Arup (1994), Urbanisation, Slums, Informal Sector Employment and Poverty: An Exploratory Study, B.R. Publishing Corporation, Delhi.
10. Papola, T.S. (1981), Urban Informal Sector in a Developing Economy, Vikas Publishing House.
11. Pavcnik, N., A. Blom, P.K. Goldberg, and N. Schady (2004): “Trade Policy and Industry WageStructure: Evidence from Brazil,” World Bank Economic
Review, 18(3), 319-344
12. Rama, Martín (2002a), “Globalization and workers in developing countries,” East-WestCenter Working Papers, Honolulu: East-West Center.
13. Rodrik, D., 1999. “Democracies Pay Higher Wages.” Quarterly Journal of Economics 114(3):707-38.
14. Sen, Amartya (1999), “Development as Freedom”, New York: Knopf.
15. Tendulkar, Suresh D. (2004), “Organised Labour Market in India: Pre and Post Reform”, Paper Presented at the Conference on Anti Poverty and Social
Policy in India, Alwar, January 2-4, 2004.
16. Trefler, Daniel (1993), “International factor price differences: Leontief was right!” Journal of Political Economy 101(6): 961-87.
17. World Employment Report – 2004-05.
18. Uchikawa, S. (2003), Labour Market and Institution in India: 1990s and Beyond, Manohar, Delhi.
19. Unni, Jeemol (2005), “Wage and Income in Formal and Informal Sector in India”, The Indian Journal of Labour Economics, Vol.48, No.2.