global technology ipo review full-year and q4 2013 global technology ipo review full-year and q4...
TRANSCRIPT
www.pwc.com
Global TechnologyIPO ReviewFull-year and Q4 2013
Technology Institute
A quarterly look at global trends in the technology IPO market
February 2014

The comeback

1www.pwc.com/globaltechipo IPO Review full-year and Q4 2013 Global Technology
The comeback
Welcome to the full-year and fourth quarter 2013 issue of PwC’s Global Technology IPO Review. It’s been some time since we’ve seen a strong technology IPO market. The past couple of years have started on a strong note but ended in disappointment. I’m happy to say that trend took an abrupt turnabout in 2013. Even in the face of an IPO freeze in China, 2013 ended on a high note, with Q4 contributing almost half to total annual IPO proceeds, due in part to Twitter’s IPO.
As you’ll see in the pages that follow, increased technology IPO activity occurred in many markets around the globe as competition across all sectors and, increasingly, all markets is driving demand for software solutions that digitise products and services. The outlook for 2014 is positive, not only due to the momentum established in Q4, but also because of the news from China that the authorities have lifted the freeze imposed in late 2012 on Chinese IPOs.
Please reach out to me or any member of our global technology team listed at the back of this document if you would like to discuss these findings and how they may impact your business.
Sincerely,
Raman Chitkara
Raman ChitkaraPartner and Global TechnologyIndustry LeaderPricewaterhouseCoopers [email protected]

Contents
3www.pwc.com/globaltechipo IPO Review full-year and Q4 2013 Global Technology
Contents
Executive summary 4
Q4 surge reverses the past two-year trend 5
Chinese technology IPOs subdued in 2013 5
Improving market conditions in Europe jumpstart IPO resurgence 5
Increasingly digital economy raises interest and demand for Soft- ware and Software Services companies
6
Full-year 2013 7
Geographic distribution 8
Subsector distribution 9
Quarterly summary by subsector 10
Stock exchange distribution 13
2013 Technology IPO listing 14
2010-2013 Technology IPO trends 16
IPO summary 16
Summary by subsector 17
Q4 2013 20
Top 10 technology deals 21
Geographic trends 22
Stock exchange distribution 26
Sector distribution 29
Key financials 30
Valuation metrics 34
Methodology 35
Contacts 36
About PwC 37
4 Global Technology IPO Review full-year and Q4 2013 www.pwc.com/globaltechipo
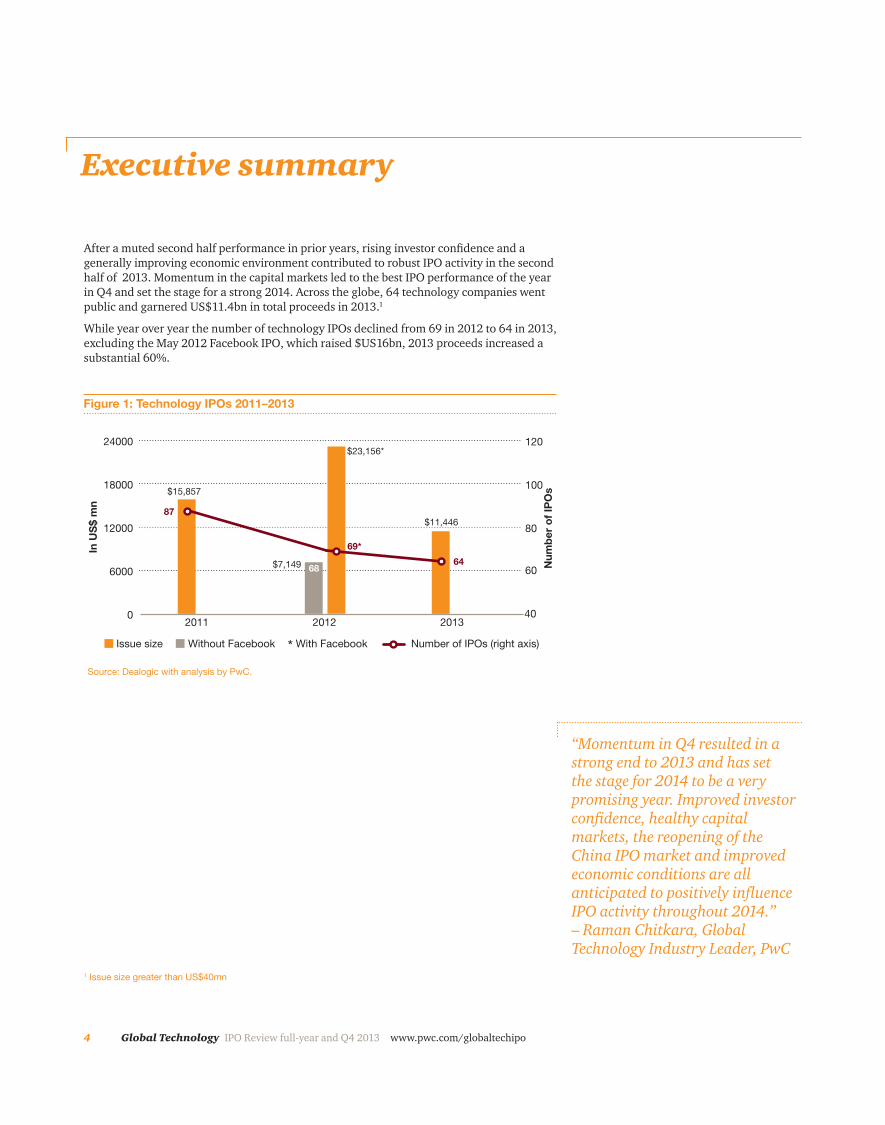
After a muted second half performance in prior years, rising investor confidence and a generally improving economic environment contributed to robust IPO activity in the second half of 2013. Momentum in the capital markets led to the best IPO performance of the year in Q4 and set the stage for a strong 2014. Across the globe, 64 technology companies went public and garnered US$11.4bn in total proceeds in 2013.1
While year over year the number of technology IPOs declined from 69 in 2012 to 64 in 2013, excluding the May 2012 Facebook IPO, which raised $US16bn, 2013 proceeds increased a substantial 60%.
Executive summary
0
6000
12000
18000
24000
201320122011
In U
S$
mn
Num
ber
of
IPO
s
40
60
80
100
120
Issue size Number of IPOs (right axis)
69*
87
64
Figure 1: Technology IPOs 2011–2013
$11,446
$15,857
$23,156*
Source: Dealogic with analysis by PwC.
$7,149
With FacebookWithout Facebook
68
*
1 Issue size greater than US$40mn
“Momentum in Q4 resulted in a strong end to 2013 and has set the stage for 2014 to be a very promising year. Improved investor confidence, healthy capital markets, the reopening of the China IPO market and improved economic conditions are all anticipated to positively influence IPO activity throughout 2014.” – Raman Chitkara, Global Technology Industry Leader, PwC
5www.pwc.com/globaltechipo IPO Review full-year and Q4 2013 Global Technology
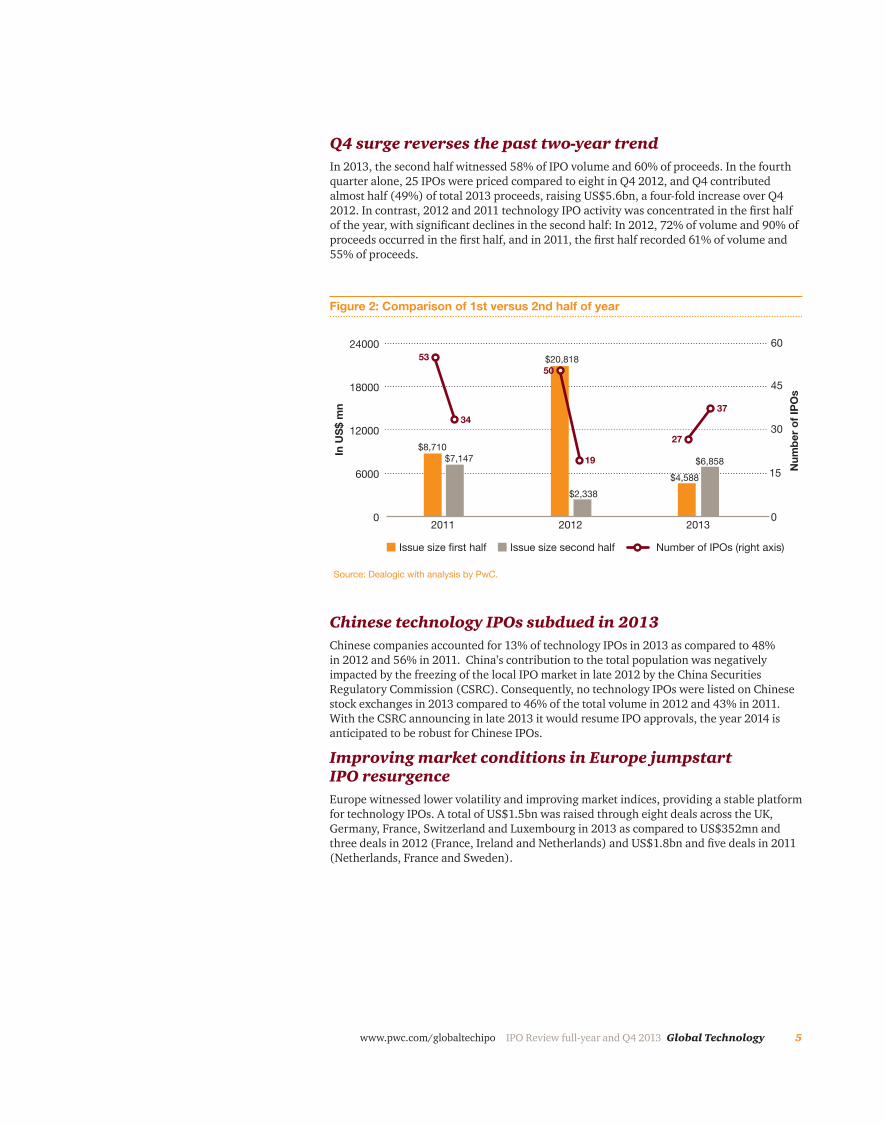
Q4 surge reverses the past two-year trendIn 2013, the second half witnessed 58% of IPO volume and 60% of proceeds. In the fourth quarter alone, 25 IPOs were priced compared to eight in Q4 2012, and Q4 contributed almost half (49%) of total 2013 proceeds, raising US$5.6bn, a four-fold increase over Q4 2012. In contrast, 2012 and 2011 technology IPO activity was concentrated in the first half of the year, with significant declines in the second half: In 2012, 72% of volume and 90% of proceeds occurred in the first half, and in 2011, the first half recorded 61% of volume and 55% of proceeds.
0
6000
12000
18000
24000
201320122011
In U
S$ m
n
Num
ber o
f IPO
s
0
15
30
45
60
Issue size first half Number of IPOs (right axis)
27
50
37
Figure 2: Comparison of 1st versus 2nd half of year
$6,858
$20,818
$4,588
Source: Dealogic with analysis by PwC.
$2,338
Issue size second half
19$8,710
$7,147
53
34
Chinese technology IPOs subdued in 2013Chinese companies accounted for 13% of technology IPOs in 2013 as compared to 48% in 2012 and 56% in 2011. China’s contribution to the total population was negatively impacted by the freezing of the local IPO market in late 2012 by the China Securities Regulatory Commission (CSRC). Consequently, no technology IPOs were listed on Chinese stock exchanges in 2013 compared to 46% of the total volume in 2012 and 43% in 2011. With the CSRC announcing in late 2013 it would resume IPO approvals, the year 2014 is anticipated to be robust for Chinese IPOs.
Improving market conditions in Europe jumpstart IPO resurgence Europe witnessed lower volatility and improving market indices, providing a stable platform for technology IPOs. A total of US$1.5bn was raised through eight deals across the UK, Germany, France, Switzerland and Luxembourg in 2013 as compared to US$352mn and three deals in 2012 (France, Ireland and Netherlands) and US$1.8bn and five deals in 2011 (Netherlands, France and Sweden).
6 Global Technology IPO Review Q4 and full year 2013
Increasingly digital economy raises interest and demand for Software and Software Services companiesFrom a subsector perspective, Internet Software & Services and Software recorded the most deals in 2013, together contributing 66% of total deal volume and 64% of total proceeds. This compares to 49% of total deals and 87% of total proceeds in 2012 and 44% of total deals and 55% of total proceeds in 2011. As the world increasingly goes digital, the demand for software continues to rise and as evidenced by continued pricing of IPOs of software companies. Price competition in devices is leading hardware companies to deliver more value-added software and/or services and companies traditionally seen outside the technology sector are digitising products and services with software. On a quarterly basis, the Internet Software & Services and Software subsectors contributed more than 68% (17 deals) of total deals and 75% (US$4.2bn) of total proceeds in Q4 2013, compared to six IPOs (75% of total deals) contributing 30% (US$399mn) of total proceeds in Q4 2012 and eight IPOs contributing 38% of deals and 60% (US$3.4bn) of total proceeds in 2011.
Full-year 2013 technology IPO summary
7www.pwc.com/globaltechipo IPO Review full-year and Q4 2013 Global Technology
0
1600
3200
4800
6400
Q4 2013Q3 2013Q2 2013Q1 2013
In U
S$ m
n
Num
ber o
f IPO
s
0
8
16
24
32
Issue size Number of IPOs (right axis)
12
17
10
25
$2,870
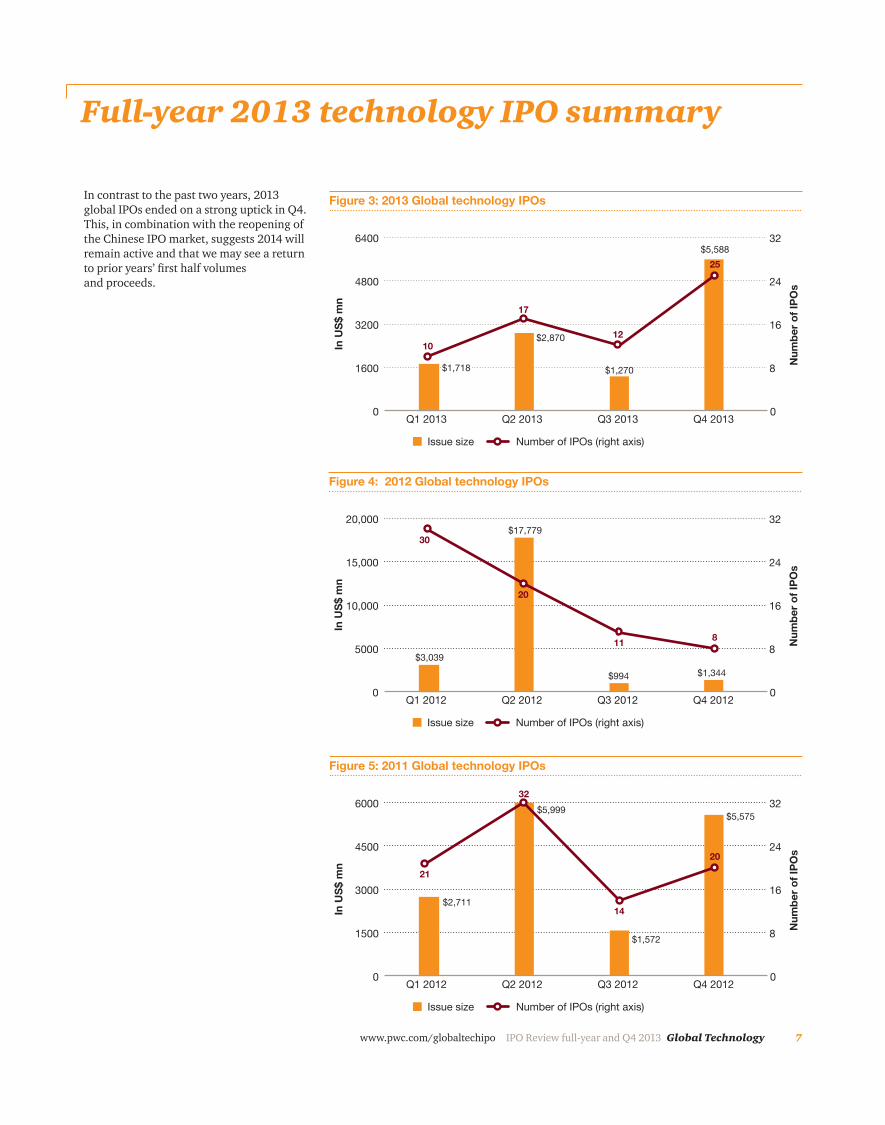
Figure 3: 2013 Global technology IPOs
$1,718 $1,270
$5,588
0
5000
10,000
15,000
20,000
Q4 2012Q3 2012Q2 2012Q1 2012
In U
S$ m
n
Num
ber o
f IPO
s
0
8
16
24
32
Issue size Number of IPOs (right axis)
11
20
30
8
$17,779
Figure 4: 2012 Global technology IPOs
$3,039
$994 $1,344
0
1500
3000
4500
6000
Q4 2012Q3 2012Q2 2012Q1 2012
In U
S$ m
n
Num
ber o
f IPO
s
0
8
16
24
32
Issue size Number of IPOs (right axis)
14
32
21
20
$5,999
Figure 5: 2011 Global technology IPOs
$2,711
$1,572
$5,575
In contrast to the past two years, 2013 global IPOs ended on a strong uptick in Q4. This, in combination with the reopening of the Chinese IPO market, suggests 2014 will remain active and that we may see a return to prior years’ first half volumes and proceeds.
Full-year 2013 technology IPO summary
8 Global Technology IPO Review full-year and Q4 2013 www.pwc.com/globaltechipo
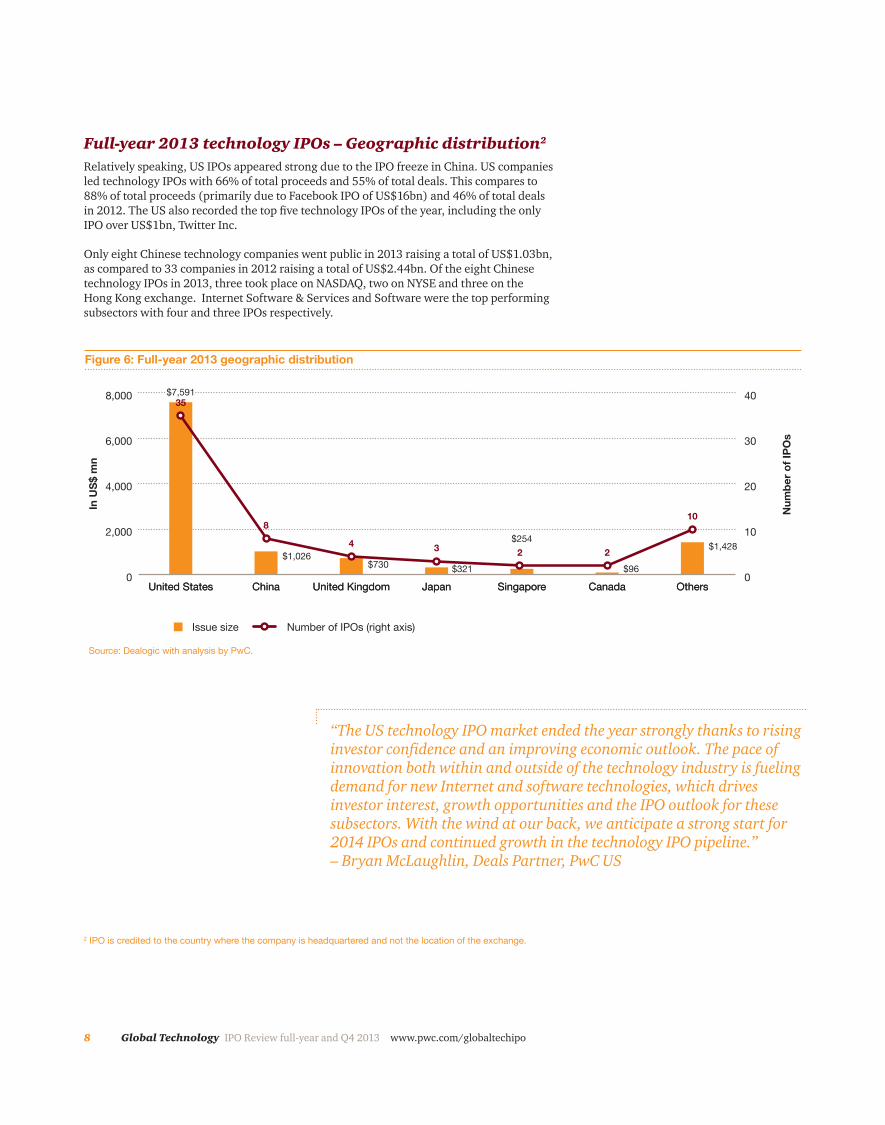
Full-year 2013 technology IPOs – Geographic distribution2 Relatively speaking, US IPOs appeared strong due to the IPO freeze in China. US companies led technology IPOs with 66% of total proceeds and 55% of total deals. This compares to 88% of total proceeds (primarily due to Facebook IPO of US$16bn) and 46% of total deals in 2012. The US also recorded the top five technology IPOs of the year, including the only IPO over US$1bn, Twitter Inc.
Only eight Chinese technology companies went public in 2013 raising a total of US$1.03bn, as compared to 33 companies in 2012 raising a total of US$2.44bn. Of the eight Chinese technology IPOs in 2013, three took place on NASDAQ, two on NYSE and three on the Hong Kong exchange. Internet Software & Services and Software were the top performing subsectors with four and three IPOs respectively.
2 IPO is credited to the country where the company is headquartered and not the location of the exchange.
“The US technology IPO market ended the year strongly thanks to rising investor confidence and an improving economic outlook. The pace of innovation both within and outside of the technology industry is fueling demand for new Internet and software technologies, which drives investor interest, growth opportunities and the IPO outlook for these subsectors. With the wind at our back, we anticipate a strong start for 2014 IPOs and continued growth in the technology IPO pipeline.” – Bryan McLaughlin, Deals Partner, PwC US
In U
S$ m
n
Issue size Number of IPOs (right axis)
Num
ber o
f IPO
s
Figure 6: Full-year 2013 geographic distribution
Source: Dealogic with analysis by PwC.
0
2,000
4,000
6,000
8,000
OthersCanadaSingaporeJapanUnited KingdomChinaUnited States0
10
20
30
40
OthersCanadaSingaporeJapanUnited KingdomChinaUnited States
2234
8
35
10
$1,428$1,026
$730 $321 $96
$254
$7,591
9www.pwc.com/globaltechipo IPO Review full-year and Q4 2013 Global Technology
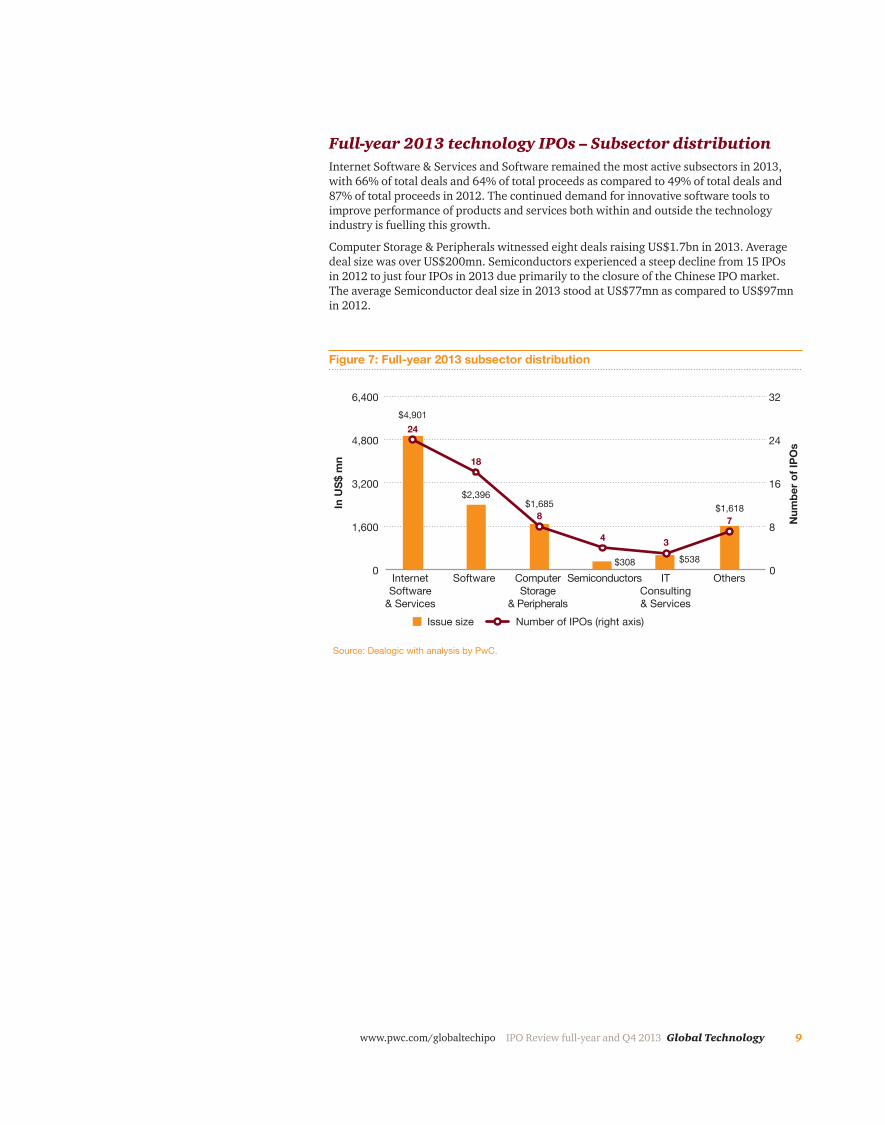
Full-year 2013 technology IPOs – Subsector distributionInternet Software & Services and Software remained the most active subsectors in 2013, with 66% of total deals and 64% of total proceeds as compared to 49% of total deals and 87% of total proceeds in 2012. The continued demand for innovative software tools to improve performance of products and services both within and outside the technology industry is fuelling this growth.
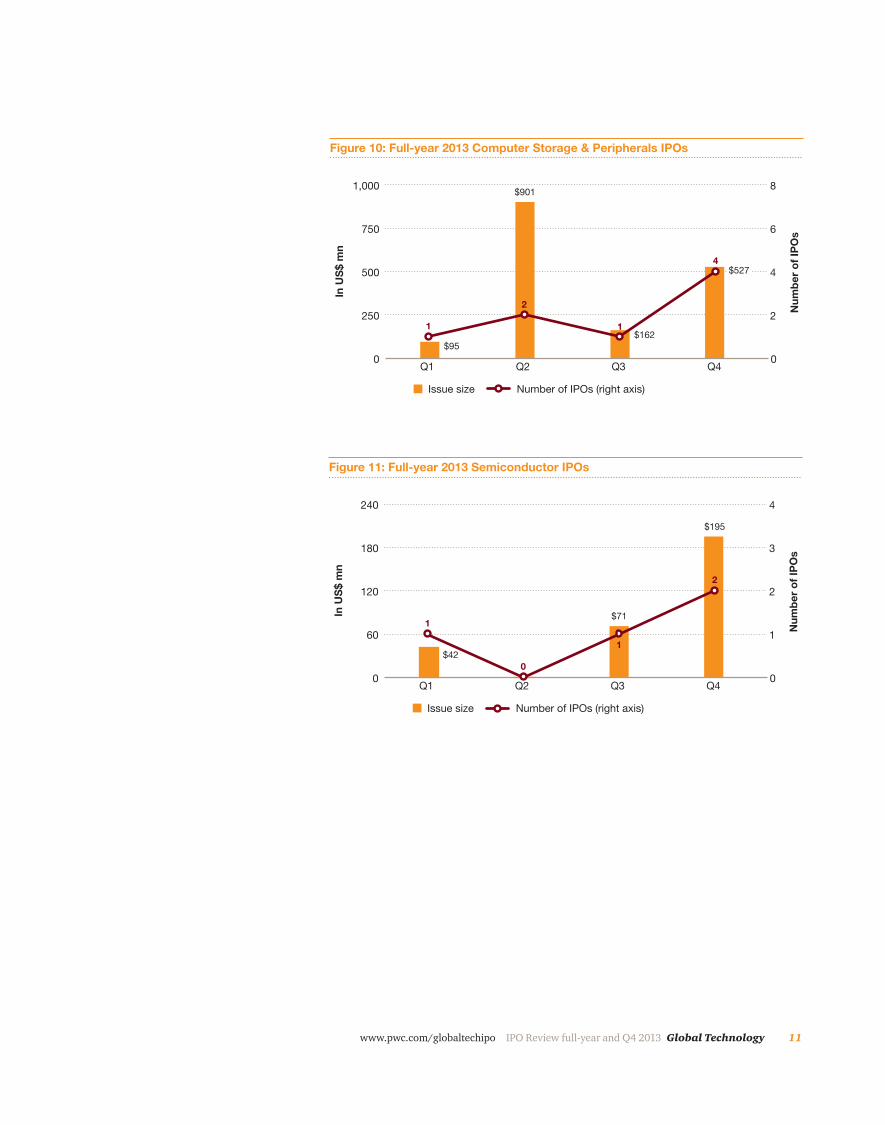
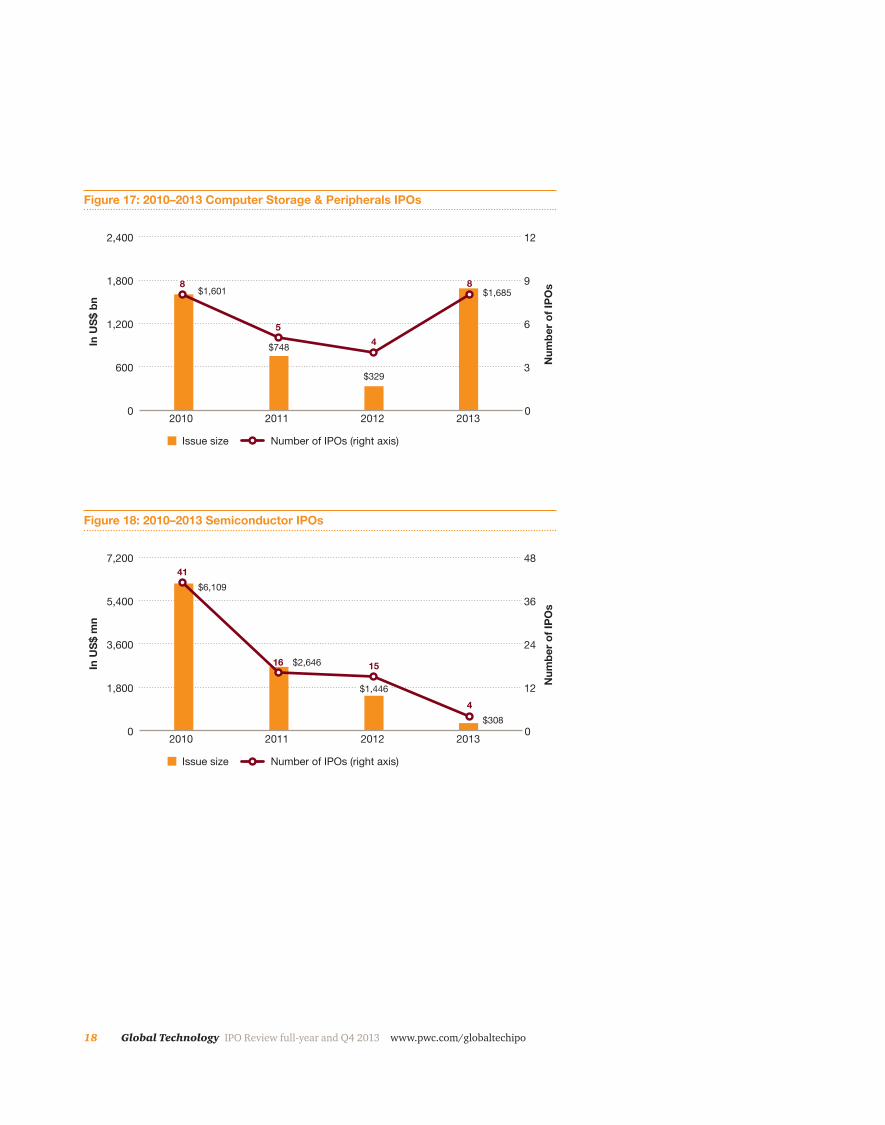
Computer Storage & Peripherals witnessed eight deals raising US$1.7bn in 2013. Average deal size was over US$200mn. Semiconductors experienced a steep decline from 15 IPOs in 2012 to just four IPOs in 2013 due primarily to the closure of the Chinese IPO market. The average Semiconductor deal size in 2013 stood at US$77mn as compared to US$97mn in 2012.
0
1,600
3,200
4,800
6,400
OthersITConsulting& Services
SemiconductorsComputerStorage
& Peripherals
SoftwareInternetSoftware
& Services
In U
S$ m
n
Num
ber o
f IPO
s
0
8
16
24
32
Issue size Number of IPOs (right axis)
4
8
18
24
7
3
Figure 7: Full-year 2013 subsector distribution
$2,396
$538
$1,685 $1,618
$308
$4,901
Source: Dealogic with analysis by PwC.
10 Global Technology IPO Review full-year and Q4 2013 www.pwc.com/globaltechipo
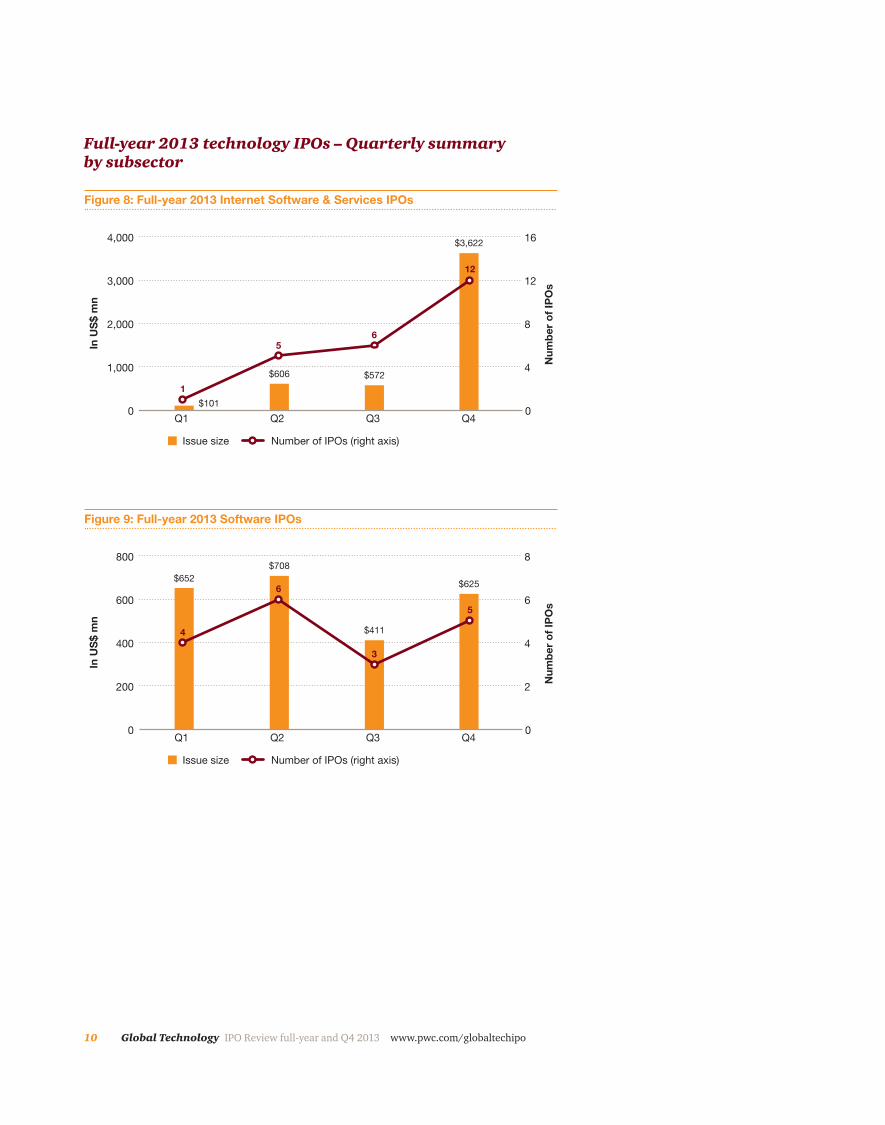
Full-year 2013 technology IPOs – Quarterly summary by subsector
0
1,000
2,000
3,000
4,000
Q4Q3Q2Q1
In U
S$
mn
Num
ber
of
IPO
s
0
4
8
12
16
Issue size Number of IPOs (right axis)
56
1
12
Figure 8: Full-year 2013 Internet Software & Services IPOs
$101
$606 $572
$3,622
0
200
400
600
800
Q4Q3Q2Q1
In U
S$
mn
Num
ber
of
IPO
s
0
2
4
6
8
Issue size Number of IPOs (right axis)
6
3
4
5
Figure 9: Full-year 2013 Software IPOs
$652
$411
$625
$708
11www.pwc.com/globaltechipo IPO Review full-year and Q4 2013 Global Technology
0
250
500
750
1,000
Q4Q3Q2Q1
In U
S$
mn
Num
ber
of
IPO
s
0
2
4
6
8
Issue size Number of IPOs (right axis)
2
11
4
Figure 10: Full-year 2013 Computer Storage & Peripherals IPOs
$95$162
$901
$527
0
60
120
180
240
Q4Q3Q2Q1
In U
S$ m
n
Num
ber o
f IPO
s
0
1
2
3
4
Issue size Number of IPOs (right axis)
1
0
1
2
Figure 11: Full-year 2013 Semiconductor IPOs
$42
$71
$195
12 Global Technology IPO Review full-year and Q4 2013 www.pwc.com/globaltechipo
0
200
400
600
800
Q4Q3Q2Q1
In U
S$
mn
Num
ber
of
IPO
s
0
1
2
3
4
Issue size Number of IPOs (right axis)
2
1
2 2
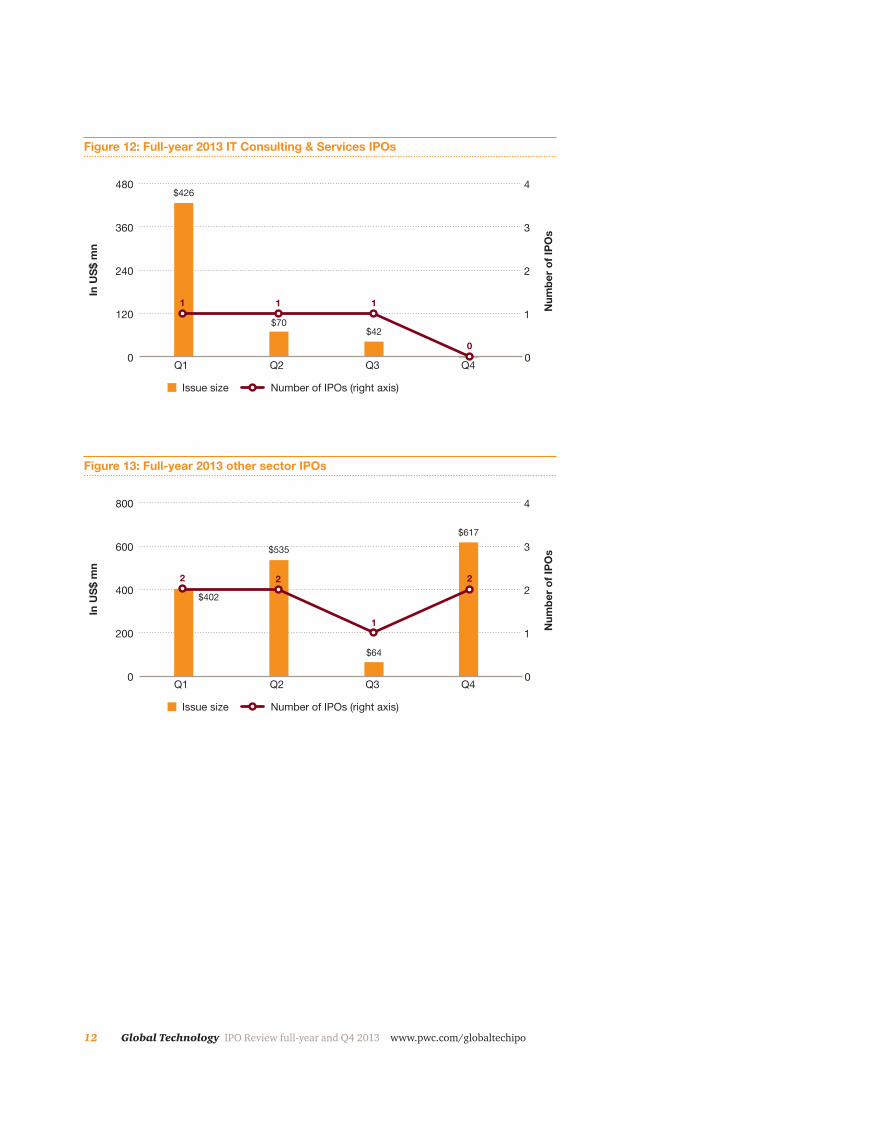
Figure 13: Full-year 2013 other sector IPOs
$402
$64
$617
$535
0
120
240
360
480
Q4Q3Q2Q1
In U
S$ m
n
Num
ber o
f IPO
s
0
1
2
3
4
Issue size Number of IPOs (right axis)
1 11
0
Figure 12: Full-year 2013 IT Consulting & Services IPOs
$426
$42$70
13www.pwc.com/globaltechipo IPO Review full-year and Q4 2013 Global Technology
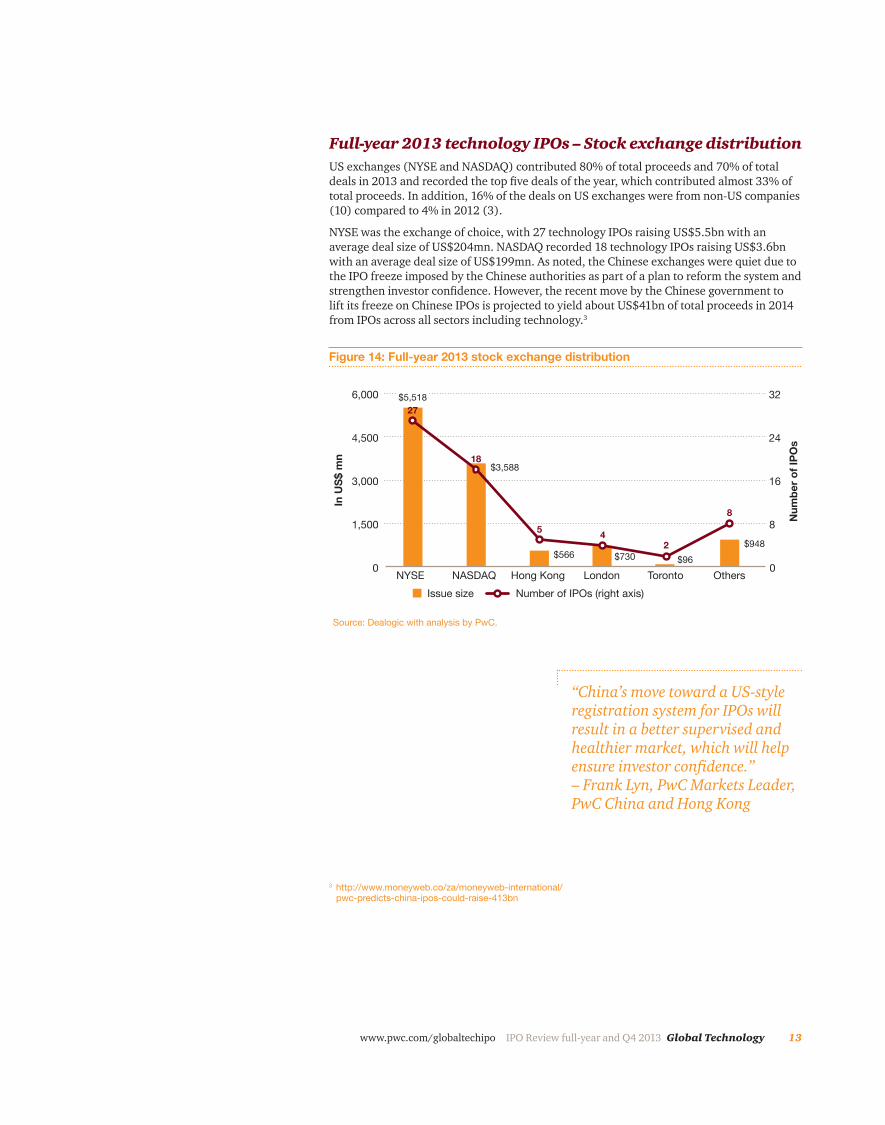
Full-year 2013 technology IPOs – Stock exchange distributionUS exchanges (NYSE and NASDAQ) contributed 80% of total proceeds and 70% of total deals in 2013 and recorded the top five deals of the year, which contributed almost 33% of total proceeds. In addition, 16% of the deals on US exchanges were from non-US companies (10) compared to 4% in 2012 (3).
NYSE was the exchange of choice, with 27 technology IPOs raising US$5.5bn with an average deal size of US$204mn. NASDAQ recorded 18 technology IPOs raising US$3.6bn with an average deal size of US$199mn. As noted, the Chinese exchanges were quiet due to the IPO freeze imposed by the Chinese authorities as part of a plan to reform the system and strengthen investor confidence. However, the recent move by the Chinese government to lift its freeze on Chinese IPOs is projected to yield about US$41bn of total proceeds in 2014 from IPOs across all sectors including technology.3
0
1,500
3,000
4,500
6,000
OthersTorontoLondonHong KongNASDAQNYSE
In U
S$ m
n
Num
ber o
f IPO
s
0
8
16
24
32
Issue size Number of IPOs (right axis)
45
18
27
8
2
Figure 14: Full-year 2013 stock exchange distribution
$3,588
$96$566$948
$730
Source: Dealogic with analysis by PwC.
$5,518
“China’s move toward a US-style registration system for IPOs will result in a better supervised and healthier market, which will help ensure investor confidence.” – Frank Lyn, PwC Markets Leader, PwC China and Hong Kong
3 http://www.moneyweb.co/za/moneyweb-international/pwc-predicts-china-ipos-could-raise-413bn
14 Global Technology IPO Review full-year and Q4 2013 www.pwc.com/globaltechipo
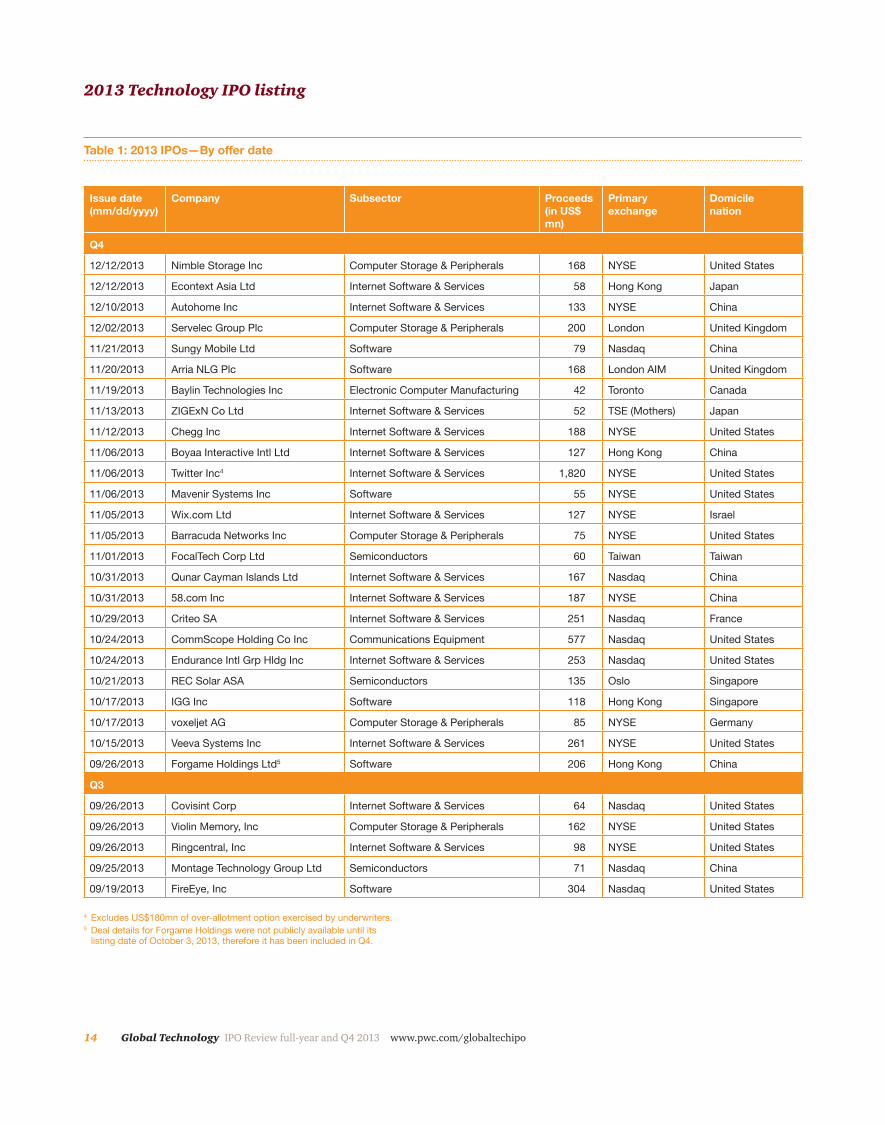
Table 1: 2013 IPOs—By offer date
2013 Technology IPO listing
Issue date (mm/dd/yyyy)
Company Subsector Proceeds (in US$ mn)
Primary exchange
Domicile nation
Q4
12/12/2013 Nimble Storage Inc Computer Storage & Peripherals 168 NYSE United States
12/12/2013 Econtext Asia Ltd Internet Software & Services 58 Hong Kong Japan
12/10/2013 Autohome Inc Internet Software & Services 133 NYSE China
12/02/2013 Servelec Group Plc Computer Storage & Peripherals 200 London United Kingdom
11/21/2013 Sungy Mobile Ltd Software 79 Nasdaq China
11/20/2013 Arria NLG Plc Software 168 London AIM United Kingdom
11/19/2013 Baylin Technologies Inc Electronic Computer Manufacturing 42 Toronto Canada
11/13/2013 ZIGExN Co Ltd Internet Software & Services 52 TSE (Mothers) Japan
11/12/2013 Chegg Inc Internet Software & Services 188 NYSE United States
11/06/2013 Boyaa Interactive Intl Ltd Internet Software & Services 127 Hong Kong China
11/06/2013 Twitter Inc4 Internet Software & Services 1,820 NYSE United States
11/06/2013 Mavenir Systems Inc Software 55 NYSE United States
11/05/2013 Wix.com Ltd Internet Software & Services 127 NYSE Israel
11/05/2013 Barracuda Networks Inc Computer Storage & Peripherals 75 NYSE United States
11/01/2013 FocalTech Corp Ltd Semiconductors 60 Taiwan Taiwan
10/31/2013 Qunar Cayman Islands Ltd Internet Software & Services 167 Nasdaq China
10/31/2013 58.com Inc Internet Software & Services 187 NYSE China
10/29/2013 Criteo SA Internet Software & Services 251 Nasdaq France
10/24/2013 CommScope Holding Co Inc Communications Equipment 577 Nasdaq United States
10/24/2013 Endurance Intl Grp Hldg Inc Internet Software & Services 253 Nasdaq United States
10/21/2013 REC Solar ASA Semiconductors 135 Oslo Singapore
10/17/2013 IGG Inc Software 118 Hong Kong Singapore
10/17/2013 voxeljet AG Computer Storage & Peripherals 85 NYSE Germany
10/15/2013 Veeva Systems Inc Internet Software & Services 261 NYSE United States
09/26/2013 Forgame Holdings Ltd5 Software 206 Hong Kong China
Q3
09/26/2013 Covisint Corp Internet Software & Services 64 Nasdaq United States
09/26/2013 Violin Memory, Inc Computer Storage & Peripherals 162 NYSE United States
09/26/2013 Ringcentral, Inc Internet Software & Services 98 NYSE United States
09/25/2013 Montage Technology Group Ltd Semiconductors 71 Nasdaq China
09/19/2013 FireEye, Inc Software 304 Nasdaq United States
4 Excludes US$180mn of over-allotment option exercised by underwriters.5 Deal details for Forgame Holdings were not publicly available until its
listing date of October 3, 2013, therefore it has been included in Q4.
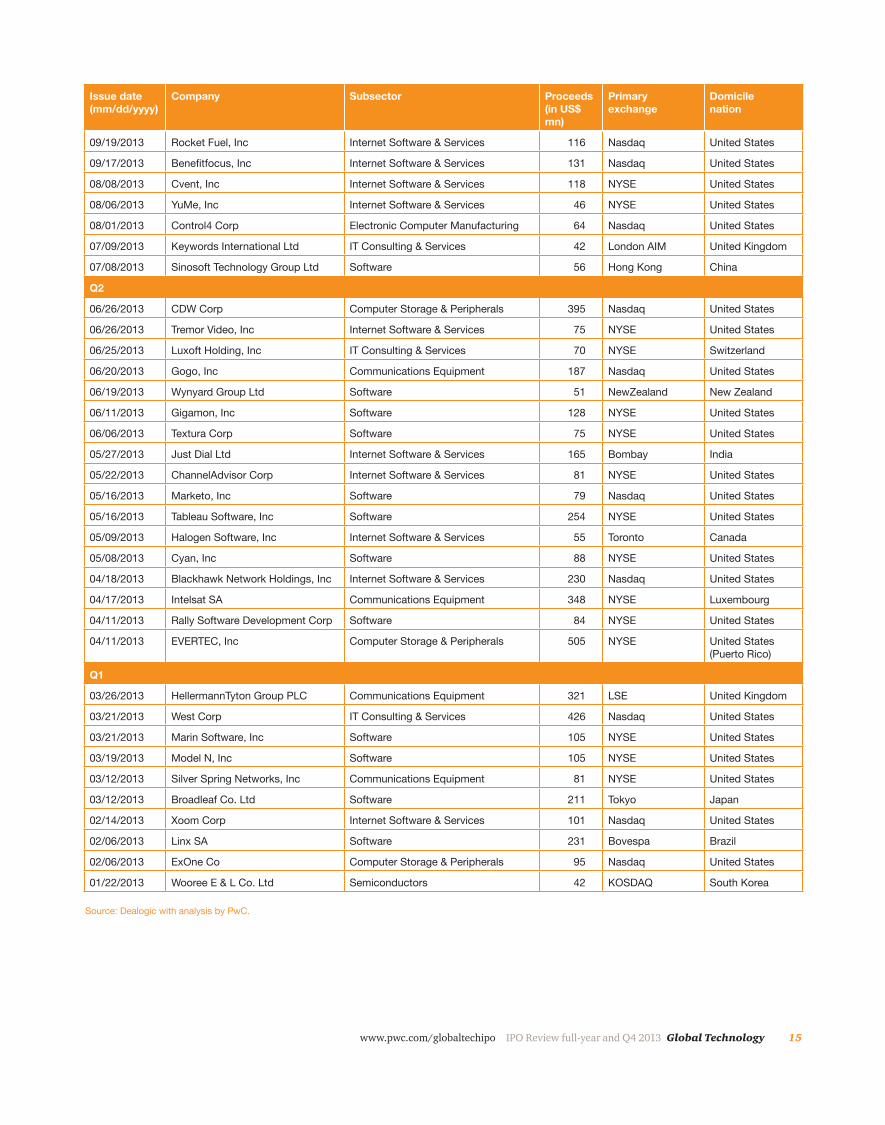
15www.pwc.com/globaltechipo IPO Review full-year and Q4 2013 Global Technology
Issue date (mm/dd/yyyy)
Company Subsector Proceeds (in US$ mn)
Primary exchange
Domicile nation
09/19/2013 Rocket Fuel, Inc Internet Software & Services 116 Nasdaq United States
09/17/2013 Benefitfocus, Inc Internet Software & Services 131 Nasdaq United States
08/08/2013 Cvent, Inc Internet Software & Services 118 NYSE United States
08/06/2013 YuMe, Inc Internet Software & Services 46 NYSE United States
08/01/2013 Control4 Corp Electronic Computer Manufacturing 64 Nasdaq United States
07/09/2013 Keywords International Ltd IT Consulting & Services 42 London AIM United Kingdom
07/08/2013 Sinosoft Technology Group Ltd Software 56 Hong Kong China
Q2
06/26/2013 CDW Corp Computer Storage & Peripherals 395 Nasdaq United States
06/26/2013 Tremor Video, Inc Internet Software & Services 75 NYSE United States
06/25/2013 Luxoft Holding, Inc IT Consulting & Services 70 NYSE Switzerland
06/20/2013 Gogo, Inc Communications Equipment 187 Nasdaq United States
06/19/2013 Wynyard Group Ltd Software 51 NewZealand New Zealand
06/11/2013 Gigamon, Inc Software 128 NYSE United States
06/06/2013 Textura Corp Software 75 NYSE United States
05/27/2013 Just Dial Ltd Internet Software & Services 165 Bombay India
05/22/2013 ChannelAdvisor Corp Internet Software & Services 81 NYSE United States
05/16/2013 Marketo, Inc Software 79 Nasdaq United States
05/16/2013 Tableau Software, Inc Software 254 NYSE United States
05/09/2013 Halogen Software, Inc Internet Software & Services 55 Toronto Canada
05/08/2013 Cyan, Inc Software 88 NYSE United States
04/18/2013 Blackhawk Network Holdings, Inc Internet Software & Services 230 Nasdaq United States
04/17/2013 Intelsat SA Communications Equipment 348 NYSE Luxembourg
04/11/2013 Rally Software Development Corp Software 84 NYSE United States
04/11/2013 EVERTEC, Inc Computer Storage & Peripherals 505 NYSE United States (Puerto Rico)
Q1
03/26/2013 HellermannTyton Group PLC Communications Equipment 321 LSE United Kingdom
03/21/2013 West Corp IT Consulting & Services 426 Nasdaq United States
03/21/2013 Marin Software, Inc Software 105 NYSE United States
03/19/2013 Model N, Inc Software 105 NYSE United States
03/12/2013 Silver Spring Networks, Inc Communications Equipment 81 NYSE United States
03/12/2013 Broadleaf Co. Ltd Software 211 Tokyo Japan
02/14/2013 Xoom Corp Internet Software & Services 101 Nasdaq United States
02/06/2013 Linx SA Software 231 Bovespa Brazil
02/06/2013 ExOne Co Computer Storage & Peripherals 95 Nasdaq United States
01/22/2013 Wooree E & L Co. Ltd Semiconductors 42 KOSDAQ South Korea
Source: Dealogic with analysis by PwC.
16 Global Technology IPO Review full-year and Q4 2013 www.pwc.com/globaltechipo
2010-2013 Technology IPO summaryStrong technology IPO activity in Q4 lifted overall performance in 2013. Although the number of technology IPOs above US$40mn declined over the 2010-2013 period, the current year results were much better than anticipated given the absence of IPOs on Chinese exchanges. Though total proceeds in 2013 declined by 51% from 2012, excluding the Facebook IPO of US$16bn, proceeds increased by 60% compared to 2012.
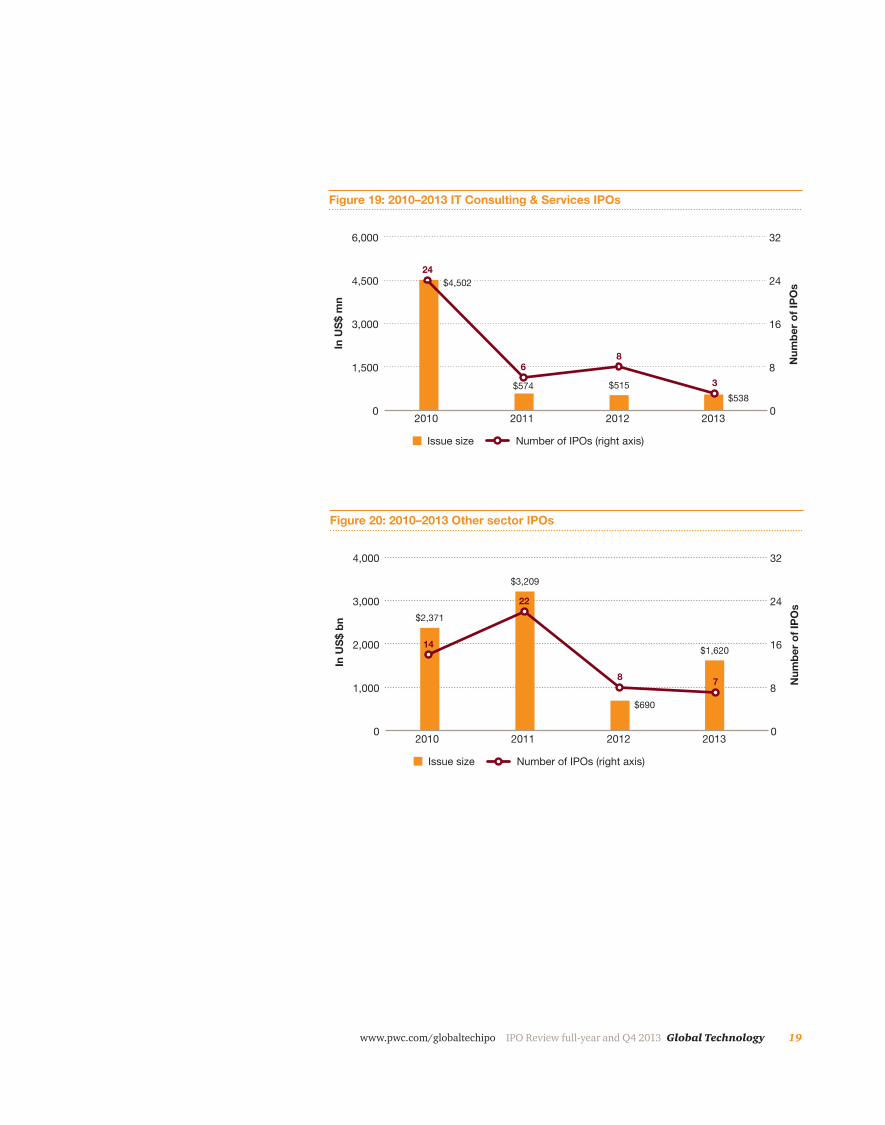
Semiconductor and IT Consulting & Services which witnessed the most deals in 2010, with 41 and 24 IPOs, respectively, almost dried up in 2013 with four and three IPOs, respectively. In contrast, Internet Software & Services, which witnessed the least number of deals in 2010, with seven, recorded the most deals in 2013, with 24 IPOs. The on-going IPO freeze on Chinese exchanges was the major factor in the decline of the Semiconductor and the IT Consulting & Services subsectors. Of the 2012 technology IPOs in China, 31% were semiconductor companies (10) and 16% were IT Consulting & Services companies (5).
2010–2013 Technology IPO trends
17www.pwc.com/globaltechipo IPO Review full-year and Q4 2013 Global Technology
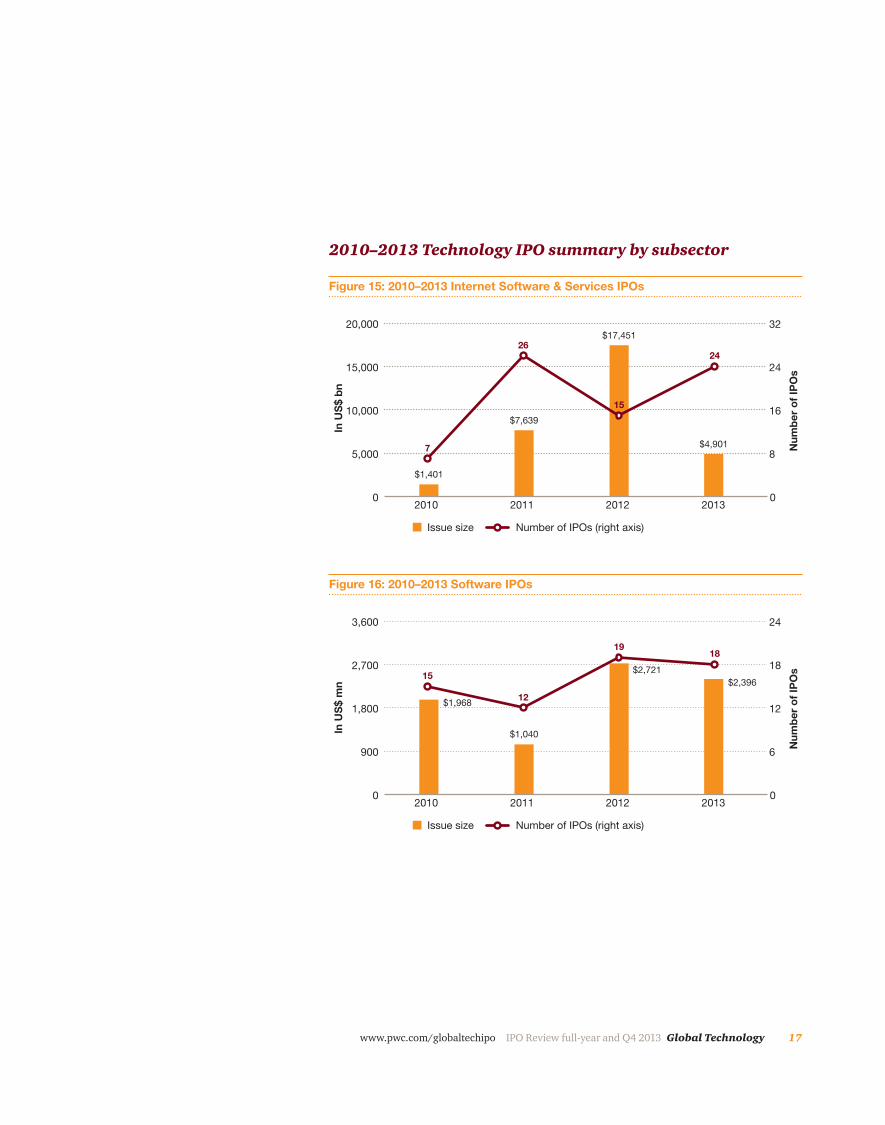
2010–2013 Technology IPO summary by subsector
0
5,000
10,000
15,000
20,000
2013201220112010
In U
S$
bn
Num
ber
of
IPO
s
0
8
16
24
32
Issue size Number of IPOs (right axis)
15
Figure 15: 2010–2013 Internet Software & Services IPOs
$7,639
$4,901
$1,401
$17,45126
24
7
0
900
1,800
2,700
3,600
2013201220112010
In U
S$
mn
Num
ber
of
IPO
s0
6
12
18
24
Issue size Number of IPOs (right axis)
19
15
18
Figure 16: 2010–2013 Software IPOs
$2,396
$1,040
$1,968
$2,721
12
18 Global Technology IPO Review full-year and Q4 2013 www.pwc.com/globaltechipo
0
1,800
3,600
5,400
7,200
2013201220112010
In U
S$ m
n
Num
ber o
f IPO
s
0
12
24
36
48
Issue size Number of IPOs (right axis)
1516
41
4
Figure 18: 2010–2013 Semiconductor IPOs
$2,646
$308
$6,109
$1,446
0
600
1,200
1,800
2,400
2013201220112010
In U
S$
bn
Num
ber
of
IPO
s
0
3
6
9
12
Issue size Number of IPOs (right axis)
4
Figure 17: 2010–2013 Computer Storage & Peripherals IPOs
$1,685
$748
$329
$1,601
5
88
19www.pwc.com/globaltechipo IPO Review full-year and Q4 2013 Global Technology
0
1,000
2,000
3,000
4,000
2013201220112010
In U
S$
bn
Num
ber
of
IPO
s
0
8
16
24
32
Issue size Number of IPOs (right axis)
8
Figure 20: 2010–2013 Other sector IPOs
$3,209
$1,620
$2,371
$690
22
7
14
0
1,500
3,000
4,500
6,000
2013201220112010
In U
S$ m
n
Num
ber o
f IPO
s
0
8
16
24
32
Issue size Number of IPOs (right axis)
8
24
3
Figure 19: 2010–2013 IT Consulting & Services IPOs
$538$515$574
$4,502
6
20 Global Technology IPO Review full-year and Q4 2013 www.pwc.com/globaltechipo
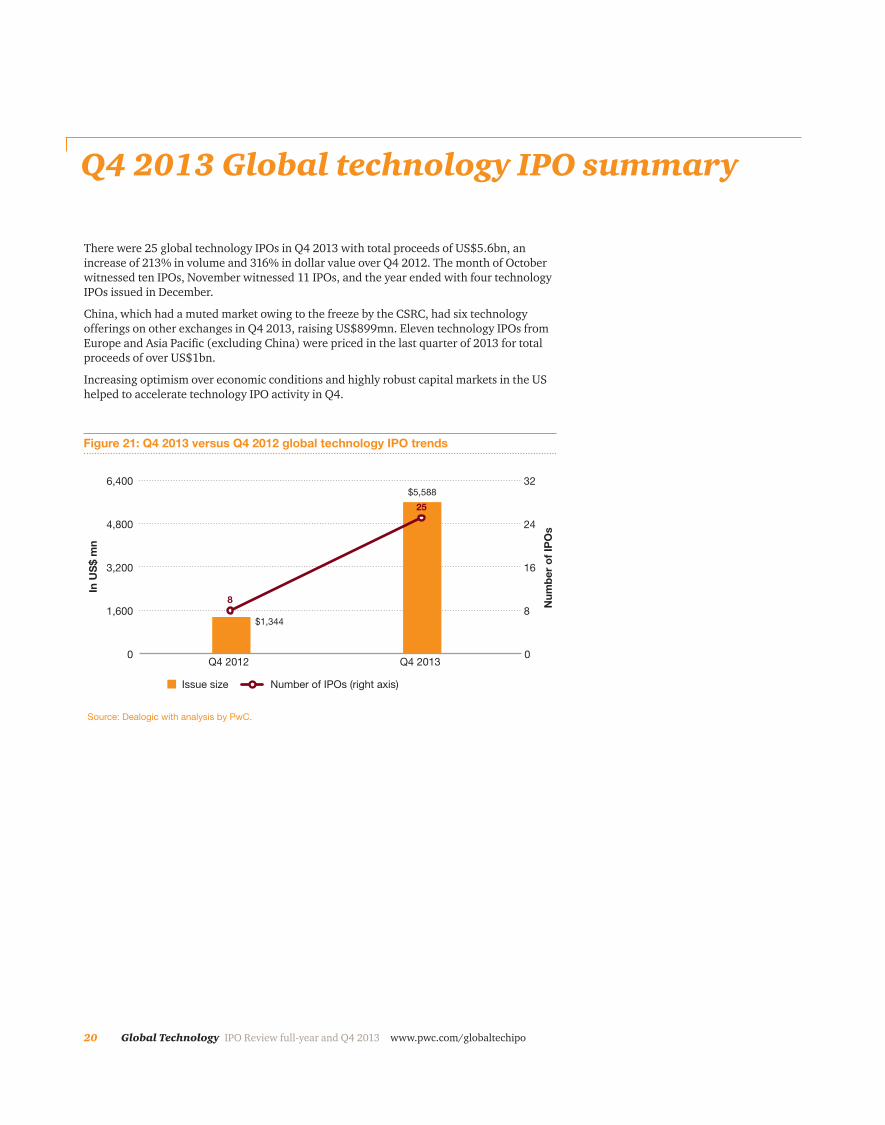
There were 25 global technology IPOs in Q4 2013 with total proceeds of US$5.6bn, an increase of 213% in volume and 316% in dollar value over Q4 2012. The month of October witnessed ten IPOs, November witnessed 11 IPOs, and the year ended with four technology IPOs issued in December.
China, which had a muted market owing to the freeze by the CSRC, had six technology offerings on other exchanges in Q4 2013, raising US$899mn. Eleven technology IPOs from Europe and Asia Pacific (excluding China) were priced in the last quarter of 2013 for total proceeds of over US$1bn.
Increasing optimism over economic conditions and highly robust capital markets in the US helped to accelerate technology IPO activity in Q4.
0
1,600
3,200
4,800
6,400
Q4 2013Q4 2012
In U
S$
mn
Num
ber
of
IPO
s
0
8
16
24
32
Issue size Number of IPOs (right axis)
8
25
Figure 21: Q4 2013 versus Q4 2012 global technology IPO trends
$1,344
$5,588
Source: Dealogic with analysis by PwC.
Q4 2013 Global technology IPO summary
21www.pwc.com/globaltechipo IPO Review full-year and Q4 2013 Global Technology
“The UK continues to thrive in an environment where new technologies are being developed and companies are being established with good track records. This environment is underpinned by positive steps by the government to support the sector and an ever-increasing pool of entrepreneurs. The quality of companies continues to generate investor interest. I fully expect sustained momentum in the number of companies emerging and wanting to do an IPO.” – Jass Sarai, Technology Industry Leader, PwC UK
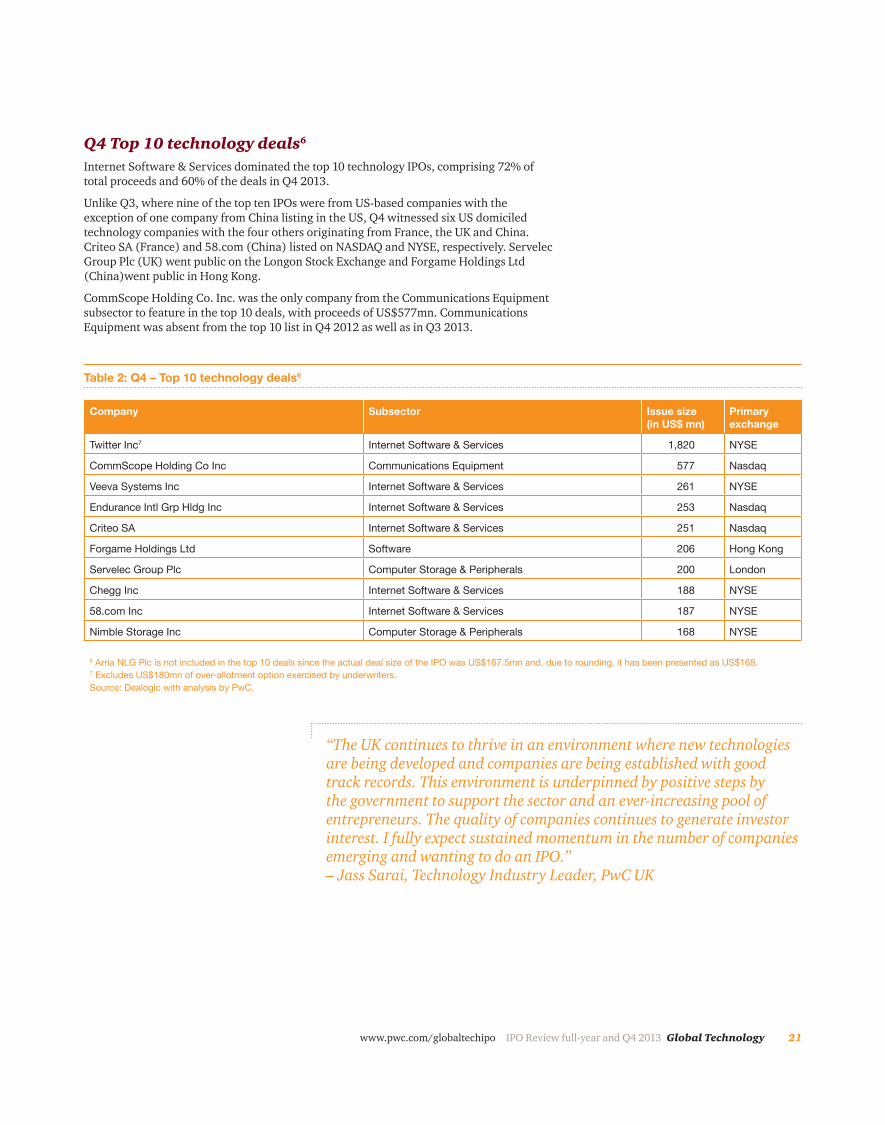
Company Subsector Issue size (in US$ mn)
Primary exchange
Twitter Inc7 Internet Software & Services 1,820 NYSE
CommScope Holding Co Inc Communications Equipment 577 Nasdaq
Veeva Systems Inc Internet Software & Services 261 NYSE
Endurance Intl Grp Hldg Inc Internet Software & Services 253 Nasdaq
Criteo SA Internet Software & Services 251 Nasdaq
Forgame Holdings Ltd Software 206 Hong Kong
Servelec Group Plc Computer Storage & Peripherals 200 London
Chegg Inc Internet Software & Services 188 NYSE
58.com Inc Internet Software & Services 187 NYSE
Nimble Storage Inc Computer Storage & Peripherals 168 NYSE
6 Arria NLG Plc is not included in the top 10 deals since the actual deal size of the IPO was US$167.5mn and, due to rounding, it has been presented as US$168.7 Excludes US$180mn of over-allotment option exercised by underwriters.Source: Dealogic with analysis by PwC.
Table 2: Q4 – Top 10 technology deals6
Q4 Top 10 technology deals6
Internet Software & Services dominated the top 10 technology IPOs, comprising 72% of total proceeds and 60% of the deals in Q4 2013.
Unlike Q3, where nine of the top ten IPOs were from US-based companies with the exception of one company from China listing in the US, Q4 witnessed six US domiciled technology companies with the four others originating from France, the UK and China. Criteo SA (France) and 58.com (China) listed on NASDAQ and NYSE, respectively. Servelec Group Plc (UK) went public on the Longon Stock Exchange and Forgame Holdings Ltd (China)went public in Hong Kong.
CommScope Holding Co. Inc. was the only company from the Communications Equipment subsector to feature in the top 10 deals, with proceeds of US$577mn. Communications Equipment was absent from the top 10 list in Q4 2012 as well as in Q3 2013.
22 Global Technology IPO Review full-year and Q4 2013 www.pwc.com/globaltechipo
0
1,000
2,000
3,000
4,000
OthersUnitedKingdom
SingaporeJapanChinaUnitedStates
In U
S$
mn
Num
ber
of
IPO
s
0
3
6
9
12
Issue size Number of IPOs (right axis)
22
6
8
5
2
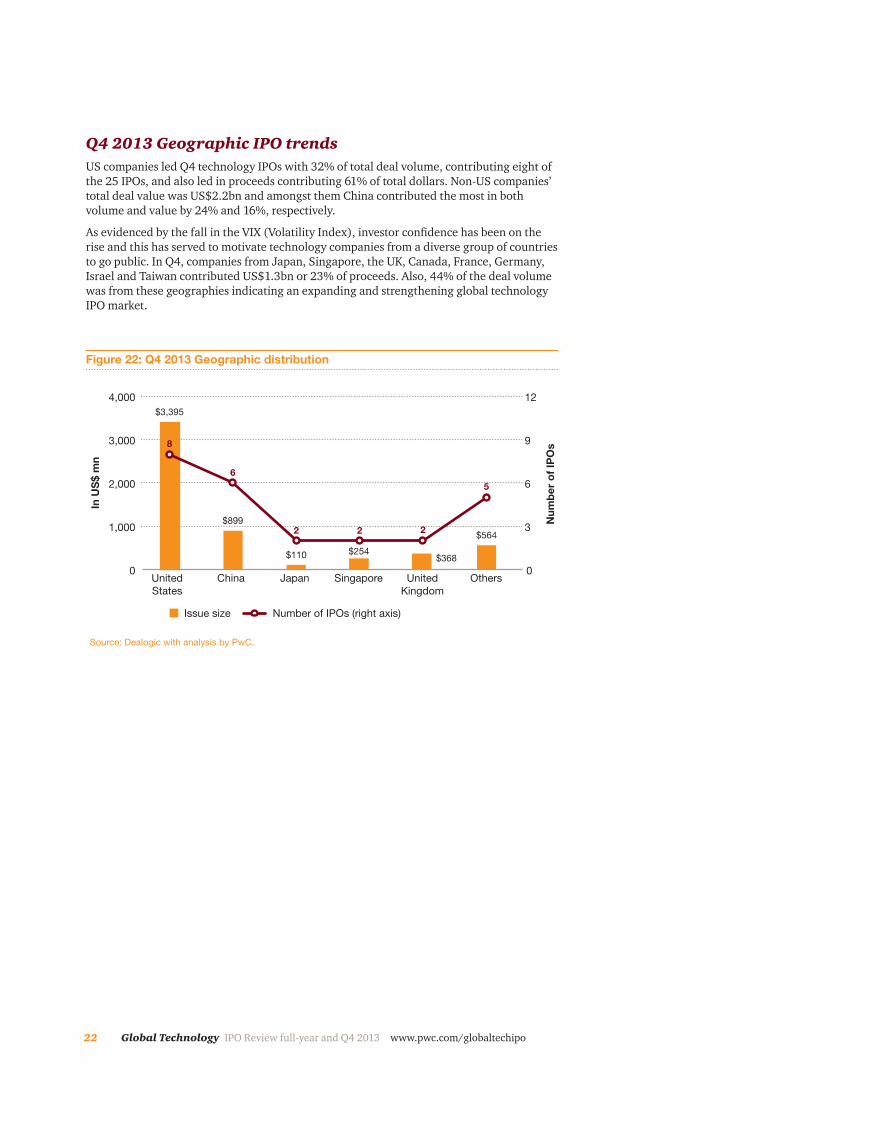
Figure 22: Q4 2013 Geographic distribution
$899
$368$110 $254
$564
$3,395
Source: Dealogic with analysis by PwC.
Q4 2013 Geographic IPO trendsUS companies led Q4 technology IPOs with 32% of total deal volume, contributing eight of the 25 IPOs, and also led in proceeds contributing 61% of total dollars. Non-US companies’ total deal value was US$2.2bn and amongst them China contributed the most in both volume and value by 24% and 16%, respectively.
As evidenced by the fall in the VIX (Volatility Index), investor confidence has been on the rise and this has served to motivate technology companies from a diverse group of countries to go public. In Q4, companies from Japan, Singapore, the UK, Canada, France, Germany, Israel and Taiwan contributed US$1.3bn or 23% of proceeds. Also, 44% of the deal volume was from these geographies indicating an expanding and strengthening global technology IPO market.
23www.pwc.com/globaltechipo IPO Review full-year and Q4 2013 Global Technology
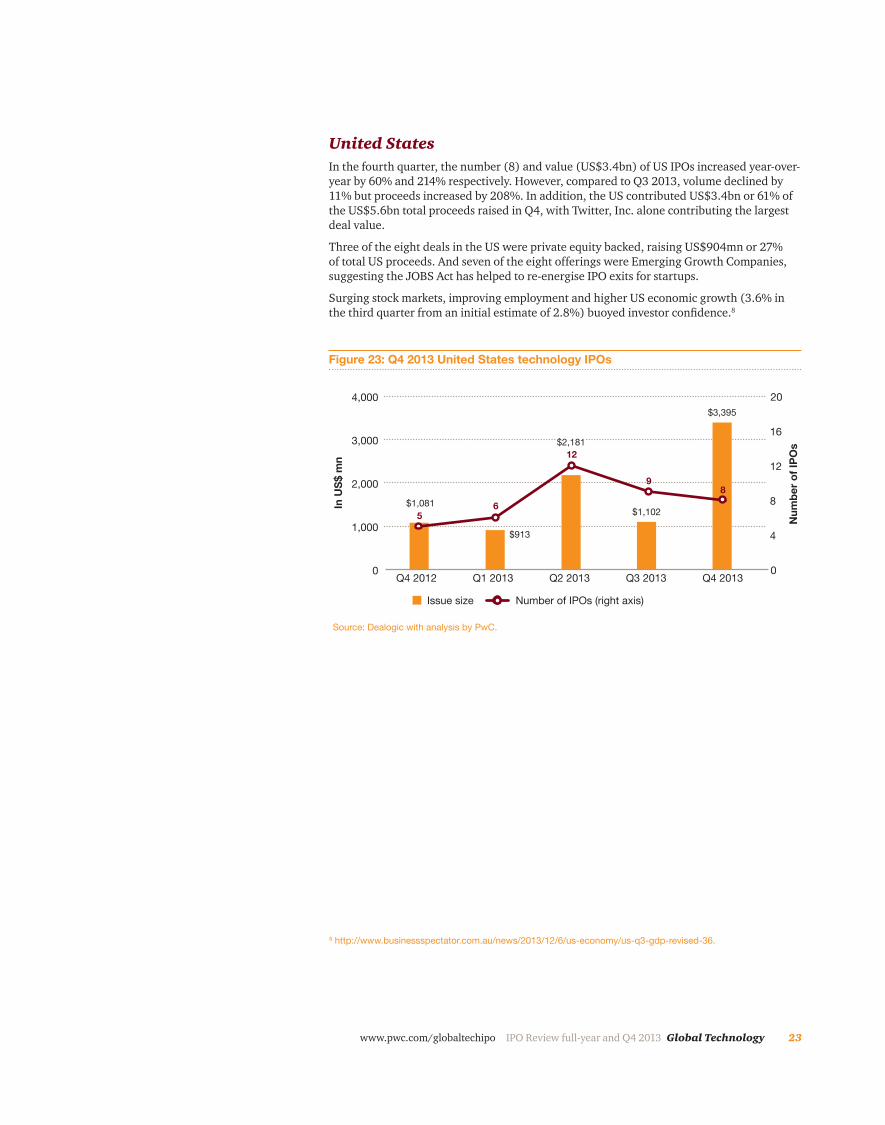
United StatesIn the fourth quarter, the number (8) and value (US$3.4bn) of US IPOs increased year-over-year by 60% and 214% respectively. However, compared to Q3 2013, volume declined by 11% but proceeds increased by 208%. In addition, the US contributed US$3.4bn or 61% of the US$5.6bn total proceeds raised in Q4, with Twitter, Inc. alone contributing the largest deal value.
Three of the eight deals in the US were private equity backed, raising US$904mn or 27% of total US proceeds. And seven of the eight offerings were Emerging Growth Companies, suggesting the JOBS Act has helped to re-energise IPO exits for startups.
Surging stock markets, improving employment and higher US economic growth (3.6% in the third quarter from an initial estimate of 2.8%) buoyed investor confidence.8
8 http://www.businessspectator.com.au/news/2013/12/6/us-economy/us-q3-gdp-revised-36.
0
1,000
2,000
3,000
4,000
Q4 2013Q3 2013Q2 2013Q1 2013Q4 2012
In U
S$ m
n
Num
ber o
f IPO
s
0
4
8
12
16
20
Issue size Number of IPOs (right axis)
56
12
98
$913
$1,081
Figure 23: Q4 2013 United States technology IPOs
$2,181
$1,102
$3,395
Source: Dealogic with analysis by PwC.
24 Global Technology IPO Review full-year and Q4 2013 www.pwc.com/globaltechipo
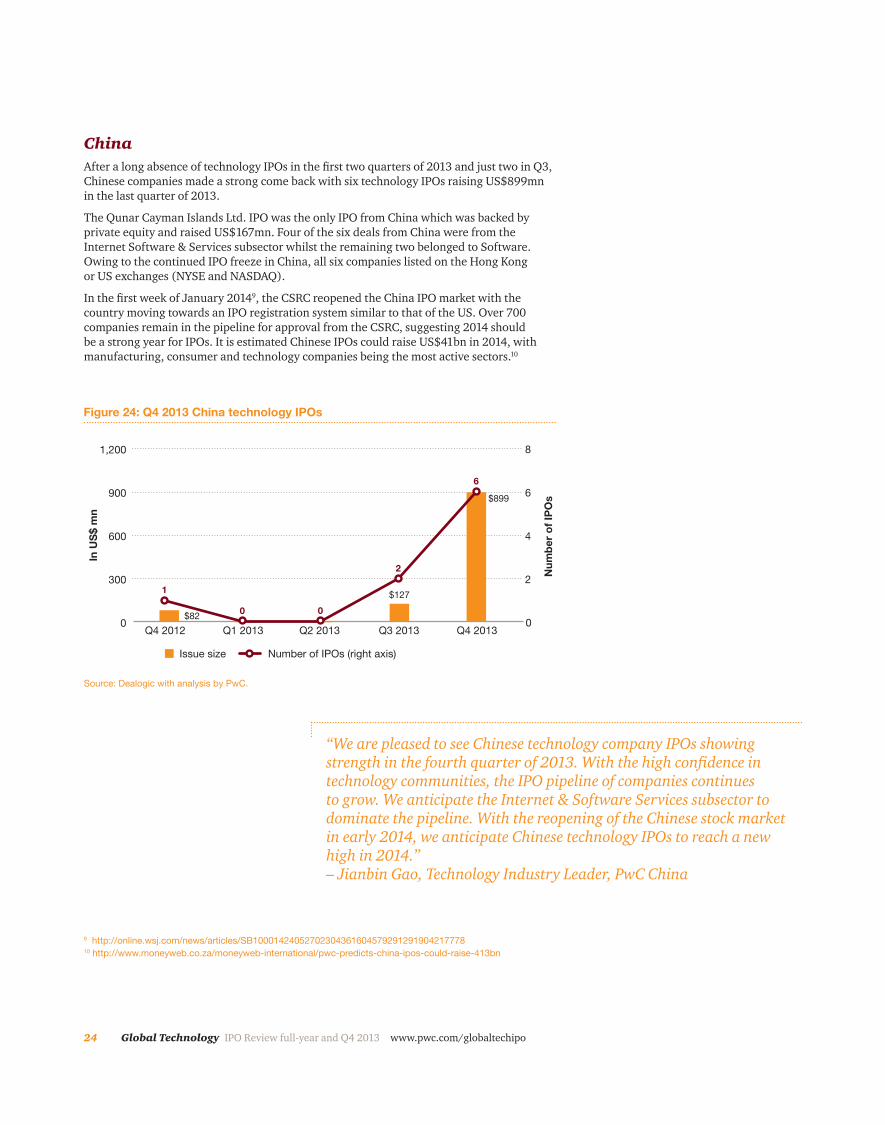
“We are pleased to see Chinese technology company IPOs showing strength in the fourth quarter of 2013. With the high confidence in technology communities, the IPO pipeline of companies continues to grow. We anticipate the Internet & Software Services subsector to dominate the pipeline. With the reopening of the Chinese stock market in early 2014, we anticipate Chinese technology IPOs to reach a new high in 2014.” – Jianbin Gao, Technology Industry Leader, PwC China
ChinaAfter a long absence of technology IPOs in the first two quarters of 2013 and just two in Q3, Chinese companies made a strong come back with six technology IPOs raising US$899mn in the last quarter of 2013.
The Qunar Cayman Islands Ltd. IPO was the only IPO from China which was backed by private equity and raised US$167mn. Four of the six deals from China were from the Internet Software & Services subsector whilst the remaining two belonged to Software. Owing to the continued IPO freeze in China, all six companies listed on the Hong Kong or US exchanges (NYSE and NASDAQ).
In the first week of January 20149, the CSRC reopened the China IPO market with the country moving towards an IPO registration system similar to that of the US. Over 700 companies remain in the pipeline for approval from the CSRC, suggesting 2014 should be a strong year for IPOs. It is estimated Chinese IPOs could raise US$41bn in 2014, with manufacturing, consumer and technology companies being the most active sectors.10
9 http://online.wsj.com/news/articles/SB1000142405270230436160457929129190421777810 http://www.moneyweb.co.za/moneyweb-international/pwc-predicts-china-ipos-could-raise-413bn
0
300
600
900
1,200
Q4 2013Q3 2013Q2 2013 Q1 2013Q4 2012
In U
S$
mn
Num
ber
of
IPO
s
Issue size Number of IPOs (right axis)
1
$82
$127
$899
0
2
4
6
8
0 0
2
6
Figure 24: Q4 2013 China technology IPOs
Source: Dealogic with analysis by PwC.
25www.pwc.com/globaltechipo IPO Review full-year and Q4 2013 Global Technology
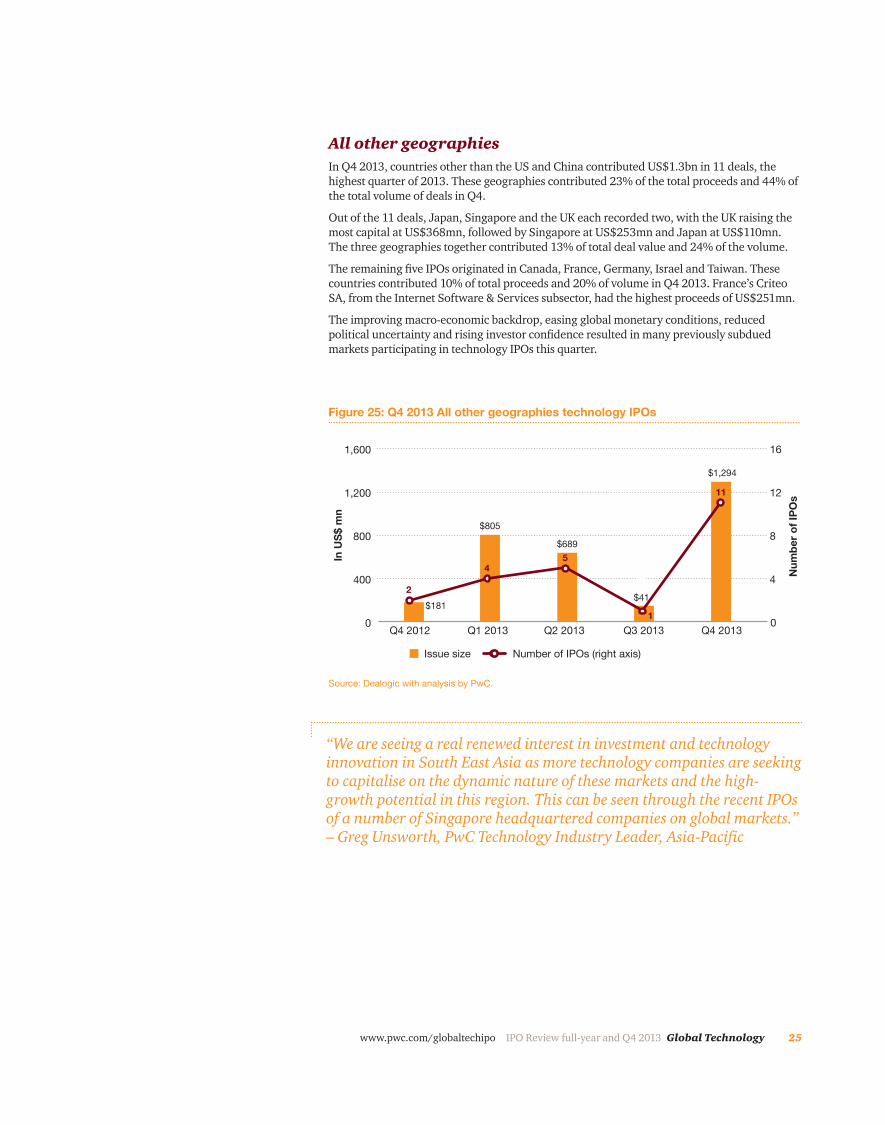
“We are seeing a real renewed interest in investment and technology innovation in South East Asia as more technology companies are seeking to capitalise on the dynamic nature of these markets and the high-growth potential in this region. This can be seen through the recent IPOs of a number of Singapore headquartered companies on global markets.” – Greg Unsworth, PwC Technology Industry Leader, Asia-Pacific
All other geographiesIn Q4 2013, countries other than the US and China contributed US$1.3bn in 11 deals, the highest quarter of 2013. These geographies contributed 23% of the total proceeds and 44% of the total volume of deals in Q4.
Out of the 11 deals, Japan, Singapore and the UK each recorded two, with the UK raising the most capital at US$368mn, followed by Singapore at US$253mn and Japan at US$110mn. The three geographies together contributed 13% of total deal value and 24% of the volume.
The remaining five IPOs originated in Canada, France, Germany, Israel and Taiwan. These countries contributed 10% of total proceeds and 20% of volume in Q4 2013. France’s Criteo SA, from the Internet Software & Services subsector, had the highest proceeds of US$251mn.
The improving macro-economic backdrop, easing global monetary conditions, reduced political uncertainty and rising investor confidence resulted in many previously subdued markets participating in technology IPOs this quarter.
0
400
800
1,200
1,600
Q4 2013Q3 2013Q2 2013 Q1 2013Q4 2012
In U
S$ m
n
Num
ber o
f IPO
s
Issue size Number of IPOs (right axis)
2
$689
$805
$181$41
$1,294
0
4
8
12
16
45
11
1
Figure 25: Q4 2013 All other geographies technology IPOs
Source: Dealogic with analysis by PwC.
26 Global Technology IPO Review full-year and Q4 2013 www.pwc.com/globaltechipo
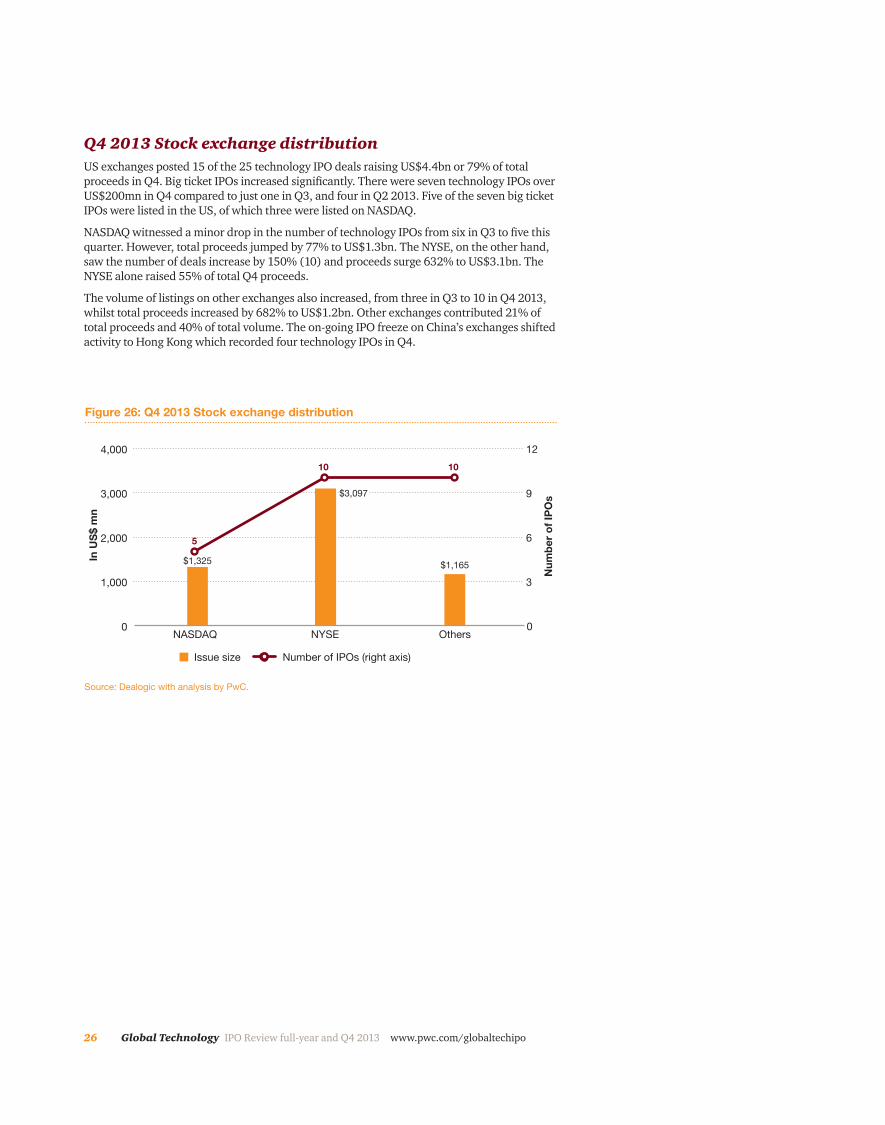
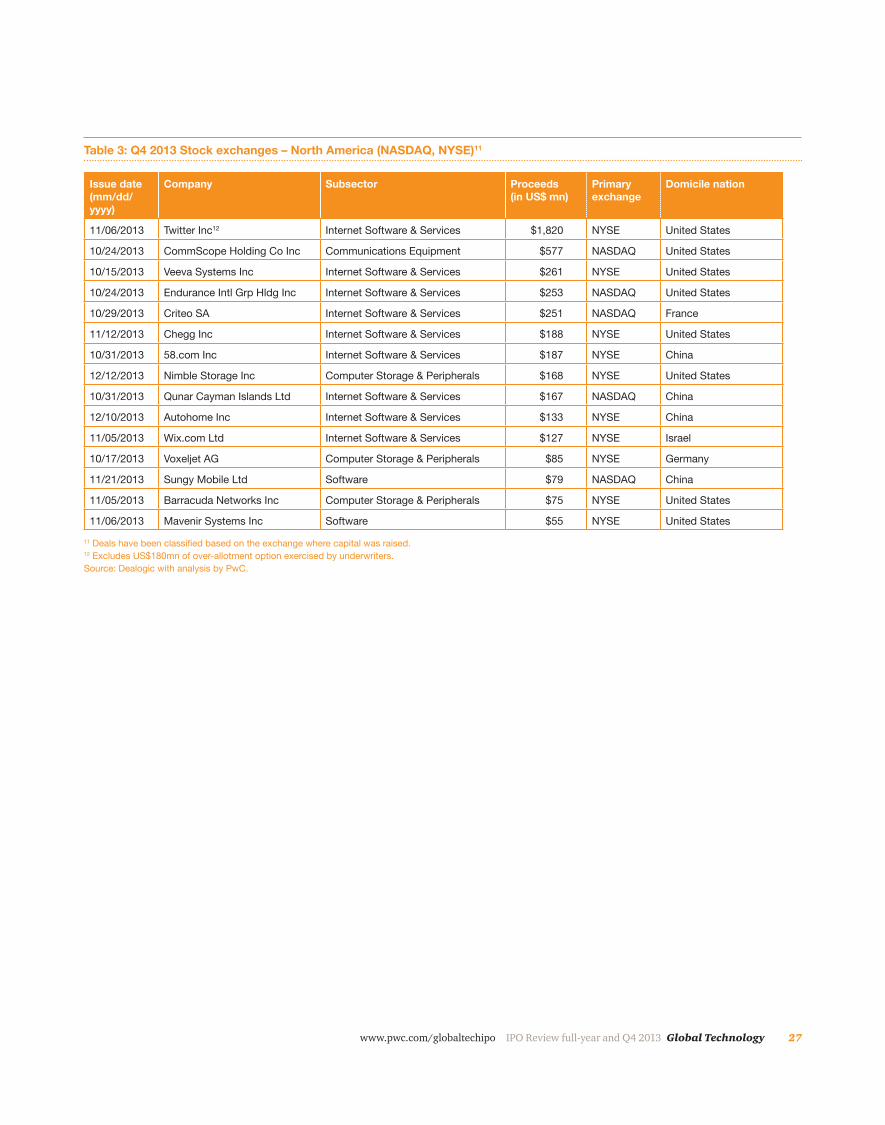
Q4 2013 Stock exchange distributionUS exchanges posted 15 of the 25 technology IPO deals raising US$4.4bn or 79% of total proceeds in Q4. Big ticket IPOs increased significantly. There were seven technology IPOs over US$200mn in Q4 compared to just one in Q3, and four in Q2 2013. Five of the seven big ticket IPOs were listed in the US, of which three were listed on NASDAQ.
NASDAQ witnessed a minor drop in the number of technology IPOs from six in Q3 to five this quarter. However, total proceeds jumped by 77% to US$1.3bn. The NYSE, on the other hand, saw the number of deals increase by 150% (10) and proceeds surge 632% to US$3.1bn. The NYSE alone raised 55% of total Q4 proceeds.
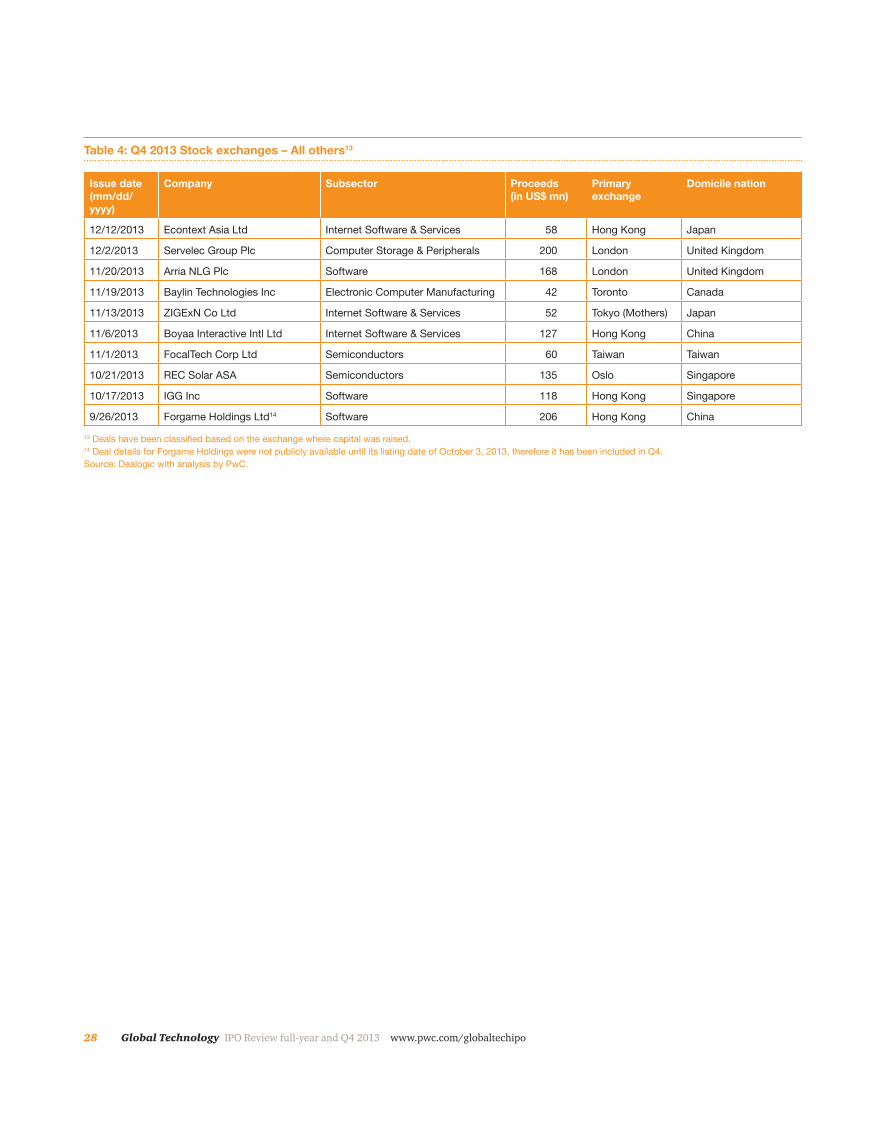
The volume of listings on other exchanges also increased, from three in Q3 to 10 in Q4 2013, whilst total proceeds increased by 682% to US$1.2bn. Other exchanges contributed 21% of total proceeds and 40% of total volume. The on-going IPO freeze on China’s exchanges shifted activity to Hong Kong which recorded four technology IPOs in Q4.
0
1,000
2,000
3,000
4,000
OthersNYSENASDAQ0
3
6
9
12
In U
S$
mn
Num
ber
of
IPO
s
Issue size Number of IPOs (right axis)
5
10 10
$1,165$1,325
Figure 26: Q4 2013 Stock exchange distribution
Source: Dealogic with analysis by PwC.
$3,097
27www.pwc.com/globaltechipo IPO Review full-year and Q4 2013 Global Technology
Issue date (mm/dd/yyyy)
Company Subsector Proceeds (in US$ mn)
Primary exchange
Domicile nation
11/06/2013 Twitter Inc12 Internet Software & Services $1,820 NYSE United States
10/24/2013 CommScope Holding Co Inc Communications Equipment $577 NASDAQ United States
10/15/2013 Veeva Systems Inc Internet Software & Services $261 NYSE United States
10/24/2013 Endurance Intl Grp Hldg Inc Internet Software & Services $253 NASDAQ United States
10/29/2013 Criteo SA Internet Software & Services $251 NASDAQ France
11/12/2013 Chegg Inc Internet Software & Services $188 NYSE United States
10/31/2013 58.com Inc Internet Software & Services $187 NYSE China
12/12/2013 Nimble Storage Inc Computer Storage & Peripherals $168 NYSE United States
10/31/2013 Qunar Cayman Islands Ltd Internet Software & Services $167 NASDAQ China
12/10/2013 Autohome Inc Internet Software & Services $133 NYSE China
11/05/2013 Wix.com Ltd Internet Software & Services $127 NYSE Israel
10/17/2013 Voxeljet AG Computer Storage & Peripherals $85 NYSE Germany
11/21/2013 Sungy Mobile Ltd Software $79 NASDAQ China
11/05/2013 Barracuda Networks Inc Computer Storage & Peripherals $75 NYSE United States
11/06/2013 Mavenir Systems Inc Software $55 NYSE United States 11 Deals have been classified based on the exchange where capital was raised.12 Excludes US$180mn of over-allotment option exercised by underwriters.Source: Dealogic with analysis by PwC.
Table 3: Q4 2013 Stock exchanges – North America (NASDAQ, NYSE)11
28 Global Technology IPO Review full-year and Q4 2013 www.pwc.com/globaltechipo
Issue date (mm/dd/yyyy)
Company Subsector Proceeds (in US$ mn)
Primary exchange
Domicile nation
12/12/2013 Econtext Asia Ltd Internet Software & Services 58 Hong Kong Japan
12/2/2013 Servelec Group Plc Computer Storage & Peripherals 200 London United Kingdom
11/20/2013 Arria NLG Plc Software 168 London United Kingdom
11/19/2013 Baylin Technologies Inc Electronic Computer Manufacturing 42 Toronto Canada
11/13/2013 ZIGExN Co Ltd Internet Software & Services 52 Tokyo (Mothers) Japan
11/6/2013 Boyaa Interactive Intl Ltd Internet Software & Services 127 Hong Kong China
11/1/2013 FocalTech Corp Ltd Semiconductors 60 Taiwan Taiwan
10/21/2013 REC Solar ASA Semiconductors 135 Oslo Singapore
10/17/2013 IGG Inc Software 118 Hong Kong Singapore
9/26/2013 Forgame Holdings Ltd14 Software 206 Hong Kong China 13 Deals have been classified based on the exchange where capital was raised.14 Deal details for Forgame Holdings were not publicly available until its listing date of October 3, 2013, therefore it has been included in Q4.Source: Dealogic with analysis by PwC.
Table 4: Q4 2013 Stock exchanges – All others13
29www.pwc.com/globaltechipo IPO Review full-year and Q4 2013 Global Technology
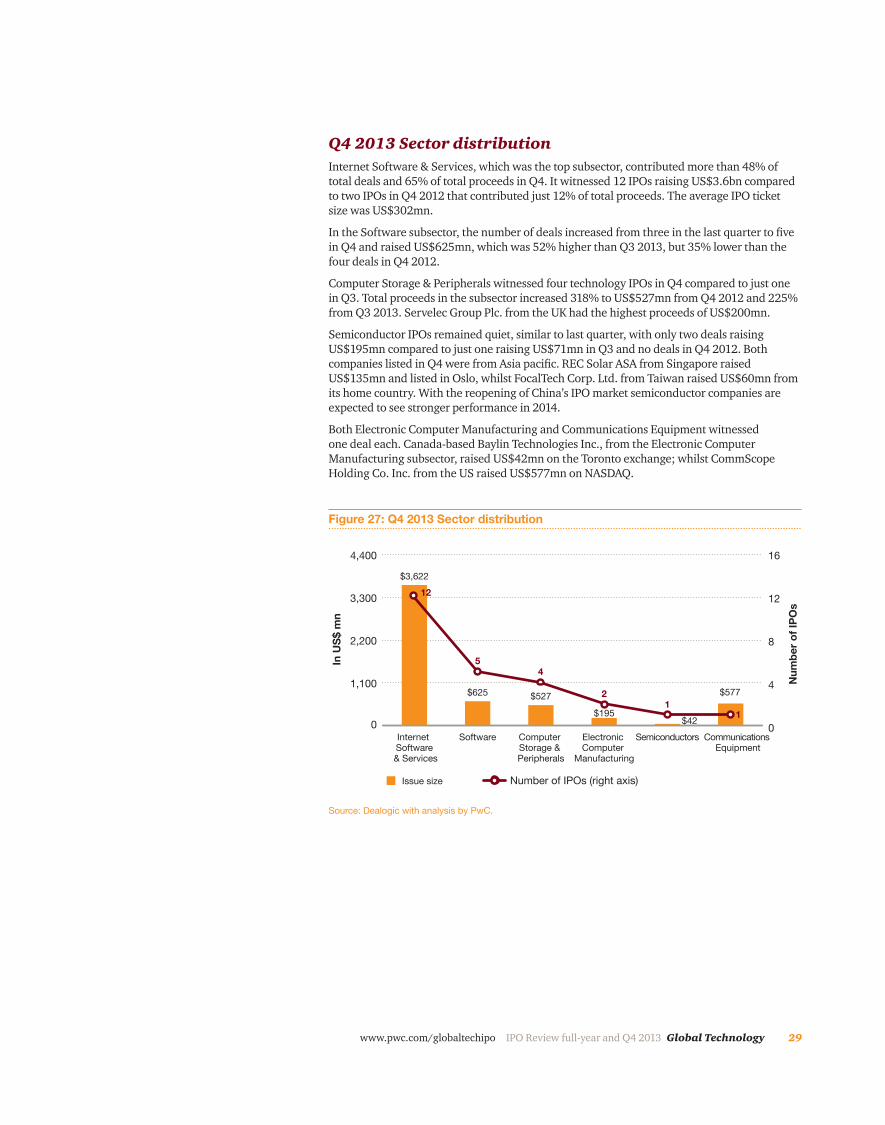
Q4 2013 Sector distributionInternet Software & Services, which was the top subsector, contributed more than 48% of total deals and 65% of total proceeds in Q4. It witnessed 12 IPOs raising US$3.6bn compared to two IPOs in Q4 2012 that contributed just 12% of total proceeds. The average IPO ticket size was US$302mn.
In the Software subsector, the number of deals increased from three in the last quarter to five in Q4 and raised US$625mn, which was 52% higher than Q3 2013, but 35% lower than the four deals in Q4 2012.
Computer Storage & Peripherals witnessed four technology IPOs in Q4 compared to just one in Q3. Total proceeds in the subsector increased 318% to US$527mn from Q4 2012 and 225% from Q3 2013. Servelec Group Plc. from the UK had the highest proceeds of US$200mn.
Semiconductor IPOs remained quiet, similar to last quarter, with only two deals raising US$195mn compared to just one raising US$71mn in Q3 and no deals in Q4 2012. Both companies listed in Q4 were from Asia pacific. REC Solar ASA from Singapore raised US$135mn and listed in Oslo, whilst FocalTech Corp. Ltd. from Taiwan raised US$60mn from its home country. With the reopening of China’s IPO market semiconductor companies are expected to see stronger performance in 2014.
Both Electronic Computer Manufacturing and Communications Equipment witnessed one deal each. Canada-based Baylin Technologies Inc., from the Electronic Computer Manufacturing subsector, raised US$42mn on the Toronto exchange; whilst CommScope Holding Co. Inc. from the US raised US$577mn on NASDAQ.
Issue size
166x
$195$42
$577
$3,622
Num
ber o
f IPO
s
In U
S$ m
n
1
Number of IPOs (right axis)
Source: Dealogic with analysis by PwC.
Figure 27: Q4 2013 Sector distribution
0
1,100
2,200
3,300
4,400
Communications Equipment
SemiconductorsElectronic Computer
Manufacturing
Computer Storage & Peripherals
SoftwareInternet Software
& Services
$625 $527
0
4
8
12
16
4
2
5
12
1
30 Global Technology IPO Review full-year and Q4 2013 www.pwc.com/globaltechipo
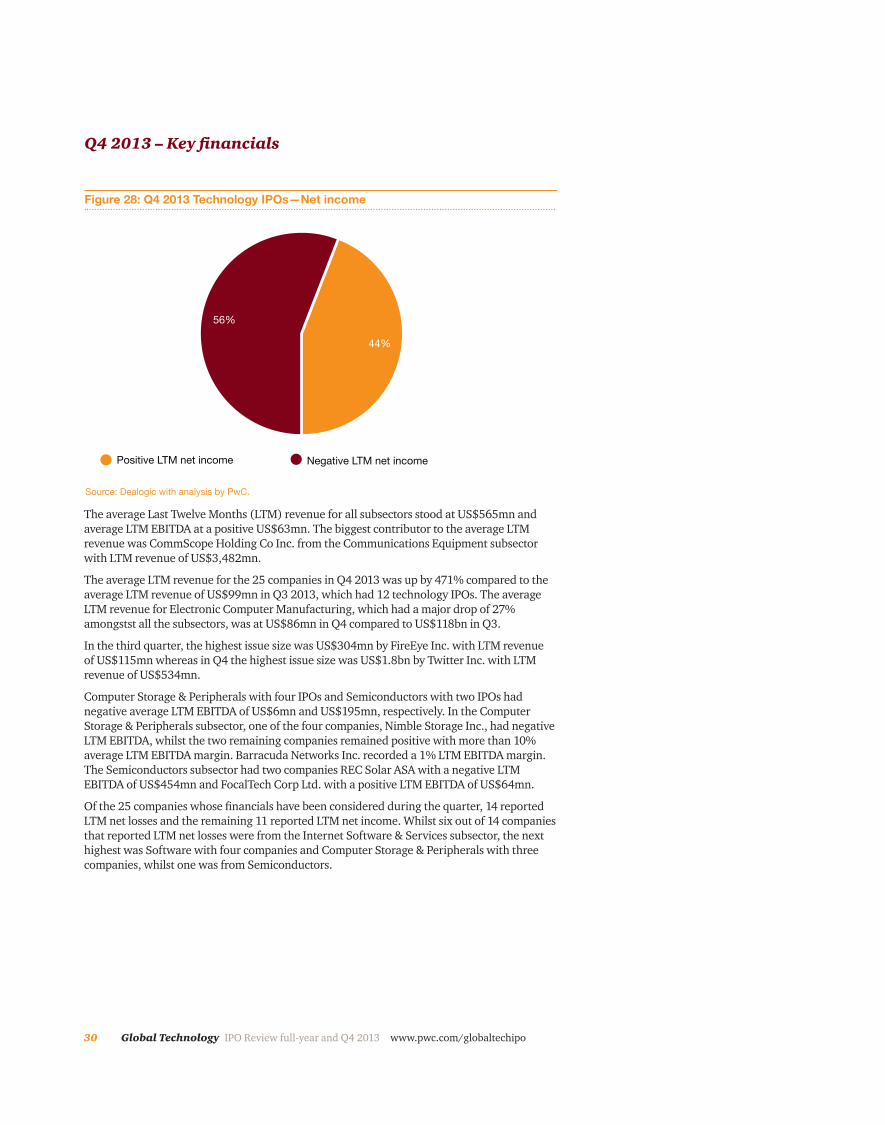
Q4 2013 – Key financials
Positive LTM net income Negative LTM net income
56%
44%
Figure 28: Q4 2013 Technology IPOs—Net income
Source: Dealogic with analysis by PwC.
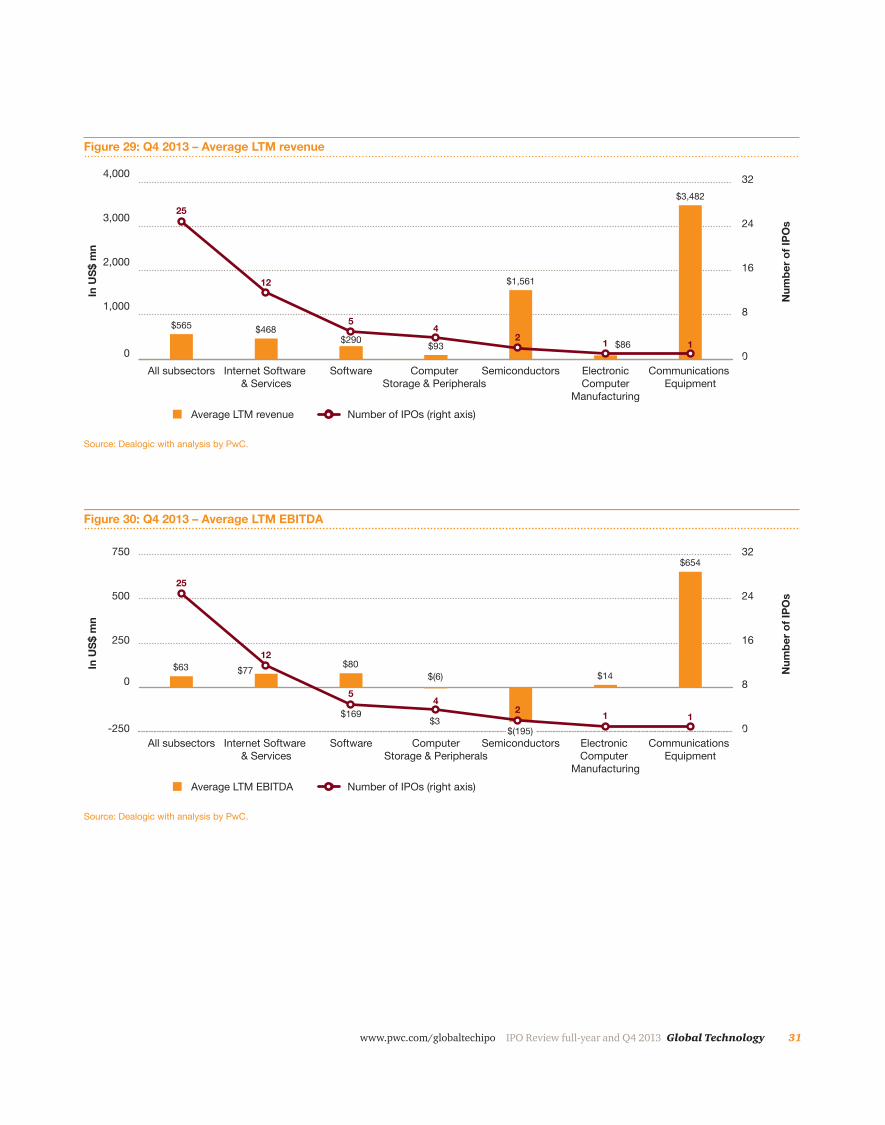
The average Last Twelve Months (LTM) revenue for all subsectors stood at US$565mn and average LTM EBITDA at a positive US$63mn. The biggest contributor to the average LTM revenue was CommScope Holding Co Inc. from the Communications Equipment subsector with LTM revenue of US$3,482mn.
The average LTM revenue for the 25 companies in Q4 2013 was up by 471% compared to the average LTM revenue of US$99mn in Q3 2013, which had 12 technology IPOs. The average LTM revenue for Electronic Computer Manufacturing, which had a major drop of 27% amongstst all the subsectors, was at US$86mn in Q4 compared to US$118bn in Q3.
In the third quarter, the highest issue size was US$304mn by FireEye Inc. with LTM revenue of US$115mn whereas in Q4 the highest issue size was US$1.8bn by Twitter Inc. with LTM revenue of US$534mn.
Computer Storage & Peripherals with four IPOs and Semiconductors with two IPOs had negative average LTM EBITDA of US$6mn and US$195mn, respectively. In the Computer Storage & Peripherals subsector, one of the four companies, Nimble Storage Inc., had negative LTM EBITDA, whilst the two remaining companies remained positive with more than 10% average LTM EBITDA margin. Barracuda Networks Inc. recorded a 1% LTM EBITDA margin. The Semiconductors subsector had two companies REC Solar ASA with a negative LTM EBITDA of US$454mn and FocalTech Corp Ltd. with a positive LTM EBITDA of US$64mn.
Of the 25 companies whose financials have been considered during the quarter, 14 reported LTM net losses and the remaining 11 reported LTM net income. Whilst six out of 14 companies that reported LTM net losses were from the Internet Software & Services subsector, the next highest was Software with four companies and Computer Storage & Peripherals with three companies, whilst one was from Semiconductors.
31www.pwc.com/globaltechipo IPO Review full-year and Q4 2013 Global Technology
In U
S$ m
n
0
1,000
2,000
3,000
4,000
Communications Equipment
Electronic Computer
Manufacturing
SemiconductorsComputer Storage & Peripherals
SoftwareInternet Software & Services
All subsectors0
8
16
24
32
25
12
54
2 1 1
Average LTM revenue Number of IPOs (right axis)
Num
ber o
f IPO
s
$565
Figure 29: Q4 2013 – Average LTM revenue
Source: Dealogic with analysis by PwC.
$468$290 $93
$3,482
$1,561
$86
In U
S$ m
n
-250
0
250
500
750
Communications Equipment
Electronic Computer
Manufacturing
SemiconductorsComputer Storage & Peripherals
SoftwareInternet Software & Services
All subsectors0
8
16
24
32
25
12
54
2 1 1
Average LTM EBITDA Number of IPOs (right axis)N
umbe
r of I
POs
$63
Figure 30: Q4 2013 – Average LTM EBITDA
Source: Dealogic with analysis by PwC.
$77 $80$(6)
$169$3
$14
$654
$(195)
32 Global Technology IPO Review full-year and Q4 2013 www.pwc.com/globaltechipo
In U
S$ m
n
(600)
(400)
(200)
0
200
Communications Equipment
Electronic Computer
Manufacturing
SemiconductorsComputer Storage & Peripherals
SoftwareInternet Software & Services
All subsectors0
8
16
24
32
25
12
54
2 1 1
Average LTM net income Number of IPOs (right axis)
Num
ber o
f IPO
s
$(34)
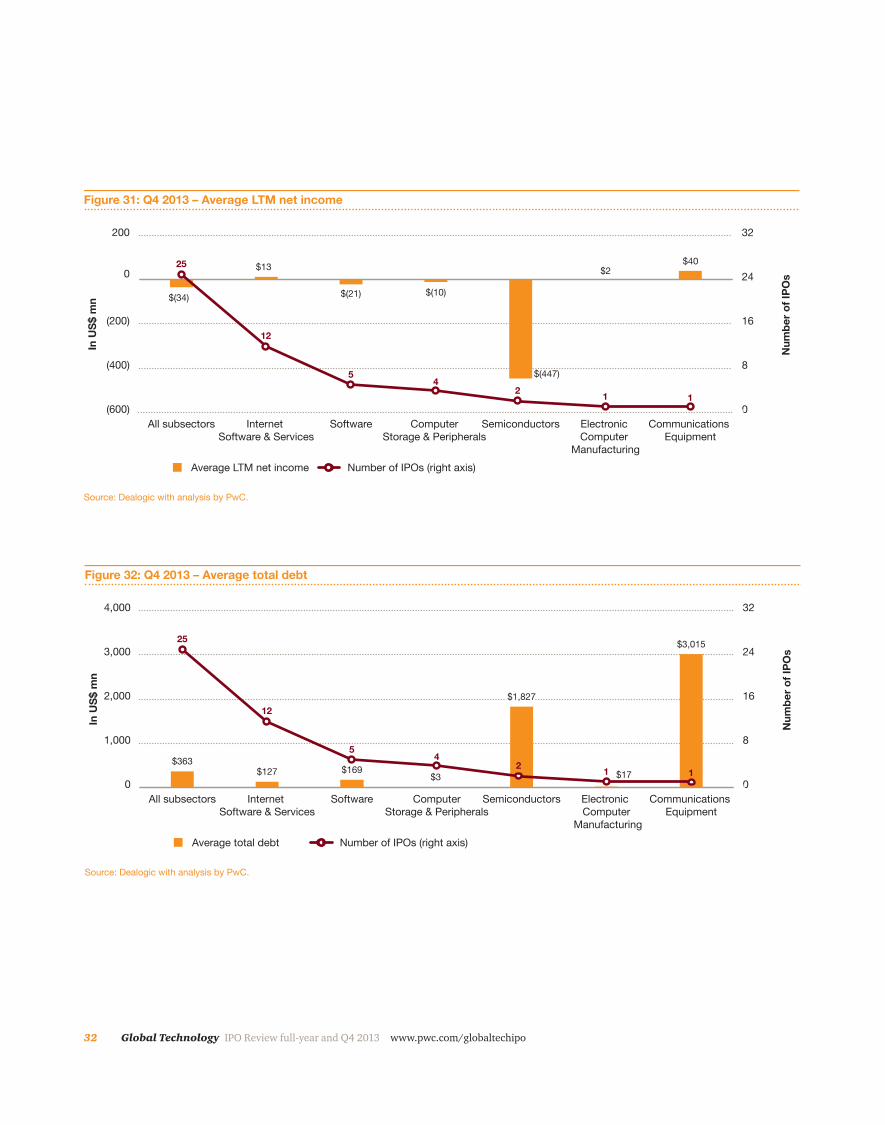
Figure 31: Q4 2013 – Average LTM net income
Source: Dealogic with analysis by PwC.
$40$2$13
$(10)$(21)
$(447)
In U
S$ m
n
0
1,000
2,000
3,000
4,000
Communications Equipment
Electronic Computer
Manufacturing
SemiconductorsComputer Storage & Peripherals
SoftwareInternet Software & Services
All subsectors0
8
16
24
32
25
12
54
2 1 1
Average total debt Number of IPOs (right axis)
Num
ber o
f IPO
s
$363
Figure 32: Q4 2013 – Average total debt
Source: Dealogic with analysis by PwC.
$127 $169$3
$1,827
$17
$3,015
33www.pwc.com/globaltechipo IPO Review full-year and Q4 2013 Global Technology
0
2,000
4,000
6,000
8,000
Communications Equipment
Electronic Computer
Manufacturing
SemiconductorsComputer Storage & Peripherals
SoftwareInternet Software & Services
All subsectors
In U
S$ m
n
0
8
16
24
32
25
12
54
2 1 1
Average enterprise value Number of IPOs (right axis)
Num
ber o
f IPO
s
$4,052
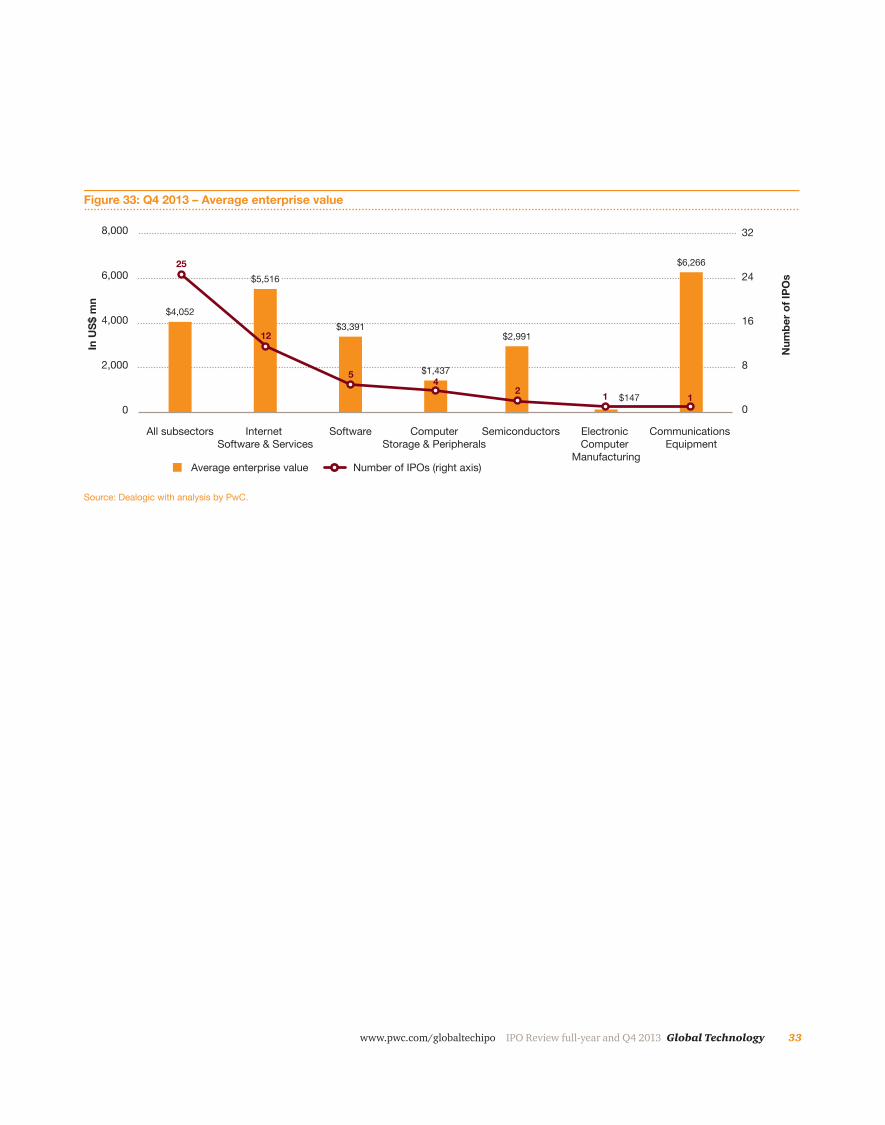
Figure 33: Q4 2013 – Average enterprise value
$5,516
$3,391
$1,437
$2,991
$147
$6,266
Source: Dealogic with analysis by PwC.
34 Global Technology IPO Review full-year and Q4 2013 www.pwc.com/globaltechipo
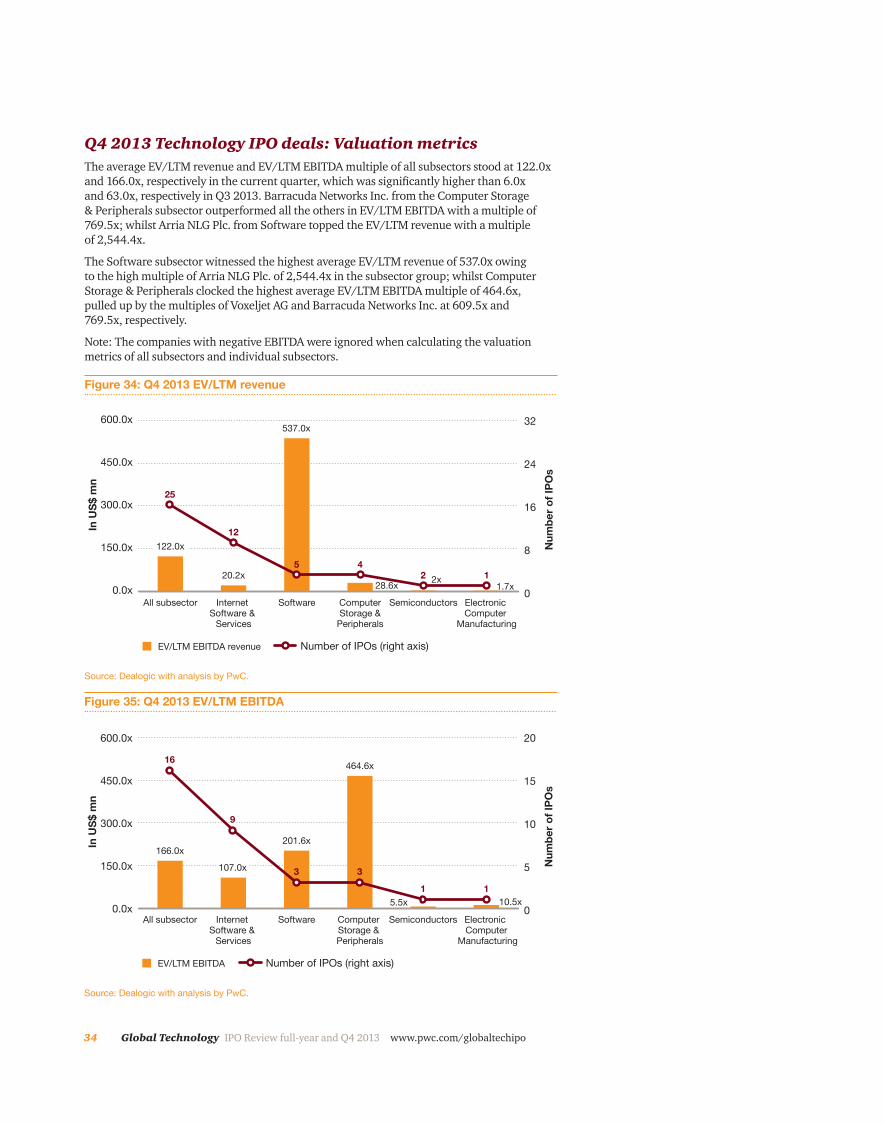
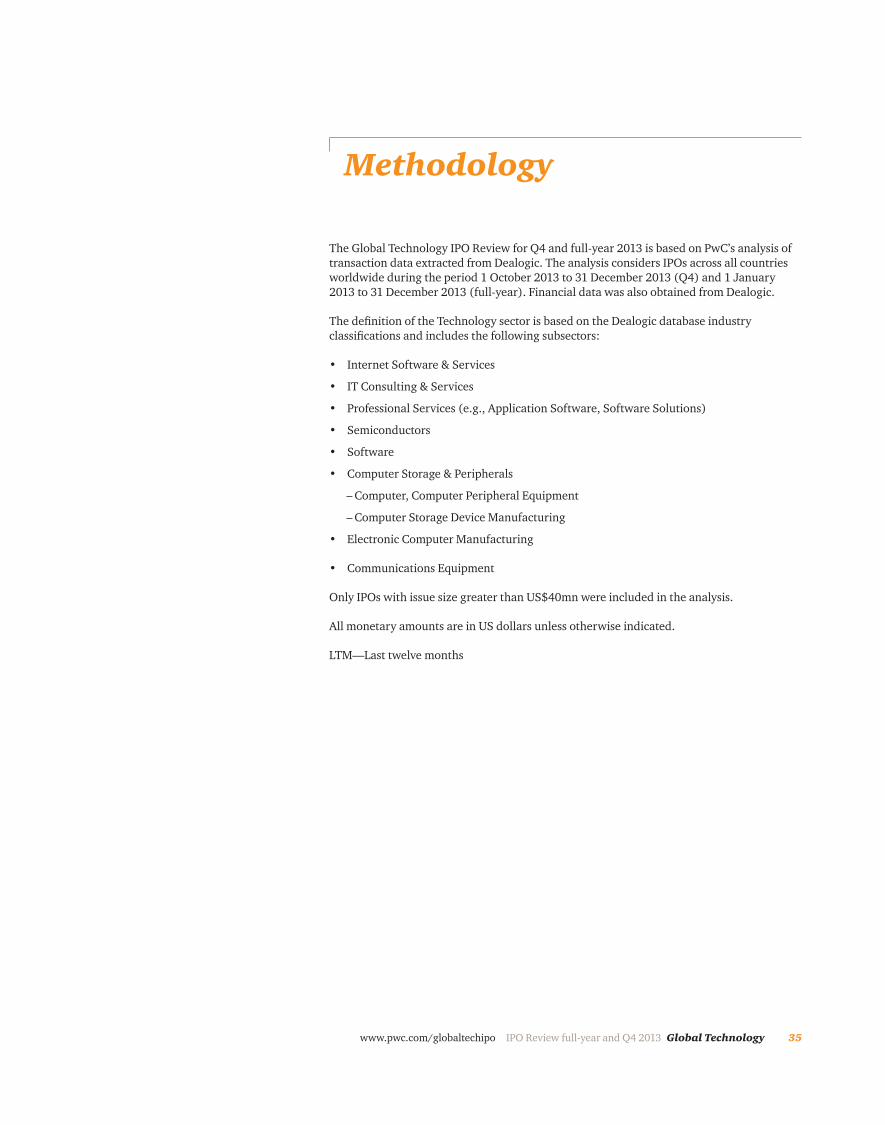
Q4 2013 Technology IPO deals: Valuation metricsThe average EV/LTM revenue and EV/LTM EBITDA multiple of all subsectors stood at 122.0x and 166.0x, respectively in the current quarter, which was significantly higher than 6.0x and 63.0x, respectively in Q3 2013. Barracuda Networks Inc. from the Computer Storage & Peripherals subsector outperformed all the others in EV/LTM EBITDA with a multiple of 769.5x; whilst Arria NLG Plc. from Software topped the EV/LTM revenue with a multiple of 2,544.4x.
The Software subsector witnessed the highest average EV/LTM revenue of 537.0x owing to the high multiple of Arria NLG Plc. of 2,544.4x in the subsector group; whilst Computer Storage & Peripherals clocked the highest average EV/LTM EBITDA multiple of 464.6x, pulled up by the multiples of Voxeljet AG and Barracuda Networks Inc. at 609.5x and 769.5x, respectively.
Note: The companies with negative EBITDA were ignored when calculating the valuation metrics of all subsectors and individual subsectors.
EV/LTM EBITDA revenue
2x
537.0x
28.6x 1.7x
Num
ber o
f IPO
s
In U
S$ m
n
25
2 1
Number of IPOs (right axis)
Source: Dealogic with analysis by PwC.
Figure 34: Q4 2013 EV/LTM revenue
0.0x
150.0x
300.0x
450.0x
600.0x
Electronic Computer
Manufacturing
SemiconductorsComputer Storage & Peripherals
SoftwareInternet Software &
Services
All subsector
20.2x
0
8
16
24
32
5 4
12122.0x
EV/LTM EBITDA
166.0x
5.5x
201.6x
464.6x
10.5x
Num
ber o
f IPO
s
In U
S$ m
n
16
1 1
Number of IPOs (right axis)
Source: Dealogic with analysis by PwC.
Figure 35: Q4 2013 EV/LTM EBITDA
0.0x
150.0x
300.0x
450.0x
600.0x
Electronic Computer
Manufacturing
SemiconductorsComputer Storage & Peripherals
SoftwareInternet Software &
Services
All subsector0
5
10
15
20
3 3
9
107.0x
35www.pwc.com/globaltechipo IPO Review full-year and Q4 2013 Global Technology
Methodology
The Global Technology IPO Review for Q4 and full-year 2013 is based on PwC’s analysis of transaction data extracted from Dealogic. The analysis considers IPOs across all countries worldwide during the period 1 October 2013 to 31 December 2013 (Q4) and 1 January 2013 to 31 December 2013 (full-year). Financial data was also obtained from Dealogic.
The definition of the Technology sector is based on the Dealogic database industry classifications and includes the following subsectors:
• Internet Software & Services
• IT Consulting & Services
• Professional Services (e.g., Application Software, Software Solutions)
• Semiconductors
• Software
• Computer Storage & Peripherals
– Computer, Computer Peripheral Equipment
– Computer Storage Device Manufacturing
• Electronic Computer Manufacturing
• Communications Equipment
Only IPOs with issue size greater than US$40mn were included in the analysis.
All monetary amounts are in US dollars unless otherwise indicated.
LTM—Last twelve months
36 Global Technology IPO Review full-year and Q4 2013 www.pwc.com/globaltechipo
For more information
If you would like to discuss how these findings might impact your business or your future strategy, please reach out to any of our technology industry leaders listed below.
Raman ChitkaraGlobal Technology LeaderPhone: 1 408 817 3746Email: [email protected]
Rod Dring—AustraliaPhone: 61 2 8266 7865Email: [email protected]
Estela Vieira—BrazilPhone: 55 1 3674 3802Email: [email protected]
Christopher Dulny—CanadaPhone: 1 416 869 2355Email: [email protected]
JianBin Gao—ChinaPhone: 86 21 2323 3362Email: [email protected]
Pierre Marty—FrancePhone: 33 1 5657 58 15Email: [email protected]
Werner Ballhaus—GermanyPhone: 49 211 981 5848Email: [email protected]
Sandeep Ladda—IndiaPhone: 91 22 6689 1444Email: [email protected]
Kenji Katsura—JapanPhone: 81 90 5428 7687Email: [email protected]
Hoonsoo Yoon – KoreaPhone: 82 2 709 0201Email: [email protected]
Ilja Linnemeijer– The NetherlandsPhone: 31 88 792 4956Email: [email protected]
Yury Pukha—RussiaPhone: 7 495 223 5177Email: [email protected]
Greg Unsworth—SingaporePhone: 65 6236 3738Email: [email protected]
Douglas Mahony—UAEPhone: 97 1 43043151 Email: [email protected]
Jass Sarai—UKPhone: 44 0 1895 52 2206Email: [email protected]
Tom Archer– USPhone: 1 408 817 3836Email: [email protected]
37www.pwc.com/globaltechipo IPO Review full-year and Q4 2013 Global Technology
© 2014 PwC. All rights reserved. PwC refers to the PwC network and/or one or more of its member firms, each of which is a separate legal entity. Please see http://www.pwc.com/structure for further details. This content is for general information purposes only, and should not be used as a substitute for consultation with professional advisors. BS-14-0286
pwc.com
About PwC’s Technology InstituteThe Technology Institute is PwC’s global research network that studies the business of technology and the technology of business with the purpose of creating thought leadership that offers both fact-based analysis and experience-based perspectives. Technology Institute insights and viewpoints originate from active collaboration between our professionals across the globe and their first-hand experiences working in and with the technology industry. For more information please contact Raman Chitkara, Global Technology Industry Leader at [email protected].
About PwCPwC firms help organisations and individuals create the value they’re looking for. We’re a network of firms in 157 countries with more than 184,000 people who are committed to delivering quality in assurance, tax and advisory services. Tell us what matters to you and find out more by visiting us at http://www.pwc.com/