global internet phenomena - sandvine · combining instagram with whatsapp, the leading third party...
TRANSCRIPT
Global InternetPhenomena
2016
AFRICA, ASIA-PACIFIC, AND MIDDLE EAST
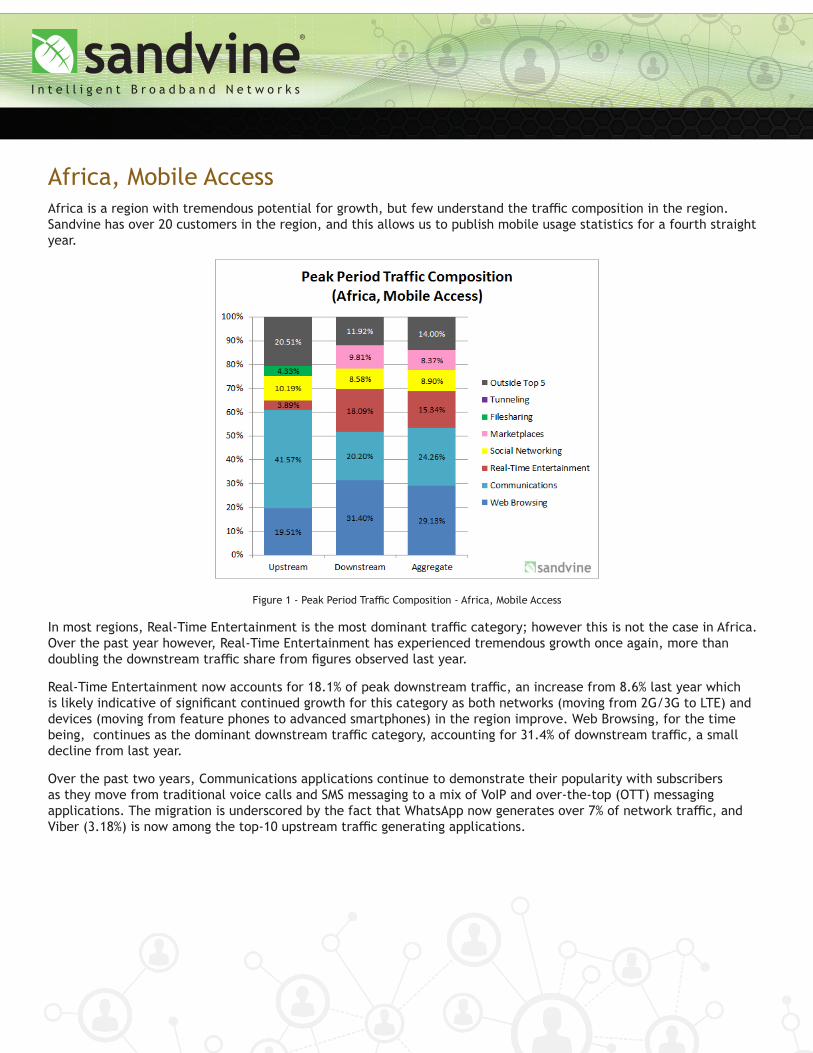
Africa, Mobile AccessAfrica is a region with tremendous potential for growth, but few understand the traffic composition in the region. Sandvine has over 20 customers in the region, and this allows us to publish mobile usage statistics for a fourth straight year.
Figure 1 - Peak Period Traffic Composition - Africa, Mobile Access
In most regions, Real-Time Entertainment is the most dominant traffic category; however this is not the case in Africa. Over the past year however, Real-Time Entertainment has experienced tremendous growth once again, more than doubling the downstream traffic share from figures observed last year.
Real-Time Entertainment now accounts for 18.1% of peak downstream traffic, an increase from 8.6% last year which is likely indicative of significant continued growth for this category as both networks (moving from 2G/3G to LTE) and devices (moving from feature phones to advanced smartphones) in the region improve. Web Browsing, for the time being, continues as the dominant downstream traffic category, accounting for 31.4% of downstream traffic, a small decline from last year.
Over the past two years, Communications applications continue to demonstrate their popularity with subscribers as they move from traditional voice calls and SMS messaging to a mix of VoIP and over-the-top (OTT) messaging applications. The migration is underscored by the fact that WhatsApp now generates over 7% of network traffic, and Viber (3.18%) is now among the top-10 upstream traffic generating applications.
3
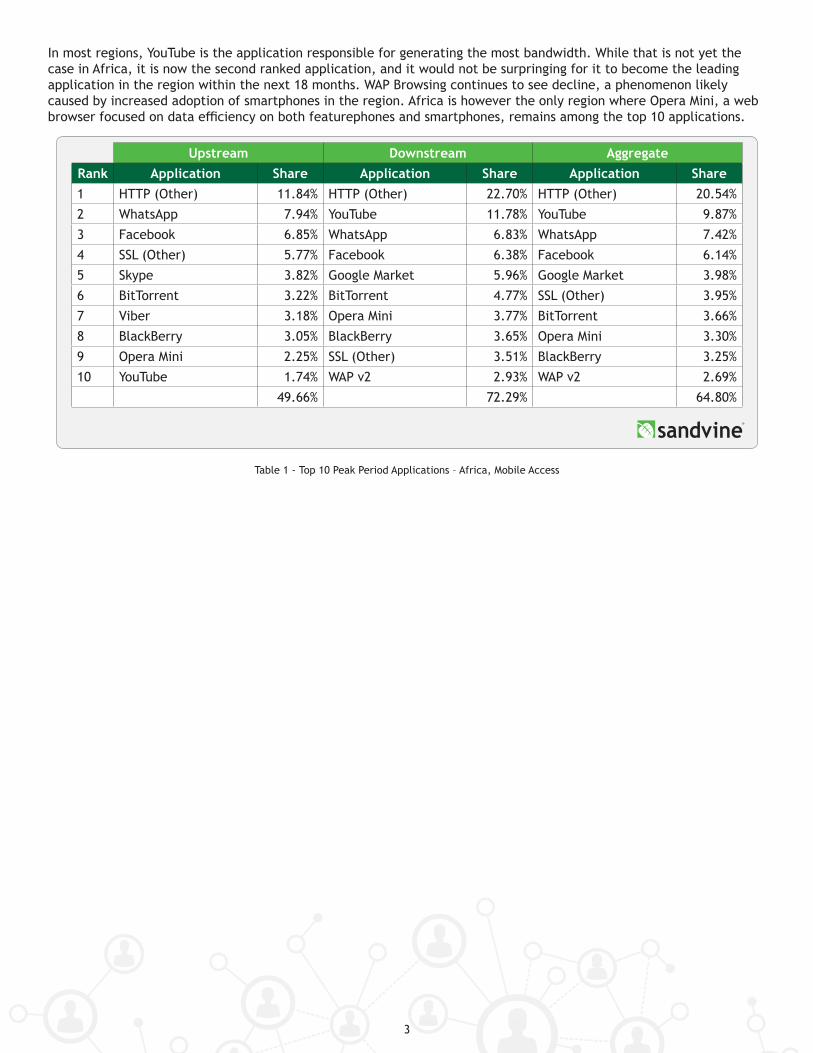
In most regions, YouTube is the application responsible for generating the most bandwidth. While that is not yet the case in Africa, it is now the second ranked application, and it would not be surpringing for it to become the leading application in the region within the next 18 months. WAP Browsing continues to see decline, a phenomenon likely caused by increased adoption of smartphones in the region. Africa is however the only region where Opera Mini, a web browser focused on data efficiency on both featurephones and smartphones, remains among the top 10 applications.
Upstream Downstream AggregateRank Application Share Application Share Application Share1 HTTP (Other) 11.84% HTTP (Other) 22.70% HTTP (Other) 20.54%2 WhatsApp 7.94% YouTube 11.78% YouTube 9.87%3 Facebook 6.85% WhatsApp 6.83% WhatsApp 7.42%4 SSL (Other) 5.77% Facebook 6.38% Facebook 6.14%5 Skype 3.82% Google Market 5.96% Google Market 3.98%6 BitTorrent 3.22% BitTorrent 4.77% SSL (Other) 3.95%7 Viber 3.18% Opera Mini 3.77% BitTorrent 3.66%8 BlackBerry 3.05% BlackBerry 3.65% Opera Mini 3.30%9 Opera Mini 2.25% SSL (Other) 3.51% BlackBerry 3.25%10 YouTube 1.74% WAP v2 2.93% WAP v2 2.69%
49.66% 72.29% 64.80%
Table 1 - Top 10 Peak Period Applications – Africa, Mobile Access
4
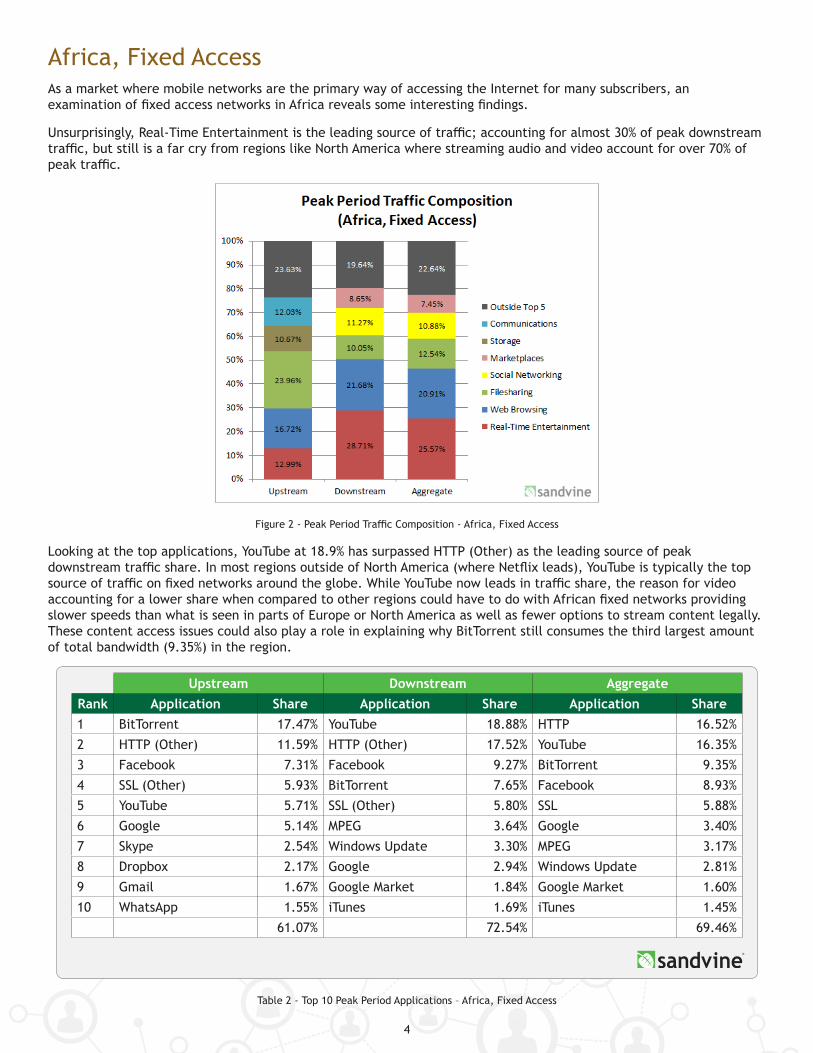
Africa, Fixed AccessAs a market where mobile networks are the primary way of accessing the Internet for many subscribers, an examination of fixed access networks in Africa reveals some interesting findings.
Unsurprisingly, Real-Time Entertainment is the leading source of traffic; accounting for almost 30% of peak downstream traffic, but still is a far cry from regions like North America where streaming audio and video account for over 70% of peak traffic.
Figure 2 - Peak Period Traffic Composition - Africa, Fixed Access
Looking at the top applications, YouTube at 18.9% has surpassed HTTP (Other) as the leading source of peak downstream traffic share. In most regions outside of North America (where Netflix leads), YouTube is typically the top source of traffic on fixed networks around the globe. While YouTube now leads in traffic share, the reason for video accounting for a lower share when compared to other regions could have to do with African fixed networks providing slower speeds than what is seen in parts of Europe or North America as well as fewer options to stream content legally. These content access issues could also play a role in explaining why BitTorrent still consumes the third largest amount of total bandwidth (9.35%) in the region.
Upstream Downstream AggregateRank Application Share Application Share Application Share1 BitTorrent 17.47% YouTube 18.88% HTTP 16.52%2 HTTP (Other) 11.59% HTTP (Other) 17.52% YouTube 16.35%3 Facebook 7.31% Facebook 9.27% BitTorrent 9.35%4 SSL (Other) 5.93% BitTorrent 7.65% Facebook 8.93%5 YouTube 5.71% SSL (Other) 5.80% SSL 5.88%6 Google 5.14% MPEG 3.64% Google 3.40%7 Skype 2.54% Windows Update 3.30% MPEG 3.17%8 Dropbox 2.17% Google 2.94% Windows Update 2.81%9 Gmail 1.67% Google Market 1.84% Google Market 1.60%10 WhatsApp 1.55% iTunes 1.69% iTunes 1.45%
61.07% 72.54% 69.46%
Table 2 - Top 10 Peak Period Applications – Africa, Fixed Access
5
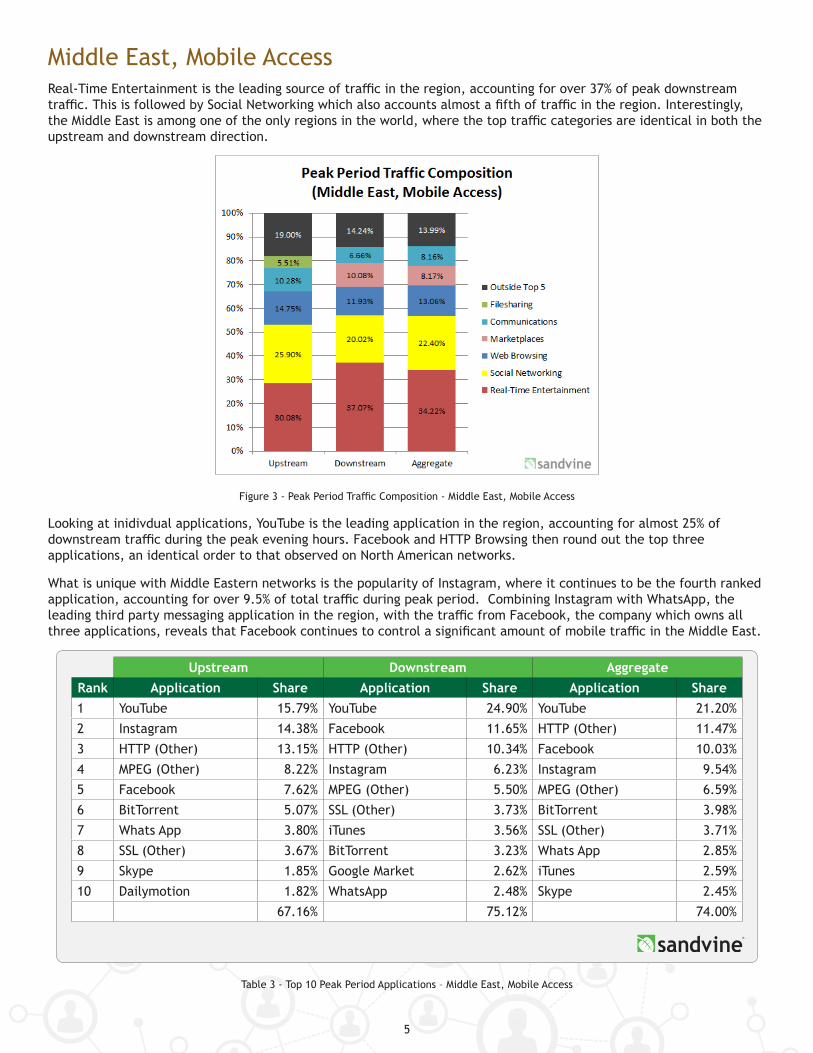
Middle East, Mobile AccessReal-Time Entertainment is the leading source of traffic in the region, accounting for over 37% of peak downstream traffic. This is followed by Social Networking which also accounts almost a fifth of traffic in the region. Interestingly, the Middle East is among one of the only regions in the world, where the top traffic categories are identical in both the upstream and downstream direction.
Figure 3 - Peak Period Traffic Composition - Middle East, Mobile Access
Looking at inidivdual applications, YouTube is the leading application in the region, accounting for almost 25% of downstream traffic during the peak evening hours. Facebook and HTTP Browsing then round out the top three applications, an identical order to that observed on North American networks.
What is unique with Middle Eastern networks is the popularity of Instagram, where it continues to be the fourth ranked application, accounting for over 9.5% of total traffic during peak period. Combining Instagram with WhatsApp, the leading third party messaging application in the region, with the traffic from Facebook, the company which owns all three applications, reveals that Facebook continues to control a significant amount of mobile traffic in the Middle East.
Upstream Downstream AggregateRank Application Share Application Share Application Share1 YouTube 15.79% YouTube 24.90% YouTube 21.20%2 Instagram 14.38% Facebook 11.65% HTTP (Other) 11.47%3 HTTP (Other) 13.15% HTTP (Other) 10.34% Facebook 10.03%4 MPEG (Other) 8.22% Instagram 6.23% Instagram 9.54%5 Facebook 7.62% MPEG (Other) 5.50% MPEG (Other) 6.59%6 BitTorrent 5.07% SSL (Other) 3.73% BitTorrent 3.98%7 Whats App 3.80% iTunes 3.56% SSL (Other) 3.71%8 SSL (Other) 3.67% BitTorrent 3.23% Whats App 2.85%9 Skype 1.85% Google Market 2.62% iTunes 2.59%10 Dailymotion 1.82% WhatsApp 2.48% Skype 2.45%
67.16% 75.12% 74.00%
Table 3 - Top 10 Peak Period Applications – Middle East, Mobile Access
6
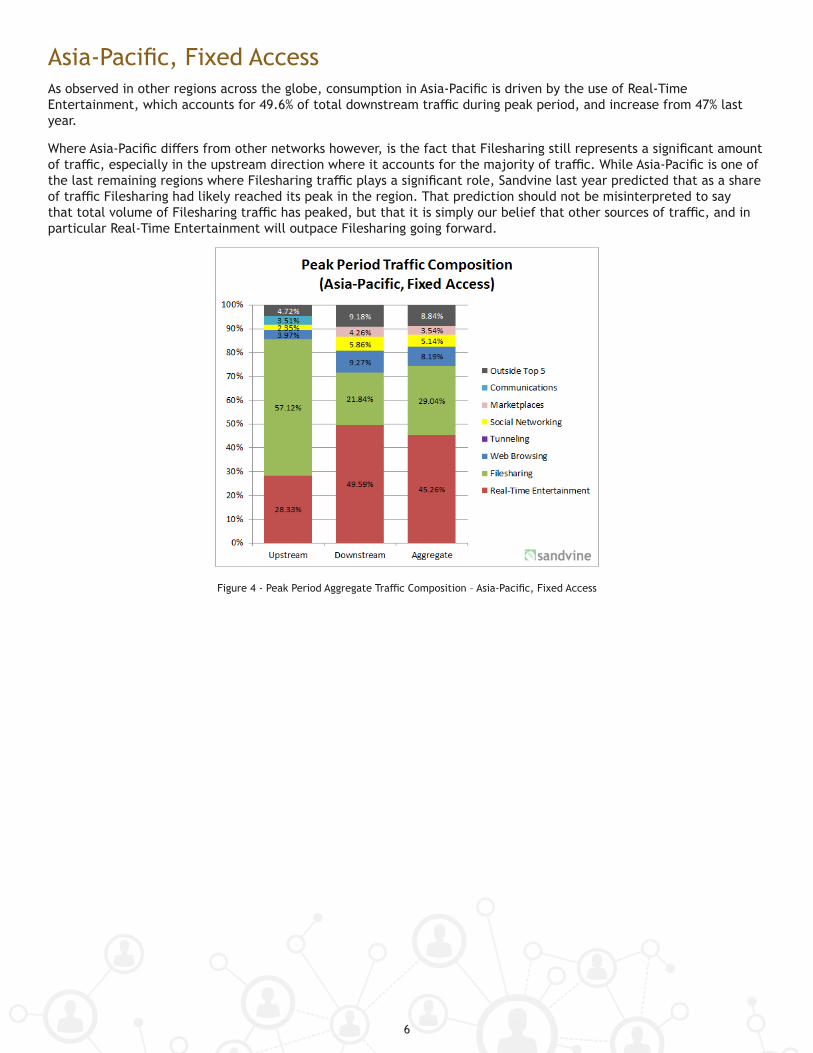
Asia-Pacific, Fixed AccessAs observed in other regions across the globe, consumption in Asia-Pacific is driven by the use of Real-Time Entertainment, which accounts for 49.6% of total downstream traffic during peak period, and increase from 47% last year.
Where Asia-Pacific differs from other networks however, is the fact that Filesharing still represents a significant amount of traffic, especially in the upstream direction where it accounts for the majority of traffic. While Asia-Pacific is one of the last remaining regions where Filesharing traffic plays a significant role, Sandvine last year predicted that as a share of traffic Filesharing had likely reached its peak in the region. That prediction should not be misinterpreted to say that total volume of Filesharing traffic has peaked, but that it is simply our belief that other sources of traffic, and in particular Real-Time Entertainment will outpace Filesharing going forward.
Figure 4 - Peak Period Aggregate Traffic Composition – Asia-Pacific, Fixed Access
7
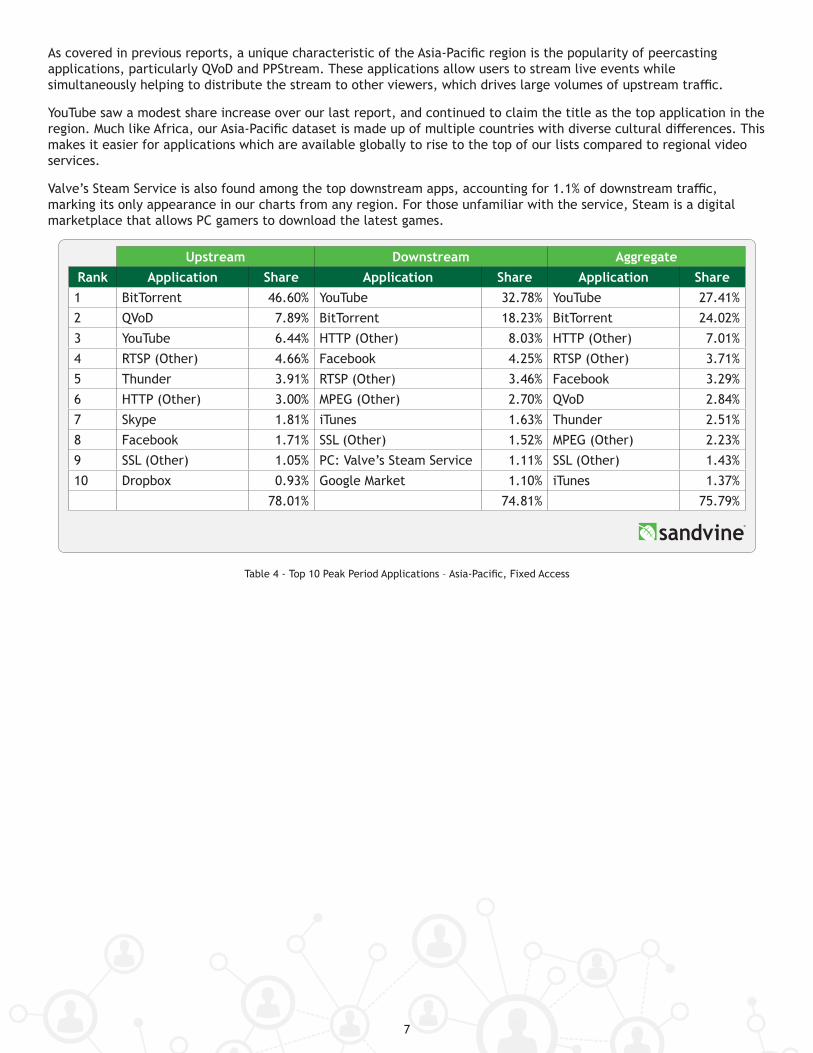
As covered in previous reports, a unique characteristic of the Asia-Pacific region is the popularity of peercasting applications, particularly QVoD and PPStream. These applications allow users to stream live events while simultaneously helping to distribute the stream to other viewers, which drives large volumes of upstream traffic.
YouTube saw a modest share increase over our last report, and continued to claim the title as the top application in the region. Much like Africa, our Asia-Pacific dataset is made up of multiple countries with diverse cultural differences. This makes it easier for applications which are available globally to rise to the top of our lists compared to regional video services.
Valve’s Steam Service is also found among the top downstream apps, accounting for 1.1% of downstream traffic, marking its only appearance in our charts from any region. For those unfamiliar with the service, Steam is a digital marketplace that allows PC gamers to download the latest games.
Upstream Downstream AggregateRank Application Share Application Share Application Share1 BitTorrent 46.60% YouTube 32.78% YouTube 27.41%2 QVoD 7.89% BitTorrent 18.23% BitTorrent 24.02%3 YouTube 6.44% HTTP (Other) 8.03% HTTP (Other) 7.01%4 RTSP (Other) 4.66% Facebook 4.25% RTSP (Other) 3.71%5 Thunder 3.91% RTSP (Other) 3.46% Facebook 3.29%6 HTTP (Other) 3.00% MPEG (Other) 2.70% QVoD 2.84%7 Skype 1.81% iTunes 1.63% Thunder 2.51%8 Facebook 1.71% SSL (Other) 1.52% MPEG (Other) 2.23%9 SSL (Other) 1.05% PC: Valve’s Steam Service 1.11% SSL (Other) 1.43%10 Dropbox 0.93% Google Market 1.10% iTunes 1.37%
78.01% 74.81% 75.79%
Table 4 - Top 10 Peak Period Applications – Asia-Pacific, Fixed Access
8
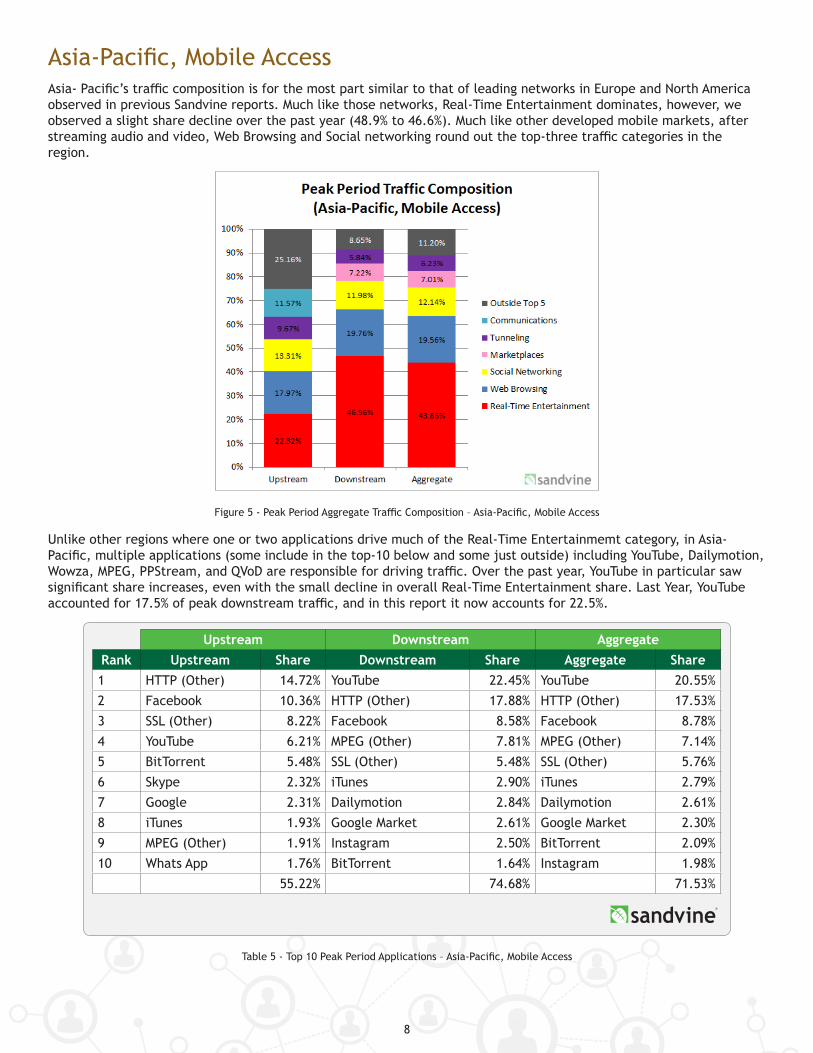
Asia-Pacific, Mobile AccessAsia- Pacific’s traffic composition is for the most part similar to that of leading networks in Europe and North America observed in previous Sandvine reports. Much like those networks, Real-Time Entertainment dominates, however, we observed a slight share decline over the past year (48.9% to 46.6%). Much like other developed mobile markets, after streaming audio and video, Web Browsing and Social networking round out the top-three traffic categories in the region.
Figure 5 - Peak Period Aggregate Traffic Composition – Asia-Pacific, Mobile Access
Unlike other regions where one or two applications drive much of the Real-Time Entertainmemt category, in Asia-Pacific, multiple applications (some include in the top-10 below and some just outside) including YouTube, Dailymotion, Wowza, MPEG, PPStream, and QVoD are responsible for driving traffic. Over the past year, YouTube in particular saw significant share increases, even with the small decline in overall Real-Time Entertainment share. Last Year, YouTube accounted for 17.5% of peak downstream traffic, and in this report it now accounts for 22.5%.
Upstream Downstream AggregateRank Upstream Share Downstream Share Aggregate Share1 HTTP (Other) 14.72% YouTube 22.45% YouTube 20.55%2 Facebook 10.36% HTTP (Other) 17.88% HTTP (Other) 17.53%3 SSL (Other) 8.22% Facebook 8.58% Facebook 8.78%4 YouTube 6.21% MPEG (Other) 7.81% MPEG (Other) 7.14%5 BitTorrent 5.48% SSL (Other) 5.48% SSL (Other) 5.76%6 Skype 2.32% iTunes 2.90% iTunes 2.79%7 Google 2.31% Dailymotion 2.84% Dailymotion 2.61%8 iTunes 1.93% Google Market 2.61% Google Market 2.30%9 MPEG (Other) 1.91% Instagram 2.50% BitTorrent 2.09%10 Whats App 1.76% BitTorrent 1.64% Instagram 1.98%
55.22% 74.68% 71.53%
Table 5 - Top 10 Peak Period Applications – Asia-Pacific, Mobile Access
9
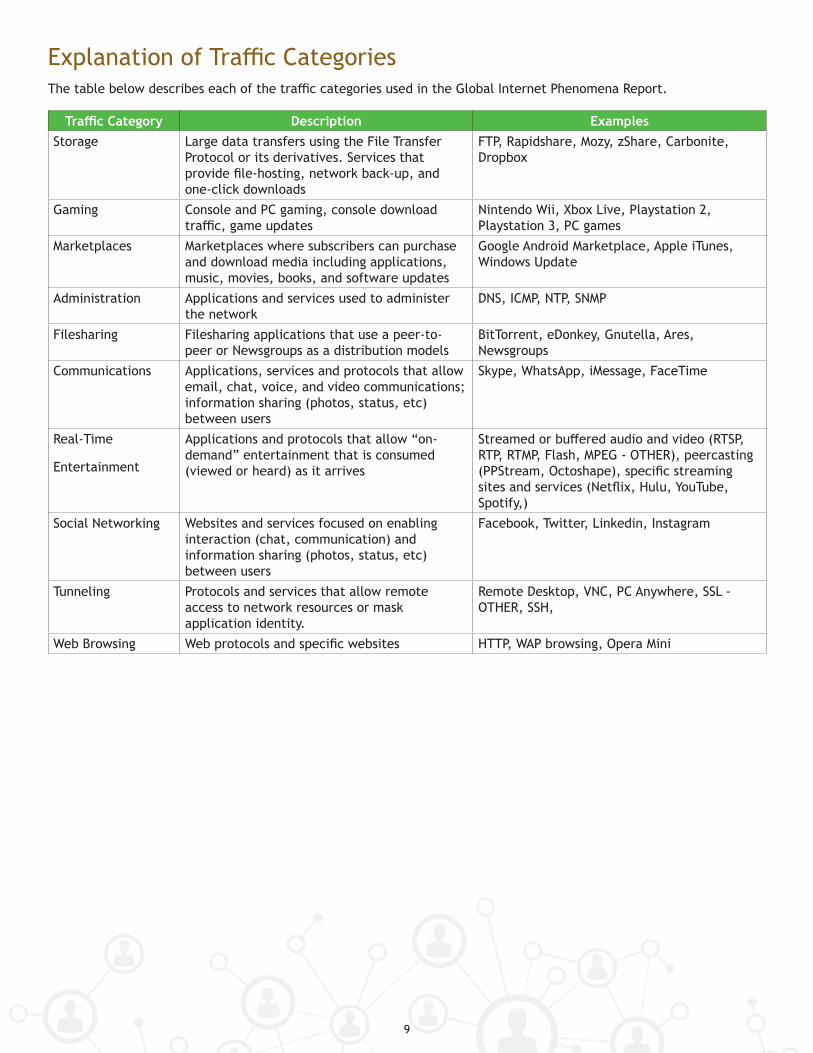
Explanation of Traffic CategoriesThe table below describes each of the traffic categories used in the Global Internet Phenomena Report.
Traffic Category Description ExamplesStorage Large data transfers using the File Transfer
Protocol or its derivatives. Services that provide file-hosting, network back-up, and one-click downloads
FTP, Rapidshare, Mozy, zShare, Carbonite, Dropbox
Gaming Console and PC gaming, console download traffic, game updates
Nintendo Wii, Xbox Live, Playstation 2, Playstation 3, PC games
Marketplaces Marketplaces where subscribers can purchase and download media including applications, music, movies, books, and software updates
Google Android Marketplace, Apple iTunes, Windows Update
Administration Applications and services used to administer the network
DNS, ICMP, NTP, SNMP
Filesharing Filesharing applications that use a peer-to- peer or Newsgroups as a distribution models
BitTorrent, eDonkey, Gnutella, Ares, Newsgroups
Communications Applications, services and protocols that allow email, chat, voice, and video communications; information sharing (photos, status, etc) between users
Skype, WhatsApp, iMessage, FaceTime
Real-Time
Entertainment
Applications and protocols that allow “on- demand” entertainment that is consumed (viewed or heard) as it arrives
Streamed or buffered audio and video (RTSP, RTP, RTMP, Flash, MPEG - OTHER), peercasting (PPStream, Octoshape), specific streaming sites and services (Netflix, Hulu, YouTube, Spotify,)
Social Networking Websites and services focused on enabling interaction (chat, communication) and information sharing (photos, status, etc) between users
Facebook, Twitter, Linkedin, Instagram
Tunneling Protocols and services that allow remote access to network resources or mask application identity.
Remote Desktop, VNC, PC Anywhere, SSL - OTHER, SSH,
Web Browsing Web protocols and specific websites HTTP, WAP browsing, Opera Mini
11
10
Study DetailsSandvine’s Global Internet Phenomena Reports examine a representative cross-section of the world’s leading fixed and mobile communications service providers (CSPs) and are made possible by the voluntary participation of our customers. Collectively, Sandvine’s customers provide Internet and data service to hundreds of millions of subscribers worldwide.
The data gathered for these reports was collected in the summer of 2016 and is completely subscriber-anonymous. No information regarding specific content or personally-identifiable information (including, but not limited to, IP or MAC addresses and subscriber IDs) was collected during this study.
This study reflects the traffic profiles of real service providers, including the impact of any network management (for instance, congestion management and traffic optimization) policies that may be in place.
The data collected includes the bandwidth per second per protocol and the number of active hosts per protocol on the network at each hour. Data also includes the total transmitted (upstream) and received (downstream) bytes, from the subscriber’s perspective, attributable to each subscriber for a period of 30 days.
The datasets were used to create a 24-hour profile of each network, normalized by the number of active subscribers at each hour in the day. These profiles were then aggregated hierarchically for each region with weightings based on subscriber counts and access technology market share.
In parts of the report we reference industry publications, analyst studies, media articles and other sources. As such, we are indebted to the collective work and wisdom of a large number of individuals and organizations and have endeavored to correctly cite all sources and to identify the original creator of referenced material.
Working With SandvineAre you a leading content provider who would like to work with Sandvine to ensure your applications are recognized by fixed and mobile operators around the world? We’d love to hear from you. Contacts us: [email protected]

Headquarters Sandvine Incorporated ULCWaterloo, Ontario Canada Phone: +1 519 880 2600 Email: [email protected]
Copyright ©2016 Sandvine Incorporated ULC. Sandvine and the Sandvine logo are registered trademarks of Sandvine Incorporated ULC. All rights reserved.
Revision: 2016-10-24
www.sandvine.comTo learn more about the latest Internet trends: www.internetphenomena.com