global economic impact of dental diseases
TRANSCRIPT

Journal of Dental Research 1 –7© International & American Associations for Dental Research 2015Reprints and permissions: sagepub.com/journalsPermissions.navDOI: 10.1177/0022034515602879jdr.sagepub.com
Research Reports: Clinical
IntroductionIdentifying the economic burden of a disease is useful to understand the maximum amount of resources that could be saved or gained if that disease were to be partially or fully eradicated (Rice 1967). Describing and highlighting the mag-nitude of the economic impact of dental diseases on society or on different population groups would provide relevant infor-mation for decision makers in public health policy to evaluate the importance of addressing oral diseases. In the context of oral health and care, however, information about the economic impacts of disease has been very limited so far. To our knowl-edge, there is not a comprehensive worldwide estimation of the economic burden of oral diseases, including direct and indirect cost, to the extent that this is possible today given the currently available primary data recently reported.
Although the World Health Organization (WHO) estimates that oral diseases are the fourth-most expensive diseases to treat in most industrialized countries (Petersen 2003), its anal-ysis was done only for direct cost and included only a subset of countries. Few sound studies reported estimates for individual countries (Beaglehole et al. 2009; Patel 2012; Wall et al. 2014). Across Organisation for Economic Co-operation and Development (OECD; 2013) countries, on average 5% of total health expenditures have been reported to originate from treat-ment of oral diseases. While treatment is a costly consequence of oral diseases, reductions in morbidity may also imply other economic benefits. Importantly, there are indirect costs to
consider in terms of productivity losses due to absenteeism from school and work, yet relatively little evidence exists in this regard. Recent findings from Canada suggest that oral dis-eases accounted for productivity losses >$1 billion yearly for Canada alone (Hayes et al. 2013). A recent US study estimated the labor market value of the marginal tooth to be nearly $720 per year for an urban-residing woman earning $11/h and work-ing full time (Glied and Neidell 2010).
Different economic approaches exist to estimate the eco-nomic burden of a disease. The cost-of-illness approach views the cost of disease as the sum of several categories of direct (treatment) costs and indirect costs (Byford et al. 2000). This typically includes personal medical care costs (diagnosis, treat-ment, drugs), nonmedical costs for travel associated with
602879 JDRXXX10.1177/0022034515602879Journal of Dental ResearchGlobal Economic Impact of Dental Diseasesresearch-article2015
1Heidelberg University, Translational Health Economics Group, Department of Conservative Dentistry, Heidelberg, Germany2Max Planck Institute for Social Law and Social Policy, Munich Center for the Economics of Aging, Munich, Germany3University of Dundee Dental School, Dundee, UK4Queen Mary University of London, UK
A supplemental appendix to this article is published electronically only at http://jdr.sagepub.com/supplemental.
Corresponding Author:S. Listl, Heidelberg University, Translational Health Economics Group, Department of Conservative Dentistry; Im Neuenheimer Feld 400, 69120 Heidelberg, Germany. Email: [email protected]
Global Economic Impact of Dental Diseases
S. Listl1,2, J. Galloway3, P.A. Mossey3, and W. Marcenes4
AbstractReporting the economic burden of oral diseases is important to evaluate the societal relevance of preventing and addressing oral diseases. In addition to treatment costs, there are indirect costs to consider, mainly in terms of productivity losses due to absenteeism from work. The purpose of the present study was to estimate the direct and indirect costs of dental diseases worldwide to approximate the global economic impact. Estimation of direct treatment costs was based on a systematic approach. For estimation of indirect costs, an approach suggested by the World Health Organization’s Commission on Macroeconomics and Health was employed, which factored in 2010 values of gross domestic product per capita as provided by the International Monetary Fund and oral burden of disease estimates from the 2010 Global Burden of Disease Study. Direct treatment costs due to dental diseases worldwide were estimated at US$298 billion yearly, corresponding to an average of 4.6% of global health expenditure. Indirect costs due to dental diseases worldwide amounted to US$144 billion yearly, corresponding to economic losses within the range of the 10 most frequent global causes of death. Within the limitations of currently available data sources and methodologies, these findings suggest that the global economic impact of dental diseases amounted to US$442 billion in 2010. Improvements in population oral health may imply substantial economic benefits not only in terms of reduced treatment costs but also because of fewer productivity losses in the labor market.
Keywords: treatment costs, indirect expenditures, health expenditures, costs and cost analysis, oral health, teeth
at Universitas Gadjah Mada on February 17, 2016 For personal use only. No other uses without permission.jdr.sagepub.comDownloaded from
© International & American Associations for Dental Research 2015
2 Journal of Dental Research
health care, and nonpersonal costs (e.g., costs for research, income losses, and sometimes pain and suffering). Another approach relates to measuring the value of lost output (i.e., the economic growth approach), which estimates the expected impact of disease on aggregate economic output (gross domes-tic product [GDP]) due to depletion in labor, capital, and other production factors (Bloom et al. 2012). The value-of-statisti-cal-life approach seeks to identify a population’s willingness to pay to reduce the risk of disability or death due to disease, hence factoring in other factors than GDP alone (Bloom et al. 2012). While such methods to estimate the economic impact of diseases are, in principle, well founded, limited availability of comprehensive data sources and nonharmonized international reporting standards make estimating the full economic impact of oral diseases difficult.
New data from the Global Burden of Disease Study 2010 (GBD 2010) provided comparable worldwide information on disability-adjusted life years (DALYs) by country. The data also showed that oral conditions remained highly prevalent in 2010 and collectively affected 3.9 billion people in the globe. Untreated caries in permanent teeth was the most prevalent condition evaluated for all of the GBD 2010 (global prevalence of 35% for all ages combined; Kassebaum et al. 2015), whereas severe periodontitis and untreated caries in deciduous teeth were the 6th- and 10th-most prevalent conditions affecting, respectively, 11% and 9% of the global population. On the con-trary, the prevalence and burden measured by DALYs associ-ated with tooth loss have decreased in the past 20 y; specifically, tooth loss was the 36th-most prevalent condition, with a global estimate of 2.3% in 2010 (Marcenes et al. 2013; Kassebaum et al. 2014).
Following publication of the Budapest Declaration under the auspices of the Global Oral Health Inequalities Research Agenda of the International Association for Dental Research (IADR-GOHIRA®), 1 objective for future research was to esti-mate the global costs (direct and indirect) of oral disease (Mossey and Petersen 2014). The purpose of the present study was to systematically produce comparable estimates of the economic burden of the 3 most prevalent oral conditions as specified above in 2010. We aimed to consolidate all economic data about the direct and indirect costs of these conditions and, subsequently, to generate internally consistent estimates for all countries where data are available and to provide estimates for all 21 world regions.
MethodsA systematic approach was used to generate information to estimate the current direct and indirect costs of dental diseases worldwide. Direct costs were defined as overall expenditures for dental health care (including public and private expendi-tures). Indirect costs were intended to capture productivity losses due to the 3 most common oral conditions—namely, untreated caries in permanent and deciduous teeth, severe peri-odontitis, and severe tooth loss. Identification of appropriate methods was informed by current best practice in evidence
synthesis and heuristic piloting to test the feasibility of various approaches. The most suitable approach to estimate worldwide direct and indirect costs of oral diseases was determined by consensus among all authors. To facilitate alignment with the GBD 2010, the year 2010 was defined as the primary target period for estimation of global economic impacts of dental diseases.
Estimation of Direct Costs: Dental Health Care Costs
Selection of studies. Our search strategy was oriented to identify country-specific yearly national expenditure for outpatient den-tal care in 2010 or nearest year available. An electronic search was performed focusing on the following online resources:
WHO Global Health Expenditure Database: http://www.who.int/health-accounts/ghed/en/
OECD Data: https://data.oecd.org/FDI Oral Health Atlas: http://issuu.com/myriadeditions/
docs/flipbook_oral_healthPlatform for Better Oral Health in Europe: http://www.oral
healthplatform.euCouncil of European Chief Dental Officers: http://www.
cecdo.org/Intergovernmental Organization Search: http://www.uia.
org/igosearchGoogle (noncustomized search): http://www.google.com
Search words for dental expenditure included “expenditure,” “expenditures,” “cost,” “costs,” or “treatment costs” combined with “dentist,” “dental,” “dentistry,” “oral health,” “oral health care,” “oral health services,” or “dental care.” The search was focused on 187 countries as defined in Murray et al. (2012). For each country, individual searches were carried out with the respective “[country name]” as an additional search term. We also searched MEDLINE via PubMed (keyword- and MeSH-based searches), EMBASE via OVID, LILACS via BIREME, the Cochrane Database of Systematic Reviews, the Database of Abstracts of Reviews of Effects, the Health Technology Assessment Database, and the NHS Economic Evaluation Database for relevant information on dental expenditure (see Appendix for details). Additional hand searches focused on reference lists of relevant publications.
Information sources were included if they fulfilled the fol-lowing criteria: country-specific representative reporting; over-all expenditures for dental services reported, including public and private source of funds, as specified in the International Classification of Health Accounts (categories: HC.1.3.2, “out-patient dental care”; HP.3.2, “offices of dentists”; OECD 2000); annual expenditures reported for at least 1 y between 2000 and 2014; and expenditures reported either as absolute monetary values or as a percentage of GDP. An information source was excluded if it was nonrepresentative of a country’s entire popu-lation (selective sample; e.g., only representative for a local patient group with specific morbidity), or it reported only
at Universitas Gadjah Mada on February 17, 2016 For personal use only. No other uses without permission.jdr.sagepub.comDownloaded from
© International & American Associations for Dental Research 2015

Global Economic Impact of Dental Diseases 3
limited parts of overall dental expenditures (e.g., only private out-of-pocket or only government expenditures).
Two authors (S.L., J.G.) performed all searches and selected information fulfilling the inclusion criteria independently and in duplicate. Those information sources found to be relevant after initial screening were kept in the database. It was distin-guished between countries for which there was “relevant infor-mation identifiable” versus countries for which there was “no relevant information identifiable.” Remaining uncertainties were resolved by consensus among all authors. Duplication between results was removed. All information sources meeting the criteria for inclusion in this review were used in the estima-tion of the direct costs of oral diseases.
Data extraction and imputation. For countries for which rele-vant information was identifiable, yearly dental expenditure values were extracted in terms of absolute values and as pro-portion of GDP. Annual expenditure values were reported in or converted to US dollars (midyear conversion rates for the reporting year [http://www.xe.com]; purchasing power adjust-ment based on inflation rates relative to 2010 US dollars [http://www.usinflationcalculator.com]). If expenditure information was originally reported as proportion of GDP, it was translated to absolute US dollar values by using the relevant country’s GDP in US dollars in the reporting year and applying inflation rates relative to 2010 US dollars. Estimates of GDP per capita and population size were extracted from the World Economic Outlook Database (International Monetary Fund 2011). In case of missing information, supplementary values were extracted from UN data (United Nations 2015). As a robustness check, worldwide dental expenditures were also computed by using solely GDP information from UN data (United Nations 2015).
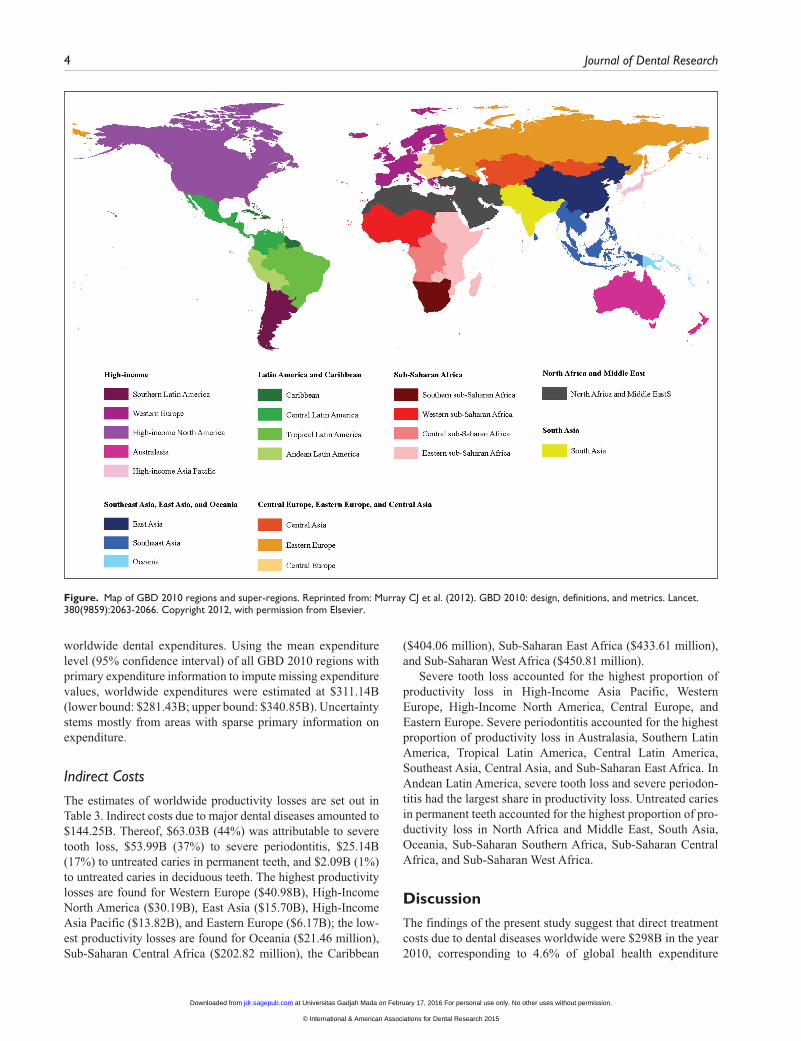
Estimation of worldwide dental expenditures involved imputation of missing expenditure values, which leaned on expenditure information from the nearest geographic unit for which expenditure information was identifiable. To this end, countries were grouped into 21 regions and 7 super-regions, following the classification of the GBD 2010 (Fig.). When expenditure information was not available for a particular country, its 2010 expenditure was approximated by multiply-ing the average expenditure (in proportion of GDP) of the near-est geographic unit (region, super-region, world), which included primary expenditure information with the GDP value of the country without primary data. As an additional robust-ness test, worldwide dental expenditures were estimated by using the mean (95% confidence interval) expenditure level of all GBD 2010 regions containing primary expenditure infor-mation to impute missing expenditure values.
Estimation of Indirect Costs
Indirect costs were estimated according to an approach sug-gested by the WHO’s Commission on Macroeconomics and Health (WHO 2001), which was recently used to estimate global economic costs of cancer (Cancer Society 2010). This approach is based on valuing 1 DALY at 1 y of per capita GDP
to approximate productivity losses. Following this approach, we factored in 2010 values of GDP per capita (International Monetary Fund 2011) and extracted DALY estimates for untreated caries, severe periodontitis, and severe tooth loss (<9 remaining permanent teeth) in 187 countries from a recent study (Marcenes et al. 2013). Note that untreated caries included deciduous teeth, whereby respective productivity losses include parents taking time off to look after their children. Country-specific GDP values were aggregated on the level of the 21 GBD 2010 regions and weighted according to country-specific population sizes (International Monetary Fund 2011). In case of missing information, supplementary values were extracted from UN data (United Nations 2015). Relevant data for estima-tion of indirect costs (i.e., GDP per capita in US dollars and DALYs in thousands [2010 values]) are summarized in Table 1.
All analyses were carried out with Microsoft Excel (v. 14.0.7015.1000).
Results
Direct Costs: Treatment Costs
The systematic information search started with identification of countries relevant to estimate global expenditures. Accordingly, 187 country-specific electronic searches were carried out and submitted to initial screening. At this stage, 107 countries were excluded because no relevant information could be identified. Of the remaining 80 countries, 14 more countries were excluded because the respective information did not meet the inclusion/exclusion criteria. For the remaining 66 coun-tries, relevant information was found to be identifiable. Full lists of included and excluded information sources (with rea-sons for exclusion) are presented in Appendix Tables 1 and 2.
Worldwide expenditure estimations are presented in Table 2. Aggregate direct treatment costs due to dental diseases worldwide were estimated at $297.67B; 82% of the estimated expenditures ($244.40B) occurred in high-income countries (North America: $120.08B; Western Europe: $91.05B; High-Income Asian Pacific: $23.30B; Australasia: $7.03B; Southern Latin America: $2.93B). Latin America and the Caribbean accounted for $14.06B (Tropical Latin America: $6.92B; Central Latin America: $5.79B; Andean Latin America: $0.76B; Caribbean: $0.59B). South Asia contributed $12.84B. Eastern Europe ($6.12B), Central Europe ($2.75B), and Central Asia ($0.45B) together contributed $9.32B. North Africa and the Middle East contributed $8.33B. The region comprising East Asia ($5.02B), Southeast Asia ($0.75B), and Oceania ($0.02B) accounted for $5.79B; $2.96B was attrib-uted to Sub-Saharan Africa (Southern: $2.70B; East: $0.20B; West: $0.04B; Central: $0.01B).
The results from robustness checks are shown in Appendix Tables 3 and 4. Findings in Appendix Table 3 show somewhat higher worldwide expenditures of $299.61B if GDP values from UN data are compared with $297.67B when based on GDP values from the World Economic Outlook Database. Appendix Table 4 highlights the extent of uncertainty in the estimation of
at Universitas Gadjah Mada on February 17, 2016 For personal use only. No other uses without permission.jdr.sagepub.comDownloaded from
© International & American Associations for Dental Research 2015
4 Journal of Dental Research
worldwide dental expenditures. Using the mean expenditure level (95% confidence interval) of all GBD 2010 regions with primary expenditure information to impute missing expenditure values, worldwide expenditures were estimated at $311.14B (lower bound: $281.43B; upper bound: $340.85B). Uncertainty stems mostly from areas with sparse primary information on expenditure.
Indirect Costs
The estimates of worldwide productivity losses are set out in Table 3. Indirect costs due to major dental diseases amounted to $144.25B. Thereof, $63.03B (44%) was attributable to severe tooth loss, $53.99B (37%) to severe periodontitis, $25.14B (17%) to untreated caries in permanent teeth, and $2.09B (1%) to untreated caries in deciduous teeth. The highest productivity losses are found for Western Europe ($40.98B), High-Income North America ($30.19B), East Asia ($15.70B), High-Income Asia Pacific ($13.82B), and Eastern Europe ($6.17B); the low-est productivity losses are found for Oceania ($21.46 million), Sub-Saharan Central Africa ($202.82 million), the Caribbean
($404.06 million), Sub-Saharan East Africa ($433.61 million), and Sub-Saharan West Africa ($450.81 million).
Severe tooth loss accounted for the highest proportion of productivity loss in High-Income Asia Pacific, Western Europe, High-Income North America, Central Europe, and Eastern Europe. Severe periodontitis accounted for the highest proportion of productivity loss in Australasia, Southern Latin America, Tropical Latin America, Central Latin America, Southeast Asia, Central Asia, and Sub-Saharan East Africa. In Andean Latin America, severe tooth loss and severe periodon-titis had the largest share in productivity loss. Untreated caries in permanent teeth accounted for the highest proportion of pro-ductivity loss in North Africa and Middle East, South Asia, Oceania, Sub-Saharan Southern Africa, Sub-Saharan Central Africa, and Sub-Saharan West Africa.
DiscussionThe findings of the present study suggest that direct treatment costs due to dental diseases worldwide were $298B in the year 2010, corresponding to 4.6% of global health expenditure
Figure. Map of GBD 2010 regions and super-regions. Reprinted from: Murray CJ et al. (2012). GBD 2010: design, definitions, and metrics. Lancet. 380(9859):2063-2066. Copyright 2012, with permission from Elsevier.
at Universitas Gadjah Mada on February 17, 2016 For personal use only. No other uses without permission.jdr.sagepub.comDownloaded from
© International & American Associations for Dental Research 2015

Global Economic Impact of Dental Diseases 5
($6.5 trillion in 2010; WHO 2012). In addition, the annual global indirect costs due to dental diseases (i.e., productivity losses) were estimated at $144B. Direct and indirect costs together amounted to an annual economic impact of $442B for 2010 alone; 83% of direct treatment costs were attributable to high-income countries. The global region with the next-largest amount of dental expenditures was Latin America and the Caribbean (5%), followed by South Asia (4%), Central/Eastern Europe and Central Asia (3%), North Africa and the Middle East (2%), Southeast Asia, East Asia and Oceania (2% of global expenditures), and Sub-Saharan Africa (1%). Forty-four percent of productivity losses were attributable to severe tooth loss, 38% to severe periodontitis, and 17% to untreated caries in permanent teeth. Economic losses of the top 10 global causes of death were recently estimated through a similar approach as the present study, to range between $895B (can-cer) and $126B (lower respiratory infections; Cancer Society 2010). Therefore, the present study’s estimate for productivity loss due to dental diseases ($144B) may be interpreted in the sense that indirect costs due to dental diseases worldwide cor-respond to economic losses within the range of the 10 most frequent global causes of death.
Due to limitations in the underlying data sources, the find-ings of the present study should be interpreted with caution. For estimation of direct costs, relevant information was identi-fiable for only 66 of 187 countries (35%). Expectedly, our results emphasize considerable uncertainty in estimating global costs of dental diseases. Routine health expenditure information was found to be primarily published by depart-ments of health or international organizations. Although
information availability tended to be better for high-income countries, there is ample room for improvement in the quality,
Table 1. GDP per Capita and DALYs: 2010.
DALYs, ×1,000
Untreated Caries Teeth Severe
Region GDP per Capita, US$ Deciduous Permanent Periodontitis Tooth Loss
Asia Pacific, High Income 36,848.52 3 35 149 188Europe, Western 38,771.20 6 114 391 546Australasia 51,809.58 0 4 35 34North America, High Income 46,805.05 8 57 224 356Europe, Central 10,951.79 4 116 133 140Latin America, Southern 10,047.62 1 20 95 60Europe, Eastern 8,427.02 7 183 265 277Asia, East 5,180.64 71 1,023 1,265 672Latin America, Tropical 10,561.95 13 97 250 212Latin America, Central 7,819.41 13 135 210 167Asia, Southeast 2,732.69 50 432 544 281Asia, Central 3,609.36 5 61 69 54Latin America, Andean 4,228.81 4 32 46 46North Africa/Middle East 6,919.93 33 297 257 287Caribbean 4,753.69 2 23 21 39Asia, South 1,227.88 129 1,413 943 1,015Oceania 1,788.10 1 6 2 3Sub-Saharan, Africa Southern 5,747.58 4 52 34 38Sub-Saharan, Africa East 658.98 32 206 292 128Sub-Saharan, Africa Central 1,361.21 9 60 48 32Sub-Saharan, Africa West 1,053.29 29 187 129 83
DALY, disability-adjusted life year; GDP, gross domestic product.
Table 2. Estimated Worldwide Dental Expenditures: 2010.
Super-region: Region US$ Billion
Southeast Asia, East Asia, and Oceania 5.79 Asia, East 5.02 Asia, Southeast 0.75 Oceania 0.02Central Europe, Eastern Europe, and Central Asia 9.32 Asia, Central 0.45 Europe, Central 2.75 Europe, Eastern 6.12High Income 244.40 Asia Pacific, High Income 23.30 Australasia 7.03 Europe, Western 91.05 Latin America, Southern 2.93 North America, High Income 120.08Latin America and Caribbean 14.06 Caribbean 0.59 Latin America, Andean 0.76 Latin America, Central 5.79 Latin America, Tropical 6.92North Africa/Middle East 8.33Asia, South 12.84Sub-Saharan Africa 2.96 Sub-Saharan, Africa Central 0.01 Sub-Saharan, Africa East 0.20 Sub-Saharan, Africa Southern 2.70 Sub-Saharan, Africa West 0.04Global 297.67
at Universitas Gadjah Mada on February 17, 2016 For personal use only. No other uses without permission.jdr.sagepub.comDownloaded from
© International & American Associations for Dental Research 2015

6 Journal of Dental Research
standardization, and reporting of dental expenditures. In the absence of more comprehensive information, estimates of global expenditure are at risk of substantial upward or down-ward bias. Moreover, it is important to appreciate that without appropriate detail on coding the direct costs, figures cannot distinguish between the percentage of the economic burden aimed toward different treatment categories (e.g., disease avoidance [checkup, diagnosis, prevention]) and interventive treatment of dental disease (restorative, periodontal, and optional cosmetic care [tooth whitening]). For estimation of indirect costs, it was assumed that each DALY can be valued at 1 y of per capita GDP. In addition to limitations implied by the concept of DALYs themselves (Anand and Hanson 1997), the economic value of DALYs is affected by the size of per capita GDP of the various regions examined. Prioritization of health policies to improve oral health according to regions with high estimated economic impacts may impose risks of neglecting regions and countries with comparably small GDPs. Nevertheless, the results of the present study may serve as informative approximation of global economic impacts of oral diseases.
The present study emphasizes the urgent need to increase the availability of internationally comparable data on dental treatment costs, disease-specific absenteeism from work and school, as well as intangible costs of oral diseases in terms of quality of life. While in principle there are a number of suitable
approaches available to estimate the economic burden of a spe-cific disease, these have been rarely applied (Cancer Society 2010). In this regard, oral health is no exception. Data relevant to comprehensively assess the full magnitude of direct and indirect costs of dental and oral diseases still seem very sparse.
ConclusionWithin the limitations of currently available data sources and thus still restricted methodologies to estimate the full costs of oral diseases, the findings of the present study suggest that the global economic burden of dental diseases amounted to $442B in 2010, of which $298B was attributable to direct treatment costs and $144B to indirect costs in terms of productivity losses due to caries, periodontitis, and tooth loss. The actual burden and cost of oral conditions are likely to be much higher as dental conditions such as oral cancer dysplasias of the oral mucosa, oral infections, oral developmental disorders (e.g., clefts of the lip and palate) and noma could not pertinently be included in this study. Further research on the cost of oral con-ditions should include all oral conditions, rather than be restricted to the most common dental conditions. Improvements in population oral health may imply substantial economic ben-efits not only in terms of reduced treatment costs but also because of fewer productivity losses in the labor market.
Table 3. Estimated Productivity Losses due to Untreated Caries, Severe Periodontitis, and Severe Tooth Loss (US$ Million): 2010.
Untreated Caries Teeth Severe
Super-region: Region Deciduous Permanent Periodontitis Tooth Loss Total
Southeast Asia, East Asia, and Oceania Asia, East 367.83 5,299.79 6,553.51 3,481.39 15,702.51 Asia, Southeast 136.63 1,180.52 1,486.59 767.89 3,571.63 Oceania 1.78 10.73 3.58 5.36 21.46Central and Eastern Europe and Central Asia Asia, Central 18.05 220.17 249.05 194.91 682.17 Europe, Central 43.81 1,270.41 1,456.59 1,533.25 4,304.05 Europe, Eastern 58.99 1,542.14 2,233.16 2,334.28 6,168.58High Income Asia Pacific, High Income 110.55 1,289.70 5,490.43 6,927.52 13,818.20 Australasia 0 207.24 1,813.34 1,761.53 3,782.10 Europe, Western 232.63 4,419.92 15,159.54 21,169.07 40,981.16 Latin America, Southern 10.05 200.95 954.52 602.86 1,768.38 North America, High Income 374.44 2,667.89 10,484.33 16,662.60 30,189.25Latin America and Caribbean Caribbean 9.51 109.33 99.83 185.39 404.06 Latin America, Andean 16.92 135.32 194.53 194.53 541.29 Latin America, Central 101.65 1,055.62 1,642.08 1,305.84 4,105.19 Latin America, Tropical 137.31 1,024.51 2,640.49 2,239.13 6,041.43 North Africa/Middle East 228.36 2,055.22 1,778.42 1,986.02 6,048.02 Asia, South 158.40 1,734.99 1,157.89 1,246.30 4,297.58Sub-Saharan Africa Sub-Saharan, Africa Central 12.25 81.67 65.34 43.56 202.82 Sub-Saharan, Africa East 21.09 135.75 192.42 84.35 433.61 Sub-Saharan, Africa Southern 22.99 298.87 195.42 218.41 735.69 Sub-Saharan, Africa West 30.55 196.97 135.88 87.42 450.81Global 2,093.76 25,137.72 53,986.91 63,031.61 144,249.97
at Universitas Gadjah Mada on February 17, 2016 For personal use only. No other uses without permission.jdr.sagepub.comDownloaded from
© International & American Associations for Dental Research 2015
Global Economic Impact of Dental Diseases 7
Author Contributions
S. Listl, W. Marcenes, contributed to conception, design, data acquisition, analysis, and interpretation, drafted the manuscript; J. Galloway, contributed to conception, design, data acquisition, and analysis, critically revised the manuscript; P.A. Mossey, contrib-uted to conception, design, data acquisition, analysis, and interpre-tation, critically revised the manuscript. All authors gave final approval and agree to be accountable for all aspects of the work.
Acknowledgments
This study was performed under the auspices of the Global Oral Health Inequalities Research Agenda of the International Association for Dental Research (IADR-GOHIRA®). Early results of this work were presented at the Satellite Workshop “Oral Health Inequalities: Translating Research into Public Health Strategies and Action” during the IADR Pan European Region Conference 2014. The authors thank David Williams, Richard Watt, Georgios Tsakos, Helen Whelton, Lone Schou, Jimmy Steele, and Christopher Fox for helpful comments. All authors were funded by their own institutions to perform all work relating to the present study. The authors declare no potential conflicts of interest with respect to the authorship and/or publication of this article.
ReferencesAnand S, Hanson K. 1997. Disability-adjusted life years: a critical review.
J Health Econ. 16(6):685–702.Beaglehole R, Benzian H, Crail J, Mackay J. 2009. The oral health atlas: map-
ping a neglected global health issue. Brighton (UK): Myriad Editions for the FDI World Dental Federation.
Byford S, Torgerson DJ, Raftery J. 2000. Cost of illness studies. BMJ. 320(7245):1335.
Bloom DE, Cafiero ET, Jané-Llopis E, Abrahams-Gessel S, Bloom LR, Fathima S, Feigl AB, Gaziano T, Mowafi M, Pandya A, et al. 2012. The global economic burden of noncommunicable diseases [accessed on 2015 Aug 7]. http://www.hsph.harvard.edu/program-on-the-global-demography-of-aging/WorkingPapers/2012/PGDA_WP_87.pdf.
Cancer Society. 2010. The global economic cost of cancer [accessed on 2015 Aug 7]. http://www.cancer.org/acs/groups/content/@internationalaffairs/documents/document/acspc-026203.pdf.
Glied S, Neidell M. 2010. The economic value of teeth. J Human Resources. 45(2):468–496.
Hayes A, Azarpazhooh A, Dempster L, Ravaghi V, Quiñonez C. 2013. Time loss due to dental problems and treatment in the Canadian population: analysis of a nationwide cross-sectional survey. BMC Oral Health. 13:17.
International Monetary Fund. 2011. World Economic Outlook Database, September 2011 [accessed on 2015 Aug 7]. http://www.imf.org/external/pubs/ft/weo/2011/02/weodata/index.aspx.
Kassebaum NJ, Bernabé E, Dahiya M, Bhandari B, Murray CJ, Marcenes W. 2014. Global burden of severe tooth loss: a systematic review and meta-analysis. J Dent Res. 93(7):20S–28S.
Kassebaum NJ, Bernabé E, Dahiya M, Bhandari B, Murray CJL, Marcenes W. 2015. Global burden of untreated caries: a systematic review and metare-gression. J Dent Res. 94(5):650–658.
Marcenes W, Kassebaum NJ, Bernabé E, Flaxman A, Naghavi M, Lopez A, Murray CJ. 2013. Global burden of oral conditions in 1990–2010: a system-atic analysis. J Dent Res. 92(7):592–597.
Mossey PA, Petersen PE. 2014. Budapest Declaration: IADR-GOHIRA®. J Dent Res. 93(7):120S-121S.
Murray CJ, Ezzati M, Flaxman AD, Lim S, Lozano R, Michaud C, Naghavi M, Salomon JA, Shibuya K, Vos T, et al. 2012. GBD 2010: design, definitions, and metrics. Lancet. 380(9859):2063–2066.
Organisation for Economic Co-operation and Development. 2000. A System of Health Accounts—version 1.0 [accessed on 2015 Aug 7]. http://www.oecd.org/health/health-systems/21160591.pdf.
Organisation for Economic Co-operation and Development. 2013. Health at a glance 2013: OECD indicators [accessed on 2015 Aug 7]. http://dx.doi.org/10.1787/health_glance-2013-en.
Patel R. 2012. The state of oral health in Europe [accessed on 2015 Aug 7]. http://www.mah.se/PageFiles/49503/Report%20-%20the%20State%20of%20Oral%20Health%20in%20Europe.pdf.
Petersen PE. 2003. The World Oral Health report 2003: continuous improve-ment of oral health in the 21st century—the approach of the WHO Global Oral Health Programme. Community Dent Oral Epidemiol. 31 Suppl 1:3–23.
Rice DP. 1967. Estimating the cost of illness. Am J Public Health Nations Health. 57(3):424–440.
United Nations. 2015. UN data [accessed on 2015 Aug 7]. https://data.un.org/Default.aspx.
Wall T, Nasseh K, Vujicic M. 2014. US dental spending remains flat through 2012 [accessed on 2015 Aug 7]. http://www.ada.org/~/media/ADA/Science%20and%20Research/HPI/Files/HPIBrief_0114_1.ashx.
World Health Organization. 2001. Macroeconomics and health: investing in health for economic development [accessed on 2015 Aug 7]. http://www.who.int/macrohealth/en/.
World Health Organization. 2012. Spending on health: a global overview [accessed on 2015 Aug 7]. http://www.who.int/mediacentre/factsheets/fs319/en/.
at Universitas Gadjah Mada on February 17, 2016 For personal use only. No other uses without permission.jdr.sagepub.comDownloaded from
© International & American Associations for Dental Research 2015