global competitiveness report - deloitte · global competitiveness report benchmarking against the...
TRANSCRIPT

Analysis based on the 2015-16 EditionThomas Andersson and Tom Pernodd
Global Competitiveness ReportBenchmarking against the World
with selected rankings for Sweden
Global Competitiveness Report
World Economic Forum har i mer än 30 år haft en betydelsefull roll i att presentera undersökningar och rapporter om produktivitet och konkurrenskraft i länder världen över. Rapporten bidrar till att förstå de viktigaste faktorerna som ligger bakom ekonomisk tillväxt och att förklara varför vissa länder är mer framgångsrika än andra vad gäller konkurrenskraft och politiskt och ekonomiskt reformarbete.
I år har 140 länder deltagit i undersökningen som omfattar både officiell statistik och analys av en enkät till beslutsfattare i näringslivet i respektive land. World EconomicForum analyserar 12 pelare för tillväxt avseende infrastruktur, institutioner, makroekonomiska faktorer, grundutbildning & hälsa, högre utbildning, arbetsmarknad, handel, teknologi, finansiella marknader, marknadsstorlek, innovation och affärsnätverk.
I Sverige har IUET (International University of Entrepreneurship and TechnologyAssociation) och Deloitte ansvarat för genomförandet av enkäten.
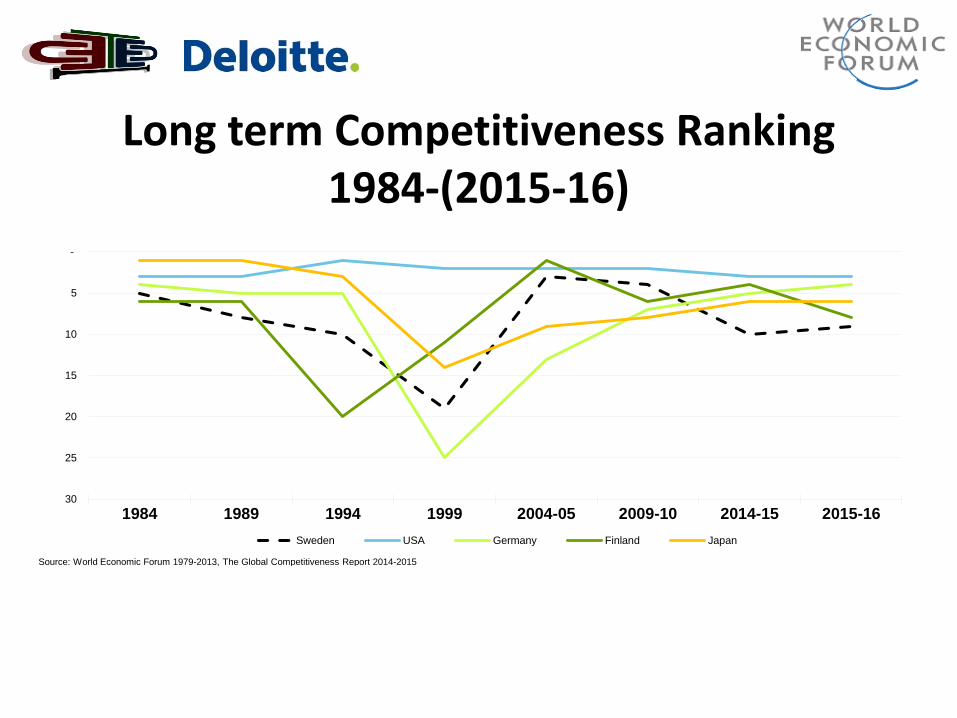
Long term Competitiveness Ranking1984-(2015-16)
-
5
10
15
20
25
30
1984 1989 1994 1999 2004-05 2009-10 2014-15 2015-16
Sweden USA Germany Finland Japan
Source: World Economic Forum 1979-2013, The Global Competitiveness Report 2014-2015
4
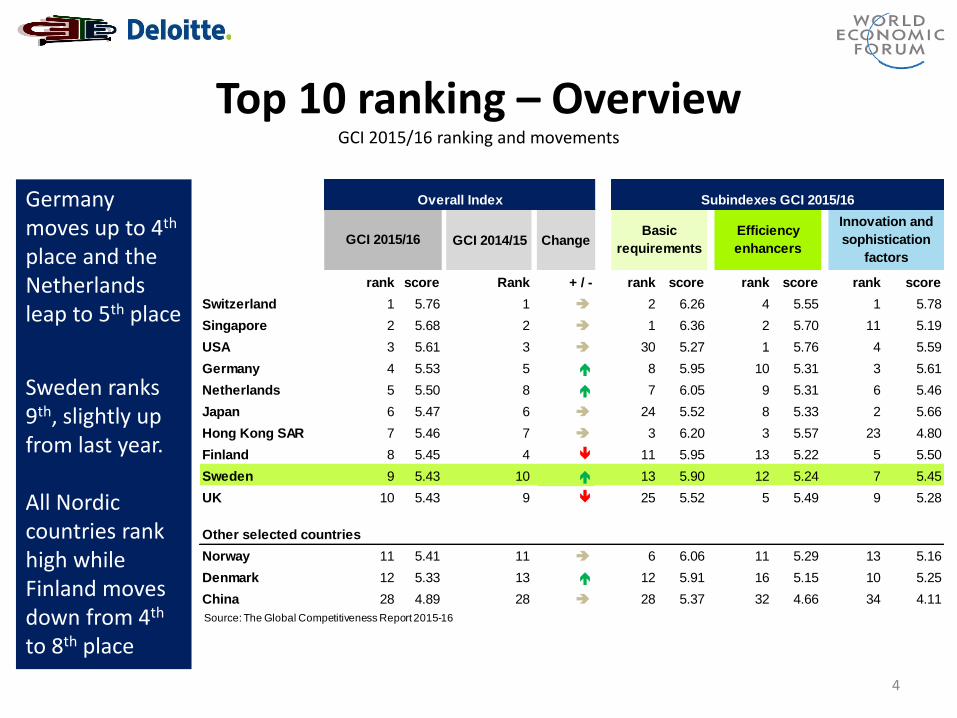
Germany moves up to 4th
place and the Netherlands leap to 5th place
Sweden ranks 9th, slightly up from last year.
All Nordic countries rank high while Finland moves down from 4th
to 8th place
Top 10 ranking – OverviewGCI 2015/16 ranking and movements
GCI 2014/15 Change
rank score Rank + / - rank score rank score rank score
Switzerland 1 5.76 1 2 6.26 4 5.55 1 5.78
Singapore 2 5.68 2 1 6.36 2 5.70 11 5.19
USA 3 5.61 3 30 5.27 1 5.76 4 5.59
Germany 4 5.53 5 8 5.95 10 5.31 3 5.61
Netherlands 5 5.50 8 7 6.05 9 5.31 6 5.46
Japan 6 5.47 6 24 5.52 8 5.33 2 5.66
Hong Kong SAR 7 5.46 7 3 6.20 3 5.57 23 4.80
Finland 8 5.45 4 11 5.95 13 5.22 5 5.50
Sweden 9 5.43 10 13 5.90 12 5.24 7 5.45
UK 10 5.43 9 25 5.52 5 5.49 9 5.28
Other selected countries
Norway 11 5.41 11 6 6.06 11 5.29 13 5.16
Denmark 12 5.33 13 12 5.91 16 5.15 10 5.25
China 28 4.89 28 28 5.37 32 4.66 34 4.11
Overall Index Subindexes GCI 2015/16
GCI 2015/16Basic
requirements
Efficiency
enhancers
Innovation and
sophistication
factors
Source: The Global Competitiveness Report 2015-16

5
Innovation, Business sophistication & Technological readiness are the core strong-holds of Sweden’s competitive-ness
Sweden rank by pillarGCI 2015/16 ranking and movements
Sweden Pillar
Rank by Pillar of Competitiveness 2013/14 2014/15 2015/16 Rank
5 13 11
20 22 20
14 17 17
13 23 20
Higher Education and training 8 14 12
Goods market efficiency 12 17 17
Labour market efficiency 18 20 20
Financial market development 8 12 14
Technological readiness 1 3 4
Market size 35 36 41
Business Sophistication 7 8 7
Innovation 6 7 7
Overall GCI Rank Sweden #9
#12
#7
Institutions
Infrastructure
Macroeconomic environment
Health and primary education
#13

Infrastructure and Macroeconomics (selected country rankings 2015(14))
Index Rank Sweden Finland Germany US Japan Singapore China
Overall quality 19(18) 6 11 13 7 4 51
Quality of air transport
infrastructure 22(21) 9 11 5 25 1 51
Quality of electricity
supply 15(22) 6 20 16 21 3 53
Budget balance 52(36) 65 13 114 132 6 34
Government debt 67(68) 96 113 129 140 127 66
Credit rating3(5) 10 4 5 19 7 26
Source: The Global Competitiveness Report, 2015-16

Health and Education(selected country rankings 2015(14))
Index Rank Sweden Finland Germany US Japan Singapore China
Life expectancy 12(10) 22 18 34 2 6 53
Quality of primary
education 34(38) 1 19 29 7 3 55
Secondary education
enrollment rate 41(40) 16 27 61 24 17 74
Tertiary education
enrollment rate 26(27) 4 38 3 40 9 83
Quality of the
educational system 25(26) 4 10 18 27 3 56
Quality of Math and
Science education43(49) 2 16 44 9 1 49
Extent of staff training8(10) 10 13 14 6 4 50
Source: The Global Competitiveness Report, 2015-16

Labour Market(selected country rankings 2015(14))
Index Rank Sweden Finland Germany US Japan Singapore China
Cooperation in labour-
employer relations7(17) 22 20 31 5 3 62
Flexibility of wage
determination133(134) 140 132 19 7 6 73
Hiring and firing
practices106(100) 87 107 10 123 4 17
Redundancy costs,
weeks of salary61(66) 34 97 1 7 5 117
Pay and productivity 44(88) 42 13 8 14 3 20
Effect of taxation on
incentives to work 94(30) 109 95 35 38 3 58
Country capacity to
attract talent 25(26) 61 19 6 78 2 27
Source: The Global Competitiveness Report, 2015-16

Index Rank Sweden Finland Germany US Japan Singapore China
Intensity of Local
competition33(41) 89 7 4 1 21 36
Extent of market
dominance20(22) 51 3 11 2 13 28
Effectiveness of anti-
monopoly policy9(10) 4 14 10 3 5 36
Effect of taxation on
incentives to invest62(28) 70 54 35 49 5 50
Total tax rate, % profits 112(119) 81 107 95 114 10 128
Foreign market size
index40(36) 63 4 2 6 9 1
Source: The Global Competitiveness Report, 2015-16
Goods Market Efficiency and Market Size(selected country rankings 2015(14))

23,2%
21,8%
9,7%
6,9%
6,9%
6,8%
6,5%
6,4%
5,1%
3,0%
2,2%
1,0%
0,2%
0,0%
- 5% 10% 15% 20% 25% 30%
Restrictive labour regulations
Tax rates
Tax regulations
Insufficient capacity to innovate
Inadequate supply of infrastructure
Inadequately educated workforce
Access to financing
Policy instability
Inefficient government bureaucracy
Government instability/coups
Poor work ethic in national labour force
Inflation
Foreign currency regulation
Corruption
Sweden
The most problematic factors for doing business
Source: The Global Competitiveness Report 2015-16

23,2%
21,8%
9,7%
6,9%
6,9%
6,8%
6,5%
6,4%
5,1%
3,0%
2,2%
1,0%
0,2%
0,0%
14,4%
15,1%
16,8%
5,9%
2,8%
7,6%
8,9%
1,6%
16,0%
0,1%
4,7%
0,8%
1,6%
1,5%
- 5% 10% 15% 20% 25% 30%
Restrictive labour regulations
Tax rates
Tax regulations
Insufficient capacity to innovate
Inadequate supply of infrastructure
Inadequately educated workforce
Access to financing
Policy instability
Inefficient government bureaucracy
Government instability/coups
Poor work ethic in national labour force
Inflation
Foreign currency regulation
Corruption
Sweden Germany
The most problematic factors for doing business
Source: The Global Competitiveness Report 2015-16

23,2%
21,8%
9,7%
6,9%
6,9%
6,8%
6,5%
6,4%
5,1%
3,0%
2,2%
1,0%
0,2%
0,0%
9,7%
14,0%
12,5%
5,5%
5,3%
8,6%
6,7%
5,2%
13,7%
1,2%
7,0%
3,5%
3,3%
1,0%
- 5% 10% 15% 20% 25% 30%
Restrictive labour regulations
Tax rates
Tax regulations
Insufficient capacity to innovate
Inadequate supply of infrastructure
Inadequately educated workforce
Access to financing
Policy instability
Inefficient government bureaucracy
Government instability/coups
Poor work ethic in national labour force
Inflation
Foreign currency regulation
Corruption
Sweden USA
The most problematic factors for doing business
Source: The Global Competitiveness Report 2015-16

23,2%
21,8%
9,7%
6,9%
6,9%
6,8%
6,5%
6,4%
5,1%
3,0%
2,2%
1,0%
0,2%
0,0%
19,2%
25,1%
11,9%
16,4%
1,4%
2,8%
2,0%
6,0%
12,1%
1,4%
0,4%
0,3%
0,5%
0,0%
- 5% 10% 15% 20% 25% 30%
Restrictive labour regulations
Tax rates
Tax regulations
Insufficient capacity to innovate
Inadequate supply of infrastructure
Inadequately educated workforce
Access to financing
Policy instability
Inefficient government bureaucracy
Government instability/coups
Poor work ethic in national labour force
Inflation
Foreign currency regulation
Corruption
Sweden Japan
The most problematic factors for doing business
Source: The Global Competitiveness Report 2015-16

23,2%
21,8%
9,7%
6,9%
6,9%
6,8%
6,5%
6,4%
5,1%
3,0%
2,2%
1,0%
0,2%
0,0%
3,7%
8,5%
6,7%
12,5%
9,0%
4,0%
11,6%
8,1%
9,2%
3,1%
4,3%
5,8%
3,6%
8,3%
- 5% 10% 15% 20% 25% 30%
Restrictive labour regulations
Tax rates
Tax regulations
Insufficient capacity to innovate
Inadequate supply of infrastructure
Inadequately educated workforce
Access to financing
Policy instability
Inefficient government bureaucracy
Government instability/coups
Poor work ethic in national labour force
Inflation
Foreign currency regulation
Corruption
Sweden China
The most problematic factors for doing business
Source: The Global Competitiveness Report 2015-16

Overall Score – Country ComparisonFive year GCI score comparison
Finland (#8)Slightly negative trend since 2012/13 and falls to #8 in 2015/16
Decrease across all sub-indexes but remains #1 in institutions and health & primary education
Germany (#4)Positive turnaround exceeding previous 2013/14 levels
Slight increase in ranking of basic requirements from #11 to #8
USA (#3)Positive trend since 2011/12
Rank #1 in efficiency enhancers
Macroeconomic environment improving but still a weak spot
Sweden (#9)Move up to #9 with slightly higher score in innovation and sophistication
Innovation and sophistication remains stronghold
UK (#10)Move down from #9to #10 in 2015/16 but score same as Sweden
Efficiency enhancers decrease while basic requirements increased slightly
Norway (#11)GCI score continues to improve but Norway remains at #11
Ranks #1 in macroeconomic environment
Denmark (#12)Positive trend from 2014/15 has continued resulting in an increase to #12 in the rankings
Small improvements across all key areas during 2015/16
5,43
5,47
5,415,39
5,61
5,18
5,4
5,47
5,55
5,485,45
5,53
5,275,29
5,48
5,545,51
5,37
5,48
5,33
5,18
5,54
5,50 5,49
5,41 5,41
5,35
5,29
5,61
5,45
5,53
5,43 5,435,41
5,33
5
5
5
6
6
USA Finland Germany UK Sweden Norway Denmark
Total GCI - Score
2011/12 2012/13 2013/14 2014/15 2015/16
Source: The Global Competitiveness Report 2015-16
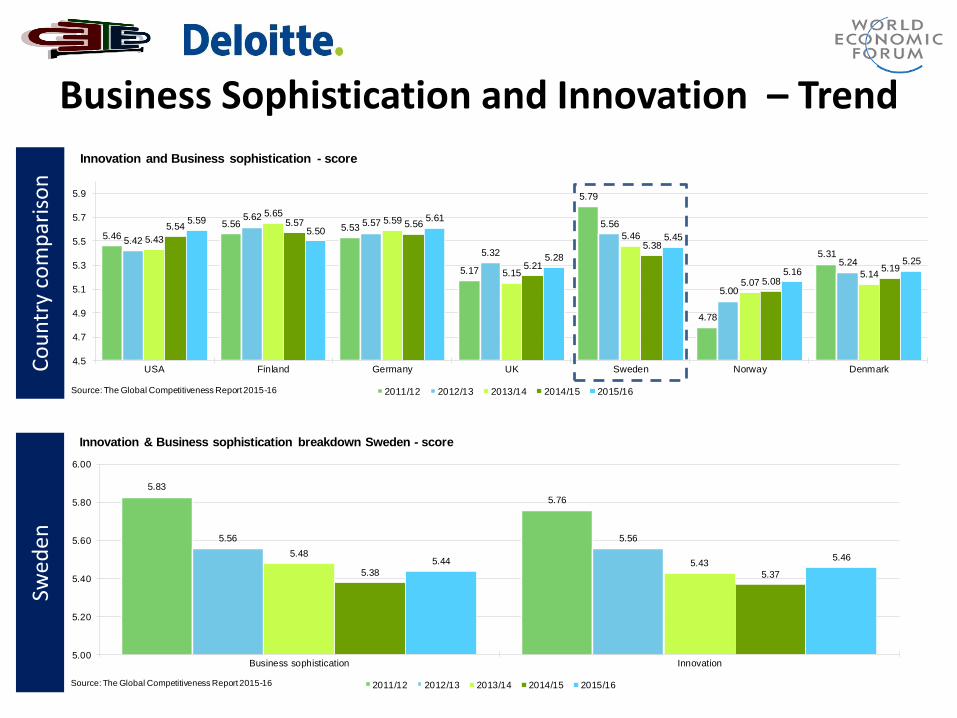
5.46
5.56 5.53
5.17
5.79
4.78
5.31
5.42
5.625.57
5.32
5.56
5.00
5.24
5.43
5.655.59
5.15
5.46
5.075.14
5.54 5.57 5.56
5.21
5.38
5.08
5.19
5.595.50
5.61
5.28
5.45
5.165.25
4.5
4.7
4.9
5.1
5.3
5.5
5.7
5.9
USA Finland Germany UK Sweden Norway Denmark
Innovation and Business sophistication - score
2011/12 2012/13 2013/14 2014/15 2015/16Source: The Global Competitiveness Report 2015-16
16
Business Sophistication and Innovation – Trend
Co
un
try
com
par
iso
nSw
eden
5.83
5.76
5.56 5.56
5.485.43
5.38 5.37
5.44 5.46
5.00
5.20
5.40
5.60
5.80
6.00
Business sophistication Innovation
Innovation & Business sophistication breakdown Sweden - score
2011/12 2012/13 2013/14 2014/15 2015/16Source: The Global Competitiveness Report 2015-16

43
8
19
12
6
149
52
54
10
2015
710 8 6 4
59
9
19
11
4
105
84
0
10
20
30
40
50
60
70
Local supplier
quantity Local supplier quality
State of cluster
development
Nature of competitive
advantage Value chain breadth
Control of
international
distribution
Production process
sophistication Extent of marketing
Willingness to
delegate authority
Business sophistication breakdown Sweden - rank
2013/14 2014/15 2015/16Source: The Global Competitiveness Report 2015-16
17
Business Sophistication – Sweden
Inn
ova
tio
n in
dic
ato
rsSw
eden
-co
mm
en
tary
Business sophistication• Business sophistication remains a stronghold for Sweden across most
indicators with an overall stable or positive development in 2015/16. • Local supplier quantity score has continued to decrease in 2015/16 leading to
a fall in rank from #43 to #59 over the past two years.

7
15
7
10
22
10
1
6
14
6
11
26
19
34
11
7
11
23
14
3
0
5
10
15
20
25
30
Capacity for innovation
Quality of scientific
research institutions
Company spending on
R&D
University-industry
collaboration in R&D
Government procurement
of advanced technology
products
Availability of scientists and
engineers PCT patent applications
Innovation breakdown Sweden - rank
2013/14 2014/15 2015/16Source: The Global Competitiveness Report 2015-16
18
Innovation – Sweden
Inn
ova
tio
n in
dic
ato
rsSw
eden
-co
mm
en
tary
Innovation • Overall, Sweden ranks #7 in innovation and continues to achieve strong scores
in several indicators of innovation in 2015/16. • Rankings for the quality of scientific research institutions, availability of
scientists and engineers and capacity for innovation have all improved slightly in 2015/16.