gettingstarted - autodeskdownload.autodesk.com/us/civil3d/learningpath/2009/civil... ·...
TRANSCRIPT

AutoCAD Civil 3D 2009
Getting Started
April 2008237A1-050000-PM01A

© 2008 Autodesk, Inc. All Rights Reserved. Except as otherwise permitted by Autodesk, Inc., this publication, or parts thereof, may not bereproduced in any form, by any method, for any purpose. Certain materials included in this publication are reprinted with the permission of the copyright holder.
TrademarksThe following are registered trademarks or trademarks of Autodesk, Inc., in the USA and other countries: 3DEC (design/logo), 3December,3December.com, 3ds Max, ActiveShapes, Actrix, ADI, Alias, Alias (swirl design/logo), AliasStudio, Alias|Wavefront (design/logo), ATC, AUGI,AutoCAD, AutoCAD Learning Assistance, AutoCAD LT, AutoCAD Simulator, AutoCAD SQL Extension, AutoCAD SQL Interface, Autodesk, AutodeskEnvision, Autodesk Insight, Autodesk Intent, Autodesk Inventor, Autodesk Map, Autodesk MapGuide, Autodesk Streamline, AutoLISP, AutoSnap,AutoSketch, AutoTrack, Backdraft, Built with ObjectARX (logo), Burn, Buzzsaw, CAiCE, Can You Imagine, Character Studio, Cinestream, Civil3D, Cleaner, Cleaner Central, ClearScale, Colour Warper, Combustion, Communication Specification, Constructware, Content Explorer,Create>what's>Next> (design/logo), Dancing Baby (image), DesignCenter, Design Doctor, Designer's Toolkit, DesignKids, DesignProf, DesignServer,DesignStudio, Design|Studio (design/logo), Design Your World, Design Your World (design/logo), DWF, DWG, DWG (logo), DWG TrueConvert,DWG TrueView, DXF, EditDV, Education by Design, Exposure, Extending the Design Team, FBX, Filmbox, FMDesktop, Freewheel, GDX Driver,Gmax, Heads-up Design, Heidi, HOOPS, HumanIK, i-drop, iMOUT, Incinerator, IntroDV, Inventor, Inventor LT, Kaydara, Kaydara (design/logo),LocationLogic, Lustre, Maya, Mechanical Desktop, MotionBuilder, Mudbox, NavisWorks, ObjectARX, ObjectDBX, Open Reality, Opticore,Opticore Opus, PolarSnap, PortfolioWall, Powered with Autodesk Technology, Productstream, ProjectPoint, ProMaterials, Reactor, RealDWG,Real-time Roto, Recognize, Render Queue, Reveal, Revit, Showcase, ShowMotion, SketchBook, SteeringWheels, StudioTools, Topobase, Toxik,ViewCube, Visual, Visual Bridge, Visual Construction, Visual Drainage, Visual Hydro, Visual Landscape, Visual Roads, Visual Survey, Visual Syllabus,Visual Toolbox, Visual Tugboat, Visual LISP, Voice Reality, Volo, Wiretap, and WiretapCentral The following are registered trademarks or trademarks of Autodesk Canada Co. in the USA and/or Canada and other countries: Backburner,Discreet, Fire, Flame, Flint, Frost, Inferno, Multi-Master Editing, River, Smoke, Sparks, Stone, and Wire All other brand names, product names or trademarks belong to their respective holders.
DisclaimerTHIS PUBLICATION AND THE INFORMATION CONTAINED HEREIN IS MADE AVAILABLE BY AUTODESK, INC. "AS IS." AUTODESK, INC. DISCLAIMSALL WARRANTIES, EITHER EXPRESS OR IMPLIED, INCLUDING BUT NOT LIMITED TO ANY IMPLIED WARRANTIES OF MERCHANTABILITY ORFITNESS FOR A PARTICULAR PURPOSE REGARDING THESE MATERIALS.
Published By: Autodesk, Inc.111 Mclnnis ParkwaySan Rafael, CA 94903, USA

Contents
Chapter 1 Introduction . . . . . . . . . . . . . . . . . . . . . . . . . . . . 1Installation . . . . . . . . . . . . . . . . . . . . . . . . . . . . . . . . . 1
Installing on a Single Computer . . . . . . . . . . . . . . . . . . . 1Installing on a Network . . . . . . . . . . . . . . . . . . . . . . . 2
Highlights of AutoCAD Civil 3D . . . . . . . . . . . . . . . . . . . . . . 2What’s New in AutoCAD Civil 3D 2009 . . . . . . . . . . . . . . . 2
Project Management . . . . . . . . . . . . . . . . . . . . . . 2Survey . . . . . . . . . . . . . . . . . . . . . . . . . . . . . . 2Pipe Networks . . . . . . . . . . . . . . . . . . . . . . . . . 3Labels . . . . . . . . . . . . . . . . . . . . . . . . . . . . . . 3Surfaces . . . . . . . . . . . . . . . . . . . . . . . . . . . . . 3Grading . . . . . . . . . . . . . . . . . . . . . . . . . . . . . 3Alignments . . . . . . . . . . . . . . . . . . . . . . . . . . . 4Profiles . . . . . . . . . . . . . . . . . . . . . . . . . . . . . 4Corridors . . . . . . . . . . . . . . . . . . . . . . . . . . . . 4Mass Haul . . . . . . . . . . . . . . . . . . . . . . . . . . . . 4Google Earth . . . . . . . . . . . . . . . . . . . . . . . . . . 4Hydraulics and Hydrology . . . . . . . . . . . . . . . . . . . 5
Sample Data Provided with the Program . . . . . . . . . . . . . . . . . . 5Tutorial Drawing Files . . . . . . . . . . . . . . . . . . . . . . . . 5Getting Started Guide Drawing Files . . . . . . . . . . . . . . . . . 5Best Practices Guide Drawing Files . . . . . . . . . . . . . . . . . . 5Sample Drawing Templates . . . . . . . . . . . . . . . . . . . . . . 6
Learning How to Use AutoCAD Civil 3D . . . . . . . . . . . . . . . . . . 6
iii

Getting Started Guide . . . . . . . . . . . . . . . . . . . . . . . . 6Online Tutorials . . . . . . . . . . . . . . . . . . . . . . . . . . . 7Help System . . . . . . . . . . . . . . . . . . . . . . . . . . . . . . 7Civil 3D Best Practices Guide . . . . . . . . . . . . . . . . . . . . . 7Moving from Land Desktop to Civil 3D Guide . . . . . . . . . . . 7Skill Builders . . . . . . . . . . . . . . . . . . . . . . . . . . . . . 8
Autodesk Training Programs and Products . . . . . . . . . . . . . . . . . 8
Chapter 2 Designing with Objects . . . . . . . . . . . . . . . . . . . . . . 11Object Model . . . . . . . . . . . . . . . . . . . . . . . . . . . . . . . 11
Object Relationships . . . . . . . . . . . . . . . . . . . . . . . . 13Object Interface . . . . . . . . . . . . . . . . . . . . . . . . . . . . . . 15
Toolspace for Object Management . . . . . . . . . . . . . . . . . 16Prospector Tab . . . . . . . . . . . . . . . . . . . . . . . . . 16Settings Tab . . . . . . . . . . . . . . . . . . . . . . . . . . 18Survey Tab . . . . . . . . . . . . . . . . . . . . . . . . . . . 19Toolbox Tab . . . . . . . . . . . . . . . . . . . . . . . . . . 20
Menu Standardization . . . . . . . . . . . . . . . . . . . . . . . . 21Shortcut Menus . . . . . . . . . . . . . . . . . . . . . . . . . . . 24Layout Tools . . . . . . . . . . . . . . . . . . . . . . . . . . . . . 25Consistent Editing Methods . . . . . . . . . . . . . . . . . . . . 25
Item View . . . . . . . . . . . . . . . . . . . . . . . . . . . 25Grips . . . . . . . . . . . . . . . . . . . . . . . . . . . . . . 26Panorama Window . . . . . . . . . . . . . . . . . . . . . . 27Property Editors . . . . . . . . . . . . . . . . . . . . . . . . 28AutoCAD Properties Editor . . . . . . . . . . . . . . . . . . 29
Exercise: Familiarization Tour . . . . . . . . . . . . . . . . . . . . 31Standard Controls for Styles and Labels . . . . . . . . . . . . . . . . . 33Precision Layout Strategies . . . . . . . . . . . . . . . . . . . . . . . . 35Object Building Blocks . . . . . . . . . . . . . . . . . . . . . . . . . . 35
Corridors . . . . . . . . . . . . . . . . . . . . . . . . . . . . . . 36Pipe Networks . . . . . . . . . . . . . . . . . . . . . . . . . . . . 37
Chapter 3 Using Styles and Settings . . . . . . . . . . . . . . . . . . . . . 39Managing Styles . . . . . . . . . . . . . . . . . . . . . . . . . . . . . . 39Types of Styles . . . . . . . . . . . . . . . . . . . . . . . . . . . . . . . 41
Object Styles . . . . . . . . . . . . . . . . . . . . . . . . . . . . . 41Label Styles . . . . . . . . . . . . . . . . . . . . . . . . . . . . . 43
Managing Label Styles . . . . . . . . . . . . . . . . . . . . 46Table Styles . . . . . . . . . . . . . . . . . . . . . . . . . . . . . 48Table Tags . . . . . . . . . . . . . . . . . . . . . . . . . . . . . . 48Band Styles . . . . . . . . . . . . . . . . . . . . . . . . . . . . . 49Profile and Section View Styles . . . . . . . . . . . . . . . . . . . 50
Using Styles with Layers . . . . . . . . . . . . . . . . . . . . . . . . . . 51Label Objects . . . . . . . . . . . . . . . . . . . . . . . . . . . . . . . 54
iv | Contents

Table Creation and Label Types . . . . . . . . . . . . . . . . . . . . . . 54Object Settings . . . . . . . . . . . . . . . . . . . . . . . . . . . . . . 55Exercise: Object and Label Styles . . . . . . . . . . . . . . . . . . . . . 57
Chapter 4 Designing Drawing Standards . . . . . . . . . . . . . . . . . . 61Creating Templates . . . . . . . . . . . . . . . . . . . . . . . . . . . . 61
Drawing Settings . . . . . . . . . . . . . . . . . . . . . . . . . . 63Layer Standards . . . . . . . . . . . . . . . . . . . . . . . . . . . 64Object Styles . . . . . . . . . . . . . . . . . . . . . . . . . . . . . 65Label Styles . . . . . . . . . . . . . . . . . . . . . . . . . . . . . 65
Plan Production Tools . . . . . . . . . . . . . . . . . . . . . . . . . . . 66Enhancing Drawings with Visualization Tools . . . . . . . . . . . . . . 66Exercise: Drawing Settings . . . . . . . . . . . . . . . . . . . . . . . . 67
Chapter 5 Managing Project Data . . . . . . . . . . . . . . . . . . . . . . 69The Collaborative Environment . . . . . . . . . . . . . . . . . . . . . 69Autodesk Vault . . . . . . . . . . . . . . . . . . . . . . . . . . . . . . 69
Access to Autodesk Vault . . . . . . . . . . . . . . . . . . . . . . 71Autodesk Vault Set Up . . . . . . . . . . . . . . . . . . . . . . . 71
Database Projects and Folders . . . . . . . . . . . . . . . . . 71User Accounts and Roles . . . . . . . . . . . . . . . . . . . 72
External References (xrefs) . . . . . . . . . . . . . . . . . . . . . . . . 74Data Shortcuts . . . . . . . . . . . . . . . . . . . . . . . . . . . . . . . 75Exercise: Creating a Data Shortcut . . . . . . . . . . . . . . . . . . . . 77
Chapter 6 Getting Started Exercises . . . . . . . . . . . . . . . . . . . . . 81Points . . . . . . . . . . . . . . . . . . . . . . . . . . . . . . . . . . . 81Surfaces . . . . . . . . . . . . . . . . . . . . . . . . . . . . . . . . . . 86Grading . . . . . . . . . . . . . . . . . . . . . . . . . . . . . . . . . . 90Parcels . . . . . . . . . . . . . . . . . . . . . . . . . . . . . . . . . . . 94Alignments . . . . . . . . . . . . . . . . . . . . . . . . . . . . . . . . 99Profiles . . . . . . . . . . . . . . . . . . . . . . . . . . . . . . . . . . 106Sections . . . . . . . . . . . . . . . . . . . . . . . . . . . . . . . . . . 110Pipe Networks . . . . . . . . . . . . . . . . . . . . . . . . . . . . . . 117Corridors . . . . . . . . . . . . . . . . . . . . . . . . . . . . . . . . . 122Survey . . . . . . . . . . . . . . . . . . . . . . . . . . . . . . . . . . 126Object and Label Styles . . . . . . . . . . . . . . . . . . . . . . . . . 131Visualization . . . . . . . . . . . . . . . . . . . . . . . . . . . . . . . 138Label Objects . . . . . . . . . . . . . . . . . . . . . . . . . . . . . . . 143Plan Production Tools . . . . . . . . . . . . . . . . . . . . . . . . . . 149
Glossary . . . . . . . . . . . . . . . . . . . . . . . . . . . . . 153
Contents | v

Index . . . . . . . . . . . . . . . . . . . . . . . . . . . . . . . 169
vi | Contents

Introduction
AutoCAD® Civil 3D® is a design and drafting program that supports a wide range of civilengineering tasks. The AutoCAD Civil 3D Getting Started guide introduces the program andprovides some initial hands-on experience, using sample data included with the product. Thisfirst chapter contains brief descriptions of the significant features in AutoCAD Civil 3D andprovides advice for AutoCAD Land Desktop users who are learning about AutoCAD Civil 3D.
InstallationYou install AutoCAD Civil 3D using the Installation wizard that opensautomatically when you insert the product media. Using the Installation wizardyou can access several pages of links, from which you can open online versionsof the documentation and locate other information to support the product.
Installing on a Single Computer
To install AutoCAD Civil 3D on a single computer, click the Install Productslink on the first page of the Installation wizard. The Installation wizard provideslinks with answers to common installation questions.
For information about installing AutoCAD Civil 3D on a single computer,consult the Stand-Alone Installation Guide. To access this guide, in the Installationwizard, click the Read the Documentation link, then click Stand-AloneInstallation Guide.
1
1

Installing on a Network
To deploy AutoCAD Civil 3D on a network, click the Create Deployments linkon the Installation wizard. For information about deploying AutoCAD Civil3D on a network, consult the Network Administrator's Guide. To access thisguide, in the Installation wizard, click the Read the Documentation link, andthen click Network Administrator’s Guide.
Highlights of AutoCAD Civil 3DAutoCAD Civil 3D® is designed for land-development professionals, such ascivil engineers, surveyors, engineering technicians, and drafters. Subsequentchapters of this Getting Started guide introduce the objects and styles that arethe main structural features of the application.
What’s New in AutoCAD Civil 3D 2009
This release of AutoCAD Civil 3D includes new features and enhancementsto existing features, as described in the following sections. More details aboutthese enhancements are available in the New Features topic of the Help andin the New Features Workshop.
Project Management
You can access the Data Shortcut commands on the Toolspace Prospector tab.This feature now provides a Data Shortcuts external editor. Also, you can usethe new project export feature, for packing a set of Vault project files into aZIP archive, and a related project import feature, for extracting the files intoanother project environment.
Survey
You can generate Mapcheck reports by selecting labels in the drawing. A newreporting tool highlights observation tolerance errors for angle, distance,elevation, and coordinate values in the Event Viewer vista. The Survey LinkExtension enables you to download data from survey data collectors and
2 | Chapter 1 Introduction

convert raw data into .fbk files. Survey figure editing commands are nowavailable.
Pipe Networks
A new command enables you to select a series of pipes and structures in thedrawing, and then rename or renumber them. You can use a spanning labelfor pipes displayed in a profile. You can use a pipe end cleanup option inprofile views.
Labels
You can now label most AutoCAD Civil 3D objects that are contained withinan Xref. For line, curve, and spiral labels on alignment, parcels, and generalline and curve labels, there are new label anchor points such as start, middle,and end. General line and curve labels can now be included in parcel tables.
Surfaces
You can now reorder surface operations and can weed points to control thenumber of points that are used when creating a surface (TIN). This feature hasbeen enhanced with more intelligent memory management, data restrictionfor improved performance, and point weeding to achieve a simplified surfacewhich results in improved performance for large surfaces.
Grading
You can have dynamic feature lines from alignments,profiles, and corridors.You can name feature lines for easier identification, and can apply styles to aselection set of feature lines. You can prioritize feature line styles to determinesplit point elevations and can create a feature line from the alignmentgeometry. Numerous new feature line commands make it easier to editelevations.
What’s New in AutoCAD Civil 3D 2009 | 3

Alignments
You can associate agency-specific standards during the alignment and profiledesign process to ensure compliance with standards. Additionally, you canuse a new post-design error-checking mechanism, which checks the alignmentand profile geometry for entities that violate the associated standards. Youcan now control label styles for different alignment and profile geometrypoints in order to label these in different ways. You can also labelsuperelevation critical points along an alignment. You can create alignmententities using the best fit tools.
Profiles
You can create stacked profile views and anchor superelevation band labelsto superelevation diagrams. You can associate agency-specified standardsduring the alignment and profile creation process. Also, you can use theerror-checking mechanism which checks for violations of the associatedstandards. You can create profile entities using the best fit tools.
Corridors
You can use survey figures, grading feature lines, polylines, and pipe networksas subassembly targets in a corridor. The View/Edit functionality has beenenhanced.
Mass Haul
A new Mass Haul Diagram wizard is available to generate a mass haul diagramthat remains dynamic in relation to the corridor model.
Google Earth
You can publish render materials on entities for display in Google Earth. Also,you can import elevation data in a current Google Earth view into AutoCADCivil 3D as a mesh.
4 | Chapter 1 Introduction

Hydraulics and Hydrology
Optionally, you can install three new hydraulics and hydrology applicationsfrom the AutoCAD Civil 3D installer. Use the stand-alone applications,Hydraflow Storm Sewers Extension and Hydraflow Hydrographs Extension,for hydraulic analysis and planning. Use the Hydraflow Express Extensionapplication to perform common hydrology tasks, such as designing culvertsand inlets. For more information, click the Help menu in each of theseapplications.
Sample Data Provided with the ProgramTo help you learn how to use AutoCAD Civil 3D and start experimenting withits features, the product media includes sample drawings and data files.
Tutorial Drawing Files
Use these files with the tutorials that are part of the AutoCAD Civil 3D Helpsystem.
After installation, the default location of the files is the following folder:
C:\Program Files\AutoCAD Civil 3D 2009\Help\Civil 3D Tutorials\Drawings
Getting Started Guide Drawing Files
Use these drawing files with the Exercises chapter of this Getting Started guide.There is one file for each feature-specific concept discussed in that chapter.
After installation, the default location of the files is the following folder:
C:\Program Files\AutoCAD Civil 3D 2009\Getting Started Guide
Best Practices Guide Drawing Files
Use these files with the Best Practices guide.
After installation, the default location of the files is the following folder:
Sample Data Provided with the Program | 5

C:\Program Files\AutoCAD Civil 3D 2009\Best Practices Guide
Sample Drawing Templates
AutoCAD Civil 3D also provides several drawing templates that contain samplecontent for settings, styles, and organization of objects. Use these files as abasis for developing your own content.
After installation, the files are located in the same folder as the AutoCADtemplates. To create a file from a template:
1 Click File menu ➤ New.
2 In the Select Template dialog box, select the template you want to use.The AutoCAD Civil 3D templates are at the top of the list, with namessuch as _AutoCAD Civil 3D (Imperial) NCS Base.dwt.
Learning How to Use AutoCAD Civil 3DAutoCAD Civil 3D provides learning materials to get you started using thesoftware and complete documentation to serve as a reference. Userdocumentation for AutoCAD Civil 3D includes:
■ Getting Started guide (this guide)
■ Online tutorials
■ Help system
■ Best Practices guide
■ Moving From Land Desktop to Civil 3D guide
■ Skill Builders
Getting Started Guide
The Getting Started guide introduces important concepts in AutoCAD Civil3D. After reading through it, and doing some of the exercises with the samplefiles provided, you should feel comfortable enough with the application tostart experimenting on your own.
6 | Chapter 1 Introduction

Online Tutorials
Access the online tutorials on the AutoCAD Civil 3D Help menu. The tutorialsoffer an in-depth guided tour of the major features of AutoCAD Civil 3D, usingrealistic engineering drawings and data. For a thorough knowledge of AutoCADCivil 3D, it is recommended that you explore the tutorials after you have readthrough the conceptual information provided in the Getting Started guide.
Help System
The AutoCAD Civil 3D Help system is provided in HTML format with a tableof contents, an index, and a search function. You can print out the Help topicsthat interest you. To print entire sections, you might prefer to work from thePDF version of the Help system. By default, this document is available at thefollowing location:
C:\Program Files\AutoCAD Civil 3D 2009\Help\civil_ug.pdf
Use the Search tab in the Help to find topics that contain a particular wordor phrase. For the best results when searching for a phrase, enclose the wordsin quotation marks, for example, “Quantity Takeoff.” Search results appearin the left pane. The Help system home page lists topics by classifying themby task, by feature, and by job role. The home page also includes links to theLearning Resources page, the Workflow topics, the New Features Workshop,Tutorials, the Best Practices guide, and the Moving from Land Desktop to Civil3D guide.
Civil 3D Best Practices Guide
The new AutoCAD Civil 3D Best Practices guide provides best practicesinformation to help you optimize your use of AutoCAD Civil 3D. This guideincludes chapters for aspects of AutoCAD Civil 3D such as project management,templates and style optimization, and specific features including surfaces,grading, pipe networks, and corridors.
Moving from Land Desktop to Civil 3D Guide
Many Land Desktop users are transitioning to Civil 3D. The Moving from LandDesktop to Civil 3D guide provides concepts, best practices, and procedures for
Online Tutorials | 7

successfully moving from Land Desktop to Civil 3D. This guide is availableon the Help menu. It contains information on how to successfully plan forand transition an organization from using Land Desktop to using Civil 3D.This guide also contains information on tools for moving Land Desktop datainto Civil 3D.
Skill Builders
AutoCAD Civil 3D Skill Builders are advanced exercises that enable you topractice performing design tasks using Civil 3D drawings. Skill Builders areavailable from the AutoCAD Civil 3D website.
To view and download AutoCAD Civil 3D Skill Builders, visithttp://www.autodesk.com/civil3d-skillbuilders.
Autodesk Training Programs and ProductsTraining programs and products from Autodesk help you learn the keytechnical features of your Autodesk software and improve your productivity.For the latest information about Autodesk training, visithttp://www.autodesk.com/training or contact your local Autodesk office.
Autodesk Authorized Training Centers
Be more productive with Autodesk software. Get trained at an AutodeskAuthorized Training Center (ATC) with hands-on, instructor-led classes tohelp you get the most from your Autodesk products. Enhance your productivitywith proven training from over 1,400 ATC sites in more than 75 countries.For more information about Autodesk Authorized Training Centers, [email protected] or visit the online ATC locator athttp://www.autodesk.com/atc.
Autodesk Courseware
Autodesk publishes many courseware titles each year for users at all levels toimprove their productivity with Autodesk software. The preferred trainingmaterials of Autodesk partners, these books are also well-suited for self-paced,standalone learning. All courseware simulates real-world projects withhands-on, job-related exercises. Autodesk Official Training Courseware (AOTC)is developed by Autodesk. Autodesk Authorized Training Courseware (AATC)is developed by Autodesk partners, including titles in a growing number of
8 | Chapter 1 Introduction

languages. Autodesk Official Certification Courseware (AOCC) teaches theknowledge and skills assessed on the Certification examinations. Visithttp://www.autodesk.com/aotc to browse the Autodesk Courseware catalog.
Autodesk Certification
Gain a competitive edge with your career by obtaining Autodesk Certification,validating your knowledge and skills on Autodesk products. Autodesk providesan end-to-end solution for assessing your readiness for certification, preparingfor certification, and obtaining certification. For more information on AutodeskCertification, visit http://www.autodesk.com/certification.
e-Learning
Autodesk e-Learning for Autodesk Subscription customers features interactivelessons organized into product catalogs. Each lesson is 20-40 minutes in lengthand features hands-on exercises, with an option to use a simulation or thesoftware application. You can also use an online evaluation tool that identifiesgaps in skills, determines what lessons will be most helpful, and gauges learningprogress.
If you are a member of Autodesk subscription, you can access e-Learning andother subscription services from within your Autodesk product. For moreinformation about Autodesk subscription resources, visithttp://www.autodesk.com/subscription.
Autodesk Training Programs and Products | 9

10

Designing with Objects
The underlying object model in AutoCAD Civil 3D creates some major efficiencies in theengineering design process. Because of this model, changes to one object can affect relatedobjects, and object styles can control many aspects of object appearance and behavior. Thischapter describes both the object model and the AutoCAD Civil 3D user interface for workingwith objects.
Object ModelThe architecture of AutoCAD Civil 3D ensures that each object, such as analignment or a parcel, has a standard set of attributes and relationships to otherobjects. These objects are “intelligent” in the sense that they automatically reactin predictable ways to changes in related objects. As a result, you do not needto spend hours ensuring that design revisions are transferred correctly amongsurfaces, alignments, profiles, sections, labels, tables, and other objects. Thetedious tasks of redrafting and relabeling are eliminated. Design options and“what if” scenarios can be created more easily and analyzed with precision,resulting in significant process improvements.
2
11

Points
Surfaces
Parcels
Alignments
Grading
Exploded representation of the object model
12 | Chapter 2 Designing with Objects

Object Relationships
The following illustration shows a simplified view of object relationships anddata flow in an AutoCAD Civil 3D drawing:
Object relationships and data flow
Object Relationships | 13

Field survey data creates figures and points that can be used to generate anexisting ground surface and parcels. This surface is referenced as other objectsare created in the design process, resulting finally in a designed surface.
Parcels, existing ground surfaces, pipe networks, and gradings can be createdindependently, or from data sources not shown in the illustration. Such objectsare usually linked to other objects during the design process, if not at thebeginning. The object type with the most complex set of relationships is thecorridor, because it requires data from an alignment, profile, and assembly.
Changes to any object automatically flow along the arrows to dependentobjects, with predictable results. For example, if you correct the elevations ofan existing ground surface, updates flow to any related grading objects,corridors, profiles, and pipe networks. As a result, all values represented inlabels and tables are also updated.
In the design process, after you create an alignment you can create manyprofiles and sections. However, the display of these in profile views and sectionviews is optional and separate from the flow of data required to create thefinal product—a designed surface. Similarly, the data from objects, such asparcels and alignments, can be output to a table or report if desired.
14 | Chapter 2 Designing with Objects

Object InterfaceThe user interface of AutoCAD Civil 3D reflects the object architecture of theapplication. The major elements are shown in the following illustration:
AutoCAD Civil 3D User Interface
The following notes describe the numbered items in the illustration:
1 Toolspace. For object management. Uses four tabs: Prospector; fornavigating through the object collections, Settings; for managing stylesand settings, Survey; for managing survey data, and Toolbox; forgenerating object reports.
2 Item view. For a list view of the contents of the selected folder or a graphicview of the selected object.
3 Layout tools. For creating and editing objects, such as gradings oralignments.
4 Standardized menus. For consistent access to the full range of commands.
Object Interface | 15

5 Tabbed property editors. For modifying individual objects and theirattributes.
Each part of the user interface is described in more detail in the followingsections.
Toolspace for Object Management
The Toolspace window provides an object-oriented view of your engineeringprojects. The window is divided into four parts or tabs: Prospector tab, Settingstab, Survey tab, and Toolbox tab.
Prospector Tab
On this tab, all of the objects in a drawing or project are arranged in a hierarchythat you navigate in standard, Windows Explorer–like fashion. To access thistab, click General menu ➤ Toolspace. To view all the collections in theProspector tree, select Master View from the list at the top of the Prospectortab. The collections available here are Open Drawings, Projects, Data Shortcuts,and Drawing Templates. Note that Projects lists projects available after youhave logged into an Autodesk Vault server and Vault database. A site collectionincludes objects that are related to one another because they share topology.
The following illustration shows a typical structure. The Oak Street site foldercontains collections for alignments, grading groups, and parcels that belongto the site. The Parcels folder contains the parcel objects defined for the OakStreet subdivision. Note that the view selected is Active Drawing.
16 | Chapter 2 Designing with Objects

The Prospector tab in Toolspace
Toolspace for Object Management | 17

Settings Tab
On this tab, styles are organized for different object types. Even in a blankdrawing, most of these styles are present in a standard hierarchy. You cancreate and modify styles in a drawing, then save it as a template. Subsequentdrawings based on the template will automatically have the same set of stylesavailable. You can modify object, label, and table styles. You can also controlsettings for drawings and commands. To access this tab, click Generalmenu ➤ Toolspace. In the following illustration, label and table styles forparcels have been defined:
Each type of object canhave an unlimitednumber of styles.
Predefined label stylescan be applied to anyparcel in the drawing.
The Settings tab in Toolspace
18 | Chapter 2 Designing with Objects
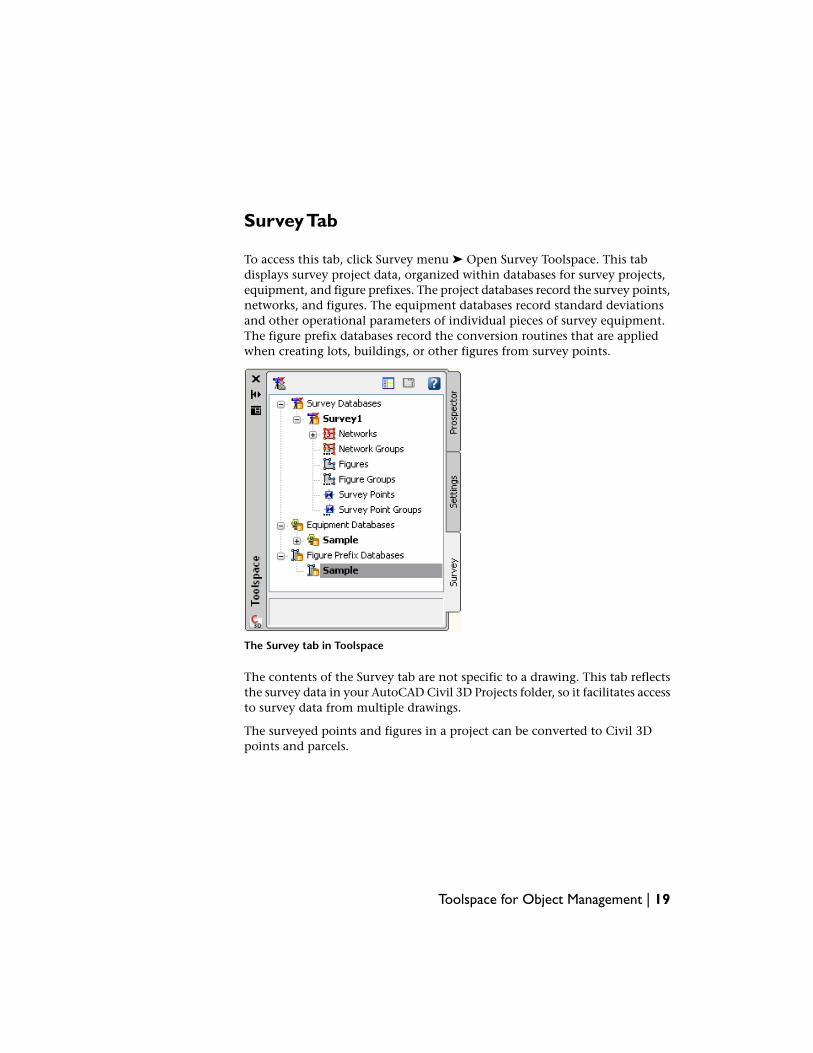
Survey Tab
To access this tab, click Survey menu ➤ Open Survey Toolspace. This tabdisplays survey project data, organized within databases for survey projects,equipment, and figure prefixes. The project databases record the survey points,networks, and figures. The equipment databases record standard deviationsand other operational parameters of individual pieces of survey equipment.The figure prefix databases record the conversion routines that are appliedwhen creating lots, buildings, or other figures from survey points.
The Survey tab in Toolspace
The contents of the Survey tab are not specific to a drawing. This tab reflectsthe survey data in your AutoCAD Civil 3D Projects folder, so it facilitates accessto survey data from multiple drawings.
The surveyed points and figures in a project can be converted to Civil 3Dpoints and parcels.
Toolspace for Object Management | 19

Toolbox Tab
To access this tab, click General menu ➤ Toolbox. This tab organizes reportsfor each object type. The reports provide useful engineering data from adrawing in a compact, portable format. AutoCAD Civil 3D includes manystandard reports. Some are in LandXML format, with predefined or customXSL style sheets. Other reports are .NET format, with custom dialog boxesthat allow you to select the data and various options.
The Toolbox tab in Toolspace
You can add your own reports to the Toolbox menu. These reports can be ina variety of formats, including XML, VBA, COM, or .NET.
20 | Chapter 2 Designing with Objects

Menu Standardization
The menus in AutoCAD Civil 3D are designed to be as consistent as possiblefor all objects, making it easy to find the command you are looking for. Thisstandardization reflects the fact that the workflows for creating, editing, andannotating various objects are quite similar.
The object creation commands are at the top of the menu structure, becauselogically they are the first steps in any workflow. They are followed by theediting commands, and then, the annotation commands. Note that all featuremenus provide access to the labeling and table creation commands.
Comparison of the Pipes, Parcels, and Alignments menus
In this release of AutoCAD Civil 3D, the Grading feature line editing commandsare also available on the Parcel and Survey menus. Use these commands toedit parcel geometry as well as parcel elevations. You can also use the featureline commands to edit survey figures, including control points.
Menu Standardization | 21

Comparison of the Parcels and Survey menus
AutoCAD Civil 3D comes with several workspaces that you can use as-is orchange according to your preferences. Workspaces are sets of menus andtoolbars grouped together to enable you to customize workspace settings.AutoCAD Civil 3D workspaces include Civil 3D Complete, Design, Annotationand Drafting, Survey and Topographical, and Visualization and Rendering.For more information about using workspaces, see the Help system.
The Annotation menu in the Annotation and Drafting workspace is designedto facilitate the creation of annotation labels and tables. The Annotation menuprovides access to all label and table commands. The feature menus, such asthe Pipes, Parcels, and Alignment menus, also include options for the creationof labels.
To modify label styles and settings, use the Add Labels command to accessthe Add Labels dialog box. This command is located on both the feature (Civil3D Complete workspace) and Annotation (Annotation and Drafting workspace)menus. For a quicker method to add labels when your styles are already setup, you can use the direct creation method for specific label types. For example:Parcels menu ➤ Add Parcel Labels ➤ Single Segment. To access the Add Labelsdialog box to edit or create features label styles, use Parcels menu ➤ Add ParcelLabels ➤ Add Parcel Labels. See the Help system for instructions on creatinglabels for features and objects.
22 | Chapter 2 Designing with Objects

Annotation Label and Table menus
Menu Standardization | 23

Shortcut Menus
AutoCAD Civil 3D uses shortcut menus extensively. These menus are displayedwhen you right-click either one or more objects in the drawing, or anindividual item in Toolspace. You use shortcut menus for quick access tocommon functions and commands.
Here are two examples from the Prospector tab. The menu on the left isdisplayed when you right-click an alignment object on the Prospector tab.The menu on the right is displayed when you right-click a parcel.
Shortcut menus for an alignment and a parcel on the Prospector tab
The options on the shortcut menus on the Settings tab are also very similarfor different object types.
24 | Chapter 2 Designing with Objects

Layout Tools
AutoCAD Civil 3D provides separate dialog boxes, called Layout or CreationTools, for designing surfaces, alignments, grading, and other features. Eachlayout tools dialog box provides access to object-specific design and editingcommands in a floating dialog box.
Layout tools for Grading, Alignments, and Pipe Networks
Consistent Editing Methods
Object editing in AutoCAD Civil 3D uses an approach that is quite consistentfor all objects. The main editing tools are described in the following sections.
Item View
When you click an object or an object collection on the Prospector tab, forexample, Points or Alignments, an item view appears. An item view can beeither a list view or a graphical view, depending on the object selected.
Layout Tools | 25

The item view presents a table in which you can review and edit data for eachobject in the selected collection. For example, if you select a point group, theitem view table includes a row for each point in the group.
Click a table cell toedit the value.
Item view showing a group of points
Grips
When you select an object in the drawing, grips appear on the object. Youcan use these grips to click and drag the object to a new location. For example,when editing alignments, you can use grips to move points of intersection orpoints of line-arc tangency.
Direction of drag
Editing an alignment by dragging the grip at the midpoint of a curve
26 | Chapter 2 Designing with Objects

When you use a grip to drag a label object to a new location, a round resetgrip appears. You can click this round grip to return the label to its originallocation. No matter how many times you have moved the label, the reset gripwill restore it to its original location.
Use the round grip to reset label location
Panorama Window
Some object types, such as alignments and profiles, use the Panorama windowto display a table of entities that make up that object. The Panorama windowis a floating, dockable window that you can keep open as you work. It caninclude several tables, called vistas, on different tabs. Panorama data shownin black text can be edited; data shown in gray text cannot be edited.
Consistent Editing Methods | 27

Panorama window showing an alignment
Property Editors
When you right-click any object on the Prospector tab, and then clickProperties, you can view all the AutoCAD Civil 3D properties of that object,and edit some of them. These properties typically include the styles, labels,related objects, and some structural details of the current object.
28 | Chapter 2 Designing with Objects

Properties editor showing properties for a surface (above) and a point group (below)
AutoCAD Properties Editor
When you right-click an object in the drawing, and then click Properties, theAutoCAD Properties dialog box is displayed. You can use this dialog box toreview and edit AutoCAD properties, such as the layer on which the object isdrawn. You can view the style assigned to the object, and can also change ithere. You can also edit an object style on the Settings tab of Toolspace.Right-click the object style. Click Edit to open the <feature> Style dialog box.
Consistent Editing Methods | 29

Click a table cell toedit the value.
Editing AutoCAD properties for an alignment
30 | Chapter 2 Designing with Objects

Exercise: Familiarization Tour
In this exercise, you will explore the Toolspace and Workspace settings.
Using an alignment as an example, you will explore objects and styles locatedon the Toolspace Prospector and Settings tabs. You will also examine theworkspace menus.
To view Toolspace tabs in AutoCAD Civil 3D
Open the file C:\Program Files\AutodeskCivil 3D 2009 \Getting StartedGuide\GSG_alignments.dwg.To access the Toolspace, click Generalmenu and click Toolspace.In Toolspace, on the Settings tab, ex-pand the Alignment collection. Notethe Alignment Styles, Design Checks,Label Styles, Table Styles, and Com-mands collections.
1
Right-click the drawing GSG_align-ments.dwg. The context menuprovides access to dialog boxes whereyou can edit drawing settings, labelstyle defaults, LandXML settings, andtable tag numbers.
2
Exercise: Familiarization Tour | 31

In Toolspace, on the Prospector tab,expand the Sites collection and ex-pand Conway Farms and its Align-ments. Right-click East-West Drive. Thecontext menu enables you to opendialog boxes to view and changeproperties such as Object Style andreference points.Make changes as desired and click OK.Now expand the Parcels collection andobserve how parcel data is displayedby opening the Properties dialog box.You can also edit object styles, createmapcheck or inverse reports, or editproperties that you can define such asparcel address.
3
Now you will explore the workspacesettings. You can customize the work-space menus to suit your particulartasks or preferences.In the lower right of the Civil 3D inter-face, click the Workspace Switching
icon and select Annotation andDrafting and observe how the menusare reorganized.
4
Select the Annotation menu. Note thecommands for adding labels and
5
tables. This menu facilitates the la-beling process during the draftingstage of your project. Experiment withthe workspace settings and customizethem for your design needs.
Click again to open the Work-space Settings dialog box. Use this
32 | Chapter 2 Designing with Objects

dialog box to customize the order anddisplay of the settings.
Standard Controls for Styles and LabelsEvery AutoCAD Civil 3D object has a style assigned to it. These styles arecreated, assigned, and managed in a consistent way for all objects. All objectshave an object style and can have one or more label styles. Some objects havetable styles as well. You can browse the collections of styles in a drawing, onthe Settings tab of the Toolspace window, as shown in the followingillustration:
Style collection folders on the Settings tab of the Toolspacewindow
To create a new style or to edit an existing style, right-click the style on theSettings tab, and then click Edit.
The Style dialog box for labels is called the Label Style Composer. It containsa preview window that makes it easy to adjust label location and appearance.
Standard Controls for Styles and Labels | 33

Label Style Composer dialog box showing a point label style
There are many ways to open the Label Style Composer:
■ Right-click an existing style and click Edit.
■ Right-click an existing style and click New.
■ Right-click a label style type and click New.
■ You can also access the Label Style Composer from the Label Style Control,which is available in many dialog boxes.
You can also access the Label Style Composer while working directly in yourdrawing. To quickly access the composer while in the drawing, select a label.Then right-click and select either Properties or Label Properties. In the AutoCADProperties palette, click the label style to display a list of available styles.
For more information about styles and labels, see the chapter Using Styles andSettings (page 39) in this guide.
34 | Chapter 2 Designing with Objects

Precision Layout StrategiesWhen creating objects, such as horizontal alignments, parcels, and profiles,you may need to use several different methods. Sometimes you want to drawquick freehand versions, other times you have specific distances and anglesto enter. AutoCAD Civil 3D supports both methods of working.
The main layout tools have settings that you can use to control some designelements while you draw each object. For example, when drawing alignmentsor profiles, you can create a series of linked tangents and add curves later, oryou can have curves of standard dimensions inserted at each tangentintersection as you draw. Similarly, you can specify a default area for eachparcel and a minimum frontage distance.
You can also use the transparent commands to specify precise point locationswhile you are laying out an object. From a current point in an alignment orparcel, you can specify the next point using standard surveying methods, suchas angle and distance, northing and easting, latitude and longitude, or pointnumber. As shown in the following figure, for a profile, you can specify apoint by various methods, such as station and elevation or grade and distance.In each case, you use the command by entering a short code on the commandline (for example, ‘bd for bearing and distance) or by clicking an icon on theTransparent Commands toolbar.
Distance transparent command in progress on a profileview
Object Building BlocksCorridors and pipe networks share a similar complex structure, in that bothobjects are built up from standard components. These components exist in acatalog, and you can modify them to create additional components.
Precision Layout Strategies | 35

Corridors
A corridor is created from one or more assemblies, which are standard roadwaycross-sections. You design an assembly from subassemblies, such as lanes,curbs, shoulders, and ditches. The subassemblies are provided in a set ofcatalogs, which you can review by clicking General menu ➤ Catalog or Generalmenu ➤ Tool Palette Window.
Roadway assembly (left), with subassemblies shown in a tool palette (right)
Each subassembly has a defined cross-section, and some subassembliesautomatically adapt to their location. For example, the slope of a road lanechanges as superelevation is applied, and a side slope automatically createseither a cut or fill slope, depending on the relative elevation of the existingsurface.
The dimensions of a subassembly, such as the width of a lane or the heightof a curb are stored as properties. If you want to create a new subassemblybased on an existing one, use this simple procedure:
1 Right-click a subassembly in the Tool Palette, copy it, and paste it.
2 Right-click the subassembly that you copied and click Properties.
3 Rename the subassembly and modify the numeric parameters.
You can also create custom subassemblies from AutoCAD polylines. In thiscase, you must also specify the subassembly behavior within an assembly andin the process of corridor creation. You can define custom subassemblies andtheir behavior using Visual Basic for Applications (VBA) scripts, then use theAutoCAD Civil 3D COM application programming interface (API) to link theseto the main application.
36 | Chapter 2 Designing with Objects

A subassembly definition references point, link, and shape codes. Points arethe vertices of the subassembly, and they can be attachment points for adjacentassemblies. Links are the line segments or curves between the points. Shapesare two-dimensional polygons that represent the cross-sectional shape of thesubassembly. The following figure shows a coding diagram for a Basic Curband Gutter subassembly:
Pipe Networks
A pipe network is constructed from various pipes and structures that appearin a parts list. You can see the available lists on the Toolspace Settings tab byexpanding the Pipe Network ➤ Parts Lists collection.
AutoCAD Civil 3D includes a utility called Part Builder, which you can use toedit the dimensions of parts and create new ones. You can create a new partby saving an existing one with a new name, and then modifying its dimensionsin various tables.
Detail from a Part Builder edit window for a concentric cylindricalstructure.
Pipe Networks | 37

38 | Chapter 2 Designing with Objects

Using Styles and Settings
Styles determine the display format and some aspects of the behavior of objects and theirlabels. This chapter explains how you can use various settings and the versatile set of stylesin AutoCAD Civil 3D to establish CAD standards and promote efficiency at every stage of thedesign process.
Managing StylesYou can use styles to control object appearance and behavior, with flexibilityand ease, and to establish design standards. If you are the CAD manager in yourorganization, you may find that time spent creating styles for others to use paysoff in terms of efficiency and standards compliance.
AutoCAD Civil 3D is an object-oriented program that works with intelligentobjects. The objects reference a style, which can be changed at any time. Anystyle can be copied by dragging it from one drawing to another. The new drawingknows where to put that style in the Settings tree. You can then apply the newstyle to existing objects.
Any label style can be copied by creating a child style. A child style derives itsdefault settings from its parent, the existing style. To create a child style for alabel, on the Toolspace Settings tab, right-click a label style. Click New. In theLabel Style Composer dialog box, make changes to the settings as desired andclick OK. The child style will appear underneath the parent style in the Settingstree. See the Labels and Settings (page 57) exercise at the end of this chapter.
You can use styles to manage the display of objects at different phases of aproject. In the following illustration, the upper drawing uses surface and parcelstyles appropriate for a preliminary layout, while the lower drawing uses differentstyles for the final presentation:
3
39

Early layout phase
Final drawing phase
Using customized surface and alignment styles for different phases of a project
40 | Chapter 3 Using Styles and Settings

Types of StylesAutoCAD Civil 3D includes styles for objects, their labels, data tables, and thebands that annotate profile views and section views. Each of these styles isdescribed in the following sections.
Object Styles
Each object type includes a Basic style. Use this style as it is, or as a basis forbuilding custom styles. You can create styles to meet the needs of a particularproject, a group of users, or any other design requirement. Groups of stylescan be collected into a template (.dwt) file, so that all drawings based on thattemplate share the same style configuration.
All object types have similar style controls, and a similar set of style collectionson the Toolspace Settings tab. You access the style editing dialog boxes byright-clicking one of the styles and then clicking Edit.
The following illustration shows some common style editing tasks for points,surfaces, and alignments:
Types of Styles | 41

1 Point style: using a custommarker
2 Surface style: smoothingcontours
3 Alignment style: changing thecolor of the line components
1
2
3
Editing the style for three different types of objects
42 | Chapter 3 Using Styles and Settings

In addition to feature-specific styles, AutoCAD Civil 3D includes multipurposestyles that apply to several objects. Most of these styles apply to grading objectsand corridor assemblies, and control the appearance of components, such asmarkers, feature lines, and slope patterns.
Label Styles
Labels are associated with many objects, and their content is updated wheneverthe object itself is changed. Labels are also controlled by styles. You can modifythe label styles in the same way that you modify the object styles: right-clicka style name on the Toolspace Settings tab, and then click Edit. You can createand save label sets for alignments, profiles, and sections, which allows you toapply multiple label types in one operation. For example, an alignment labelset could include labels for major stations, minor stations, and geometrypoints.
Labels can include text, blocks, lines, ticks, and leaders. You can easily createlabels and preview their appearance in the Label Style Composer dialog box,as shown in the following illustration:
Label Styles | 43

Alignment station labels and parcel arealabels appear in the drawing as they appearin the preview of the Style Composer.
Table styles can alsobe customized.
Previewing customized label styles for alignment stations and parcel area
44 | Chapter 3 Using Styles and Settings

When composing a label style, you work with the following types of attributes:
■ Location. Controls the location of the label in relation to the object.
■ Text. Specifies which object data is displayed, and sets the size, color, andfont for the text.
■ Appearance and Visibility. Defines the bounding box, color, lineweight,linetype, and other aspects of label appearance, and sets the visibility ofany of the label components.
■ Dragged State. Determines how a label changes if it is dragged away fromthe default location to a place where it is more readable. For example, youcan specify the addition of a leader line with arrow.
■ Plan Readability. Automatically rotates any upside-down label text so it isreadable in plan view. Otherwise, if labels are oriented in relation to anobject, they might be displayed upside-down.
■ Orientation. Sets the rotation angle of the labels in relation to the objectyou are labeling, the current view, or the world coordinate system (WCS).
Setting the label style defaults provides an efficient way to standardize somekey aspects of label appearance and behavior for all objects in the drawing.To review and edit these defaults, right-click the drawing name on theToolspace Settings tab and click Edit Label Style Defaults.
All label text is controlled by the Text Component Editor. To access the TextComponent Editor, in the Label Style Composer dialog box, click the Layouttab. Select a component from the Component Name list, or create a new textcomponent. Under Text, click the Value column for Contents, and then click
. You can use this editor to simultaneously edit the text for an entire groupof labels.
Label Styles | 45

Use the Properties list at the top of the dialog box to specify which objectproperty to include in the label. For example, a parcel area label can includeproperties such as the parcel area, perimeter, number, and street address. Eachproperty component can include character strings and data codes, as shownon the screen on the right. After you select a property to include, use the tableon the left to specify the format of text inside the double brackets (<[text]>).When you finish modifying the values, click the right arrow at the top of thedialog box to send the updated component to the screen on the right. Usethe screen on the right to modify the standard text strings outside the bracketsand to cut and paste entire components.
Managing Label Styles
Use the AutoCAD Properties palette to manage most labels. The palette displaysthe Standard AutoCAD properties and also the label properties such as LabelStyle and whether the label is visible, flipped, or pinned.
You can simultaneously edit an entire group of labels. For example, you cancreate additional label text for inclusion on all labels by performing a singleaction. Some types of labels, such as station labels, are group type labels. Toedit a group of labels, right-click a label, which highlights the group, and clickeither Label Properties or Properties to access the AutoCAD Properties palette.
Also, you can select and edit a single label. To edit a single label within a labelgroup, use Ctrl+left-click to select a label. Right-click the label and click eitherLabel Properties or Properties to access the Properties palette. To select morethan one label (subentity) within a group of labels, continue to press Ctrl andclick additional labels.
46 | Chapter 3 Using Styles and Settings

You can use the Style Selection menu in the Properties palette to bulk-editlabel properties. This is a convenient method of editing labels without havingto navigate to the Toolspace Settings tab. You can quickly create, edit, or copystyles while working directly within the drawing.
Select the Edit/Create option to open the Select Style dialog box where youcan create a new style, copy the currently selected style, create a child style,or edit the currently selected style using the Label Style Composer.
You can now directly edit or change a label style using the Edit Label Styleoption. In the drawing, select the label to edit. Right-click and select Edit LabelStyle.
You can also edit an existing label style in Toolspace. In Toolspace, on theSettings tab, right-click the label style you want to edit and click Edit. Use the
Label Styles | 47

Label Style Composer to edit the label. In the Label Style Composer, click to access the Text Component Editor.
Table Styles
AutoCAD Civil 3D provides automated data tables for points, surfaces, parcels,alignments, and quantity takeoff. As shown in the following illustration, thesetables provide a concise display of object data as an alternative to using objectlabels. The table styles control the data properties and the displayedcomponents of the table. Data properties include the data format, order ofcolumns, text style, and whether the table title and column headers arerepeated if the table is split. Display components include the borders,separators, fill, and text. You can control the visibility, color, linetype, andscale of each component.
Example data table for the Ridge Road alignment
Table Tags
Use the Table Tag Numbering dialog box to set the default starting numberand increment options for table tags. To access the Table Tag Numberingdialog box, navigate to the Toolspace Prospector tab. Then, right-click thedrawing name, and select Table Tag Numbering. You can also access this dialog
48 | Chapter 3 Using Styles and Settings

box from the Add Labels dialog box. You can use General line and curve labelsalone or with parcel segment labels to create a table.
The table tag settings for segment labels are no longer controlled by the siteand can be found in the drawing settings, DWG node and is drawing-wide.By default when creating table tags, the settings control the starting number,and increment number.
Use this dialog box to set your table tags automatically
Note that duplicate tags are not created unless you manually create them withthe EditParcelTagNumbers command. When table tags are created, it preventsthe creation of duplicate tag number within the drawing. When renumberingtable tags, you can create duplicates by changing the starting number orincrement in the settings (table tag renumbering section of the dialog).
Table tags support the following tag mode labels: general line, general curve,parcel line, parcel curve, alignment line, alignment curve, and alignmentspiral.
Band Styles
Profiles and sections are displayed in a graph format. These profile views andsection views can be annotated with data bands along the top and bottom ofthe grid. Each band marks significant points along the length of the profile
Band Styles | 49

or section. For example, in a profile view, you can have separate bands forvertical geometry, horizontal geometry, superelevation data, and pipe networks.
The following illustration shows part of a profile data band above a horizontalgeometry band. In the profile data band, at each major station you see theelevations of the existing ground and finished grade profiles. The horizontalgeometry band shows the location of a curve and some engineering data aboutthe curve.
Part of two profile view data bands
Separate band styles exist for each band type. In each style definition, youcan specify what data to display and details of the band format, such as theheight and position of the band (above or below the grid), and the color ofcomponents, such as borders and labels. If you want a standard set of bandsfor use with profile or section views, you can define these as a band set andapply them as needed.
Profile and Section View Styles
You modify the appearance of a profile view the same way you modify theappearance of other objects, by changing its style. The profile view stylecontrols the format of the graph on which the profiles are displayed, as wellas the title and annotations on the axes.
Customizing profile view styles is a good example of how styles can bemodified for different stages of your project. In the design phase, you mayuse one profile style that has few grid elements and limited annotation. Bylimiting annotation and grid elements you reduce drawing size and improvedrawing performance. During the plotting stage of the design, a second stylemay be used that includes extensive annotation and uses more graph elements
50 | Chapter 3 Using Styles and Settings

than the design style. For more information about profile and section viewstyles, see the AutoCAD Civil 3D Help.
Using Styles with LayersMost objects in AutoCAD Civil 3D have several components. For example, asurface includes contours, triangles, and points. You can control how thesecomponents are displayed either by using layers or by setting the displayproperties directly in the object style. You use the Layer Properties Managerdialog box or the object styles dialog boxes respectively to do this.
The Display tab of the object styles dialog boxes provides a number of settingsthat are similar to those in the Layer Properties Manager dialog box, such asvisibility, color, linetype, and lineweight. This duplication means that youcan control object appearance using only styles, only layers, or a combinationof the two.
Display properties defined in the object styles dialog boxes override the settingsdefined for the drawing layers in the Layer Properties Manager dialog box.For example, you can use two different styles to distinguish the display ofexisting ground and finished grade surfaces, even if they are drawn on thesame layer.
The following illustration shows how you can use both style settings andtraditional layers to control the display characteristics of an object. The styleshown in the upper drawing directly modifies the color and visibility of the
Using Styles with Layers | 51

surface components, so that the surface points are turned on and colored red,even though the layer on which the points are drawn (0) is turned off andcolored white in the Layer Properties Manager dialog box.
The style shown in the lower drawing assigns the surface components to layersalready defined in the drawing. In this case, the color of the major and minorcontours is set by the C-TOPO-MAJR and C-TOPO-MINR layers.
52 | Chapter 3 Using Styles and Settings

Visibility and colorof the surfacecomponentsare controlled by thelayer assignment.
Visibility and colorof the surfacecomponentsare controlled bysettings on theDisplay tab of theSurface Styledialog box.
Managing object appearance using style settings (above) and layers (below)
Using Styles with Layers | 53

Label ObjectsMost labels are implemented as independent label objects and are nothighlighted when the parent object is selected. Label object properties areseparate from the parent object. You can use the LIST command to displaythe label properties.
Label objects can include references to other AutoCAD Civil 3D objects byincluding Referenced Text components.
The layer behavior of label objects is different. For example, their new defaultlayers are specified in the Drawing Settings and can be changed using theAutoCAD Properties palette (rather than modifying the label style with theLabel Properties dialog box).
You can control the behavior of labels in one of two ways, by referencingeither the layer in the style or the layer that the label resides on.
In previous releases of AutoCAD Civil 3D, all group type labels were subentitiesof the parent object. If the parent object was frozen, the labels would disappearwith the frozen parent object. Independent object labels are no longersubentities of the parent object. However, if you desire to control the objectlayer in conjunction with a parent object, you can set the layer that the labelresides on to 0, which will make it behave as if it were a subentity of the parentobject. In this case, with the layer set to 0, if the layer of the parent object isfrozen, the label will also be frozen (and will no longer be visible).
Table Creation and Label TypesIn this release of AutoCAD Civil 3D, when creating parcel tables, you canselect general line and curve label types and parcel segment labels, includingany line or curve labels, that are applied to a line, curve, feature line, orpolyline.
You can create an alignment segment label that references a general line orcurve style for inclusion in a table. General line and curve label styles nowhave a Tag Mode that supports general line and curve labels, parcel segmentlabels that reference a general line or curve style, and alignment segment labelsthat reference a general line or curve style.
The Add Table commands (Add Line, Add Curve, and Add Segment) areavailable on the Lines/Curves menu, the Grading menu (for feature lines),and the Survey Menu (for figures and survey figures). The Renumber Tagscommand is also available on these menus.
54 | Chapter 3 Using Styles and Settings

Object SettingsSettings in AutoCAD Civil 3D provide many preset values, ranging from values,such as drawing units, scale, and coordinate system, to optional defaults, suchas the layers that the different objects are created on, and the use of tooltips.You can access the setting dialog box by right-clicking the appropriatecollection on the Toolspace Settings tab, and then clicking Edit Feature Settings.
You can work with three levels of settings:
■ Drawing settings establish values for the whole drawing. If you are creatinga drawing template, ensure that these are set correctly.
■ Feature settings control behavior for a particular feature, such as Parcelsor Grading.
■ Command settings apply to individual commands within a feature, suchas the CreateParcelByLayout command within the Parcels feature.
Each lower level object in the settings hierarchy can either inherit or overridesettings in the level above it. The following illustration shows an override setfor area units at the Parcels feature level. The arrow in the Child Overridecolumn of the Drawing Settings dialog box (upper drawing) indicates that anoverride has been set at a lower level. The check mark in the Override columnin the Parcel Settings dialog box (lower drawing) indicates that the value setin this dialog box overrides the setting at a higher level. At the drawing levelyou can cancel an override by clicking it. You can prevent overrides by lockinga setting.
Object Settings | 55

Area units for parcel objectsare acres, overriding thedrawing setting. For otherobjects, area units remainset to square meters.
How feature settings can override drawing settings
56 | Chapter 3 Using Styles and Settings

Exercise: Object and Label StylesIn this exercise, you create and modify a child label style.
Using parcel labels as an example, you will learn how to create a child styleand observe how changes to parent styles affect the child styles.
To create and change label styles in AutoCAD Civil 3D
Open the file C:\Program Files\AutodeskCivil 3D 2009\Getting StartedGuide\GSG_styles.dwg.In Toolspace, on the Settings tab, ex-pand the Parcel collection, and thenexpand the Label Styles collection.Now expand Area and right-click theStandard style. Click New.
1
On the Label Style Composer dialogbox Information tab, the new stylename is Standard [Child].Make changes as desired and click OK.Observe that in the Label Style collec-tion, the new child style appears underStandard.
2
Exercise: Object and Label Styles | 57

Right-click Standard and click Edit.In the Label Style Composer dialogbox, on the Layout tab, change theBorder Visibility setting to True. Notethat now a visible border is displayedaround the label.Click OK to close the dialog box.
3
Right-click the Standard [Child] Labeland click Edit.
4
On the Layout tab, observe that thechange to the parent style has affectedthe child style, which now also has aBorder Visibility setting of True.
58 | Chapter 3 Using Styles and Settings

Exercise: Object and Label Styles | 59

60

Designing DrawingStandards
This chapter outlines a process for creating drawing templates. You can use drawing templatesto save time by establishing a consistent format for drawings and a standard design process.
Creating TemplatesAutoCAD Civil 3D provides a number of features that contribute to a standardappearance and behavior for all your drawings. These can all be specified in adrawing template, which is saved as a .dwt file. Your organization may needseveral templates for different customers or project types. Then, whenever youstart a new drawing, you can open a template that contains all the requiredsettings and styles. The general process for setting up a template is described inthe following sections.
4
61

Lot labels are controlled bya parcel label style, whichcould also be defined in thetemplate file.
Units and precision foralignments are set in thetemplate file.STA=22+00.00
LOT: 1Area: 8321.86 sq. m0.83 hectares
Defining standards using a template file and a label style
62 | Chapter 4 Designing Drawing Standards

Drawing Settings
As a basis for configuring your drawing settings, choose an existing templatethat is closest to your needs. To see the available templates, click Filemenu ➤ New. If you want some preset object styles, the four templates thathave names beginning with “_AutoCAD Civil 3D”, are recommended. Thenames of these templates, such as AutoCAD Civil 3D (Imperial) NCS Base.dwt,indicate some of their settings. The metric or imperial label indicates the mainunit of measure.
After choosing your initial template, the next step is to review and edit settings.On the Toolspace Settings tab, right-click the drawing name and click EditDrawing Settings. The Drawing Settings dialog box includes five tabs andmany settings.
Use the table on the Object Layers tab to assign objects to layers, and createor rename layers. When designing your use of layers, consider the followingpoints:
■ Objects on the same layer are turned on and off together if you changethe layer visibility. For maximum display flexibility, spread objects andtheir components across several layers.
■ The color of a layer affects all objects assigned to that layer that are drawnin a style that uses the ByLayer color setting. If you set up styles this way,you can change the color of many objects by simply changing the layercolor.
Use the Abbreviations tab as a central location in which to set the abbreviationsused in object labels, especially for alignment and profile geometry points.
Using the Ambient Settings tab requires a careful review, because it providesglobal default settings, such as the precision of numeric values, and thevisibility of tooltips. One very useful setting is the General setting, Save
Drawing Settings | 63

Command Changes To Settings. If you set this to Yes, then whenever youchange a setting, such as the radius of an alignment curve, it is saved as thedefault value for next time. Another important setting on this tab isIndependent Layer On. This must be set to No if you want to be able to controlobject visibility by turning layers on and off.
On the Ambient Settings tab, you see a blue arrow in the Child Overridecolumn next to any setting that is changed for one or more features (objects)in the drawing. You can cancel the override by clicking the arrow, and youcan click the lock icon to lock any setting and prevent overrides at the featurelevel.
After configuring the ambient settings, you should work down through Point,Surface, and other features in the Settings tree, right-clicking each feature andselecting Edit Feature Settings. Doing this allows you to examine the defaultstyles for each feature and its labels, the feature name format, and other settingsthat you may want to modify. The ambient settings you configured at thedrawing level are available at the feature level in case you want to overridethem.
Layer Standards
Maintaining a standard for the use of layers is easier if you have a drawingtemplate with predefined layers, and styles that reference those layers whenobjects are created. For additional consistency, save your template as anAutoCAD standards file (.dws format). Then, in the template, enter theSTANDARDS command and in the Configure Standards dialog box, link thestandards file to the template. If you want to enforce the standards, you canclick the Settings button and activate notifications of standards violations, or
64 | Chapter 4 Designing Drawing Standards

override such violations. For more information, see Define Standards in theAutoCAD help.
Object Styles
Ideally, your drawing template will have the perfect set of styles for yourprojects, but this usually takes some time to evolve. To assist the process,create a demonstration drawing that contains one or more surface, alignment,and other object types. Or you can explore the Sample_styles.dwg, that issupplied with AutoCAD Civil 3D. After a default installation, you can findthis file at: C:\Program Files\AutoCAD Civil 3D 2009\Best PracticesGuide\Sample_styles.dwg. This provides a good laboratory in which to displayand develop styles. Consider designing styles to reflect the informationrequirements at different times in the project. For example, create styles forobjects in the design phase, and other styles for their final presentation. Also,you can create styles for different users of the drawings, showing object detailsand labels that present the data each type of user needs.
Label Styles
The styles for labels are another template item that should be developed witha top-down approach, similar to that for drawing settings and feature settings.At the drawing level, click Edit Label Style Defaults. In this context, you canset global standards such as those for text font, size, and label behavior aroundcurves. As with the object styles, after setting label style defaults you can reviewthe feature-level settings and apply any required overrides.
In this release of AutoCAD Civil 3D, you can use general line and curve labelstyles for parcel segment labels, and for alignment line and curve labels.Previously, general line label styles could be used to label only lines, curves,and polylines. The general line label styles are now available from the parcel,alignment, grading, and survey menus. For more information, see Label Objects(page 54). Parcel tables now support general line and curve label types anddisplay either general line and curve labels or parcel segment labels. For moreinformation, see Table Creation and Label Types (page 54).
Object Styles | 65

Plan Production ToolsYou can use AutoCAD Civil 3D plan production tools to automate the processof creating construction documents from your designs. Select an alignmentin your drawing, and using the plan production tools, you can quickly createsheets that automatically display the desired data.
You can use the View Frames wizard to create view frames along an alignment.Click General menu ➤ Plan Production Tools ➤ Create View Frames to openthe View Frames wizard. After creating the view frames, you can easily createsheets for construction plans. Click General menu ➤ Plan ProductionTools ➤ Create Sheets to open the Create Sheets wizard. See Plan ProductionTools (page 149) to explore the view frame and sheet creation process. For moreinformation about Plan Production tools, see Plan Production Tools in theHelp system.
Enhancing Drawings with Visualization ToolsAutoCAD render materials can greatly enhance the appearance of yourdrawings by simulating real world materials for a more realistic view of thedesign. Experiment with the render materials to determine which will workbest for your drawings. You can use this feature to enhance renderings ofsurfaces, corridors, and pipe networks. Click View menu ➤ Render ➤ Renderto render the object with the selected material. Click View menu ➤ Render ➤ Materials to open the Render Materials dialog box, where you can createnew materials and add or remove materials from the current drawing. Formore information, see Render Materials in the Help system.
66 | Chapter 4 Designing Drawing Standards

Exercise: Drawing SettingsIn this exercise, you will open a file that contains alignments and look at someways to work with drawing settings in AutoCAD Civil 3D.
Using alignments as an example, you will learn how to edit the drawingsettings to specify the default layer on which new objects will be created.
To set up object layers in AutoCAD Civil 3D
Open the file C:\ProgramFiles\Autodesk Civil 3D 2009 \GettingStarted Guide\GSG_alignments.dwg.
Click View menu ➤ Zoom ➤ Window.Draw a rectangle that includes thesketch lines at the bottom. Your viewof the drawing should look like this.
1
In Toolspace, on the Settings tab,right-click the name of the drawingand click Edit Drawing Settings.
2
In the Drawing Settings dialog box,click the Object Layers tab.This tab shows the default layers onwhich the various objects are created.You will change the default layer foralignments.
3
Exercise: Drawing Settings | 67

On the Object Layers tab, in theAlignment row, click the C-ROADvalue.In the Layer Selection dialog box, se-lect the C-ROAD-CNTR row. Click OKtwice to exit the Settings dialog boxes.
4
Click Alignments menu ➤ CreateAlignment From Polyline.In the drawing, click the cyan polylineat the bottom of the drawing.
5
In the Create Alignment dialog box,for Alignment Style, select Major Road.Note that the Alignment Layer is setto C-ROAD-CNTR. New alignmentswill be placed on this layer.
6
Click OK.
The new alignment is drawn on theC-ROAD-CNTR layer, using the MajorRoad style.
7
68 | Chapter 4 Designing Drawing Standards
Managing Project Data
The project management feature of AutoCAD Civil 3D is based on Autodesk Vault, a databasefor storing and sharing data among members of a project team. This chapter explains howto set up and use Autodesk Vault to manage your projects. The project management systemalso includes the data reference methods known as External References (xrefs) and DataShortcuts, which you can use for less complex and smaller projects.
The Collaborative EnvironmentThe project management system supports shared access to project files by anentire design team. There are three mechanisms for the sharing of design datawithin a project:
■ Object references in Autodesk Vault
■ External references
■ Data shortcuts
Before deciding which method to use, consider the complexity of drawings, thenumber of drawings involved, the size of your project team that will access andedit the files, and your requirements for ease of use as opposed to your need fordata security. Each mechanism is best suited to particular project requirements.
Autodesk VaultThe heart of the project management system is a set of project folders in anAutodesk Vault database. These folders can contain databases of point objects,along with official copies of surfaces, alignments, and other objects. When you
5
69

want to edit a particular drawing, you can check it out from the database,which locks it so that other users can get a read-only copy, but cannot editthe drawing.
As shown in the following illustration, you can import some read-onlyreference objects from the Vault database, such as surfaces or alignments intoa drawing. These reference objects participate in the design process withinyour local drawing. You can change their style and labeling, but you cannotchange their geometry.
ReferenceAlignments
ReferenceSurface
ParcelDrawing
A user with edit permissions for the reference object can check out the drawingthat contains the master copy and change it. When the edited version ischecked back into the database, any open drawing that contains a referencecopy is updated with markers in the Prospector tree and the Windows SystemTray, advising the user that the drawing does not include the latest versionof the reference object. The user can choose to update the object or not.Whenever a drawing that contains a reference object is opened, it automaticallyretrieves the latest version of the reference object.
70 | Chapter 5 Managing Project Data

Access to Autodesk Vault
When you install AutoCAD Civil 3D, you have the option of installing astand-alone Autodesk Vault database on your computer. This database is goodfor experimenting with project management commands, but it cannot supportmultiple users. The other option is to install the Autodesk Vault server on anetwork, which creates a multi-user production system.
In either case, you can access the Autodesk Vault database on the ToolspaceProspector tab, Master View. Simply right-click the Projects icon and click LogIn. Alternatively, on the Windows Start menu, launch the Autodesk Vaultapplication.
Autodesk Vault Set Up
If you follow a few general guidelines for creating user accounts and databases,you can ensure that your system balances data security with ease of use.
Database Projects and Folders
You can create project directories and folders within either AutoCAD Civil 3Dor Autodesk Vault. However, a drawing can contain objects from only oneproject. In the same project you should include all data and drawings thatcan possibly relate to each other, to facilitate object sharing.
The standard project folder structure for AutoCAD Civil 3D is shown in thefollowing illustration:
Access to Autodesk Vault | 71

In this example, a project named Park Project includes collections of drawings,alignments, and surfaces. Placeholders exist for points, pipe networks, and asurvey database. The object collections, such as Alignments, include all objectsthat are shared within the project, for read-only use by members of the projectteam.
The security framework for project folders is described in the following section.
User Accounts and Roles
Each person using your Autodesk Vault database has one of three main userroles:
■ Administrator
■ Vault Editor
■ Vault Consumer
Permissions can be applied to individual users and to user groups. With carefulplanning, you can minimize the amount of configuration required and createa flexible security system. For example, rather than assigning permissions toeach user, you can save time by creating project-specific user groups or
72 | Chapter 5 Managing Project Data

job-based groups, such as Engineers, Project Managers, and Data Technicians.Then, you can add users to the groups and set permissions once for each group.Later, you can move users from one group to another to change theirpermissions.
Administrator
The Administrator role has the highest level of permissions, and is able to doall tasks on the server and within Autodesk Vault databases. Only anadministrator can create user accounts, user groups, and databases on theserver, and set access permissions. For security purposes, only a few usersshould have administrator permissions, but enough so that an administratoris always available during work hours.
Vault Editor
A Vault Editor has full read-write permissions within Autodesk Vault, and isable to create new projects and folders in the database, add files, and edit files.Assign this user role to anyone who needs to create drawings and share objectswithin the database.
Vault Consumer
A Vault Consumer has read-only access to the database, and is able to getreference versions of objects for use in drawings saved outside of the database.Assign this role to anyone who does not regularly share objects or add drawingsto a project.
Autodesk Vault Set Up | 73

External References (xrefs)You can insert into your current drawing an external reference (xref) of theentire contents of another drawing as a display-only object.
To insert an xref, click Insert menu ➤ External Reference and in the SelectReference File dialog box, insert a specified drawing (.dwg) into your currentdrawing. Objects in the referenced drawing cannot be edited, but you cancontrol the display of separate components with the Layer Manager.
Xref Advantages
Xrefs may be as simple as a single object or as complex as a complete design.Keep in mind that xrefs insert into your current drawing the entire contentsof the drawing. The advantage of xrefs is that they can be used with differentDWG types. Xrefs are ideally used when you will not need to manipulateobjects within the referenced file. They can also be used with either datashortcuts or Autodesk Vault.
Another advantage of using xrefs is that you can label them in your currentdrawing. Because parcel data is not supported by Vault, you can import parcelxrefs and then can annotate them as you would any other object. You canalso create parcel tables using xrefs. It is recommended that you do not labelxref data in the source drawing, but rather in the current drawing.
NOTE Any changes to the source drawing will be reflected in the current drawing’sxref labels.
Xref Constraints
Xrefs are display-only and they provide no access to object data such as surfaceelevations or alignment length. For example, you cannot create a surfaceprofile from a surface in an xref. Both data shortcuts and Vault object referencesprovide access to object data. Xrefs are best used when you do not need toedit objects within the referenced file. Links can be easily moved and referencefiles renamed with ease. Use caution as xrefs do not provide the securitymechanism that Autodesk Vault does.
74 | Chapter 5 Managing Project Data

Data ShortcutsYou can use a data shortcut to import a complete reference copy of an objectinto one or more drawings. Data shortcuts offer great flexibility, and you caneasily learn to use them. The data shortcut method is ideal for use by smalldesign teams in which all members have access to a shared network location.
In this release of AutoCAD Civil 3D, there is a new Data Shortcut Editor thatfacilitates this process. Use this editor to create data shortcuts and folders inwhich to store the reference copies.
Data Shortcut Advantages
Data shortcuts are a convenient way to share object data that is entirely basedon drawings without the complication of maintaining a database. These objectsautomatically update when you open a file in which you have referenced data.Reference objects are data shortcuts that can have styles and labels that aredifferent from the source drawing. Data shortcuts can be used to referencesurface, alignment, profile, pipe network, and view frame group objects.
An example of a data shortcut would be to reference an alignment into adrawing in which you want to create profiles. You can use the data shortcutto keep profiles in a separate drawing from the alignment, to abide by the bestpractice of “one object per drawing.”
For more information about data shortcuts, see Using Data Shortcuts in theHelp system. For Data Shortcut Editor information, see Data Shortcut EditorHelp.
Data Shortcuts | 75

Surface Object
Parcel Drawing
Data Shortcut
Use a data shortcut to reference a surface object into a drawing
Data Shortcut Constraints
Data shortcuts do not provide data versioning or security controls. They shouldbe used only when team members have equal access to project files.
76 | Chapter 5 Managing Project Data

Exercise: Creating a Data ShortcutIn this exercise, you will learn how to create a data shortcut by referencingdata from another drawing. You will reference surface object data into a parceldesign drawing and create a data shortcut from the Data Shortcuts node onthe Toolspace Prospector tab. This exercise also demonstrates how to accessthe new Data Shortcuts Editor and use it to create the reference.
To create a data shortcut in AutoCAD Civil 3D
Open the file C:\ProgramFiles\Autodesk Civil 3D 2009\GettingStarted Guide\GSG_alignments.dwg.Keep the drawing open, but minimizeit for now.Open the file C:\ProgramFiles\Autodesk Civil 3D 2009\GettingStarted Guide\GSG_parcels.dwg.In Toolspace, on the Prospector tab,in Master View, right-click DataShortcuts and click New Data Short-cuts Folder. In the New Data ShortcutFolder dialog box, specify the nameas Data Shortcut Test. Click OK.
1
Exercise: Creating a Data Shortcut | 77

In Toolspace, on the Prospector tab,in Master View, right-click DataShortcuts and click Create DataShortcuts. In the Create Data Short-cuts dialog box, click the check boxto select EG TOPO FINAL to includein the data shortcut. Click OK. Thedata shortcut is created.
2
Maximize GSG_alignments.dwg.In Toolspace, on the Prospector tab,in Master View, expand the DataShortcuts collection. Under Surfaces,right-click EG Topo Final and clickCreate Reference.
3
In the Create Surface Reference dialogbox, click the Source Surface arrow tosee the entire source surface file path.Click OK.
4
In the Prospector Tree, expand theSurfaces collection to verify that theEG TOPO FINAL surface object is dis-played. The data shortcut has beensuccessfully entered and is now refer-enced in the GSG_alignments.dwg.Right-click EG TOPO FINAL and clickZoom. The drawing view zooms tothe surface object as shown here.
5
78 | Chapter 5 Managing Project Data

Now, you will explore the new DataShortcut Editor, which is a separateapplication. This editor can be usedfor bulk operations on data shortcuts.On the Windows Start menu navigateto your list of programs.Open the AutoCAD Civil 3D programgroup and click Data Shortcuts Editor.
6
The editor opens in a separate win-dow. Explore the interface and closethe application.
Exercise: Creating a Data Shortcut | 79

80

Getting Started Exercises
This chapter explains and illustrates the concepts underlying AutoCAD Civil 3D features.Each feature section in this chapter has a corresponding drawing file. Each drawing illustratesthe concepts introduced in that section. You can open the file to see examples of the objectsand their various components. There is also a corresponding exercise for each feature, whichgives you some basic hands-on experience with AutoCAD Civil 3D. The drawings also providea good “sandbox” environment in which to explore product features and settings beyond theexercises.
PointsThe central repository for point information is the project database. The databaseis typically located on a central server and shared by a number of users, whoattach the database to their drawings. However, point presentation is handledin the drawing. Point groups reference the point data directly and are responsiblefor drawing the points. Point groups have an override that forces all points inthe group to use both that group’s preferred point style and point-label style,rather than the styles assigned to the individual points.
You can insert or import points from different sources and in different formats.For example, you can define sets of description keys to help organize theinsertion of points. Description keys use the raw description of incoming pointsto control the creation of each drawing point, including the following actions:
■ Assigning the point to a specific layer
■ Assigning a point style
■ Assigning a point label style
■ Translating the raw description into a full description
■ Rotating or scaling the point symbol
6
81

Points can also be created directly in the drawing, using a wide variety ofmethods, which are all available from the Points menu.
Points Drawing
Open the file: C:\Program Files\AutoCAD Civil 3D 2009\Getting StartedGuide\GSG_points.dwg.
The drawing contains two named views. To go to a named view:
1 Click View menu ➤ Named Views.
2 In the View dialog box, click the view you want. Click Set Current. ClickOK.
82 | Chapter 6 Getting Started Exercises

Pond point group
Landscape Trees point group
Point styleTree-20ft Pinehas labels turned off.
Pond point groupuses the Numberand Elevation Onlypoint label style.
Point label styleManholes includes anarrow and leader line.
Road Centerlinepoint group
StormManholespoint group
Named view: points_all
Named view: points_detail
Some point groups showing different uses of point styles and point label styles
Points | 83

Points: Getting Started Exercise
In this exercise, you open a file that contains points and examine some of theways to manage objects in AutoCAD Civil 3D.
Using points as an example, you will learn how to use an item view of objects,and how to use the Properties dialog box.
To view point lists and edit properties in AutoCAD Civil 3D
Open the file C:\Program Files\Auto-CAD Civil 3D 2009\Getting StartedGuide\GSG_points.dwg.
Click View menu ➤ Zoom ➤ Window.Draw a rectangle in the upper leftcorner to zoom your view of thedrawing so that it looks like this.
1
In Toolspace, click the Prospector tab.Expand the list of point groups, asshown in the illustration.The icon next to each point group in-dicates that you cannot expand thepoint group to the level of individualpoints. You can view the points in theitem view.
2
Click the Road Centerline point groupin the list.An item view of all the points con-tained in the group is displayed inToolspace.Note that you can edit the individualpoints in the item view.
3
84 | Chapter 6 Getting Started Exercises

Right-click the Road Centerline pointgroup. Click Properties.In the Point Group Properties dialogbox, click the Include tab.The point group contains all the pointswith raw descriptions that matchCLRD.
4
In the Point Group Properties dialogbox, click the Query Builder tab.Both tabs point to the same Raw De-scription data. These tabs provide twodifferent ways in which you canmodify a point group.
5
Click the Include tab. Clear the checkbox for With Raw DescriptionsMatching.Select With Numbers Matching. Enter755,757 in the text box.Click OK.Note that only two points remain inthe point group item view.
6
Points: Getting Started Exercise | 85

SurfacesYou can work with two types of surfaces: TIN (triangulated irregular network)and grid. For each of these types, you can create volume surfaces, which aredifferential surfaces created from two existing surfaces. Surface styles definethe appearance of any surface. They can also be used to control the visibilityof any analysis that has been performed on that surface. Watersheds can bedrawn on the surface, with information about the type of drainage area andwhere each area drains to.
Boundaries define the visible area of a surface. Only the area within theboundary is included in calculations, such as for total area and volume. Youcan also define masks to hide or show parts of a surface for editing orpresentation purposes, while still including that area in calculations.
Breaklines are used on TIN surfaces to define linear features that trianglescannot cross, such as retaining walls or streams. Breaklines affect triangulationof the surface.
You can define different sets of contours, for example, for different intervals.Smoothing is provided for the surface object as a whole, which gives betterresults than simply smoothing the contours. In AutoCAD Civil 3D, the buildprocess for surfaces is incremental. Whenever data is added or corrected, thesurface is updated. Each surface has a definition list. This list contains all theoperations performed on the surface. By turning the operations on and off,you can return a surface to a previous state or modify it to support differenttypes of analysis.
Surfaces Drawing
Open the file: C:\Program Files\AutoCAD Civil 3D 2009\Getting StartedGuide\GSG_surfaces.dwg.
The drawing contains two named views. To go to a named view:
1 Click View menu ➤ Named Views.
2 In the View dialog box, click the view you want. Click Set Current. ClickOK.
86 | Chapter 6 Getting Started Exercises

Elevation analysis(colored 3D faces)
Slope arrowsturned on
Breakline
EG surface boundary
FG surface boundary
Contours with smoothing
Watershed analysis(labels turned off)
Named view: surfaces_all
Named view: surfaces_detail
Surfaces showing boundaries, contours, elevation analysis, and slope arrows
Surfaces | 87

Surfaces: Getting Started Exercise
In this exercise, you open a file that contains surfaces and look at some waysto work with styles in AutoCAD Civil 3D.
Using surfaces as an example, you will learn how to create new styles, andhow to use styles to change the appearance of an object.
To create or change a surface style in AutoCAD Civil 3D
Open the file C:\Program Files\Auto-CAD Civil 3D 2009\Getting StartedGuide\GSG_surfaces.dwg.
1
In Toolspace, on the Settings tab, ex-pand the list of surface styles, asshown in the illustration.The triangle icon next to a surfacestyle indicates that the style is appliedto at least one surface in the drawing.
2
Right-click the Finish Grade surfacestyle. Click Copy.In the Surface Style dialog box, on theInformation tab, for Name, enter Fin-ish Grade Contours.
3
88 | Chapter 6 Getting Started Exercises

Click the Display tab.In the Visible column, click the lightbulb icons to turn on both MajorContour and Minor Contour. Turn offElevations and Slope Arrows. Click OK.You have created a new surface style.Next, you will apply it to a surface.
4
In Toolspace, on the Prospector tab,expand the list of surfaces.Click the Surfaces collection in the list.An item view of the surfaces in thedrawing appears in Toolspace.Note that the name of the style as-signed to the FG surface is Finishgrade.
5
Right-click the FG surface in the list.Click Surface Properties.In the Surface Properties dialog box,click the Information tab. For Surface
6
Style, select Finish Grade Contoursfrom the list. Click OK.
The new style is applied to the FGsurface. The drawing is updated.
7
Surfaces: Getting Started Exercise | 89

GradingYou create a grading by selecting a base line in the drawing, and thenspecifying a projection method and target, for example, grade at 3:1 to meetan existing surface. Save time and effort by predefining such values and savingthem as grading criteria. Subsequent gradings you create will use the currentcriteria. You can also create named grading styles that combine specific displayproperties, such as colors. In addition to using the current criteria, any gradingyou create uses the current style.
A grading normally consists of a face bounded by a base line, a target line,and several projection lines. The base line can be any open or closed figurefrom which you want to project the grading. It can be a feature line or a lotline. A feature line is any linear feature in the drawing, such as a ridge line,building footprint, or the bottom of a swale. The target for the grading canbe a surface, a distance, or an elevation (absolute or relative).
Each site can include grading groups, which bundle individual gradings intonamed sets. Before creating a grading, you must create a new grading group,or select one that already exists. A surface can be created from a grading group,and a grading group can be pasted into a surface. The surface will then beupdated if you change the grading.
After you create a grading group, volume tools within AutoCAD Civil 3D showyou the amount of cut and fill required for the grading design. You can raiseor lower the grading group incrementally to adjust volume requirements. Youcan also change the elevation of points along a grading base line, change thegrade of a base line, or modify the grading criteria.
90 | Chapter 6 Getting Started Exercises

Criteria uses slope of 3:1with a surface target
Gradings usingdifferent criteria
Grading group
Base line
Feature line
Projection lineTarget line
Face
.
The components of a grading object
Grading | 91

Grading: Getting Started Exercise
In this exercise, you examine the properties of a grading and adjust its elevationto change cut and fill volumes.
At any time during this exercise, you can look at the grading in threedimensions. To do this, right-click the grading object and click Object Viewer.
To edit a grading in AutoCAD Civil 3D
Open the file C:\Program Files\Auto-CAD Civil 3D 2009\Getting StartedGuide\GSG_grading.dwg.You see a grading that is projected toa surface from a rectangular base line.The grading surface has its own con-tour lines, separate from those of theexisting ground (surface EG). The facesof the grading have a slope patternwith short line segments along theupper edge of the face.
1
Click Grading menu ➤ Grading Utilit-
ies ➤ Grading Volume Tools.This toolbar shows the volume of fillrequired for the grading as designed.
Click to open or close the Historypane.
2
Click to lower the grading groupby one meter.Note the decrease in fill volume. Theupper left corner of the grading is al-most at the ground surface.
3
92 | Chapter 6 Getting Started Exercises

Click to automatically balance cutand fill volumes. Click OK in the Auto-Balance Volumes dialog box.The volumes are balanced, within atolerance factor, and a portion of thegrading is set below the existingground. You can identify cut slopes inthe 2D plan view wherever the shortlines of the slope pattern are on theoutside edge of the grading.
4
Click Grading menu ➤ Create Grad-ing to open the Grading CreationTools.
5
On the Grading Creation Tools tool-
bar, near the right end, click Elev-ation Editor. Click any point along therectangular base line of the grading.The Grading Elevation Editor opens,showing the elevation and grade ateach corner of the base line.
6
As you click each row of the table, atriangular marker appears in thedrawing to mark the correspondingcorner of the base line.You can click in the elevation cell forany row in the table and change theelevation. The related grades changeautomatically.
Grading: Getting Started Exercise | 93

ParcelsAutoCAD Civil 3D provides a site topology that includes intelligent parcelobjects. Each parcel is an independent object that usually represents real estateparcels or lots. You can also import parcels as simple polylines and then convertthem to parcel objects. Parcels consist of a series of segments that can be editedindividually. Editing parcel segments dynamically updates the parcel properties.Deleting a segment can result in one parcel merging with another.
Each site contains one collection of parcels. The hierarchy of parent site andchild parcels is managed on the Prospector tab in Toolspace. The parent siterepresents the original area to be subdivided. By creating a number of separatesites, you can manage large projects with many lots grouped in separate blocks.
You can create parcels one at a time or as a group, with settings for the defaultarea and minimum frontage of each parcel. Parcel layout tools give you precisecontrol over parcel area and the angle of each lot line.
Parcel styles determine the appearance of the parcel, including fill patternsfor the area and linetypes for the segments. There are separate label styles forparcel areas and parcel segments.
Parcels Drawing
Open the file: C:\Program Files\AutoCAD Civil 3D 2009\Getting StartedGuide\GSG_parcels.dwg.
The drawing contains two named views, as shown on the following page. Togo to a named view:
1 Click View menu ➤ Named Views.
2 In the View dialog box, click the view you want. Click Set Current. ClickOK.
94 | Chapter 6 Getting Started Exercises

Segment label
Area label
Parcel styleuses areafill
Right-of-way parcelRegion forresidential lots
Named view: parcels_all
Named view: parcels_detail
Parcels and parcel components
Parcels | 95

Parcels: Getting Started Exercise
In this exercise, you create a series of equal-sized parcels and learn how to editparcel styles and parcel command settings.
Using parcels as an example, you will learn how AutoCAD Civil 3D hasautomated some routine tasks in the design process.
To create parcels and their labels in AutoCAD Civil 3D
Open the file C:\Program Files\Auto-CAD Civil 3D 2009\Getting StartedGuide\GSG_parcels.dwg.Zoom in to the extents of the largeblue parcel, Oak Street_1.
1
Click Parcels menu ➤ Create Parcel ByLayout.In the Parcel Layout Tools dialog box,
if necessary, click to see the de-fault settings for parcel creation. SetAutomatic Mode to On.
2
Click (Slide Angle - Create)to open the Create Parcels - Layoutdialog box. Set the Parcel Style toResidential and the Area Label Style toParcel Name & Area. Click OK.
3
96 | Chapter 6 Getting Started Exercises

Follow the command-line prompts:Pick a point inside the parcel to besubdivided.Pick a frontage start point along thebottom edge of the parcel, near thecurve on the left side.Pick a frontage end point near thecurve on the right side of the parcel.Press Enter to accept default values forfrontage angle (90 degrees) and parcel
4
area (1 acre). The original parcel issubdivided into six. The first one re-tains the original name (Oak Street_1)and style.
Zoom in around a few of the new res-
idential parcels. Click Parcels menu ➤
Add Parcel Labels ➤ Add Parcel La-bels. In the Add Labels dialog box, setthe Label Type to Multiple Segment.Click Add, but do not close the dialogbox. Click the area label of any parcelto automatically add a label to eachsegment of the parcel. Specify whichdirection to add the labels. Click on afew more parcels to label them.
5
In the Add Labels dialog box, set theLabel Type to Single Segment. Set theLine Label Style to Span Bearing-Dis-tance-Crows Feet.Click along the bottom edge of theresidential parcels to place a label forthe line that spans multiple parcels.Curved indicators called “crow’s feet”mark the ends of the labeled line.
6
This label is designed for placementbelow a line. If you apply it to the top
Parcels: Getting Started Exercise | 97

segment of a residential parcel, right-click the label and select Flip Label.
For further exploration, you can editParcel command settings. On theToolspace Settings tab, expand theCommands collection. Right-clickCreateParcelByLayout to display theEdit Command Settings - CreatePar-celByLayout dialog box. Expand theDefault Styles. Set the Parcel Styleproperty to Parent Parcel and click OK.Open the Create Parcels - Layout dia-log box as you did in Step 1 and Step
7
2. Note that the default Parcel Style isnow Parent Parcel.
98 | Chapter 6 Getting Started Exercises

AlignmentsHorizontal alignments are used to represent roads and other linear objectsthat follow a path in space. Alignments can include lines, curves, and spirals,which can be joined by constraints. When you edit an alignment, for example,by dragging a grip, the components of the alignment can maintain tangencyto one another. You can create alignments from existing polylines, or by usingalignment layout tools in AutoCAD Civil 3D. You can edit an alignment eitherby grip editing or by using the edit commands. Some of the creation andediting options are as follows:
■ Draw a series of tangents, then add curves or spiral-curve or spiral-linegroups at the PIs (Points of Intersection).
■ Draw single lines, curves, and spirals.
■ View and edit the dimensions of alignment components.
■ Apply superelevation to the curves along an alignment.
Use station equations to change station-distance references at any pointwithout physically changing the geometry of the alignment.
Alignments Drawing
Open the file: C:\Program Files\AutoCAD Civil 3D 2009\Getting StartedGuide\GSG_alignments.dwg.
The drawing contains two named views, as shown on the following page. Togo to a named view:
1 Click View menu ➤ Named Views.
2 In the View dialog box, click the view you want. Click Set Current. ClickOK.
Alignments | 99

Design speed label
Station label
Major road usesdifferent lineand label stylesfrom local roads
Station referencepoint at startof alignment
Alignments drawnwith tangent-to-tangent curves
Parallel alignmentlabels used forlocal roads
Preliminary centerlines sketchedusing lines andcurves
Named view: alignments_all
Named view: alignments_labels
Alignments: lines, curves, and labels
100 | Chapter 6 Getting Started Exercises

Alignments: Getting Started Exercise
In this exercise, you explore the Alignment Layout toolbar and learn how toedit alignments with grips. You can edit alignments, create new alignments,and use a variety of AutoCAD commands, while still having access to theAlignment Layout Tools toolbar, to perform layout commands. You can editalignment geometry using the Panorama and Layout Parameters windows,and use grip edits to update the alignment dynamically.
To edit alignments
Open the file C:\Program Files\Auto-CAD Civil 3D 2009\Getting StartedGuide\GSG_alignments.dwg.
Click Alignments menu ➤ CreateAlignment by Layout, to open theCreate Alignment - Layout dialog box.Click OK to open the Alignment Lay-out Tools window. Note that thetoolbar stays displayed while you workin the drawing.
1
Alignments: Getting Started Exercise | 101

In the drawing, click the alignment inthe middle of the drawing so that theblue grips are displayed. In the Align-
ment Layout Tools, click to dis-play the alignment’s Panorama vista,which lists alignment entity informa-tion, such as Type, Length, and Direc-
2
tion. Click another alignment and ob-serve that the Panorama vista now liststhe data for that alignment.
Now you will create and edit analignment. Click Alignments
3
menu ➤ Create Alignment by Layout.In the Create Alignment - Layout dia-log box, set the Site to Conway Farms.Click OK.
On the toolbar, click Tangent-Tangent (No Curves).
In the drawing, specify a startingpoint. Observe that data values are
4
populated in the Layout Parametersdialog box. Specify an end point. ClickEnter to end the command. MajorStation Labels are displayed, lookingsomething like this.
Click to select the new alignment. Onthe Alignment Layout Tools, click theAlignment Grid View button to openthe Panorama vista.
5
Click the square grip at the right endof the alignment. The grip turns redto show that it is active. Drag it to theright to lengthen the alignment. Ob-serve that the Length, End Station,and End Point data is updated in thePanorama vista.
102 | Chapter 6 Getting Started Exercises

Now you will explore how to editdrawings using Lines and Curvesdrafting tools. Zoom in on the rightside of the drawing so that it appearsas shown here. First you will create aline perpendicular to an existing line.
Click Lines/Curves menu ➤ Create
Lines ➤ Line Perpendicular From Point.You are prompted to select an arc orline object. Select the top horizontalline in the drawing view. Now select
6
the point where the perpendicular linewill start. Enter 55 to select the lengthof the perpendicular line. The drawingappears as shown here.
Click Lines/Curves menu ➤ Create
Lines ➤ Line Tangent From Point.You are prompted to select an arc orline object. Select the vertical line inthe drawing as shown here.
7
Alignments: Getting Started Exercise | 103

Now select the point where the tan-gent line will start. When prompted,click the line to select the length ofthe tangent line (where it will end).The drawing appears as shown here.
8
Now you will create a curve betweentwo connected lines. Click
Lines/Curves menu ➤ Create
Curves ➤ Curve Between Two Lines.At the bottom of the drawing, selecta horizontal line as the first tangentand then select the connected verticalline. Now you are prompted withmultiple options with which to determ-
9
ine the size of the arc. Select length(L) and enter 111. The drawing ap-pears as shown here. For further ex-ploration, try using the various meth-ods of determining the size of linesand arcs.
104 | Chapter 6 Getting Started Exercises

Now you will convert the newly cre-ated arc entity to an alignment. Click
Alignments menu ➤ Create Align-ment By Layout. In the Alignment
Layout Tools, click Convert Auto-CAD Line and Arc. You are promptedto select an arc or line to convert. Se-lect the arc and observe that it is nowdefined as an alignment.
10
Alignments: Getting Started Exercise | 105

ProfilesProfiles (also known as vertical alignments), are derived from horizontalalignments in the drawing. There are two types of profiles. Surface profiles,often called existing ground (EG) profiles, are extracted from a surface. Layoutprofiles, often called finished grade (FG) profiles, represent a designed surfacesuch as a road. A profile can be dynamic, in which case it is linked to a surfaceto reflect updates to the surface or the horizontal alignment. It can also bestatic, to preserve a record of a surface at a particular time. You can use threetypes of vertical curves in a profile: parabolic, asymmetric parabolic, andcircular.
You create static profiles in various ways, such as importing a text file,importing an XML file, or by using the Profile Layout Tools dialog box. Edita profile by grip editing or by using the edit commands in the Profile LayoutTools dialog box.
Profiles are displayed in graphs called profile views. Profile views are separateobjects that have their own sets of styles. You can add data bands to annotatethe profile view with stations and elevations, horizontal geometry points, orother useful data. You can save several data bands in a set that can be easilyapplied to other profile views.
Profiles Drawing
Open the file: C:\Program Files\AutoCAD Civil 3D 2009\Getting StartedGuide\GSG_profiles.dwg.
The drawing contains two named views, as shown on the following page. Togo to a named view:
1 Click View menu ➤ Named Views.
2 In the View dialog box, click the view you want. Click Set Current. ClickOK.
106 | Chapter 6 Getting Started Exercises

Surface andlayoutprofiles
Profile label shows a tangent grade
Grade break and elevation profilesdefined by profile label styles
Axes and griddefined byprofile view styles
Data bandsdefined byprofile viewband styles
Named view: profiles_all
Named view: profiles_detail
Surface and layout profiles displayed in a profile view
Profiles | 107

Profiles: Getting Started Exercise
In this exercise, you open a file containing profiles and experiment with gripediting in AutoCAD Civil 3D.
Using profiles as an example, you will learn how objects can be dynamicallyupdated in response to changes in another object.
To make dynamic updates in AutoCAD Civil 3D
Open the file C:\Program Files\Auto-CAD Civil 3D 2009\Getting StartedGuide\GSG_profiles.dwg.
1
Click View menu ➤ Zoom ➤ Extents.
Click View menu ➤ Zoom ➤ Window.Draw a rectangle that includes theprofile view at the top and the East-West alignment at the bottom.
2
On the AutoCAD Layers toolbar, click
.In the Layer Properties Manager dialogbox, click the light bulb next to the C-ROAD-PROF-FGRD layer to turn it off.This turns off the FG profile in theprofile view and makes the green EGprofile easier to see.
3
108 | Chapter 6 Getting Started Exercises

In the drawing, click the alignment sothat the blue grips appear, as shownin the illustration.Drag the grips to modify the align-ment dynamically. As you modify the
4
alignment, the profile will update atthe same time.
The green profile in the profile viewat the top of the drawing representsthe intersection of the alignment withthe existing ground surface.The profile looks like this before youmodify the alignment.
5
Click the square grip at the far left ofthe alignment.(Try to watch the green profile as youcomplete the following step.)The grip turns red to show that it isactive. Drag it a little farther to the leftand then release it.
6
Note that the profile has been exten-ded to include the addition to thealignment. It now looks something likethis.(You may want to experiment furtherand see the effect of editing thealignment curves before you close thisdrawing.)
7
Profiles: Getting Started Exercise | 109

SectionsSections, or cross sections, are cut across a linear feature to a specified distanceon the left and right of a center line. Sections are typically sampled at givenstations along a horizontal road alignment. Edits to an alignment update thesections as well.
Sections are located on sample lines that cut across the alignment. Samplelines have their own styles and can be labeled. A set of sample lines makes upa named collection called a sample-line group.
Sections are displayed in a graph called a section view. A section view is verysimilar to a profile view. It consists of a grid or graph with attributes that arecontrolled by section-view styles. You can also display data bands above orbelow the section view. You can plot individual sections for a specific sampleline, or all the sections for a group of sample lines. To plot multiple sections,use a paperspace viewport to set up the sheet.
Sections, like alignments and profiles, support label sets. Label sets enable youto save and apply an unlimited number of different types of labels.
Sections Drawing
Open the file C:\Program Files\AutoCAD Civil 3D 2009\Getting StartedGuide\GSG_sections.dwg.
The drawing contains two named views, as shown on the following page. Togo to a named view:
1 Click View menu ➤ Named Views.
2 In the View dialog box, click the view you want. Click Set Current. ClickOK.
110 | Chapter 6 Getting Started Exercises

Centerline
Right swath width
Data band
Section line
Stations and sample-linenames are displayed bythe sample-line-group labelstyle
Sample lines belong tothe East-West sampleline group
Section viewfor this sampleline is shownbelow
Named view: section_detail
Named view: section_view
A group of sample lines and a section view across one of them
Sections | 111

Sections: Getting Started Exercise
In this exercise, you open a file that contains sections and revisit the processof applying custom styles in AutoCAD Civil 3D.
Using sections as an example, you will learn how to select an individual objectand apply a new style to it.
To change label styles in AutoCAD Civil 3D
Open the file C:\Program Files\Auto-CAD Civil 3D 2009\Getting StartedGuide\GSG_sections.dwg.The drawing looks like this. There areseveral sample lines crossing an align-ment.
1
In Toolspace, on the Prospector tab,expand the list of alignments (underSites/Conway Farms).Expand the East-West Drive alignment.Then expand Sample Line Groups andthe East-West sample line group. Notethe black dot glyph which indicatessample lines exist in the drawing. Clickon Sample Lines to display the list ofsample lines in List View, as shown inthe illustration.Next, you will select one of the samplelines and change the label style.
2
112 | Chapter 6 Getting Started Exercises

Right-click Sample Lines and then clickSample Line Group Properties.In the Sample Line Group Propertiesdialog box, click the Sample Lines taband then, select the row for sampleline 8. Select the Edit Group Labelsbutton.In the Sample Line Labels dialog box,change the label style to Name &
3
Section Marks in the Pick Label Styledialog box, then click OK. Click Apply.Click OK to close the Sample Line La-bels dialog box.
The sample line is updated in thedrawing, as shown in the illustration.Next, you will update the existingsection view for this sample line.
Click View menu ➤ Named Views.Click section_view. Click Set Current.Click OK.
4
In Toolspace, on the Prospector tab,expand Section View Groups. SelectIndividual Section Views.In the List View, right-click the sectionview 3+50.00 (1). Click Properties.
5
In the Section View Properties dialogbox, on the Information tab, for Ob-ject Style, select Standard. Click OK.
6
Sections: Getting Started Exercise | 113

The section view is updated in thedrawing, as shown in the illustration.
7
114 | Chapter 6 Getting Started Exercises

Mass Haul Diagrams: Getting Started Exercise
In this exercise, you will open a file that contains sections and explore theprocess of creating mass haul diagrams in AutoCAD Civil 3D. Use mass hauldiagrams to graphically display a partial or overall view of earthwork volumes.They are used to analyze aspects of the design, such as the distance over whichcut and fill will balance, the amount of material to be moved, and the directionof movement.
To generate a mass haul diagram, your drawing must contain an alignment,a sample line group, and a list of materials. Any corridor from which yougenerate a mass haul diagram will have a baseline alignment, and many willhave one or more sample line groups.
You will also explore the use of the Mass Haul Diagram Creation wizard andlearn how to edit a mass haul line style.
To create mass haul diagrams in AutoCAD Civil 3D
Open the file C:\Program Files\Auto-CAD Civil 3D 2009\Getting StartedGuide\GSG_sections.dwg.
Click Sections menu ➤ ComputeMaterials. In the Select A Sample LineGroup dialog box, Basic Road is theassigned alignment. The sample linegroup is SLG-1. Note that a sampleline group must be selected to createmass haul diagrams. Click OK.
1
The materials exist in the drawing soyou do not have to create them. Inthe Edit Material List dialog box, notethe materials: Corridor surface andBasic Road Corridor Surface - (1)
2
Mass Haul Diagrams: Getting Started Exercise | 115

Click Sections menu ➤ Create MassHaul Diagram.In the Create Mass Haul Diagram wiz-ard, note that the General page spe-cifies the alignment and the SampleLine Group. You can add an optionaldescription to further describe themass haul diagram.
3
Click Mass Haul Display Options orNext. To see the display options, clickthe Choose A Material To Display AsMass Haul Line option. Note the op-tions for volume and grade materials.
4
Click Balancing Options to see theBalancing page, which is used to selectthe free haul distance, as well as thetype, location, and capacity of borrowpits and dump sites. Select the FreeHaul Distance check box.
5
116 | Chapter 6 Getting Started Exercises

Click Create Diagram. Then select apoint in the drawing to insert the dia-gram. The mass haul view diagram iscreated in the drawing.
6
Right-click the black mass haul lineand select Edit Mass Haul Line Style.In the Mass Haul Line Style dialog box,on the Display tab, for Mass Haul Line,double-click Color. In the Select Styledialog box, change the color to red.Click Apply. Click OK. The mass haulline displays as red in the drawing.
7
Pipe NetworksYou can use the pipe networks feature to design and model networks thatsupport the flow and function of a utility system, such as a storm or sanitarysewer.
You build a model of a pipe network using individual parts, much like areal-world pipe network, connecting pipes in your network either with orwithout using structures, such as manholes or catch basins, and adding inletor outlet structures, such as headwalls, to mark the terminating end of a piperun. After you have created your initial network design, you can view and editnetwork parts in virtually unlimited ways within plan view or in a profileview. You can also view the pipe network parts in a section.
Preset design rules control the slope of pipes, their depth relative to a surface,and the sizing of the structures that connect the pipes. This is useful whenyou are designing a gravity system, such as a storm or sanitary sewer.
Pipe Networks Drawing
Open the file C:\Program Files\AutoCAD Civil 3D 2009\Getting StartedGuide\GSG_pipe_networks.dwg.
The drawing file contains three viewports: the pipe network in plan view, theprofile view of some of the network pipes and structures, and the same partsin a section view.
Pipe Networks | 117

The left pane shows a pipe network segment made up of two manholestructures connected by pipes. The network parts have been placed at aspecified offset from an alignment, and are drawn in a profile view createdusing the same alignment (upper-right pane). A sample line placed at station7+71 was used to create a section view (lower-right pane) that shows across-section view of the pipe network parts located at the station.
You can edit the positions of the pipe network parts manually by using editinggrips in either plan, profile, or section view, or by directly editing theirproperties.
Plan view shows the layout ofpipe network parts in relation toother drawing objects Profile view shows the vertical
layout of pipe network parts andalignment
Road section includes cross-sectionviews of pipe network parts
Layout, profile, and section views of a pipe network segment
118 | Chapter 6 Getting Started Exercises

3D view of pipe network segment
Pipe Networks | 119

Pipe Networks: Getting Started Exercise
In this exercise, you edit a simple pipe network. Using the pipe network as anexample, you will learn how to configure the pipe network layout tools, andto use the tools to create a new pipe that connects two structures.
To create pipe network parts
Open the file C:\Program Files\Auto-CAD Civil 3D 2009\Getting StartedGuide\GSG_pipe_networks.dwg.The drawing window shows threeviews of parts in a pipe network: planview, profile view, and cross-sectionview.
1
In Toolspace, on the Prospector tab,expand the collections of Pipe Net-works and Networks. Expand theNetwork – (1) item.When you select the Pipes or Struc-tures item found under the pipe net-work collection, part information isdisplayed in the item view, as shownin the illustration.
2
Right-click Network – (1). Click EditNetwork.
3
The Network Layout Tools toolbarcontains all the tools you need to cre-ate or edit a pipe network, and liststhe names of the alignment and sur-face that are referenced when partsare created.
120 | Chapter 6 Getting Started Exercises

In the Pipe List, select 18 inch Con-crete Pipe.Ensure that the button to the right of
the Pipe List is toggled to (Downslope).
4
Click the button to the right of thePipes list and click Pipes Only.
In the drawing window, in the planview, place your cursor over thestructure that is offset from station7+71 on Conway Farms Drive. A con-nection marker is displayed (shown inthe illustration) that indicates that thepipe will connect to the structure ifyou click at that location.Click the structure to connect the pipeend to it.
5
Pan to the structure that is offset fromstation 1+00 on East-West Drive. Withthe connection marker active, click thestructure to connect the pipe to it.Press Esc to end the command.
Pipe Networks: Getting Started Exercise | 121

CorridorsCorridors are used for roads and similar structures that follow a designed routeacross the terrain.
A corridor is a detailed three-dimensional design that combines data from ahorizontal alignment, a profile view, and an assembly. The corridor canautomatically reflect changes to any of the parent data.
Subassembly objects such as road lanes, curbs, and shoulders form the buildingblocks for an assembly. When you apply the assembly to an alignment and aprofile, a corridor is generated in three dimensions. At each point along itslinear path, the corridor adapts to conditions, such as superelevation and cutor fill requirements.
Corridors Drawing
Open the file C:\Program Files\AutoCAD Civil 3D 2009\Getting StartedGuide\GSG_corridors.dwg.
The drawing contains three viewports. Although the corridor, profile view,and assembly are all within the same drawing, the viewports help you see theobject relationships.
In the left pane, the horizontal alignment starts at the top of the corridor andruns to station 1658 at the bottom. In the profile view, station 0 is on the leftside, and green vertical lines across the grid show the start and end points ofthe horizontal curves. In the assembly view, you can see that the corridorassembly includes two road lanes, a curb on the left, a sidewalk on the right,and side slopes on each side. The side slope subassembly(BasicSideSlopeCutDitch) is designed to create a ditch only on cut slopes, andthe ditches are visible along the corridor.
You can use the Object Viewer to see the corridor in a three-dimensional viewthat shows the cut and fill regions. Click the corridor, then right-click andclick Object Viewer. Click near the bottom of the Object Viewer window, thenclick and move the cursor up to tilt the corridor. If you want to pan or zoomthe display, right-click inside the Object Viewer window.
122 | Chapter 6 Getting Started Exercises

Assembly is a templatefor corridor cross-sections
Profile shows the verticallayout and the surface
Corridor shows the designin relation to the surface
Elements of a corridor design
Corridors | 123

Corridors: Getting Started Exercise
In this exercise, you examine the section views along a corridor anddynamically update the corridor by changing the layout profile.
To review and edit corridor sections
Open the file C:\Program Files\Auto-CAD Civil 3D 2009\Getting StartedGuide\GSG_corridors.dwg.The drawing contains viewports thatdisplay a corridor, profile view, andassembly.
1
Click Corridors menu ➤ View/EditCorridor Section.In the drawing window, click to selectthe corridor.The corridor is replaced with a viewof the corridor cross-section and the
2
existing ground surface at station 0.Note that the fill slopes are shown atthis point.
On the View/Edit Corridor SectionTools Toolbar, select station 5+50.You see the section view at this sta-tion, which is in a fill area along thefirst curve.
3
124 | Chapter 6 Getting Started Exercises

Select station 9+50.This station is on the second curve,where the corridor has deep cutslopes. In the section, you can see theditch that is automatically inserted oncut slopes.
4
If you want to see other sections inthis part of the corridor, click the ar-rows on the View/Edit Corridor SectionTools toolbar.Close the toolbar to close the view ofthe corridor cross-section.
In this step, you change the cut slopenear the beginning of the corridor toa fill slope.In the profile view, click the layoutprofile. The points of vertical intersec-tion (PVIs) are marked with red tri-angles. Click and drag the first PVIupward until the profile is completelyabove the surface. Click to place it inthe new location.
5
The corridor rebuilds, and the cutslope with ditches is replaced with afill slope.
Click the corridor. Right-click, andthen click Corridor Properties.In the Corridor Properties dialog box,on the Surfaces tab, click the SurfaceStyle entry (Standard) and change itto Border & Contours.Click OK twice.When the corridor is rebuilt, contourlines are displayed on the corridorsurface.
6
Corridors: Getting Started Exercise | 125

SurveyYou can use the survey tools in AutoCAD Civil 3D to import survey field data,analyze and correct it, and convert survey data into Civil 3D objects.
Survey data is organized into databases, whose data is visible in Toolspace, onthe Survey tab. The survey databases can either be integrated with yourAutodesk Vault project management database, or stored locally.
Survey Drawing
Open the file C:\Program Files\AutoCAD Civil 3D 2009\Getting Started Guide\GSG_survey.dwg.
126 | Chapter 6 Getting Started Exercises

Survey | 127
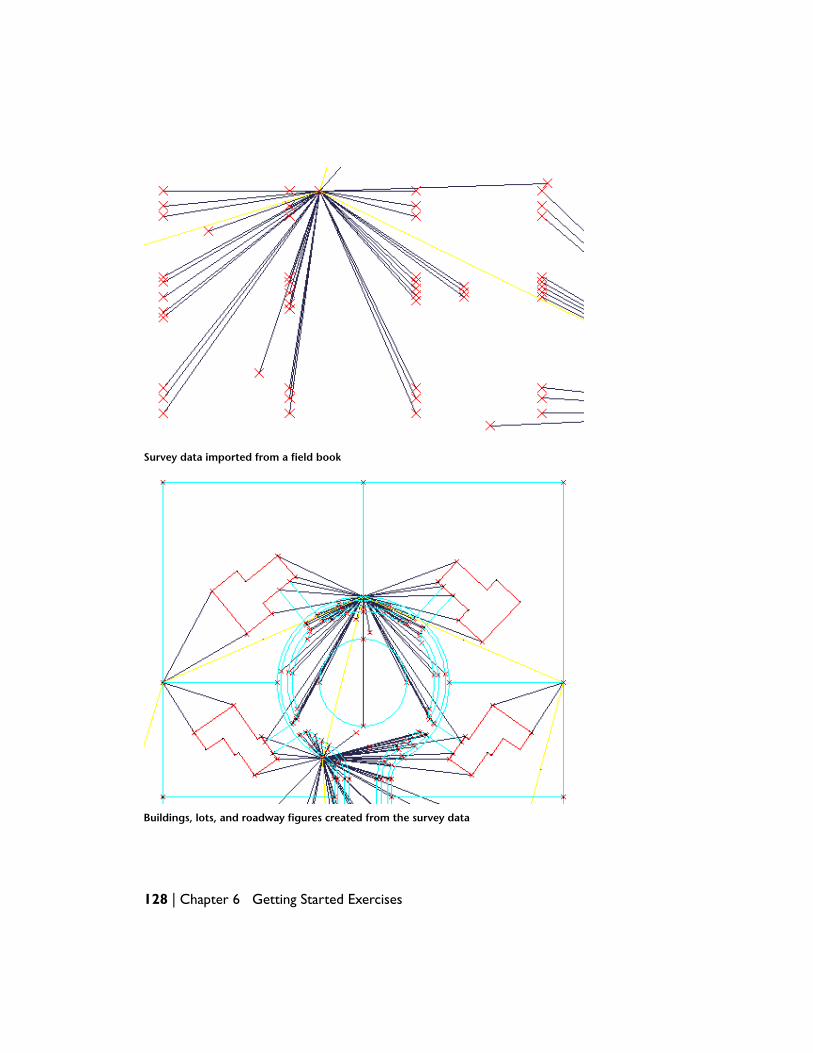
Survey data imported from a field book
Buildings, lots, and roadway figures created from the survey data
128 | Chapter 6 Getting Started Exercises

Survey: Getting Started Exercise
In this exercise, you import a fieldbook data file and create figures thatrepresent buildings, lots, and roadways in a residential area.
NOTE To prepare for this exercise, copy the fieldbook file Cedar-3.fbk fromC:\Program Files\AutoCAD Civil 3D 2009\Getting Started Guide and paste it intoyour Civil 3D Projects folder. Default location of this folder is C:\Civil 3D Projects.
To import a field book
Open the file C:\Program Files\Auto-CAD Civil 3D 2009\Getting StartedGuide\GSG_survey.dwg. Click Survey
menu ➤ Open Survey Toolspace.
1
In the upper left corner of the
Toolspace Survey tab, click (UserSettings). Set Import Defaults to
2
■ Show Interactive Graphics YES
■ Insert Figure Objects NO
■ Insert Survey Points YES
Click OK to close the User Survey Set-tings dialog box.
In the Figure Prefix Databases collec-tion, right-click Sample and click New.In the New Figure Prefix dialog box,set the name to BLDG and the Styleto Building Outline.This setting ensures that each surveyfigure that has a name prefixed with
3
BLDG will be drawn with the presetstyle Building Outline. Click OK toclose the dialog box.
Survey: Getting Started Exercise | 129

Right-click Survey Databases and cre-ate a new database named Forest. InToolspace, expand the Forest data-base, right-click Networks and createa new network named Cedar Proper-ties.
4
Right-click the network Cedar Proper-ties, click Import Field Book, then se-lect the file Cedar-3.fbk. Review theImport Defaults, then click OK.The network of survey points is loadedinto your drawing. Each point is alsoa Civil 3D point object that you cansee on the Toolspace Prospector tab.
5
On the Survey tab, right-click Fig-
ures ➤ Insert Into Drawing.The figures for buildings, lots, andother details are drawn.Further exploration: On the Surveytab, refresh the Figures collection andensure that the figures are visible inthe List View. Then go to the Prospect-or tab, Survey collection. Right-click afigure and click Browse to Survey Data.
6
On both the Prospector and Surveytabs you can right-click a figure andzoom to it.
130 | Chapter 6 Getting Started Exercises

Object and Label StylesThe object styles in AutoCAD Civil 3D have general attributes, such as objectcolor, visibility of components, linetypes, and fill patterns.
Similarly, label styles work with text format, data content, location, and graphicelements, such as leader lines and bounding boxes.
Within your design process, object and label styles should be created withspecific purposes in mind, such as representing objects at different approvalstages, or displaying the right information for different types of users. Beforeyou create object styles, it makes sense to experiment with editing styles fordifferent objects and to learn the available controls.
Style components vary according to object type, but most object and labelstyles are accessible in the same two ways:
■ In Toolspace, on the Prospector tab, right-click an object and clickProperties to see the object style. Some objects also show the label stylehere. Click the list button next to the style name and select Edit CurrentSelection to review or edit the style components.
■ In Toolspace, on the Settings tab, expand the object collection to see allthe styles for that object, organized by types. Right-click any style nameand click Edit to review or edit the style components.
For objects, you can access labels from the main object menu either by clickingAdd <feature> Label or by using the Annotation menu (available when theAnnotation and Drafting workspace is selected).
You can create sets of labels for alignments, profiles, and sections in order tomanage multiple labels easily. After the set is defined, it can be applied to orremoved from an object in a single operation.
The Getting Started exercises for object styles and label styles make use of thesame drawing.
Object and Label Styles Drawing
Open the file C:\Program Files\AutoCAD Civil 3D 2009\Getting Started Guide\GSG_styles.dwg.
Object and Label Styles | 131

132 | Chapter 6 Getting Started Exercises

Object styles for a surface, parcels, and an alignment, showing stylization
Label styles, including two alignment labels in a dragged state
Object and Label Styles | 133

Object Styles: Getting Started Exercise
In this exercise, you examine object styles for alignments and parcels, andlearn how to change the styles.
To review and modify object styles
Open the file C:\Program Files\Auto-CAD Civil 3D 2009\Getting StartedGuide\GSG_styles.dwg.
Click View menu ➤ Named Views, andset the current Model View to Align-ment CloseUp.You now have a good view of thealignment Oak CL, which is drawn inDesign Style.
1
In Toolspace, on the Prospector tab,expand the Sites, Oak Street, andAlignments collections. Right-click OakSt. CL and click Properties. On the In-formation tab, change the ObjectStyle to Plot Style. This demonstrateshow easy it is to change an object’sappearance if you have preset stylesavailable.
2
Click View menu ➤ Named Views, andset the current view to Parcels.In Toolspace, on the Prospector tab,expand the Parcels collection in theOak Street site.
3
134 | Chapter 6 Getting Started Exercises

In Toolspace, on the Prospector tab,right-click one of the parcels, thenclick Properties. In the Parcel Proper-ties dialog box, on the Informationtab, note the Object Style name. Onthe list next to the style name, clickEdit Current Selection to see thecomponents of the style on the Dis-play tab and the Design tab. Feel freeto change style definitions here andapply the results to the drawing. See
4
Style Notes following this exercise forsample style details to change.
In Toolspace, on the Prospector tab,right-click the Parcels collection andclick Properties. Note the Parcel StyleDisplay Order field, which determineshow styles overlap in the drawing.While the Parent Parcel style is at thetop, you see the magenta border ofthe site parcel. Select a different style,then use the Up and Down arrows to
5
move this style to the top. In thedrawing, note that the outer borderof a parcel with the selected style isvisible instead of the magenta border.
Style notes
■ In the Parcel Style dialog box, on the Display tab, use the light bulbs tocontrol visibility of parcel borders and fill patterns.
■ Residential style, used on Oak Street_1, has a fill distance of 50 feet, whichindicates how far in from the border the fill is applied.
■ New Parcels style, used on New Parcels 2 & 5, has fill pattern ANSI31 rotated315 degrees (–45).
Object Styles: Getting Started Exercise | 135

Label Styles: Getting Started Exercise
In this exercise, you examine label styles for alignments and parcels, and learnhow to change them.
To review and modify label styles
Open the file C:\Program Files\Auto-CAD Civil 3D 2009\Getting StartedGuide\GSG_styles.dwg.
Click View menu ➤ Named Views, andset the current view to Label View.
1
On the alignment, click one of theDesign Speed labels. A blue editinggrip appears. Click the grip (it turnsred) and drag it to a new location. Yousee the dragged state of this label. Toreturn the label to its normal place,select it, then right-click and click Re-
2
set All Group Labels. Hold down theCtrl key and click one of the greencurve labels, then right-click and clickFlip Label.
Now we will examine the style settingsfor the design speed labels.In Toolspace, on the Settings tab, ex-
pand the Alignment ➤ Label
Styles ➤ Station ➤ Design Speed col-lection. Right-click the Standard labeland click Edit.
3
136 | Chapter 6 Getting Started Exercises

In the Label Style Composer dialogbox, on either the General or Layouttab, note the Preview window is setto show the Design Speed Label Style.The Preview will change to show theeffects of your changes to style set-tings.
4
On the Layout tab, note that youchange settings separately for threecomponents of this label.Select Design Speed and experimentwith changing the settings on theLayout tab for Anchor Component,
5
Anchor Point, Border Visibility, andBorder Type. Select the Line compon-ent and experiment with changingsettings for Line Length and Angle.
Select the Station Component, selectthe Text Contents value in the right
column, then click . The Text
6
Component Editor dialog box is dis-played. Note that the Properties listprovides many preset values that youcan add to the label by clicking theblue arrow at the upper right.In the editing window on the right,change the text STA to STATION, thenclick OK. The style change is displayedin the Preview. In the Label StyleComposer dialog box, click OK. Thestyle change is displayed in the draw-ing.
Label Styles: Getting Started Exercise | 137

VisualizationYou can use the visualization tools in AutoCAD Civil 3D to create enhanceddesign drawings using model rendering materials that correspond to specificreal world materials in a design. AutoCAD render materials simulate thecharacteristics of materials such as asphalt, concrete, and gravel.
To visualize a material with a render material, the material must be includedin the current drawing. You can easily add materials to a drawing from thetool palette or by dragging materials used in one drawing into another drawing.You can also create a new render material, and save it to use as part of adrawing template or copy it into other drawings.
In AutoCAD Civil 3D, you can apply render materials to features, such assurfaces and surface masks, corridor surfaces and corridor surface boundaries,and pipes and structures.
138 | Chapter 6 Getting Started Exercises

View using Civil 3D styles such as 2D wireframe and 3D realistic
Rendered image of a surface object simulated with grass and the underlying concrete drainagepipes and catch basins
Visualization | 139

Visualization: Getting Started Exercise
In this exercise, you explore how to select AutoCAD render materials tosimulate the appearance of pipe networks. When a pipe is created, the rendermaterial assigned to the pipe is defined in the Pipe or Structure part(s) list.After you add a part to the drawing, you can edit the render material for thepart by using the Render Material option on either the Pipe Properties or theStructure Properties (Information tab) dialog box.
To select render materials
Open the file C:\Program Files\Auto-CAD Civil 3D 2009\Getting StartedGuide\ GSG_pipe_networks.dwg.
1
In the drawing, right-click a pipe seg-ment and select Pipe Properties todisplay the Pipe Properties - Pipe dia-log box. Click the Information tab andnote the Render Material at the bot-tom of the dialog box.
2
140 | Chapter 6 Getting Started Exercises

Click the displayed render material toopen the list of available materials.
Click . You are prompted to selectan object from the drawing. Selectanother segment of the pipe and ob-serve that the Pipe Properties dialogbox is displayed again. Click OK toclose the dialog box.
3
Click View menu ➤ Render ➤ Mater-ials to display the Render Materialsavailable in the drawing. You can usethe tool palette to add, remove, orcreate new render materials for thecurrent drawing. You can also copymaterials from one drawing to anotherdrawing.
4
Visualization: Getting Started Exercise | 141

You can also select render materialsfor pipes or structures by navigatingto the Toolspace Prospector tab. Ex-pand the Pipe Networks collection.Then expand the Networks collectionand expand Network - (1). Click Pipesor Structures to open the Prospectorlist view shown here. Select a pipe andclick its corresponding material in theRender Material column to display theSelect Render Material dialog box.
5
142 | Chapter 6 Getting Started Exercises

Label ObjectsYou manage label objects in AutoCAD Civil 3D with standard AutoCADcommands as well as Civil 3D commands. You can use the AutoCAD Propertiespalette to edit multiple labels in a single operation. For example, you can usethe Properties palette to access the Text Component Editor in order tosimultaneously edit text content for a group of any number of labels. If youare editing a drawing that includes dozens of pipe network parts withcorresponding labels, you can edit the text, change the appearance, or resetthe location of all of the labels at the same time by using multiple selection.It is important to remember that you can also select subentities of group typelabels with the Ctrl-click selection method in order to edit individual labelsone at a time.
As independent objects, label objects are not “subentities” of a parent object.They reside on their own layer, the default of which is controlled using drawingsettings.
The Getting Started exercises for label objects makes use of the same drawingas profiles.
Label Objects | 143

Standard AutoCAD Properties
Label Properties
Label Properties controlled with AutoCAD Properties palette
144 | Chapter 6 Getting Started Exercises

Group Labels Context Menu
Label Objects | 145

Managing Label Objects: Getting Started Exercise
You can use the label objects in AutoCAD Civil 3D to manage multiple labelsby editing one or more properties with the AutoCAD Properties palette. Thelabel objects are versatile. You can select individual label subentities usingCtrl-click in order to edit single labels that belong to the group.
Label objects are controlled using standard AutoCAD commands in theProperties palette. You can control properties such as color, layer, linetype,and lineweight in addition to the label style and placement options.
In this exercise, you will explore how to manage labels with the AutoCADProperties palette. Using profile labels as an example, you will learn how toedit a group of label objects and also how to select and edit a single labelobject. You will also explore how to use grips to manage label placement.
To manage labels
Open the file C:\Program Files\Auto-CAD Civil 3D 2009\Getting StartedGuide\GSG_profiles.dwg.
Click View menu ➤ Zoom ➤ Window.Draw a rectangle in the top center tozoom your view of the drawing so thatProfile View: East-West Drive displaysat the top as it does in this illustration.On the profile, double-click one of theEG labels. The group of labels is high-lighted with square grips as shown
1
here. Note that the label group styleis Standard and the labels are blue.The Properties palette is also dis-played.
146 | Chapter 6 Getting Started Exercises

In the Properties palette, under La-beling, click Profile Grade Break LabelStyle and change the setting fromStandard to Grade Over Elevation.Note that the entire label group hasnow changed to the Grade Over Elev-ation style. The result is shown in theillustration.Note that you can access the SelectStyle dialog box by selecting Cre-ate/Edit. From this dialog box, you canopen the Label Style Composer by se-lecting Edit Current Selection.
2
Now you will select a subentity of thelabel group and change its style.Zoom out of the drawing so that youcan see several components of the la-bel group.Use CTRL-click to select one of the la-bels. Note that only this label is high-lighted (with the blue square grip) asshown in the illustration and theProperties palette is displayed.
3
Managing Label Objects: Getting Started Exercise | 147

Change the Label Style setting toStandard and note that the label stylereverts back to Standard. The label isnow blue. The result is shown in theillustration.
4
Now you will learn how to reset labellocation. Click the label you selectedin Step 3. The grip color is now red,indicating that it can be moved.Drag the label with the square gripand move the cursor away from thegrip. The square grip is blue and an-other round blue grip is visible along-side the square grip. This round gripis a reset grip which can be clicked torestore the label to its original loca-tion. Click the round grip. You can
5
make multiple drag edits to the labeland the reset grip will reset the labelto its original location. If you move anumber of group labels, right-click alabel and select Reset All Group Labels.
148 | Chapter 6 Getting Started Exercises

Plan Production ToolsUse the Create View Frames and Create Sheets wizards to create sheets thatautomatically display segments of alignments and profiles in your plans. Youcan create view frame groups that automatically capture predefined areasalong an alignment.
Instead of needing to manually create many viewports on layouts to showsegments of alignments, you can create view frames that automatically capturepredefined areas along an alignment. View frames are rectangular areas alongan alignment that represent what is displayed in the associated viewports onthe layouts (sheets) to be created. This automation saves you from makingmany manual changes when your design data changes.
The plan production tools simplify the process of preparing sheets from yourdesign drawings. After you select an alignment in your drawing, in just a fewseconds you can create sheets that automatically display the desired data. Forinformation about Sheet Set Manager or the plotting or publishing processes,see the AutoCAD Help. For information about Plan Production tools, see PlanProduction Tools in the Help system.
Plan Production Tools | 149

Creating View Frames and Sheets: Getting StartedExercise
In this exercise, you will learn how to use the plan production tools to prepareyour design for plotting or publishing. You will use the Create View Frameswizard to quickly create view frames along an alignment. Then, you will createsheets using the Create Sheets wizard.
To create view frames and sheets in AutoCAD Civil 3D
Open the file C:\ProgramFiles\Autodesk Civil 3D 2009\GettingStarted Guide\GSG_alignments.dwg.
Click General menu ➤ Plan Production
Tools ➤ Create View Frames.
1
In the Create View Frames wizard, onthe Alignment page, in the Alignmentlist, make sure that Conway FarmsDrive is selected.
2
150 | Chapter 6 Getting Started Exercises

Click Next to open the Sheets page.On the Sheets page, in the Sheet Set-tings section, make sure that Plan AndProfile is selected.
3
Click the Create View Frames button.The view frames are displayed alongthe alignment in the drawing window.
4
Now using the Create Sheets wizard,you will create sheets from the viewframes that you created.
5
Click General menu ➤ Plan Produc-
tion Tools ➤ Create Sheets.
Creating View Frames and Sheets: Getting Started Exercise | 151

In the Create Sheets wizard, on theView Frame Group And Layouts page,in the View Frame Group area, selectVFG - Conway Farms Drive - (1).In the Layout Creation area, select AllLayouts In The Current Drawing.Click Create Sheets to close the wizardand create the sheets.
6
At the “To complete this process yourcurrent drawing will be saved”prompt, click OK. Then, click a blankarea in the drawing to insert the viewframes.After the progress dialog box is dis-played, note that the new sheets arecreated in the current drawing. In theSheet Set Manager, right-click andopen one of the sheets.
7
The sheet is displayed as shown here.For more information, see Work withSheets in a Sheetset in the AutoCADHelp.
8
152 | Chapter 6 Getting Started Exercises

Glossary
2D polyline A polyline with all vertices at the same elevation.
3D face An AutoCAD object that represents the surface of a 3- or 4-sided area,with each vertex potentially at a different elevation. You can view TINs(Triangulated Irregular Networks) as 3D faces. Using the SHADE command,you can shade 3D faces. Using the RENDER command, you can render the 3Dfaces. See also TIN surface.
3D polyline A polyline with vertices at varying elevations.
A.A.S.H.T.O. American Association of State, Highway, and TransportationOfficials.
acre A measure of land: 160 square rods; 4,840 square yards; 43,560 squarefeet.
alignment A series of 2D coordinates (northings and eastings), connected bylines or curves, used to represent features such as the road centerlines, edgesof pavement, sidewalks, or rights-of-way.
angle The difference in direction between two convergent lines measured inthe units of degrees, radians, or grads.
area The quantity of plane space in a horizontal plane enclosed by theboundary of any polygonal figure.
assembly The combination of one or more subassemblies forming a typicalsection. The assembly is applied along a horizontal/vertical alignment to forma singular path-like structure.
azimuth A clockwise angle measured from a reference meridian. Also knownas north azimuth. It can range from 0 to 360 degrees. A negative azimuth isconverted to a clockwise value.
base line The object to which grading criteria are applied. A base line can bean open or closed 2D or 3D geometric figure that is a feature line or a lot line.See also control region, feature line.
Glossary | 153

base surface An existing ground or undeveloped terrain. Specified whencreating volume surfaces. See also comparison surface, volume surface.
bearing An angle measured from North or South, whichever is nearest, withthe added designation of East or West. The angle is always less than 90 degrees(PI/2 radians or 100 grads) and is usually referenced by a quadrant number.
border (surface) The visible limits of a surface. The border may or may notbe defined from a boundary or may be the result of a defined boundary andoperations performed on a surface, such as a Delete Line operation (a hole iscreated in the surface). If a boundary is not defined on a surface, the exteriorborder is always defined as the extents of the surface triangulation.
boundary (surface) One of three kinds of closed polylines that limit thedisplay area of the digital terrain model. Most common are outer surfaceboundaries constructed just outside the extremities of the dataset, eliminatingunwanted interpolations across empty space where the surface has a concaveshape. Also used are two types of internal surface boundaries: hide boundaries,to punch holes in a surface, (for example, a building footprint), or showboundaries, to create smaller surfaces by eliminating areas that fall outsidethe boundary.
bounded volumes A method of calculating volumes using an existingAutoCAD object (for example, a polyline or polygon) to calculate the cut, fill,and net volume for the area bounded by the object.
breakline A line used to connect the data representing a distinct surfacefeature, like a ridge line, edge of pavement, toe of a slope, centerline of a road,or flowline of a ditch or stream. When a breakline is defined, the surfacetriangulation must first follow the breaklines, by placing triangle edgescoincident with the breakline segments. This ensures the feature in the modelis accurately depicted. Then, the rest of the interpolation is performed basedon proximity. Breaklines are typically critical to creating an accurate surfacemodel. It is the interpolation of the data, not just the data itself, thatdetermines the shape of the model. See also non-destructive breakline.
breakline point A point that is included in the list of vertices for a definedbreakline.
ByBlock A setting specifying that a component of an object inherits the coloror linetype associated with the object, or block, that contains it.
ByLayer A setting specifying that an object or component of an object inheritsthe color or linetype associated with the assigned layer.
catchment area The area tributary to a lake, stream, or drainage system.
154 | Glossary

chord A straight line connecting two points on a curve: the Point of Curvature(PC) and Point of Tangency (PT). The curve joins with a line or another curveat these points.
clothoid spiral A spiral in which the curvature is a linear function of thelength of the spiral, so that the degree of curvature is zero when it meets thetangent and then increases to match the curvature of the adjacent curve. Seealso compound spiral, simple spiral.
COGO Short for Coordinate Geometry.
COGO points The point objects that you create using the point-creation orpoint-import commands. COGO points are referred to simply as “points” inthis documentation. The pieces of data associated with a point, such as pointnumber, northing, and easting, are referred to as properties. See also properties.
comparison surface A proposed or existing terrain surface used in the creationof volume surfaces. See also base surface, volume surface.
composite volumes A method of calculating volumes using top and bottomsurfaces (a surface pair) to establish cut, fill, and net volume values.
compound curve A curve consisting of two or more arcs of different radiicurving in the same direction, and having a common tangent or transitioncurve at their point of junction.
compound spiral A spiral that provides a smooth transition between twoadjoining curves of different radii but in the same direction. It has a finiteradius on either side/end. See also clothoid spiral, simple spiral.
contour A line that connects points of the same elevation or value relativeto a specified reference datum.
control region A region that is defined by applying grading criteria to a baseline. A base line can have a single region along its entire length, or it may besubdivided into a number of control, transition, and void regions. See alsobase line, feature line.
coordinates Values that specify exactly where a point is in space in terms ofthree planes: X, Y, and Z (easting, northing, and elevation).
corridor Any path, the length and location of which is typically governed byone or more horizontal and vertical alignments. Examples are roadways,railways, traveled ways, channels, ditches, utility runs, airport runways, andtaxiways.
crest curve In a profile, a vertical curve on the crest of a hill or similar locationwhere the grade leading into the curve is greater than the grade leading out
Glossary | 155

of the curve. In a crest curve, the point of vertical intersection (PVI) for thetangents is above the curve. See also sag curve.
cross section See section.
CS See curve to spiral.
curve to spiral A point on a horizontal alignment where a curve meets aspiral.
cut slope The slope created when the base line falls below the existing groundline. The resulting slope matching up into the existing ground is called a cutslope because the existing ground must be cut (removed) during construction.
data band A graphic frame that is associated with a profile view object orsection view object. The data band contains annotations for the profile orsection view, as well as for the parent horizontal alignment. Some commonannotations include elevation data, stations, and cut/fill depths.
data collector A device surveyors use to automatically record the observationdata they collect in the field. The raw survey data is downloaded and convertedinto a field book file, which is written in the Survey Command Languageformat, or a LandXML file, which uses the LandXML schema to describe theSurvey data. Surveyors can then import this file to create points in the databaseand figures in the drawing.
datum A reference value. All elevations or coordinates are set relative to thisvalue. In surveying, two datums (horizontal and vertical) are generally used.
For global coordinate systems, a datum refers to the ellipsoid information andthe techniques used to determine positions on the Earth’s surface. An ellipsoidis part of a datum definition.
daylight line A line showing the line of zero cut or fill within the job area.Daylight lines are also known as match lines.
decimal degree The measure of an angle in decimal units. For example,3°30'36" equals 3.51 decimal degrees.
definition list A list that contains all the operations performed on a surface.By turning the items in the list on and off, you can modify the surface, returnit to a previous state, and so on.
degrees, minutes, seconds (DMS) A representation of an angle in degrees,minutes, and seconds in which a full circle contains 360 degrees, each degree60 minutes, and each minute 60 seconds. A typical bearing in DMSmeasurement looks like: N45°45'58"E. Using this format, 3°30'36" is enteredas 3.3036.
156 | Glossary

Delaunay triangulation A calculation method used in the creation of TINnetworks. Given a set of data points, Delaunay triangulation produces a setof lines connecting each point to its natural neighbors.
DEM (Digital Elevation Model) An array of elevations taken on a regularlyspaced horizontal grid.
description keys A method of translating descriptions to help standardizepoint data when a variety of data sources are used. For example, descriptionsof EROAD, EPAVE, ERD, and EDGEROAD can all be translated to a descriptionof EOP. The layer, point style, and point label style options can greatly enhanceautomatic base plan generation and the overall organization of the drawing.
design rule A set of automatic constraints for some objects in the drawingthat are enforced by applying a specific style. For example, if you are layingout alignments, you can specify a rule for a curve radius.
drawing object An object that exists in a single drawing. See also projectobject.
easting A linear distance eastwards from the North-South line which passesthrough the origin of a grid. Equivalent to the X coordinate in an XYZcoordinate system.
elevation The vertical distance from a datum to a point or object on theEarth's surface. The datum is generally considered to be at sea level. Equivalentto the Z coordinate in an XYZ coordinate system.
face A three-dimensional surface triangle. A face is represented by either a 3Dface object or 3D line objects.
feature line An object in AutoCAD Civil 3D that the grading commands canrecognize and use as a base line. Usually, a line that marks some importantfeature in the drawing, such as a ridge line, or the bottom of a swale. See alsobase line, control region.
fill slope The slope created when the base line falls above the existing groundline. The resulting slope matching down into the existing ground is called afill slope because material must be brought in to fill the area duringconstruction.
fixed entity An alignment entity with a fixed position, not necessarily tangentto another entity for the definition of its geometry. See also float entity, freeentity.
float entity An alignment entity that is tangent to one other entity (beforeor after) for the definition of its geometry. See also fixed entity, free entity.
Glossary | 157

footprint vertices The endpoints that define the segments of a footprint withan XYZ location and stationing starting at the first vertex.
free entity An entity that is tangent to two other entities (before and after)for the definition of its geometry. See also fixed entity, float entity.
full description The expanded description of a point after description keymatching has taken place.
geodesic On a surface, the shortest line between two points, either a line orcurve from one point along an ellipsoid to another.
geodetic A basic relationship to the Earth that takes into account the curvatureof the Earth’s sea level surface. For example, a geodetic distance is a distanceor angle in which the Earth's curvature is taken into account, versus a distanceor angle measured on a flat paper map.
grade A method of reporting ground inclination in which the change inelevation is expressed as a percentage of the horizontal distance travelled. Forexample, if the ground rises one linear unit (meter or foot) over a horizontaldistance of five units, the grade is 20%. See also slope.
grade line See layout profile.
grading The process used to model the finished ground surface.
grading criteria The parameters that describe how a grading is accomplished.Two main components of grading criteria are the target type and the projectionmethod.
grading face The area bounded by the base line, the target line, and the twoprojection lines. See also grading target, target line.
grading target The grading target defines what the projection lines from thefootprint will intercept. The three choices for targets are: surface, relative orabsolute elevation, and distance. See also grading face, target line.
grads A system of angle measurement in which one grad equals 1/100 of a90° angle, or 360° = 400 grads.
grid A system of lines parallel to a given set of axes at a specific spacing. Gridsare used to visualize surfaces and calculate volumes. A grid is also used forgeodetic purposes.
grid distance The distance between two points based on a coordinate zone,not on local northing and easting coordinates.
158 | Glossary

grid easting The easting coordinate that is based on a selected coordinatezone, as opposed to the local easting, which is based on the surveyor’s basepoint. See also local easting.
grid northing The northing coordinate that is based on a selected coordinatezone, as opposed to the local northing, which is based on the surveyor's basepoint. See also local northing.
grid surface A type of surface created from a DEM or SDTS file, or importedfrom a LandXML file. A grid surface consists of a sampled array of elevationsfor a number of ground positions at regularly spaced intervals.
grid volume surface A differential grid surface based on user-specified baseand comparison surfaces. The grid method of volume calculation measuresthe difference in elevation between two surfaces at each intersection in auser-defined grid.
grip A moveable point on an object that you can drag to edit the objectdynamically.
hectare A measure of area, generally relating to land, of 10,000 square metersor approximately 2.47 acres.
intersection The point where two or more lines, arcs, figures, or objects joinor cross in two- or three-dimensional space.
Kriging A method of surface smoothing that uses known values and asemivariogram to determine unknown values. Based on the semivariogramused, optimal weights are assigned to known values to calculate unknownones. Since the variogram changes with distance, the weights depend on theknown sample distribution.
label component Text, a block, direction arrow, line, or tick that is used toconstruct a label style. Label styles can be made up of multiple labelcomponents.
label set A collection of label definitions for multiple label types, such asstation labels and geometry point labels. For example, alignment stationlabeling can be composed of major station labels, minor station labels, andgeometry point labels.
latitude The angular distance measured on a meridian north or south fromthe equator.
layout profile A profile object that represents the finished ground elevationsalong a horizontal alignment or other linear feature that supports profileviews. Typically this data is designed, not derived from a pre-existing source,and consists of a series of vertical tangents connected by vertical curves located
Glossary | 159

at each point of vertical intersection (PVI). This profile is also known as verticalalignment, profile grade line, grade line, and finished grade profile.
layout toolbar A floating, dockable toolbar that groups together object-specificdesign and editing tools.
local copy An object that is contained in a drawing that is attached to aproject. Compare with official copy.
local easting The easting coordinate that is based on the surveyor's assumedhorizontal base point, as opposed to the grid easting, which is based on theglobal coordinate zone. See also grid easting.
local elevation The elevation coordinate based on the surveyor's assumedvertical base point, or benchmark, versus a real world elevation value.
local northing The northing coordinate that is based on the surveyor'sassumed horizontal base point, as opposed to the grid northing, which isbased on the global coordinate zone. See also grid northing.
longitude The angle between the plane of a given meridian and the plane ofthe Greenwich meridian.
mask (surface) A polygon used to mask the visible portions of the surface.
masking A process of obscuring objects so that text can be placed over themin a clear area. Masking maintains legible text without destroying the objectsunderneath.
match line See daylight line.
mid-ordinate On a circular arc, the distance from the midpoint of a chordto the midpoint of the subtended arc.
modifier A formula for formatting property field values, such as decimalprecision for an area. You can use predefined modifiers, such as acres, feet,and meters, or you can define a custom modifier. See also property fields.
Natural Neighbor Interpolation (NNI) A method of surface smoothingsupported on TIN surfaces. NNI uses Delaunay triangulation to determine theelevation of an arbitrary point based on the elevations of known neighborpoints.
non-destructive breakline A breakline that is not crossed by triangulationlines in a TIN. Instead, new vertices are added to the breakline at theintersection of each TIN line and the breakline. The new points createadditional surface triangles. This is useful when you do not want the elevation
160 | Glossary

of a surface to be interpolated inside an area that you know to be a constantelevation. See also breakline.
northing A linear distance northwards from the East-West line which passesthrough the origin of a grid. Equivalent to the Y coordinate in an XYZcoordinate system.
object In AutoCAD Civil 3D, an element in a drawing, for example, a point,surface, alignment, or profile, that can maintain a relationship with otherobjects.
object model The underlying system of links and dependencies betweenobjects. In the object model, changes in one object can be passed onautomatically to all the objects associated with it.
object reference A read-only copy of an object in the project database. Thereferenced object can be used in multiple drawings and stylized locally. Whenthe official copy of the object is updated in the database, drawings withreferences to it are notified of the opportunity to update their local copy.
official copy An object that is contained in the project database. Comparewith local copy.
override A value for a setting that replaces the value already set at the nexthigher level.
Panorama A window that displays data in table form for the objects in acollection that is selected in Toolspace. For example, if you select a pointgroup, the Panorama table displays a row for each point.
parcel A discrete piece of 2D area. For example, a subdivision is composed ofnumerous parcels. Synonymous with lot.
parcel node A point where two or more parcel segment ends join.
parcel segment A parcel boundary element, a line or a curve.
pass-through point A point on the path of a line or curve, often used to definean alignment. A pass-through point on a curve can be used as a grip to controlthe position of the curve. However the alignment is edited, its geometry hasto go through the pass-through point.
passing sight distance The distance measured to a point where an approachingvehicle comes into view ahead of a driver on an undivided road. This is usedto calculate vertical crest curves.
PC See point of curvature.
PI See point of intersection.
Glossary | 161

pipe An object that connects structures in a pipe network, often to conveyfluid in a utility system.
pipe network Collection that manages pipe objects and structure objectsrepresenting the physical structure and function of a utility system such as astorm or sanitary sewer.
plan readable Text that can be read easily in a normal plan view, that is,placed at an angle less than 270 degrees and more than 90 degrees. Also calledright-reading.
plan view The view of a site if you look straight down from an elevatedposition.
point group Collection used to group the points in a project into smaller,more manageable units. For example, you can create a point group thatcontains all of the points in a project that meet certain elevation criteria.
point list The list of the points that belong to a point group.
point marker See point symbol.
point of curvature The point where an arc is drawn from a tangent.
point of intersection The point where two tangents meet on a horizontalalignment. Curves and spirals also have points of intersection, which indicatewhere the tangents would meet if they were extended outward.
point of tangency The point where a curve meets a tangent.
point of vertical intersection In a profile, the point where two tangent linesmeet.
point symbol A point location marker. When you add points to a drawing,point symbols are created to represent the points. The point style referencedby a point describes how the point symbol is drawn.
polyface A 3-dimensional (polygon) mesh object. Each face is capable ofhaving numerous vertices.
profile An object that contains elevation data along a horizontal alignmentor other line. There are two main types of profiles: surface and layout. Profiledata objects can be viewed within a profile view object.
profile grade line See layout profile.
profile view An object that manages the graphic display of profile data objectswithin a drawing. A profile view is essentially a graph with two primary axes:the X-axis represents horizontal distance along the referenced horizontal
162 | Glossary

alignment (or other linear feature). The Y-axis represents elevations. Profileview objects can also include grid display components and data bands.
project object An object that has been added to a project. See also drawingobject.
projection lines In a grading, the lines that designate face edges within aregion for break points on the base line or the target line, and for the facetsof curves (corner cleanup, vertical curves).
properties The settings that apply to a particular instance of an object.
property fields The placeholders in labels that contain content, such as textor graphics, along with format modifiers unique to specific features. Propertyfields can be named and their values defined according to the feature withwhich they are associated. See also modifier.
Prospector tab The part of Toolspace where you access drawing and projectobjects. Objects are arranged in a tree or hierarchy with folders and subfoldersthat you navigate through in standard, Windows-Explorer fashion. See alsoSettings tab.
proximity breakline A breakline that is drawn as a polyline without snappingto points in the drawing. The northing, easting, and elevation of the breaklinevertices are determined from the nearest point contained in the surface pointdata, after generating the surface.
PT See point of tangency.
PVI See point of vertical intersection.
quadrant One of the sections resulting from dividing a circle into four equalparts. Quadrant 1 is the NE corner, and quadrants 2, 3, and 4 proceed clockwisearound the compass. Bearings are usually referenced by quadrant number.
quantity takeoff The analysis of detailed cut and fill requirements along analignment. A quantity takeoff report provides information on the total volumeof material required to create a finished grade surface, including the processof cutting existing ground and refilling it with a different material, such ascoarse gravel.
radians A system of measure in which 2 pi radians equals 360°.
raw description The original description of a point, before description keymatching takes place. Often corresponds to the point description entered inthe field by a surveyor.
Glossary | 163

raw station A station value on an alignment, either formatted or unformatted,that does not take into account any station equations applied to the alignment.
region (grading) The area where grading criteria is applied to a lot line or afeature line.
region lines The projection lines that designate the start and end of thegrading regions (criteria or transition) by connecting the base line to the targetline.
right of way The allowable work area for an alignment. Property lines of theproperty owners who reside adjacent to the construction site generally specifythese limits, which are called right-of-way lines.
right-of-way parcel A parcel that is created from an alignment that crossesthe original parent parcel.
ROW See right of way.
sag curve In a profile, a vertical curve at the bottom of a valley or similarlocation where the grade leading into the curve is less than the grade leadingout of the curve. In a sag curve, the point of vertical intersection (PVI) for thetangents is below the curve. See also crest curve.
sample The process of obtaining elevation information from an existingterrain model or surface.
sample line A line that typically cuts across an alignment, and that can beused for creating cross sections.
SC See spiral to curve.
SDTS See Spatial Data Transfer Standard.
section An object that contains elevation data along a sample line.
settings A collection of properties and styles that apply to an object.
Settings tab The part of Toolspace where you access the styles for the differenttypes of objects, including object labels and tables. See also Prospector tab.
shortcut menu A menu that is displayed when you select an object and thenright-click. Shortcut menus are context-sensitive. Only commands that arerelative to the object that you selected are displayed.
simple spiral A spiral where the large radius end has an infinite radius andthe small radius end has a finite radius, therefore providing a smooth transitionfrom a tangent (infinite radius end) to a curve (finite radius end). See alsoclothoid spiral, compound spiral.
164 | Glossary

site A collection of objects that are managed via a common topology. Theobjects that participate in the topology are parcels, alignments, and grading.See also topology.
slope A method of reporting surface inclination as a ratio that expresses thehorizontal distance in which the elevation changes by one linear unit. Forexample, if the ground rises 3 units over a horizontal distance of 15 linearunits (meters or feet), the slope is 5:1 (5 to 1). See also grade.
slope projection The method of grading to a target that is either Slope (H:Vvalue) or Grade (percentage value).
Spatial Data Transfer Standard (SDTS) A file format designed as a mechanismfor the transfer of spatial data between various computer systems. The SDTSformat is designed to transfer data with complete content transfer (no loss ofinformation).
spiral See clothoid spiral, compound spiral, simple spiral.
spiral to curve A point where a spiral meets a curve.
spiral to tangent A point where a spiral meets a tangent.
spot elevation The elevation of a single point in the drawing. Used whengenerating a TIN using contour information to define areas that are sparse incontour data. Areas that may also need spot elevations are the top of hills,valleys, and bottom of swales.
ST See spiral to tangent.
stacked text When a label is dragged from its point of origin, label text canbe re-arranged by specifying settings for text justification, text height, andrelationship to borders.
standard breakline A breakline defined from selecting consecutive pointsor point numbers, or selected 3D polyline or 3D line objects.
station A distance along a horizontal alignment.
station equation A point on an alignment that defines a change in the stationvalues after that point.
stationing The labeling that provides a reference when talking about a specificpoint along the reference base line.
stopping sight distance The distance required to safely stop a vehicle, travelingat design speed, to avoid a collision with any other non-moving objectsobstructing the travel path.
Glossary | 165

stratum The difference between two surfaces that exist in a drawing, usuallythe existing ground surface and a finished ground surface, which is used forcalculating volumes.
structure A pipe network object that represents a specific engineering functionin the design, such as a manhole, catch basin, or headwall.
style A logical collection of settings that applies to a class of objects (surface,alignment, and so on). Styles simplify the process of applying settings bysimply referencing a style. Modifying a style affects all the objects referencingthat style.
subassembly An individual segment or portion of a physical corridor design.Examples of subassemblies include lanes, curbs, and shoulders.
subdivision An unimproved tract of land surveyed and divided into parcelsfor purposes of sales.
surface A network of elevation data (either TIN or Grid). The points of asurface are connected into either triangles or a grid, which are then used tointerpolate contours, and to generate profiles and cross-sections. A surfacerepresents the ground condition at a particular time or event.
surface border See border (surface).
surface boundary See boundary (surface).
surface distance The distance between two points, measured along the groundsurface. On a sloped surface, the distance between two points can also bemeasured as a horizontal distance and a vertical distance.
surface profile A profile object that represents existing ground elevationsalong a horizontal alignment or other linear feature that supports profileviews. Typically, this data is derived from an existing surface or data file, andconsists of a series of connected vertical tangent lines without vertical curvesdefined. Vertical curves can be added if required.
surface smoothing A process that interpolates and extrapolates surface datato derive additional elevation values. Kriging and Natural NeighborInterpolation (NNI) are the two methods of surface smoothing.
Survey tab The tab in Toolspace where you access and manage survey settings,survey-related databases, and survey project data.
tangent A straight line segment that forms part of a horizontal alignment orprofile. Tangent distances are measured as the horizontal distance betweenthe two end points.
166 | Glossary

target The element of grading design criteria that determines what the gradingis going to intercept. A target can be a surface, absolute elevation, relativeelevation, or distance.
target line In a grading, the target line is either the resulting geometry createdby applying grading criteria to a base line, or a lot line that was selected asthe target. See also grading face, grading target.
template A collection of default settings and styles used to create a drawing.
terminators Graphics, such as arrowheads, ticks, or crow’s feet, that aredisplayed at the end of lines, arcs, or spirals.
tick A component of a label that is usually a mark (or short line) inserted ina series at perpendicular angles to another object, such as a line or curve.
TIN surface Triangular Irregular Network. A TIN is the most common methodof interpolating elevation data. The points are connected into triangles thatare used to interpolate for contours, and to generate profiles and cross-sections.The lines that make up the surface triangulation are called TIN lines. See also3D face.
TIN volume surface A differential surface created from a composite of pointsbased on base and comparison surface. Also known as a differential surface.
Toolspace A window that provides an object-oriented view of your engineeringprojects. Toolspace is divided into four parts or tabs: Prospector tab, Settingstab, Survey tab, and Toolbox tab.
topography The features of the actual surface of the Earth.
topology A set of geometric connections between objects. Objects linked bytopology maintain their relationships with one another. In AutoCAD Civil3D, objects that share the same topology are grouped together in a site. Seealso site.
transition region An area of a grading that blends the control regions oneither side of the grading. A transition region has no design criteria assignedto it.
transparent command A command that can be run while another commandis in progress. Transparent commands begin with an apostrophe (‘).
triangle area The 2-dimensional (2D) area of a triangle face computed fromthe northing and easting of each triangle point. The total triangle area is thesum of all 2D triangle areas with the surface boundary(s).
Glossary | 167

trim (surface) The process of removing unwanted TIN lines from a surface,thereby removing triangles.
vault A database managed by Autodesk Vault.
vertical alignment See profile.
vertical curve A curve used on a profile (most commonly on layout profiles)to provide a gradual change in slope from one tangent to the other. There arethree types of vertical curve: parabolic, circular, and asymmetrical.
vertical exaggeration An increase of vertical scale relative to horizontal scale,used to make grade changes easier to differentiate. See also vertical scale.
vertical scale The scale that is compared to the horizontal scale to calculatethe vertical exaggeration in profiles and cross sections. It does not actuallychange the scale that is used when the drawing is plotted. See also verticalexaggeration.
void region An area along a base line where grading has not been applied,creating a gap in the grading.
volume surface A surface that is created by calculating volumes using thegrid (differential) or TIN (composite) methods. The surface is created from thetwo surfaces that make up the stratum. The elevation values of a volumesurface are actually the difference between the two surfaces. For example, atpoint 1000,1000, the bottom surface has an elevation of 100, and the topsurface has an elevation of 150. The elevation of point 1000,1000 on thevolume surface is the difference between the two surfaces, which is 50.
wall breakline A breakline that represents surface features, such as retainingwalls, curbs, bridge abutments, and so on.
watershed The catchment area for rainfall that is delineated as the drainagearea producing runoff. Base flow in a stream also usually comes from the samearea.
weeding The removal of points along a selected polyline representing acontour. The weeding factors determine the amount of points removed. Youcan use weeding to reduce the amount of point information taken from thecontours that may not be necessary to generate an accurate surface. See alsoweeding factors.
weeding factors The settings used to reduce redundant points along thecontours by ignoring contour vertices that are close together or along a straightline. A larger distance and deflection angle will weed a greater number ofpoints. See also weeding.
168 | Glossary

Index
A
alignments 26, 67–68, 99, 106, 110and profiles 106and sections 110concepts for 99create (exercise) 68editing with grips 26LiveView exercise 67
alignments, horizontal 99analysis, of surface 86angle, of labels 45appearance 39, 45
of labels 45of objects 39
assemblies 122asymmetric parabolic curves 106AutoCAD Civil 3D 1–2, 6, 21, 25, 81
editing methods 25exercises with 81highlights of 2installation of 1introduction to 1learning 6menus in 21sample data 1
AutoCAD properties 29
B
base line, grading 90Basic style 41best practices 5
sample data location 5boundaries, definition of 86boundary lines, parcels 94breaklines, definition of 86
C
CAD manager, and AutoCAD Civil3D 39
center line, for sections 110child label style, creating 57child override, explanation of 55circular curves 106collections 25, 33, 41
introduction to 33item view of contents 25of styles 41
commands 24–25, 55from layout tools 25from shortcut menus 24settings for 55
compliance, with standards 39, 61components 43, 51, 91, 95, 99
of a grading object 91of alignments 99of an object 51of labels 43of parcels 95
concepts 6, 43, 81, 86, 90, 94, 99, 106, 110, 117, 122, 126, 131, 138, 143
alignments 99corridors 122feature-specific 81grading 90label objects 143learning 6parcels 94pipe networks 117points 81profiles 106sections 110styles 43, 131surfaces 86survey 126visualization 138
Index | 169

constraints, for alignments 99copying styles to another drawing 39corridors 122, 124
concepts for 122exercise 124
criteria, grading 90cross sections 110curves 99, 106, 109
editing (exercise) 109in alignment 99in profiles 106
D
data bands 106, 110for profiles 106for section views 110
data flow between objects 13data shortcuts 75database, points 81defaults 41, 55, 67
basic style 41for drawing settings 55for layers 67
definition list, for surfaces 86definitions of terms 153dependencies between objects 12deployment, network 1–2description keys 81design standards 61dialog boxes 25, 41, 43, 51, 82, 85, 88
Create Points 82Label Style Composer 43Layer Properties Manager 51Layout Tools 25Properties 85Style Editor 41, 51Style Editor (exercise) 88
differential surfaces 86display management 39, 51
and layers 51and styles 39
Display tab, using (exercise) 89documentation 6
list of 6drag-and-drop styles 39
drainage analysis, surface 86drawing settings 55, 67
editing (exercise) 67introduction to 55
drawing templates 6drawings 55, 61, 81
and point groups 81creation, consistency in 61for exercises 81presentation, consistency of 61settings for 55
dwt files 41dynamic updates 11
E
editing 25–28, 42, 84, 92, 99, 106, 120, 124, 129, 134, 136
alignments 99consistency of methods 25corridors 124grading 92of styles 42pipe networks 120profiles 106properties (exercise) 84properties of objects 28styles 134, 136survey data 129using grips 26with item view 25with Panorama window 27
elevation analysis, illustration of 86exercises 6, 57, 67, 77, 81, 84, 88, 92,
96, 108, 112, 115, 120, 124, 129, 134, 136, 140, 146
alignments 67corridors 124create a child label style 57creating a data shortcut 77files for 81grading 92managing label objects 146mass haul 115parcels 96pipe networks 120
170 | Index

points 84profiles 108purpose of 6sections 112styles 134, 136surfaces 88survey 129visualization 140
expanding folders 16external references (Xrefs) 74
F
face, grading 90feature line, grading 90features 7, 21, 55, 81
concepts for 81learning about 7menus for 21settings for 55
folders 16, 69and project management 69in Toolspace 16
G
Getting Started Guide 5–6description of 6sample data location 5
grading 90, 92concepts for 90criteria 90exercise 92volume tools 90
grading group 90graph 110
for section views 110graphical view of objects 25grid surfaces 86grip editing 26, 99, 106, 108
introduction to 26of alignment (exercise) 108of alignments 99profiles 106
H
hatch pattern, for parcels 94Help system 7
introduction to 7search for words 7
hierarchy 16, 94of objects 16of site and parcels 94
horizontal alignments 99HTML Help 7
I
icons 84, 88for point groups 84for styles 88
importing 81points 81
installation 1, 5of sample data 5overview 1
Installation wizard 1intelligent objects 39interface 15
ease of use emphasis 15overview 15
item view 25, 84, 89as editing method 25displaying (exercise) 84Style column 89
L
label objects 143label sets 43, 110
for sections 110introduction to 43
Label Style Composer 34labels 33, 43, 45, 81, 94, 110
angle of 45appearance of 45components of 43customizing 43for parcel area and segments 94for points 81
Index | 171

for sections 110introduction to 33label styles 43location of 45plan readability 45preview window 33rotating 45
Layer Properties Manager 51, 108using (exercise) 108
layers 51, 67, 81and styles 51for imported points 81properties of 51specifying (exercise) 67
layout profile 107layout tools, dialog boxes for 25layout tools, parcel 94learning AutoCAD Civil 3D 6lines, projection 90list view of objects 25LiveView exercises 67
alignments 67location, of labels 45lot lines, for grading 90
M
masks, surface 86mass haul diagram 115
exercise 115match lines 150
creating with view frames 150menus 21, 23–24
annotation 23comparison between 21consistency of 21shortcut 24
merging parcels 94
N
navigation, of objects 16network 2, 69
and project files 69installation on a 2
O
object model 11–12concept of 11illustration of 12
Object Viewer 92, 122object-oriented 16, 39
intelligent objects 39view of projects 16
objects 13, 16, 18, 21, 24–26, 28, 33, 39, 41, 43, 51
and Settings tab 18and Toolspace 16dependencies 13display of 51display of, using styles 39editing methods 25grip editing 26hierarchy 16item view of 25labeling of 43layout tools 25properties of 28right-clicking 24styles for 41styles, introduction to 33workflow for 21
official copies, of project files 69overrides 51, 55, 81
display properties 51explanation of 55for point groups 81for settings 55
P
Panorama window, editing with 27parabolic curves 106parcels 94, 96
concepts for 94exercise 96styles for 94
phases of a project 39phrase, finding in Help 7pipe networks 117, 120
concepts for 117
172 | Index

design rules 117exercises 120structures 117
PIs, alignment 99plan production 150
view frames, creating 150plan readability, for labels 45plotting sections 110point groups 81, 84
concepts 81icons for 84
point-label styles 83points 81, 84
concepts for 81exercise 84styles for 81
polylines 90, 94, 99convert to alignments 99convert to feature lines 90convert to parcels 94
preview, for labels 33profile views, description of 106profiles 106, 108
and alignments 106automatic update 108concepts for 106exercise 108types of 106
project database, for points 81projection lines, grading 90projection method, grading 90projects 16, 39, 69
in Toolspace 16management of 69phases of 39
properties 28–29, 51, 84, 89AutoCAD 29changing styles 89editing (exercise) 84introduction to 28of layers 51
Prospector tab 16, 24–25, 28introduction to 16item view 25properties of objects 28shortcut menus 24
R
raw description 81, 85introduction to 81viewing (exercise) 85
rebuilding surfaces 86relationships between objects 11
and object model 11render materials 141reset label location, with grip 27revisions, of design data 11right-click menu content 24rotating labels 45
S
sample data 1, 5–6, 81best practices 5for exercises 81for Getting Started Guide 5for tutorials 5overview 1provided on the product media 5styles and settings 6
sample lines 110searching 7
for a word or phrase 7section view 110sections 110, 112
concepts for 110exercise 112plotting 110
segments, parcel 94server 69, 81
and points database 81for project files 69
settings 51, 55display properties 51levels of 55overriding 55
Settings tab 18, 24, 41, 43, 55, 88and drawing settings 55and label styles 43and styles 41expanding styles (exercise) 88shortcut menus 24
Index | 173

shared access 69, 81to points database 81to project files 69
shortcut menus 24sites 16, 94
and parcels 94introduction to 16
smoothing, surface 86spirals, in alignments 99standards 39, 61
and styles 39compliance with 61
static profiles 106station equations, alignment 99Style Editor 51styles 6, 18, 33, 39, 41, 43, 51, 81, 86,
88, 90, 94, 110, 131, 134, 136and display management 39and layers 51and Settings tab 18basic, or default 41concepts for 131copying to another drawing 39creating (exercise) 88editing method 33exercise 134, 136for grading 90for labels 33, 43for objects 41for parcels 94for points 81for sample lines 110for section views 110for surfaces 86introduction to 33sample data for 6table 33types of 33
subassemblies 122subdivisions, designing 94support, technical 1surface profile 107surfaces 86, 88, 90, 106
analysis of 86and profiles 106concepts for 86
created from grading 90drainage analysis 86exercise 88styles for 86types of 86
survey 126, 129concepts for 126exercise 129
Survey tab 19–20symbol, point 81
T
table, item view 26tables, styles for 33target, grading 90technical support 1templates 5, 41
and styles 41provided on the product media 5
terms, definitions 153TIN surfaces 86Toolspace 16, 18–20, 26
introduction to 16item view 26Prospector tab 16Settings tab 18Survey tab 19–20
topology, site 16, 94triangulation, surface 86tutorials 5, 7
description of 7sample data location 5
U
update 13, 43, 90, 94, 110of labels 43of objects 13of parcels 94of sections 110of surfaces 90
upside-down labels 45usability highlights 15
174 | Index

V
vertical alignments 106view frames 150
creating 150visualization 138, 140
exercise 140volume surfaces 86volume tools, grading 90
W
watershed analysis 86workflow 21, 61
creating, editing, and annotating 21engineering 61
World Coordinate System, and labels 45
Z
zooming (exercise) 84
Index | 175

176