getting a grip on the intertidal: flow microhabitat and substratum type determine the dislodgement...
TRANSCRIPT

www.elsevier.com/locate/jembe
Journal of Experimental Marine Biology and Ecology
295 (2003) 1–21
Getting a grip on the intertidal: flow microhabitat and
substratum type determine the dislodgement of the
crab Pachygrapsus crassipes (Randall) on rocky
shores and in estuaries
Winnie W.Y. Lau*, Marlene M. Martinez
Department of Integrative Biology, University of California at Berkeley, Berkeley, CA 94720, USA
Received 19 July 2001; received in revised form 13 May 2003; accepted 21 May 2003
Abstract
Hydrodynamic forces can affect survival as well as limit the movement of motile benthic animals.
An animal’s danger of dislodgement depends on the hydrodynamic forces it experiences in its
microhabitat relative to the force required to dislodge it (tenacity) from the substratum. We measured
water flow and substratum characteristics in two different habitats of the shore crab Pachygrapsus
crassipes: a wave-swept rocky shore and an intertidal mudflat. The maximum water velocities and
accelerations in the microhabitats of the crabs at the wave-swept site were three times and two times
greater, respectively, than at the mudflat site. In the laboratory, we measured the tenacity of crabs of
various sizes on different substrata, and also measured their drag, lift and added-mass coefficients.
Using these data, we calculated the flow conditions under which crabs would be overturned or
sheared off the substratum in their two habitats. The net horizontal force (drag plus acceleration
reaction) required to dislodge a crab on a rugose rock substratum was an order of magnitude greater
than on smooth rock and two orders of magnitude greater than on mud. Our calculations indicate
that, under non-storm conditions, crabs will not be dislodged from the substratum in either the
mudflat or the wave-swept habitat when grasping the substratum with maximum tenacity. Moving
crabs have lower tenacity and our calculations predict that hydrodynamic forces will restrict the
mobility of large crabs more than that of small ones on smooth, but not on rugose rock.
D 2003 Elsevier B.V. All rights reserved.
Keywords: Crab; Dislodgement; Hydrodynamics; Rugosity; Mudflat; Wave-swept
0022-0981/03/$ - see front matter D 2003 Elsevier B.V. All rights reserved.
doi:10.1016/S0022-0981(03)00276-4
* Corresponding author. School of Oceanography, University of Washington, Box 357940, Seattle, WA
98195-7940, USA. Tel.: +1-206-616-1570; fax: +1-206-685-6651.
E-mail address: [email protected] (W.W.Y. Lau).

W.W.Y. Lau, M.M. Martinez / J. Exp. Mar. Biol. Ecol. 295 (2003) 1–212
1. Introduction
Fluid motion provides important services to benthic organisms, such as mass
transport of nutrients and waste and distribution of gametes and larvae. Fluid motion,
however, can also break, dislodge or restrict the activity of both attached and motile
benthic organisms (e.g. Denny, 1988; Denny et al., 1985; Koehl, 1977, 1982, 1984).
Mobile activities such as foraging (e.g. Branch and Marsh, 1978; Denny, 1994), seeking
a mate and defending a territory can be hindered if water motion reduces the spatial and
temporal range of an animal’s motility. In the intertidal environment, hydrodynamic
forces can affect the structure of benthic communities, by limiting the size of some
organisms (e.g. Black, 1976; Blanchette, 1997; Gaylord et al., 1994), acting as an
important agent of disturbance (e.g. Sousa, 1979a,b), or reducing the effect of important
predators (e.g. Menge, 1978a,b).
For motile, non-swimming, benthic organisms, dislodgement from the substratum can
decrease survival and the cost of resisting dislodgement is reduced locomotion (Martinez,
2001). To assess an organism’s danger of dislodgement, the nature of the water flow, the
resultant hydrodynamic forces and the organism’s ability to resist those forces must be
characterized.
Fluid flow experienced in the microhabitat of an organism may differ significantly from
that in the macrohabitat (Hart et al., 1996; Koehl, 1977). Flow near the substratum can be
significantly slower than in freestream due to local topography, neighboring organisms and
the presence of a boundary layer, the velocity gradient resulting from the no-slip condition
at the interface of the moving water and a substratum (Hart et al., 1996; Koehl, 1977,
1982; Nowell and Jumars, 1984; Vogel, 1994). Thus, the flow velocities where the
organisms are located rather than freestream velocities must be measured.
The types of hydrodynamic forces experienced by an organism in its microhabitat
depend on whether the organism is in unidirectional or wave-swept flow. An organism in
relatively constant unidirectional flow is subjected to drag and lift, while an organism in
wave-swept environments is exposed to acceleration reaction in addition to drag and lift
(Denny, 1988; Koehl, 1977).
Hydrodynamic forces can dislodge motile organisms from the substratum either by
overturning or by shearing (Fig. 1). An organism, however, can adhere to the substratum
passively (e.g. via glue) or actively (e.g. by muscular grasping with appendages), thereby
increasing the force necessary to dislodge it. Thus, the relationship between flow
velocities, hydrodynamic forces and dislodgment is not a simple linear relationship and
must be determined for a particular organism in its particular habitats.
Until recently, few studies have looked at the hydrodynamic forces on marine animals
that use legged locomotion and none of these studies considered acceleration reaction,
dislodgement and tenacity (Bill and Herrnkind, 1976; Blake, 1985; Jacklyn and Ritz,
1986; Spaargaren, 1979). The recent papers by Martinez (2001) and Martinez et al. (1998)
analyzed hydrodynamic forces on the tropical crab, Grapsus tenuicrustatus Herbst,
locomoting in waves and found that hydrodynamic forces can limit the speed, gait choice,
and environmental conditions in which crabs can locomote.
The purpose of the present study was to investigate whether hydrodynamic forces and
dislodgement also limit the locomotion of smaller crabs, which might live in more

Fig. 1. (A) A crab will be overturned when the overturning moment about the center of mass exceeds the
stabilizing moment. The overturning moment consists of the sum of the drag and acceleration reaction times the
height of the crab’s center of mass. The stabilizing moment consists of the sum of the crab’s submerged weight,
vertical tenacity and lift times the distance to the downstream leg. (B) A crab will be sheared off the substratum
when the shearing force exceeds the horizontal stabilizing force on the center of mass. The shearing force
comprises drag and acceleration reaction on the body of the crab. The horizontal stabilizing force is the horizontal
tenacity of the crab.
W.W.Y. Lau, M.M. Martinez / J. Exp. Mar. Biol. Ecol. 295 (2003) 1–21 3
protected flow microhabitats than do larger crabs such as G. tenuicrustatus. We chose the
common intertidal shore crab Pachygrapsus crassipes for our study. P. crassipes is a
highly motile animal found in a variety of habitats, from wave-swept rocky shores to
calm estuaries (Hiatt, 1948). Because it is an important consumer in intertidal commu-
nities, it can accelerate algal succession on rocky shores (Sousa, 1979b), reduce infaunal
densities of mudflats (Quammen, 1984) and eliminate sea urchins from tide pools
(Lindberg, 1985). Determining how water motion in various habitats affect the mobility
of this important consumer will help us understand the ecological role P. crassipes plays
in different environments.
Specifically, we assessed the hydrodynamic conditions under which P. crassipes would
be dislodged from the substratum. By characterizing the flow microhabitats of P. crassipes
on wave-swept rocky shores and in estuaries, we determined the magnitudes of the

W.W.Y. Lau, M.M. Martinez / J. Exp. Mar. Biol. Ecol. 295 (2003) 1–214
hydrodynamic forces on the crabs exposed to such flows and compared them to the crab’s
tenacity on different substrata.
2. Materials and methods
2.1. Field sites
We chose two sites that represented different flow habitats of P. crassipes. The
protected estuarine site, located on the southwestern end of Bodega Harbor, CA, USA,
is exposed to long periods of unidirectional tidal flow. The substratum at this site was
composed of mud with scattered rock boulders, changing abruptly to rip-rap along the
shore. We commonly observed P. crassipes under and around rocks and on the surface of
the mud. We also observed crabs locomoting below the tide line in this environment. The
wave-swept site located just north of Horseshoe Cove (Bodega Marine Laboratory,
University of California) on the outer coast about a mile from the estuarine site is
characterized by rock cliffs and surge channels, the bottoms of which were composed of
coarse sand, rocks and large boulders. At this site, we observed crabs locomoting both
above and below the tide line.
2.2. Water flow measurements
We measured water velocities at both sites on several days in different weather
conditions during spring tides from June through December 1994. Except on days when
we would have lost our equipment due to extreme weather and wave conditions, we
measured water flow for one tidal cycle: flooding tide (at about 3 h after slack low tide),
slack high tide and ebbing tide (about 3 h after slack high tide).
We used a Marsh McBirney Model 511 electromagnetic flow meter to measure water
velocities. The flow probe was held rigidly in place by a heavy-duty camera tripod
(Bogen 3036) that was secured to the substratum with rope and weights. Flow
visualization by fluorescein dye injected upstream showed that the tripod legs did not
noticeably affect the water motion around the flow probe. At the protected site, we
placed the flow probe in a location directly over the mud surface where we had seen P.
crassipes feeding. At the wave-swept site, we placed the flow probe over the substratum
in a location where we observed crabs standing below the tide line. Measurements were
made of water velocities (to the nearest 1 cm/s) in the horizontal plane, both parallel and
perpendicular to the local shoreline, for 3 min at a sampling rate of 2 Hz. These
measurements were recorded either on a battery-operated chart recorder (Soltec Model
6723) or on a laptop computer (TravelMate 5000, Texas Instruments) with a portable
data acquisition system (OMB-DaqBook 100, Iotech). Data recorded on chart paper
were digitized using a Jandel tablet with Sigma Scan Scientific Measurement System
software (version 3.01, Jandel). We calculated the resultant horizontal water velocity
using the parallel and perpendicular velocity recordings.
To assess whether water flow in a crab’s microhabitat differed from that in freestream
flow, we measured water velocity sequentially at two heights: (1) 6 cm above the

W.W.Y. Lau, M.M. Martinez / J. Exp. Mar. Biol. Ecol. 295 (2003) 1–21 5
substratum, approximating the water flow at the height of a crab at 2 cm above the
substratum (‘‘crab microhabitat’’) and (2) 21 cm above the substratum (‘‘freestream’’). The
lower height limit was set by the size of the flow-sensing volume of the electromagnetic
probe and the upper height limit by the adjustable range of the tripod. Although the
sensing volume of the probe prevented measurement of flow at the actual height of a crab,
dissolution experiments (e.g. Doty, 1971) indicated that bulk flow at 6 cm was not
different from that at 2 cm (nonparametric paired sign test, P>0.05, N = 12 for the
protected site; N = 8 for the wave-swept site).
As another measure of variability in flow microhabitat, we calculated turbulence, a
component of unsteady water flow. Turbulence is the random fluctuation in velocity that is
superimposed on the mean velocity (in unidirectional flow) and on the mean velocity plus
oscillatory flow (in waves). Turbulence intensity is defined as the root-mean-square value
of the fluctuations in the flow velocity, and is often reported as a fraction of the mean flow
velocity:
Turbulence intensity ¼�uV2
�1=2.�U ð1Þ
where uV is the difference between the speed at an instant in time and the mean velocity
(U_) (Anderson and Charters, 1982; Koehl and Alberte, 1988). We calculated turbulence
intensity for each of the horizontal velocity components measured at each site, although
the sampling rate of the Marsh McBirney flow meter did not permit us to assess high-
frequency turbulence.
The nature of water flow in our two sites required two different calculations for
turbulence intensity. For the estuarine site, where water flow was unidirectional, we
simply calculated turbulence intensity using Eq. (1). For the wave-swept site, where
unsteady flow is composed of both oscillatory flow and turbulence, we first calculated
turbulent fluctuation (uV) by subtracting the oscillatory component (u) from the total
unsteady flow (u) for each time point. The oscillatory component of flow at time t = i is
defined by
u ¼ 1=4ðui�1 þ 2*ui þ uiþ1Þ ð2Þ
where ui� 1, ui and ui + 1 are the unsteady periodic component of the flow at t= i� 1,
t = i and t= i + 1 (Nakagawa, 1982; Yu et al., 1993). After obtaining uV, we substituted
it into Eq. (1) to calculate turbulence intensity in the wave-swept site.
For use in calculating acceleration reaction, the hydrodynamic force resulting from
the acceleration and deceleration of the water, we calculated the average water
acceleration over each sampling interval of 0.5 s. From the maximum accelerations
at each sampling point in a tidal cycle, we calculated an average maximum
acceleration for each sampling day. Our calculated values for average acceleration
probably underestimated instantaneous acceleration in the field. Denny et al. (1985)
reported peak accelerations in a wave-swept environment with a duration of only 4
ms, although Gaylord (2000) has shown that such brief high accelerations occur on
such small spatial scales that they are unlikely to limit the size of organisms on wave-
swept shores. To calculate maximum acceleration reaction on a crab, we used literature

W.W.Y. Lau, M.M. Martinez / J. Exp. Mar. Biol. Ecol. 295 (2003) 1–216
values for water accelerations in waves in addition to our calculated values for
accelerations.
2.3. Animals
We collected a total of 26 crabs representing a size range of adults from our two sites
(carapace width range: 2.0–4.5 cm). To the extent possible, we made all measurements
(except hydrodynamic forces) on all the crabs.
2.4. Hydrodynamic forces
2.4.1. Models
For hydrodynamic measurements, we selected five crabs from each site with an even
distribution across the range of sizes. Each crab from one site was approximately matched
in carapace width to a crab from the other site. We made models of these crabs by filling
the exoskeletons with epoxy.
We positioned the crab exoskeletons to reflect the posture used by live P. crassipes as
they locomoted through an aquarium of seawater. We measured the maximum stance
width (distance between contralateral pairs of legs) and maximum height of the anterior
and posterior edges of the carapace with a ruler (to the nearest 0.1 cm) as crabs locomoted
across the aquarium. Ten replicate measurements were made per crab and five crabs per
site were measured ranging in carapace width from 2.2 to 4.2 cm. Linear regressions of
these measurements against carapace width were used to determine the postures for crab
models of different sizes.
Since the maximum stance width does not necessarily co-occur with the maximum
stance height during crab locomotion (unpublished data, methods from Martinez et al.,
1998), we compared drag on one crab model in three postures: (1) maximum stance width
and stance height measured as described above, (2) maximum stance width, but with the
ventral surface of the crab’s body in contact with the substratum, and (3) legs maximally
tucked under the body (minimum stance width) with the ventral surface of the body
pressed down on top of the tucked legs. We found no significant difference in drag on
these three extreme postures (P>0.05, Kruskal–Wallis, df = 2), thus for subsequent
hydrodynamic measurements we used the posture with maximum stance height and width.
2.4.2. Reynolds number
WecalculatedReynolds numbers (Re) for our crabmodels for use inmaintaining dynamic
similarity between field flow conditions and simulated flow conditions in laboratory flow
tanks. We calculated field conditions for seawater at 10jC (q = 1.03� 103 kg/m3,
l = 1.39� 10� 3 N s/m2; Myers, 1969) and laboratory conditions for freshwater at 20jC(q = 9.98� 102 kg/m3, l = 1.00� 10� 3 N s/m2; Vogel, 1994).
2.4.3. Drag and lift measurements
We measured drag and lift on crab models that were positioned in locomoting
orientation (left–right axis parallel to flow) with their dactyls 0.3 cm from a plexiglas
substratum in the flow tank. Crabs were mounted on a single beam force transducer of
W.W.Y. Lau, M.M. Martinez / J. Exp. Mar. Biol. Ecol. 295 (2003) 1–21 7
shimstock steel (e.g. Koehl, 1977) with strain gages (Measurements Group) attached to
both sides of the beam to compensate for temperature effects on the beam. We passed
force signals through a bridge amplifier (Gould model 13-4615-30) to a portable data
acquisition system (OMB-DaqBook 100, Iotech) and a laptop computer (TravelMate
5000, Texas Instruments). We measured drag in a unidirectional flow tank (Vogel and
LaBarbera, 1978) with a cross-sectional area of 0.022 m2. The crab models obstructed
less than 10% of the flume cross section (largest crab cross-sectional area: 1.07� 10� 3
m2); thus, they did not significantly affect flow through the flow tank (Denny, 1988;
Vogel, 1994). We measured lift in a different unidirectional flow tank that had a cross-
sectional area of 0.13 m2.
We measured drag and lift at three velocities to represent the range of water flow
recorded at the two field sites. The flow velocities we used in the flow tanks
corresponded to field velocities of 0.20, 0.54 and 0.81 m/s. We measured water velocity
in the flow tanks to the nearest 0.01 m/s with a small electromagnetic flow probe (Marsh
McBirney model 523, flow sensing volume: 2.25 cm radius) positioned 2.5 cm from the
substratum where the crabs were positioned during force measurements. We made three
replicate measures of drag and lift for each crab at the three different velocities.
We calculated drag coefficient (CD) from the equation
CD ¼ 2D
qU2Sð3Þ
where D is the measured drag, q is the water density, U is the water velocity and S is the
projected area of the crab perpendicular to the flow direction. We calculated lift coefficient
(CL) using the equation
CL ¼ 2L
qU2Spð4Þ
where L is the measured lift and Sp is the planform area parallel to the direction of flow.
We calculated projected (side view) and planform (top view) areas of the crab exoskeleton,
including appendages, to the nearest 0.01 cm2 from video images with NIH Image (version
1.52) on a MacIntosh PowerPC computer. We then calculated a mean CD and CL for each
crab at each velocity.
2.4.4. Measurement of acceleration reaction force
Using the apparatus and methods described in Denny and Gaylord (1996), we measured
acceleration reaction on the epoxy-filled crabs accelerating underwater in a tow tank. We
made 10 measurements on each crab, positioned next to a substratum, oriented in the same
locomoting posture as for drag and lift measurements. The sensitivity range of this set-up
allowed acceleration reaction measurements only on the three largest crabs from each site.
We calculated a mean added mass coefficient (CA) for each crab with the equation
CA ¼ A
qaV
� �� 1 ð5Þ

W.W.Y. Lau, M.M. Martinez / J. Exp. Mar. Biol. Ecol. 295 (2003) 1–218
where A is the measured acceleration reaction, a is the acceleration of the fluid and V is the
volume of the crab.
2.5. Mass and volume
We measured the mass of each crab to the nearest 0.01 g with a Mettler balance (model
PB1502) both in air (after blotting off excess water with paper towels) and in water. Mass
was then multiplied with the gravitational constant ( g) to yield the force weight for
comparison with hydrodynamic forces. We calculated the volume (V) of a crab with the
equation
V ¼ ðWa �WwÞ=q ð6Þ
where Wa is the crab’s weight in air, Ww is the crab’s submerged weight and q is the
density of water.
2.6. Substratum characterization and tenacity measurements
2.6.1. Hard substrata
In the laboratory we measured crab tenacity on two different rock substrata: rugose
rock and smooth rock. To ensure that our rock surfaces matched those in nature, we
characterized the laboratory substrata using two parameters—height of rugosity
elements (bumps that crabs might grasp) and surface relief (a measure of the density
of rugosity elements)—and compared them to field substrata. We measured surface
contours with a linear contour guage that was 150 mm long with teeth that were
0.8 mm wide. We made 10 contour measurements on each of our laboratory rocks
using a grid and a random number table. At the wave-swept site, we made con-
tour measurements every 0.5 m along three 5-m transect lines, for a total of nine
contour measurements per transect. These transect lines ran along the length of the
surge channel, two along the walls of the surge channel, where crabs had been
observed, and one along the bottom, crossing the location where water velocity
measurements were made. At the mud site, we took contours of rocks that appeared
within each meter along a 10-m transect parallel to shore and crossing the site where
water velocity measurements were made. Using digitized photographs of the contour
guage (Jandel digitizing tablet and Sigma Scan Scientific Measurement System
software, version 3.01), we calculated the height of rugosity elements given by the
height of the contour pins relative to the lowest point on the contour at every 0.25 cm
along the length of the guage. To get an index of surface relief, we measured the
length of the contour relative to the length of the contour guage, yielding a
dimensionless measure of relief commonly used in coral reef studies (e.g. Thomas
and Atkinson, 1997).
Tenacity measurements on rock were made by pulling a crab with an Ametek
(LKG-5) force transducer, via a wire loop glued with cyanoacrylate (Superglue) to the
center of the crab’s carapace. We measured tenacity as the crabs grasped the

W.W.Y. Lau, M.M. Martinez / J. Exp. Mar. Biol. Ecol. 295 (2003) 1–21 9
substratum with their legs and/or chelipeds. Maximum force to the nearest 0.1 N was
determined from five replicates in the horizontal and vertical directions on each rock
substratum.
2.6.2. Soft substrata
Since the mud was soft, we could not acquire mud contours. Furthermore, because it is
difficult to mimic the hydration and compaction of mud under laboratory conditions, we
measured tenacity of five crabs on mud underwater at the estuarine field site. With plexiglas
walls embedded in the mud, we created an arena (40� 90 cm) of still water in which to
conduct these trials. We determined tenacity by the deflection of a simple shimstock beam
attached to the crab’s carapace. We measured the deflection to the nearest 1.0 degree with a
protractor and then calibrated the deflections with weights in the laboratory (r2 = 0.99). We
reported the horizontal tenacity as the greatest force measured in three replicate trials. Crabs
were not observed to actively burrow in the mud, so we made no vertical tenacity
measurements on mud.
2.7. Critical velocity calculations
We calculated the critical velocities at which a crab would overturn and shear off the
substratum while standing still and holding onto the three different types of substrata
with maximum horizontal and vertical tenacity. A crab would be overturned if its
overturning moment exceeded its stabilizing moment (Fig. 1A). A crab would be
sheared off the substratum if the shearing force exceeded the crab’s stabilizing force
(Fig. 1B). Since our measured water accelerations were an underestimate of the true
accelerations in the field, we performed a sensitivity analysis to explore the effects of
water acceleration on the likelihood of a crab’s being overturned or sheared off different
substrata.
2.8. Statistical analyses
We used the statistical software programs Statview (version 4.5, for the MacIntosh) or
SigmaStat (version 1.0, for the PC) for analysis of our data.
3. Results
3.1. Water flow
The estuarine habitat experienced relatively slow, unidirectional water flow. In
contrast, the wave-swept site was subjected to back-and-forth water flow that reached
much higher water velocities than those measured in the estuarine habitat (Fig. 2).
For each site, the mean water velocity did not vary significantly throughout the tidal
cycle on any day at either height above the substratum (Kruskal–Wallis, P>0.10,
df = 2). Therefore, a mean velocity was calculated for each height on each day. Average
water velocity, average maximum water velocity and average maximum acceleration

Fig. 2. Examples of water velocity as a function of time recorded at each site at a height of 6 cm above the
substratum.
W.W.Y. Lau, M.M. Martinez / J. Exp. Mar. Biol. Ecol. 295 (2003) 1–2110
were all significantly higher at the wave-swept site than at the estuary site for both
freestream and crab microhabitat heights (Table 1). At both sites, these values at
freestream were significantly higher than at the crab microhabitat, except for maximum
accelerations at the estuary site, which did not differ significantly between the two
heights (Table 1).
There was no significant difference in turbulence intensity between the parallel and
perpendicular components of the flow velocity measurements (Wilcoxon paired sign
tests, P>0.05, N = 13 at wave-swept site, N = 16 at estuarine site; Table 1). There was
also no significant variation in turbulence intensity between the two sites nor between
the two heights above the substratum at each site (Mann–Whitney U-tests, P>0.05;
Table 1). Since turbulence intensity is normalized to mean velocity (see Eq. (1)), this
masks the pattern that the absolute turbulent fluctuations are actually greater in
habitats with faster mean velocities, i.e. at the wave-swept site (relative to the
estuarine site) and at freestream heights (relative to microhabitat heights).
3.2. Hydrodynamic forces
Drag measured on a large crab (carapace width of 4.2 cm) were three to four times
greater than those measured on a small crab (carapace width of 2.2 cm) at all three
water velocities (Fig. 3A). Lift, however, showed no discernable patterns with respect
to water velocities and crab size (Fig. 3B). We observed that the lift coefficient of P.
crassipes was very sensitive to slight changes in angle of attack (angle at which the
crab meets the oncoming flow, rotation about the anterior–posterior axis of the crab)
which might explain the high standard deviation in the measured lift.
Over the ranges tested, there was no correlation between the drag and lift coefficients
and Reynolds number (Kendall correlation, P>0.10, N = 3). There was also no correla-
tion of CA with fineness ratio (Kendall correlation, P>0.10, N = 6). Moreover, crabs from
the estuarine and wave-swept sites did not differ significantly in CD, CL or CA (Mann–

Table 1
Microhabitat and freestream water flow characteristics for estuary and wave-swept sites
Estuary site Wave-swept site
‘‘Crab microhabitat’’
(6 cm above
substratum)
‘‘Freestream’’
(21 cm above
substratum)
‘‘Crab microhabitat’’
(6 cm above
substratum)
‘‘Freestream’’
(21 cm above
substratum)
Mean valuesaF S.D. (N = 6)
Mean water velocity
(m/s)
0.05F 0.01 0.06***F 0.02 0.13**F 0.02 0.16*,****F 0.04
Maximum water
velocity (m/s)
0.08F 0.04 0.10***F 0.04 0.41**F 0.08 0.47*,****F 0.10
Maximum
acceleration (m/s2)
0.10F 0.10 0.09F 0.09 0.53**F 0.09 0.70*,****F 0.16
Turbulence intensity
Component parallel
to flow direction
0.46F 0.28 0.44F 0.20 0.75F 0.86 0.48F 0.19
Component
perpendicular to
flow direction
(horizontal)
0.52F 0.46 0.51F 0.37 2.29F 4.71 1.09F 1.55
Maximum values recorded at a site
Water velocity (m/s) 0.17 0.22 0.55 0.64
Acceleration (m/s2) 0.29 0.23 0.63 0.91
Turbulence intensity
Component parallel
to flow direction
1.22 1.22 2.40 1.18
Component
perpendicular to
flow direction
(horizontal)
1.20 1.22 11.90 4.24
a Each mean value reported here is the mean of the means of all days. Because there was no difference in the
water velocities during a tidal cycle, the mean values of the three samples (3-min. duration each) during one tidal
cycle were averaged to obtain one mean value per day.
*Significantly different from estuary site value, P < 0.05 (Mann–Whitney U-test).
**Significantly different from estuary site value, P < 0.01 (Mann–Whitney U-test).
***Significantly different from microhabitat value, P< 0.05 (Wilcoxon signed rank test).
****Significantly different from microhabitat value, P< 0.01 (Wilcoxon signed rank test).
W.W.Y. Lau, M.M. Martinez / J. Exp. Mar. Biol. Ecol. 295 (2003) 1–21 11
Whitney U-tests, P>0.05); thus, we calculated a mean of the mean CD of 0.48
(S.D. = 0.05, N = 10), CL of 0.03 (S.D. = 0.03, N = 10) and CA of 0.51 (S.D. = 0.12,
N = 6).
3.3. Substratum rugosity and relief
Rocks from the wave-swept site and the protected estuarine site did not differ
significantly in height of rugosity elements or in relief (Fig. 4). The smooth rock
substratum used in laboratory tenacity measurements had significantly shorter rugosity

Fig. 3. Drag (A) and lift (B) measured (meanF S.D., N= 3 replicates) at each of three water velocities in a
unidirectional flow tank in the laboratory for crabs of two sizes: carapace width of 4.2 cm (filled circles) and 2.2
cm (open circles). Lift was measured at an angle of attack of 0j.
W.W.Y. Lau, M.M. Martinez / J. Exp. Mar. Biol. Ecol. 295 (2003) 1–2112
elements and lower relief than rocks from both field sites. The rugose rock substratum
used in lab tenacity measurements possessed similarly sized rugosity elements to those
of rocks in the field. The rugose rock substratum exhibited greater relief than rocks at
the wave-swept site but did not differ in relief from rocks at the estuarine site. Our
laboratory rock substrata appeared to represent two extremes in terrain variability that
crabs may encounter in the field and as such served as appropriate substrata for tenacity
measurements.

Fig. 4. Substratum characteristics of rocks in two habitats (wave-swept and protected) and rocks used to test
crabs’ tenacity in the lab (rugose rock and smooth rock). On each graph, underlining connects the rock types that
were not significantly different (Kruskal–Wallis test and Dunn’s pairwise multiple comparison test, P< 0.05,
df = 3). (A) Height of rugosity elements (meanF S.D., N = 10 measurements) relative to lowest point on the
contour, as illustrated by the inset diagram. (B) Relief (meanF S.D., N= 10 measurements) is the length of the
contour relative to the length of the gauge, as illustrated by the inset diagram.
W.W.Y. Lau, M.M. Martinez / J. Exp. Mar. Biol. Ecol. 295 (2003) 1–21 13
3.4. Tenacity
On rugose substrata crabs were able to grasp the substratum with surprisingly large
forces, up to 937 times the crabs’ submerged weight (118 times the weight in air).
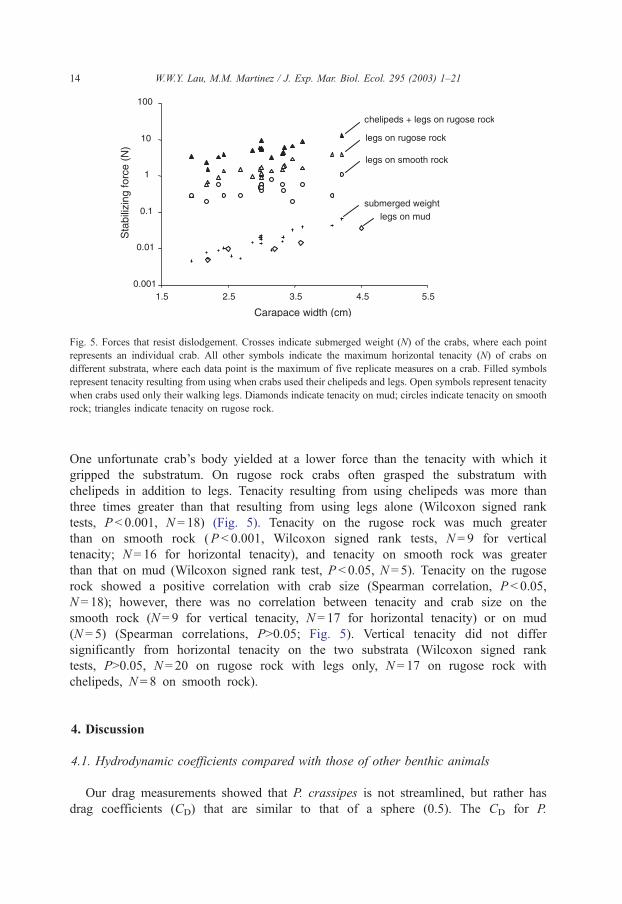
Fig. 5. Forces that resist dislodgement. Crosses indicate submerged weight (N) of the crabs, where each point
represents an individual crab. All other symbols indicate the maximum horizontal tenacity (N) of crabs on
different substrata, where each data point is the maximum of five replicate measures on a crab. Filled symbols
represent tenacity resulting from using when crabs used their chelipeds and legs. Open symbols represent tenacity
when crabs used only their walking legs. Diamonds indicate tenacity on mud; circles indicate tenacity on smooth
rock; triangles indicate tenacity on rugose rock.
W.W.Y. Lau, M.M. Martinez / J. Exp. Mar. Biol. Ecol. 295 (2003) 1–2114
One unfortunate crab’s body yielded at a lower force than the tenacity with which it
gripped the substratum. On rugose rock crabs often grasped the substratum with
chelipeds in addition to legs. Tenacity resulting from using chelipeds was more than
three times greater than that resulting from using legs alone (Wilcoxon signed rank
tests, P < 0.001, N = 18) (Fig. 5). Tenacity on the rugose rock was much greater
than on smooth rock (P < 0.001, Wilcoxon signed rank tests, N = 9 for vertical
tenacity; N = 16 for horizontal tenacity), and tenacity on smooth rock was greater
than that on mud (Wilcoxon signed rank test, P < 0.05, N = 5). Tenacity on the rugose
rock showed a positive correlation with crab size (Spearman correlation, P < 0.05,
N = 18); however, there was no correlation between tenacity and crab size on the
smooth rock (N = 9 for vertical tenacity, N = 17 for horizontal tenacity) or on mud
(N = 5) (Spearman correlations, P>0.05; Fig. 5). Vertical tenacity did not differ
significantly from horizontal tenacity on the two substrata (Wilcoxon signed rank
tests, P>0.05, N = 20 on rugose rock with legs only, N = 17 on rugose rock with
chelipeds, N = 8 on smooth rock).
4. Discussion
4.1. Hydrodynamic coefficients compared with those of other benthic animals
Our drag measurements showed that P. crassipes is not streamlined, but rather has
drag coefficients (CD) that are similar to that of a sphere (0.5). The CD for P.

W.W.Y. Lau, M.M. Martinez / J. Exp. Mar. Biol. Ecol. 295 (2003) 1–21 15
crassipes falls within the range of those reported in the literature for other intertidal
benthic invertebrates measured against a substratum (limpets: Denny et al., 1985;
Dudley, 1985; Denny, 1989; barnacles, snails and mussels: Denny et al., 1985; sea
urchins: Denny and Gaylord, 1996) , including the intertidal crab G. tenuicrustatus
(0.47, Martinez, 2001). To compare our values to the CD’s reported for other crabs by
Blake (1985), we also calculated our drag coefficients using planform area. The mean
CD for P. crassipes calculated using planform area is 0.15, which is lower than that
reported for the carapaces of Callinectes sapidus Rathbun (0.33) and Cancer
productus Randall (0.19) and much lower than that of the whole exoskeleton
(including appendages) of Lopholithodes mandtii Brandt (0.96). Because Blake
(1985) was interested in carapace design for swimming, he measured forces on the
carapaces in freestream flow. Measurements of drag on bodies in freestream flow are
generally higher than those made on bodies near a substratum (e.g. Dudley, 1985;
Koehl, 1984). Hence, CD’s measured by Blake (1985) are higher than those measured
for G. tenuicrustatus (Martinez, 2001) and P. crassipes on the substratum.
The mean lift coefficient (CL) of P. crassipes is in the lower range of those reported
for other benthic invertebrates also measured against a substratum (limpets: Denny et al.,
1985; Denny, 1989; sea urchins: Denny and Gaylord, 1996) and is an order of
magnitude greater than that of the crab G. tenuicrustatus (Martinez, 2001). In contrast,
the carapaces of the swimming crabs C. sapidus and C. productus have much higher lift
coefficients (0.16 to 0.64, Blake, 1985) than does P. crassipes. Blake (1985) suggested
that a high lift-to-drag ratio (L/D) is adaptive for swimming by crabs. The L/D for the
non-swimming P. crassipes (0.2), G. tenuicrustatus (0.05; Martinez, 2001) and L.
mandtii (0.2; Blake, 1985) are lower than those for the swimming C. sapidus (3.3)
and C. productus (2.3) (Blake, 1985).
The mean added mass coefficient (CA) of P. crassipes falls in the lower range of those
reported for benthic invertebrates (crab: Martinez, 2001; limpets, barnacles, snails and
mussels: Denny et al., 1985; sea urchins: Denny and Gaylord, 1996), and is within the
range predicted by Daniel (1984) for bodies with fineness ratios like those of P. crassipes
(3.3–4.5).
The hydrodynamic coefficients of P. crassipes are similar to those of other ben-
thic organisms. This suggests that benthic organisms in general might share simi-
lar hydrodynamic constraints. Crabs, however, are highly motile and thus might be
in more danger of being swept away by ambient currents, even though their
hydrodynamic coefficients are in the same range as those of the other benthic
organisms.
4.2. Danger of dislodgement
The total hydrodynamic force on an organism in a wave-swept environment at
any instant is the sum of the drag, lift, and acceleration reaction. While drag and lift
are proportional to the square of the instantaneous water velocity, acceleration reaction
is proportional to the instantaneous water acceleration. Acceleration reaction acts in
the same direction as drag if the water is speeding up, but in the opposite direction
if the water is slowing down (Denny et al., 1985; Koehl, 1977). The peak total

W.W.Y. Lau, M.M. Martinez / J. Exp. Mar. Biol. Ecol. 295 (2003) 1–2116
horizontal hydrodynamic forces we calculate for P. crassipes in waves, therefore, do
not occur at times of peak velocity (when acceleration is zero), but rather occur earlier
in the wave cycle at a point of high water velocity and maximum water acceleration.
Later in a wave cycle, when the water is decelerating, maximum net horizontal force
occurs in the opposite direction at the time of low velocity and high negative
acceleration (Fig. 6).
We calculated peak total hydrodynamic forces on P. crassipes using our measure-
ments of CD, CL and CA and water flow measurements from the wave-swept site.
Under these conditions, the crabs would be safe from being overturned or sheared off
the substratum if holding on to the substratum with maximum tenacity (Fig. 7).
However, under the maximum velocity and acceleration values reported by Denny et
al. (1985), flow conditions severe enough to both overturn and shear a crab off the
substratum do occur in wave-swept environments (Fig. 7). Gaylord (2000) has shown
that extreme water accelerations in the surf-zone act on such small spatial scales that
they are unlikely to impose high forces on organisms that are larger than a few
centimeters. However, P. crassipes falls within the critical size range where it may
Fig. 6. Typical example of horizontal hydrodynamic forces on a large crab (carapace width of 4.2 cm) as a
function of time during two consecutive wave periods. Forces were calculated based on water velocities and
accelerations measured in the microhabitat of a crab at the wave-swept site. Accelerations were averaged over the
0.5-s interval between velocity readings. Acceleration at the maximum velocity reading during half of the wave
period was manually set at 0 m/s2. Acceleration reaction forces were calculated for the midpoint of this 0.5-s
interval. Velocity was assumed to change linearly over the interval and drag was calculated at the midpoint of the
interval, using an average velocity calculated for that interval. Total horizontal hydrodynamic force was calculated
at the midpoint of each interval as the sum of the acceleration reaction and the drag. Inset shows corresponding
water velocity in the seaward-shoreward axis over the two wave periods.

Fig. 7. Effect of water acceleration on the critical water velocity necessary to dislodge a crab on different
substrata: (A) rugose rock, (B) smooth rock and (C) mud. Critical velocities were calculated using individual
weight, tenacity and posture measurements for a large and a small crab plus mean hydrodynamic coefficients of
all crabs. Solid lines indicate values for a large crab (carapace width of 4.2 cm). Dashed lines indicate values for a
small crab (carapace width of 2.2 cm). Thick lines are values for overturning and thin lines are values for shearing
off the substratum. Squares and triangles represent water-flow values for a wave-swept environment reported by
Denny et al. (1985) and Gaylord (2000), respectively. Circles represent water-flow values measured in this study
at the wave-swept site whereas diamonds represent water flow values measured at the estuarine site. Filled
symbols indicate water flow at the maximum acceleration recorded with simultaneous velocity. Open symbols
indicate water flow at the maximum velocity recorded with simultaneous acceleration.
W.W.Y. Lau, M.M. Martinez / J. Exp. Mar. Biol. Ecol. 295 (2003) 1–21 17

W.W.Y. Lau, M.M. Martinez / J. Exp. Mar. Biol. Ecol. 295 (2003) 1–2118
experience acceleration reaction as a significant proportion of net hydrodynamic force
in wave-swept environments. Although hydrodynamic forces are no longer believed to
limit directly the size of intertidal animals (Denny, 1999), these forces can determine
the dislodgement and mobility of animals (Martinez, 2001).
The danger of being sheared away or overturned also depends on the size of the
crab and on the type of substratum (Fig. 7). Not only does tenacity depend on body
size (Fig. 5), but drag and lift scale to area (length2), while acceleration reaction and
weight scale to volume (length3). As a crab increases in size, acceleration reaction
increases disproportionately faster than drag and lift. Hence, a crab is more likely to be
sheared off the substratum than to be overturned, on any substratum (Fig. 7). On rugose
substratum, large crabs can withstand higher water velocities than small crabs in flow
situations with low accelerations. In contrast, in waves with higher accelerations, small
crabs can withstand higher velocities than big crabs. On a relatively smooth rock
substratum, however, faster water flow is required to dislodge small crabs than large
ones in both waves with low accelerations and waves with high accelerations (Fig. 7).
Rugose rock substrata have large bumps and holes that crabs of all sizes can hold on
to; smooth rock substrata have very fine surface variations (Fig. 5) that only small
crabs with small dactyls can grip. Therefore, on smooth rock, small crabs are able to
exert higher tenacities relative to the hydrodynamic forces they experience than can
larger crabs.
In addition to actively grasping the substratum, crabs can decrease the risk of
dislodgement by hiding in crevices among the rocks at the wave-swept site (personal
observation). This behavior may shield crabs from predation and dessication, as well as
reduce the flow velocity and thus the hydrodynamic forces to which crabs are exposed.
Similar to sea anemones, crabs may hide among rocks and depressions where the local
velocities can be much lower than freestream velocities for relief from high hydrody-
namic forces (Koehl, 1977).
4.3. Habitat variability
Although crabs have behaviors to resist dislodgement, habitat variability in flow and
substratum characteristics can affect the animal’s ability to respond appropriately.
Compared to the unidirectional flow in the estuarine site, the back-and-forth flow in
the wave-swept site generates more variability in water velocity on the order of seconds
(Fig. 1). Turbulent fluctuations are superimposed on mean water flow, thus small-scale
instantaneous flow velocities can be different in both magnitude and direction than the
mean flow (Denny, 1988). Such variation in flow velocity can reduce or increase the net
instantaneous hydrodynamic force an animal experiences. Because of the much higher
absolute turbulence, crabs in the wave-swept site experience not only greater peak
hydrodynamic forces but also greater changes in force from one instant to the next than
crabs at the estuarine site. Greater turbulence can also lead to more variability in the
angle of attack relative to the direction of the flow, making a crab more susceptible to
dislodgement by lift (Fig. 3).
Heterogeneity of the substratum in the field can also produce variability in the crabs’
tenacity on the substratum. We observed that when being pulled crabs actively searched

W.W.Y. Lau, M.M. Martinez / J. Exp. Mar. Biol. Ecol. 295 (2003) 1–21 19
for ‘‘handles’’ or bumps on the substratum to grasp. In the natural environment, crabs are
unlikely to have instant access to rugosity elements that they can grasp tightly. Thus,
whether a crab gets dislodged depends on where the crab is standing and the instantaneous
flow across its body.
Crabs of any size can exert greater tenacity on the rocky substrata of the wave-swept
site than on the mud of the estuarine site. However, availability of roughness elements is
random. Whether a crab will have a hold of the substratum is unpredictable from one
step to the next as it locomotes across a rock. Because the next step is less predictable
(in both substratum relief and in magnitude and direction of ambient water flow), we
would expect crabs at the rocky, wave-swept site, to move around less underwater than
do estuarine crabs. Furthermore, it might be harder to recover locomotory position once
a crab is dislodged in more variable wave-swept rocky sites, than in a less variable
estuarine environment.
4.4. Ecological consequences
Behaviors that increase a crab’s tenacity or reduce the hydrodynamic forces
encountered are also likely to restrict a crab’s motility by affecting speed and
manueverability and the spatial and temporal range of movement. Reduced mobility
can lead to higher susceptibility to predation. P. crassipes is prone to predation by
terrestrial predators such as birds, rats, and raccoons, and by sit-and-wait, marine
predators such as sea anemones (Morris et al., 1980). The crabs’ main defense from
predators is to run to cover between rocks (Hiatt, 1948). Decreased locomotor
performance in water can leave a crab exposed to greater predation if it cannot quickly
reach refuge. Reduced mobility can also restrict the temporal and spatial range of
movement. A crab that is forced to hide or cling tightly to the substratum during rapid
flow conditions will have reduced access to both food and mates and will be restricted
to what is nearby and near protective cover. Lastly, dislodgement from the substratum
may result in death if the crab is deposited in unsuitable habitats, is bashed against
rocks, or is washed into the grasp of a predator, such as a sea anemone.
Because of the constraints associated with resisting dislodgement, crabs living in
more protected water flow habitats may move around more and utilize greater individual
ranges along the shore, as do some predatory snails (Menge, 1978b). Wave action may
restrict a crab’s foraging rate as has been suggested for the spiny lobster Panulirus
interruptus Randall (Robles, 1987) and other rocky-shore animals (Denny, 1994).
Furthermore, because crabs in the wave-swept environment use crevices as refuges
from rapid water flow, crab densities and size distributions in these physically severe
habitats may be influenced by the availability of crevices rather than by food, as argued
for gastropods (Menge, 1978b).
Crab size alone is not a good predictor of dislodgement. Our calculations predict that
the mobility of small crabs is more restricted than that of large ones on rugose and
muddy substrata, but not on smooth rock substrata. Although water flow in the field can
be sufficient to dislodge a crab from the substratum, the water-flow microhabitat and the
interaction of tenacity with substratum characteristics are also important factors that
determine whether a crab will be dislodged.

W.W.Y. Lau, M.M. Martinez / J. Exp. Mar. Biol. Ecol. 295 (2003) 1–2120
Acknowledgements
This research was supported by NSF grants OCE-9217338 and OCE-9907120 to
M.A.R. Koehl, the University of California Natural Reserve System Robert Norris
Undergraduate Research Grant and the University of California President’s Undergraduate
Fellowship to W. Lau, and NSF Graduate Fellowship to M. Martinez. We are especially
grateful to our adviser M.A.R. Koehl for her encouragement, guidance and advice
throughout the entire project. We thank P. Connors and the University of California
Natural Reserve System for use of facilities at Bodega Marine Laboratory, and M. Denny
and B. Gaylord for use of acceleration reaction measuring tow tank in their lab. We are
indebted to M. Denny and B. Gaylord for instructions and help with acceleration reaction
measurements, to B. Wagner, J. Pearson and K. Araf for their invaluable help in the field,
and to J. Jed and T. Cooper for technical assistance in the lab. [AU]
References
Anderson, S.M., Charters, A.C., 1982. A fluid dynamics study of seawater flow through Gelidium nudifrons.
Limnol. Oceanogr. 27, 399–412.
Bill, R., Herrnkind, W., 1976. Drag reduction by formation movement in spiny lobsters. Science 193,
1146–1148.
Black, 1976. The effects of grazing by the limpet, Acmaea insessa, on the kelp Egregia laevigata. Ecology 57,
265–277.
Blake, R.W., 1985. Crab carapace hydrodynamics. J. Zool. Lond. A 207, 407–423.
Blanchette, C.A., 1997. Size and survival of intertidal plants in response to wave action: a case study with Fucus
gardneri. Ecology 78, 1563–1578.
Branch, G.M., Marsh, A.C., 1978. Tenacity and shell shape in six Patella species: adaptive features. J. Exp. Mar.
Biol. Ecol. 34, 111–130.
Daniel, T.L., 1984. Unsteady aspects of aquatic locomotion. Am. Zool. 24, 121–134.
Denny, M.W., 1988. Biology and the Mechanics of the Wave-swept Environment. Princeton Univ. Press,
Princeton.
Denny, W., 1989. A limpet shell shape that reduces drag: laboratory demonstrations of a hydrodynamic mech-
anism and an exploration of its effectiveness in nature. Can. J. Zool. 67, 2098–2106.
Denny, M.W., 1994. Roles of hydrodynamics in the study of life on wave-swept shores. In: Wainwright, P.C.,
Reilly, S.M. (Eds.), Ecological Morphology. University of Chicago Press, Chicago, pp. 169–204.
Denny, M., 1999. Are there mechanical limits to size in wave-swept organisms? J. Exp. Biol. 202, 3463–3467.
Denny, M.W., Gaylord, B., 1996. Why the urchin lost its spines: hydrodynamic forces and survivorship in three
echinoids. J. Exp. Biol. 199, 717–729.
Denny, M.W., Daniel, T.L., Koehl, M.A.R., 1985. Mechanical limits to size in the wave-swept organisms. Ecol.
Monogr. 55, 69–102.
Doty, M.S., 1971. Measurement of water movement in reference to benthic algal growth. Bot. Mar. 14, 32–35.
Dudley, R., 1985. Fluid-dynamic drag of limpet shells. Veliger 28, 6–13.
Gaylord, B., 2000. Biological implications of surf-zone flow complexity. Limnol. Oceanogr. 45, 174–188.
Gaylord, B., Blanchette, C.A., Denny, M.W., 1994. Mechanical consequences of size in wave-swept algae. Ecol.
Monogr. 64, 287–313.
Hart, D.D., Clark, B.D., Jasentuliyana, A., 1996. Fine-scale field measurement of benthic flow environments
inhabited by stream invertebrates. Limnol. Oceanogr. 41, 297–308.
Hiatt, R.W., 1948. Biology of the lined shore crab, Pachygrapsus crassipes Randall. Pacif. Sci. 2, 134–213.
Jacklyn, P.M., Ritz, D.A., 1986. Hydrodynamics of swimming in scyllarid lobsters. J. Exp. Mar. Biol. Ecol. 101,
85–99.

W.W.Y. Lau, M.M. Martinez / J. Exp. Mar. Biol. Ecol. 295 (2003) 1–21 21
Koehl, M.A.R., 1977. Effects of sea anemones on the flow forces they encounter. J. Exp. Biol. 69, 87–105.
Koehl, M.A.R., 1982. The interaction of moving water and sessile organisms. Sci. Am. 247, 124–134.
Koehl, M.A.R., 1984. How do benthic organisms withstand moving water? Am. Zool. 24, 57–70.
Koehl, M.A.R., Alberte, R.S., 1988. Flow, flapping, and photosynthesis of Nerocystis luetkeana: a functional
comparison of undulate and flat blade morphologies. Mar. Biol. 99, 435–444.
Lindberg, D.R., 1985. Crab predation on intertidal populations of the urchin Strongylocentrotus purpuratus. Bull.
Soc. Calif. Acad. Sci. 84, 109–111.
Martinez, M.M., 2001. Running in the surf: hydrodynamics of the shore crab Grapsus tenuicrustatus. J. Exp.
Biol. 204, 3097–3112.
Martinez, M.M., Full, R.J., Koehl, M.A.R., 1998. Underwater punting by an intertidal crab: a novel gait revealed
by the kinematics of pedestrian locomotion in air vs. water. J. Exp. Biol. 201, 2609–2623.
Menge, B.A., 1978a. Predation intensity in a rocky intertidal community: effect of an algal canopy, wave action
and desiccation on predator feeding rates. Oecologia 34, 17–35.
Menge, B.A., 1978b. Predation intensity in a rocky intertidal community: relation between predator foraging
activity and environmental harshness. Oecologia 34, 1–16.
Morris, R.H., Abbott, D.P., Haderlie, E.C., 1980. Intertidal Invertebrates of California. Stanford Univ. Press,
Stanford, CA.
Myers, J.J. (Ed.), 1969. Handbook of Ocean and Underwater Engineering. McGraw-Hill, New York.
Nakagawa, T., 1982. On characteristics of the water-particle velocity in a plunging breaker. J. Fluid Mech. 126,
254–268.
Nowell, A.R.M., Jumars, P.A., 1984. Flow environments of aquatic benthos. Ann. Rev. Ecol. Syst. 15, 303–328.
Quammen, M., 1984. Predation by shorebirds, fish, and crabs on invertebrates in intertidal mudflats: an exper-
imental test. Ecology 65, 529–537.
Robles, C., 1987. Predator foraging characteristics and prey population structure on a sheltered shore. Ecology
68, 1502–1514.
Sousa, W.P., 1979a. Disturbance in marine intertidal boulder fields: the nonequilibrium maintenance of species
diversity. Ecology 60, 1225–1239.
Sousa, W.P., 1979b. Experimental investigations of disturbance and ecological succession in a rocky intertidal
algal community. Ecol. Monogr. 49, 227–254.
Spaargaren, D.H., 1979. Hydrodynamic properties of benthic marine crustacea: I. Specific gravity and drag
coefficients. Mar. Ecol. Prog. Ser. 1, 351–359.
Thomas, F.I.M., Atkinson, M.J., 1997. Ammonium uptake by coral reefs: effects of water velocity and surface
roughness on mass transfer. Limnol. Oceanogr. 42, 81–88.
Vogel, S., 1994. Life in Moving Fluids. Princeton Univ. Press, Princeton.
Vogel, S., LaBarbera, M., 1978. Simple flow tanks for research and teaching. BioScience 28, 638–643.
Yu, Y., Sternberg, R.W., Beach, R.A., 1993. Kinematics of breaking waves and associated suspended sediment in
the nearshore zone. Cont. Shelf Res. 13, 1219–1242.