geotechnical earthquake engineering for seismic design design framework.pdf · geotechnical...
TRANSCRIPT

Geotechnical Earthquake Engineering for Seismic Design
Prof. Ellen M. Rathje, Ph.D., P.E.University of Texas at Austin
Jeff Bachhuber M S C E GJeff Bachhuber, M.S., C.E.G. Ranon Dulberg
Fugro/William Lettis and AssociatesProf. Brady R. Cox, Ph.D., P.E.
University of Arkansas
18-19 November 2010
Seismic Design Framework: gCharacterizing sources and
estimating ground shaking for designestimating ground shaking for design
Prof. Ellen M. Rathje, Ph.D., P.E.
Department of Civil Architectural andDepartment of Civil, Architectural, and Environmental Engineering
University of Texas at Austin
18 November 2010
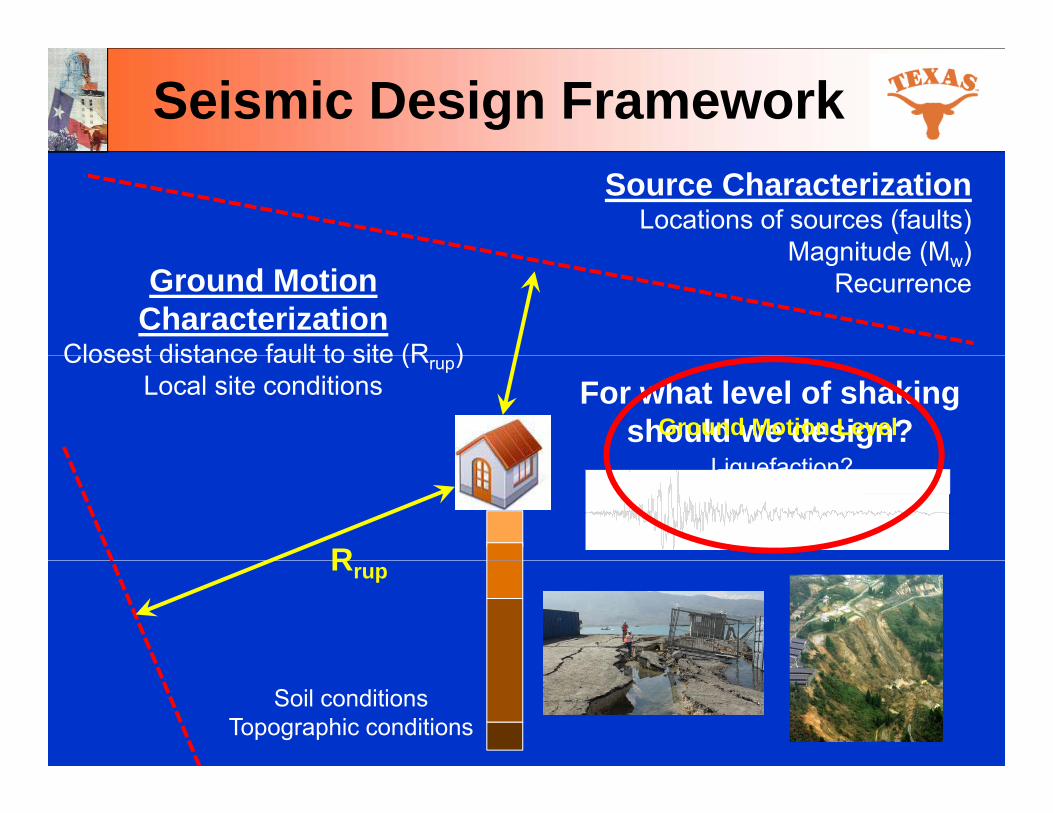
Seismic Design FrameworkSource Characterization
Locations of sources (faults)Magnitude (M )Magnitude (Mw)
RecurrenceGround Motion Characterization
Closest distance fault to site (R )For what level of shaking
should we design?
Closest distance fault to site (Rrup)Local site conditions
Ground Motion LevelLi f i ?
Palo Alto
R
Liquefaction?Landslide?
Rrup
Soil conditionsTopographic conditions
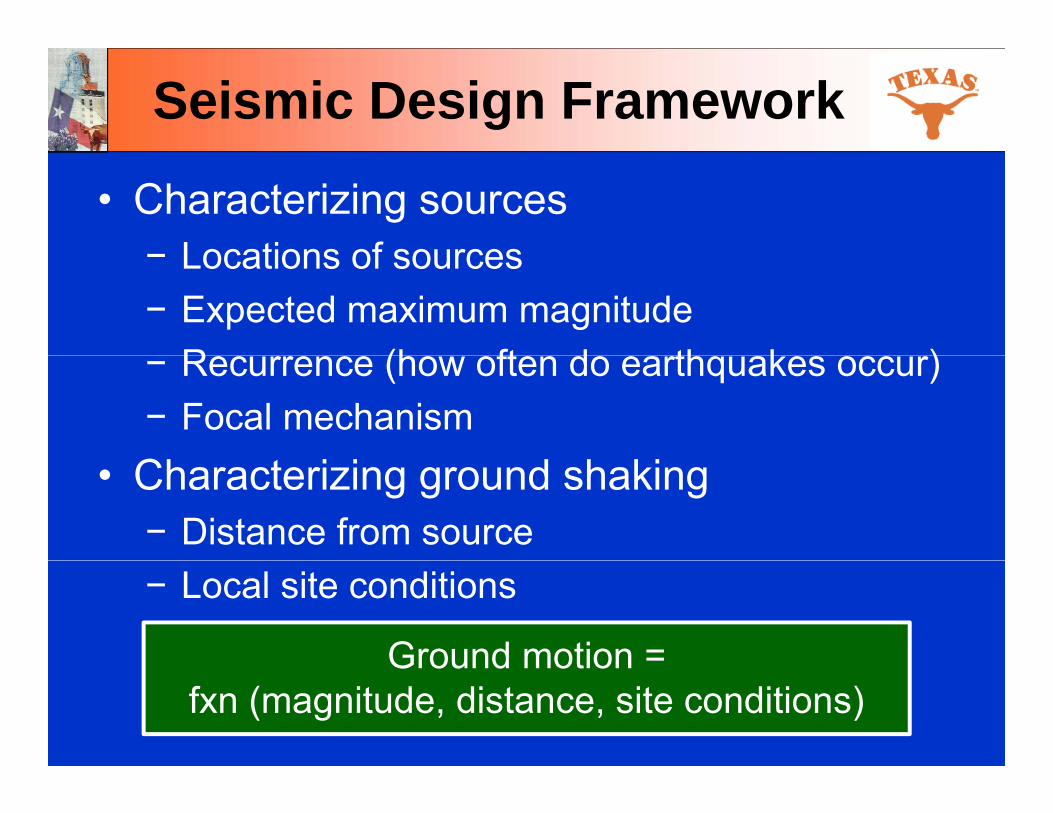
Seismic Design Framework
• Characterizing sourcesLocations of sources− Locations of sources
− Expected maximum magnitudeR (h ft d th k )− Recurrence (how often do earthquakes occur)
− Focal mechanism• Characterizing ground shaking
− Distance from source− Local site conditions
Ground motion =Ground motion fxn (magnitude, distance, site conditions)
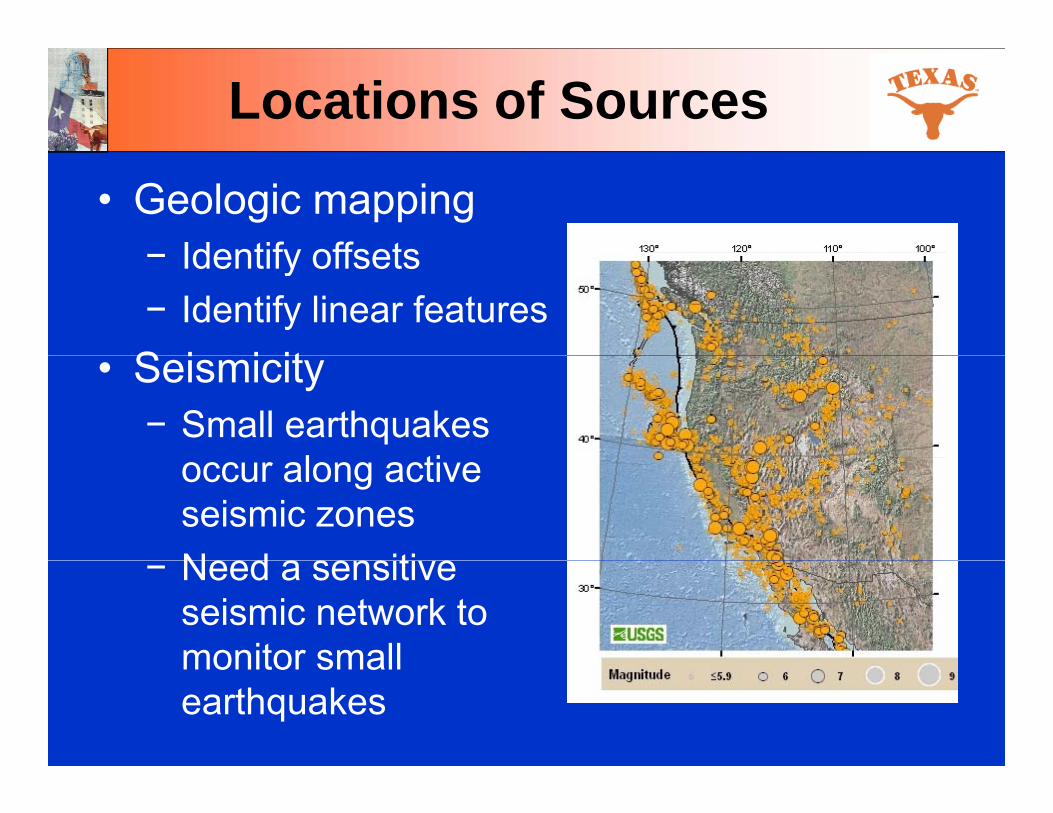
Locations of Sources
• Geologic mappingIdentify offsets− Identify offsets
− Identify linear featuresS i i it• Seismicity− Small earthquakes
l tioccur along active seismic zonesNeed a sensiti e− Need a sensitive seismic network to monitor smallmonitor small earthquakes
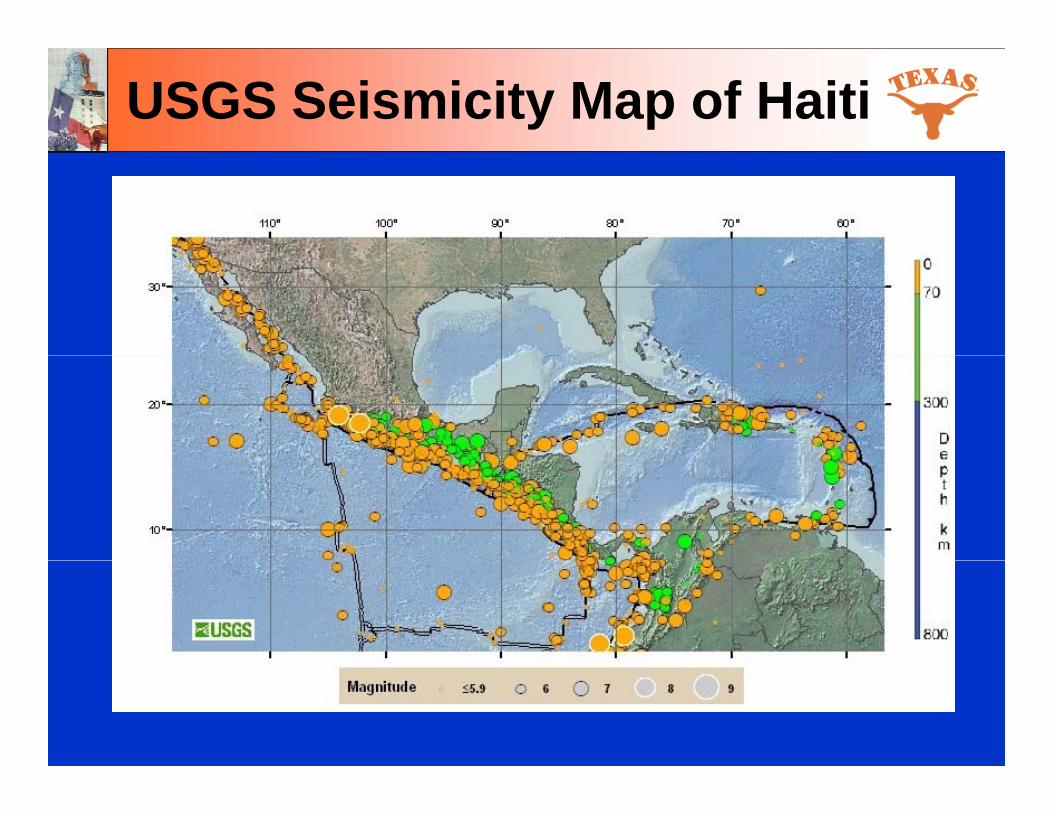
USGS Seismicity Map of Haiti
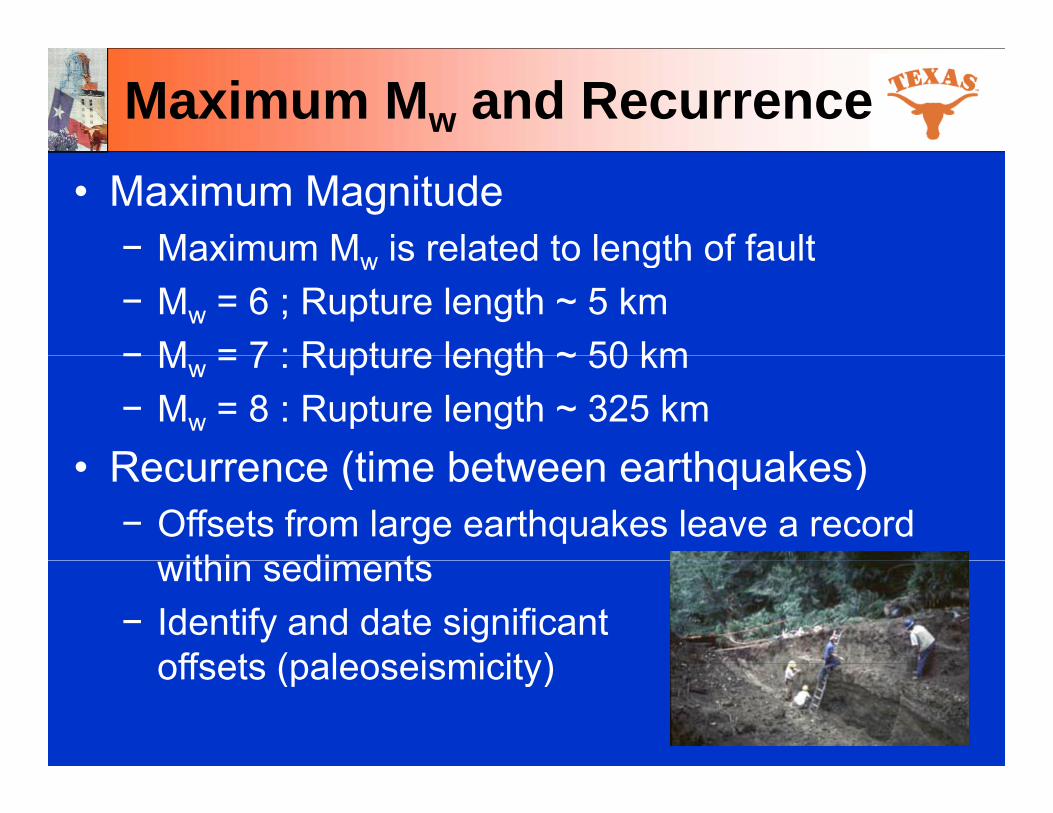
Maximum Mw and Recurrence• Maximum Magnitude
− Maximum M is related to length of faultMaximum Mw is related to length of fault− Mw = 6 ; Rupture length ~ 5 km− M = 7 : Rupture length ~ 50 km− Mw = 7 : Rupture length ~ 50 km− Mw = 8 : Rupture length ~ 325 km
R (ti b t th k )• Recurrence (time between earthquakes)− Offsets from large earthquakes leave a record
ithi di twithin sediments− Identify and date significant
offsets (paleoseismicity)offsets (paleoseismicity)
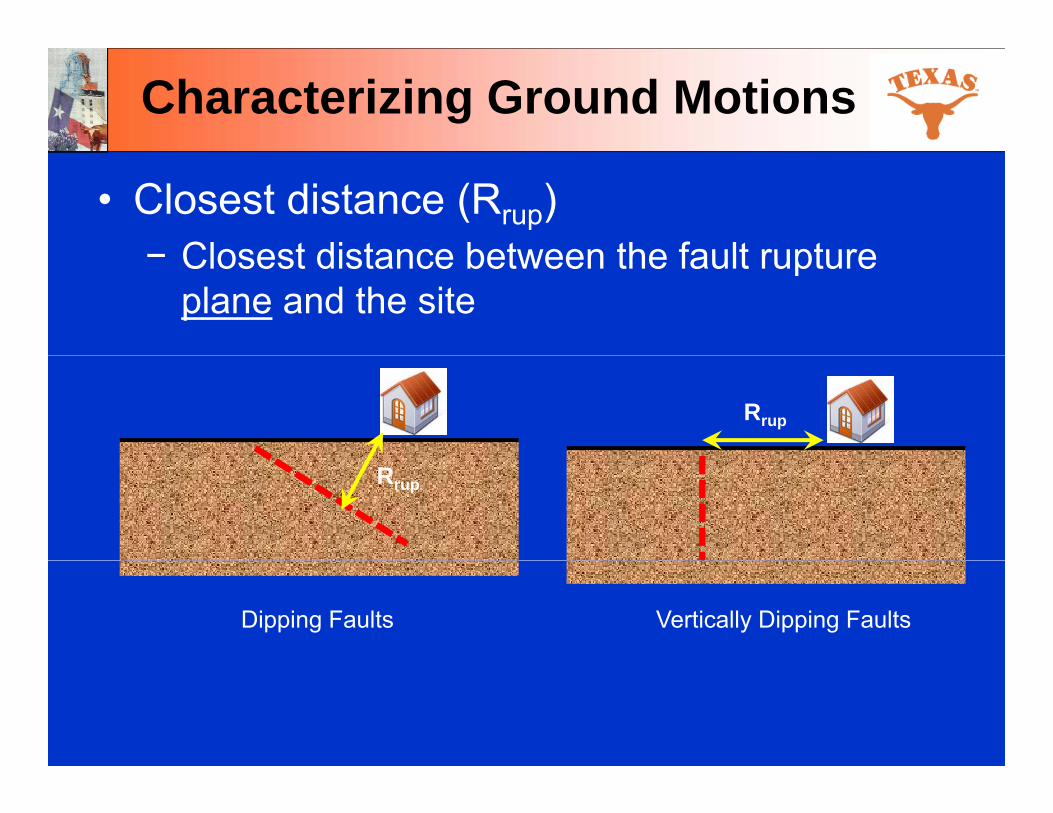
Characterizing Ground Motions
• Closest distance (Rrup)Closest distance between the fault rupture− Closest distance between the fault rupture plane and the site
Rrup
Rrup
Dipping Faults Vertically Dipping Faults
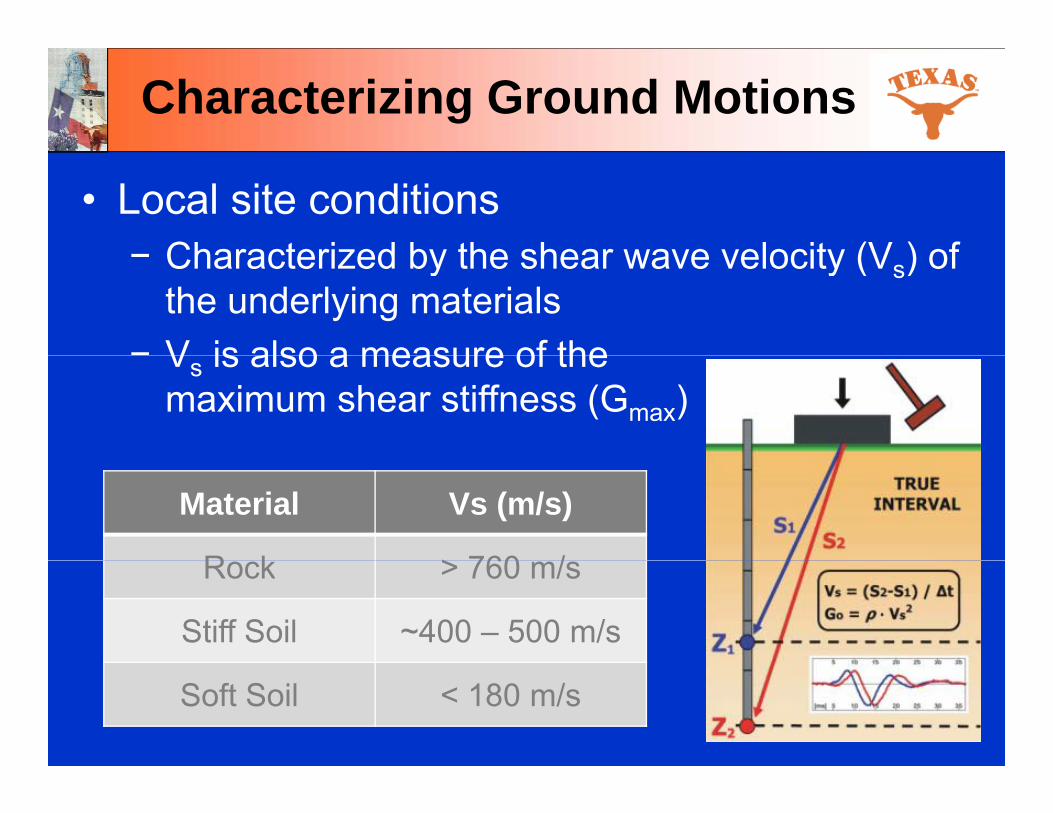
Characterizing Ground Motions
• Local site conditionsCharacterized by the shear wave velocity (V ) of− Characterized by the shear wave velocity (Vs) of the underlying materials
− V is also a measure of theVs is also a measure of the maximum shear stiffness (Gmax)
Material Vs (m/s)
R k > 760 /Rock > 760 m/s
Stiff Soil ~400 – 500 m/s
Soft Soil < 180 m/s
Predicting Ground Shaking
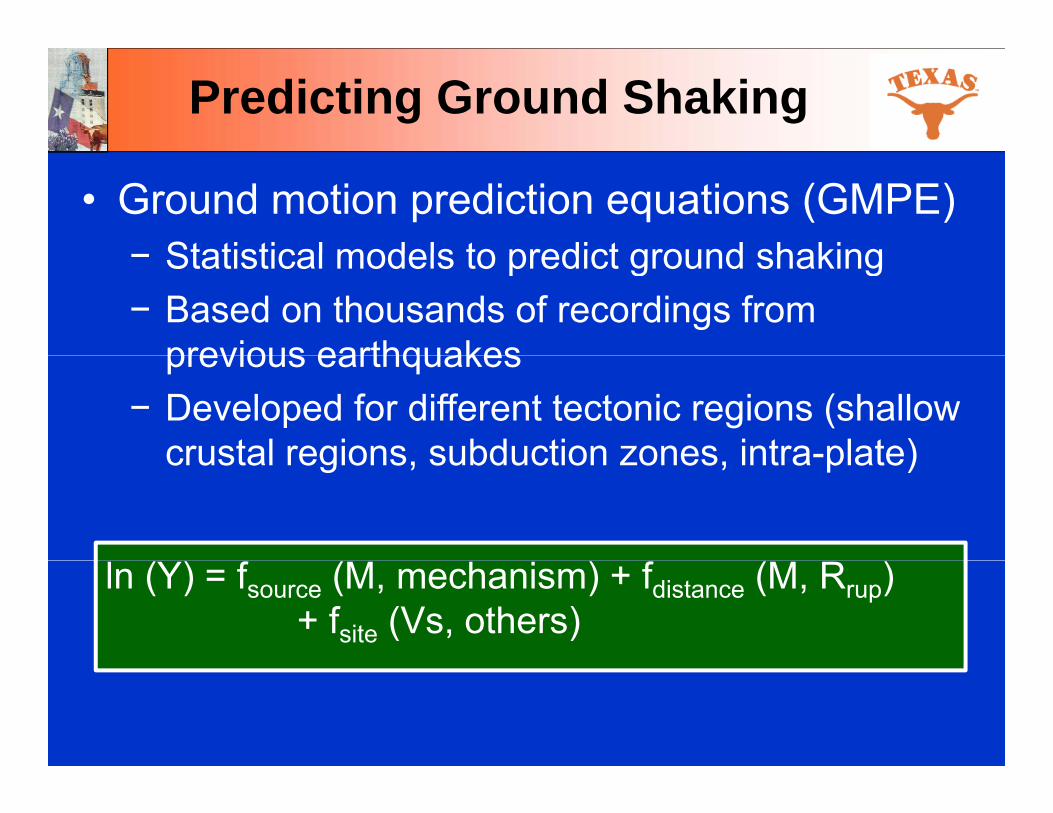
• Ground motion prediction equations (GMPE)Statistical models to predict ground shaking− Statistical models to predict ground shaking
− Based on thousands of recordings from previous earthquakesprevious earthquakes
− Developed for different tectonic regions (shallow crustal regions subduction zones intra-plate)crustal regions, subduction zones, intra plate)
ln (Y) = fsource (M, mechanism) + fdistance (M, Rrup) + fsite (Vs, others)
Predicting Ground Shaking
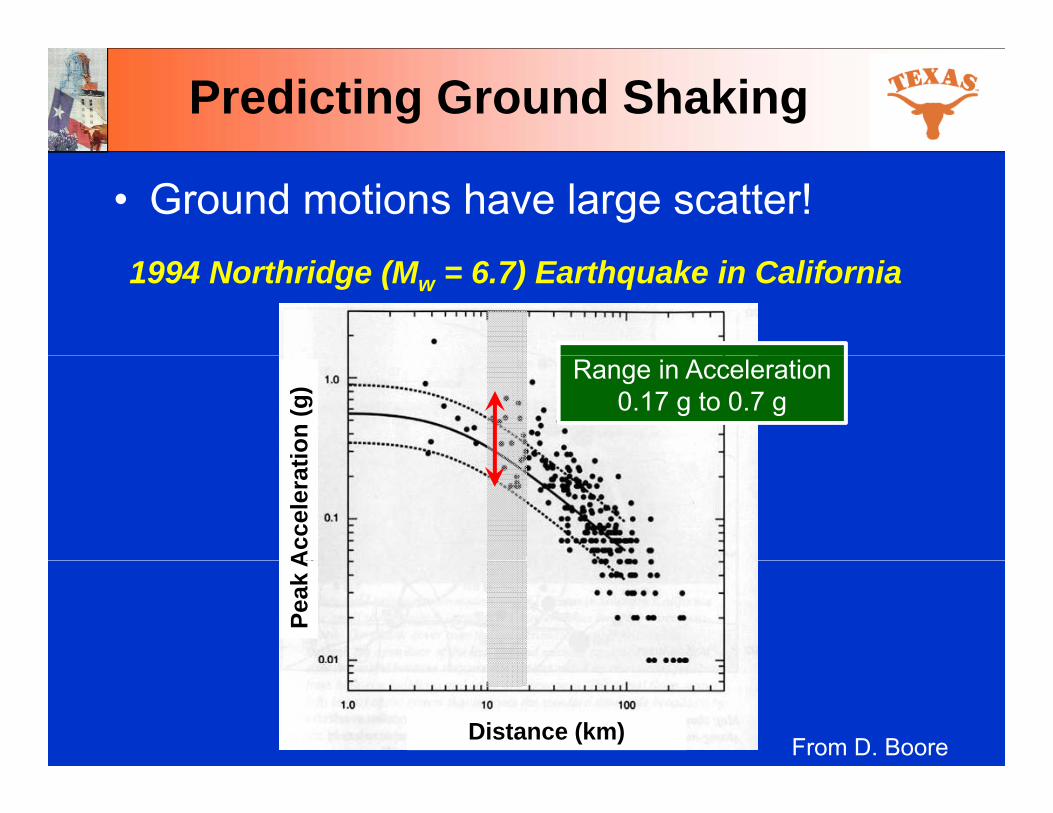
• Ground motions have large scatter!1994 Northridge (Mw = 6.7) Earthquake in California
ion
(g) Range in Acceleration
0.17 g to 0.7 g
Acc
eler
atPe
ak A
From D. BooreDistance (km)

Liquefaction
• Liquefaction occurs in loose, saturated dsand
Saturated: Below the ground water table
Loose: Assessed by the Standard PenetrationStandard Penetration Test blowcount (N)
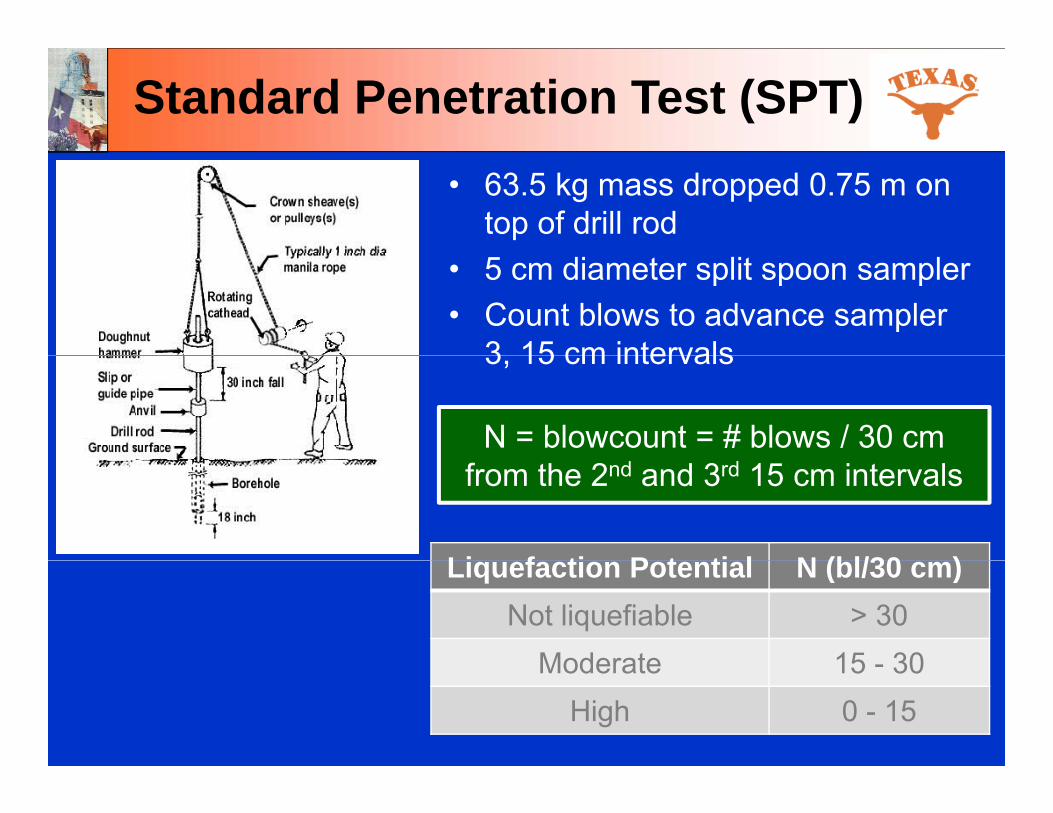
Standard Penetration Test (SPT)• 63.5 kg mass dropped 0.75 m on
top of drill rod• 5 cm diameter split spoon sampler • Count blows to advance sampler
3 15 cm intervals3, 15 cm intervals
N = blowcount = # blows / 30 cm from the 2nd and 3rd 15 cm intervals
Li f ti P t ti l N (bl/30 )Liquefaction Potential N (bl/30 cm)Not liquefiable > 30
Moderate 15 30Moderate 15 - 30High 0 - 15
Earthquake-Induced Landslides
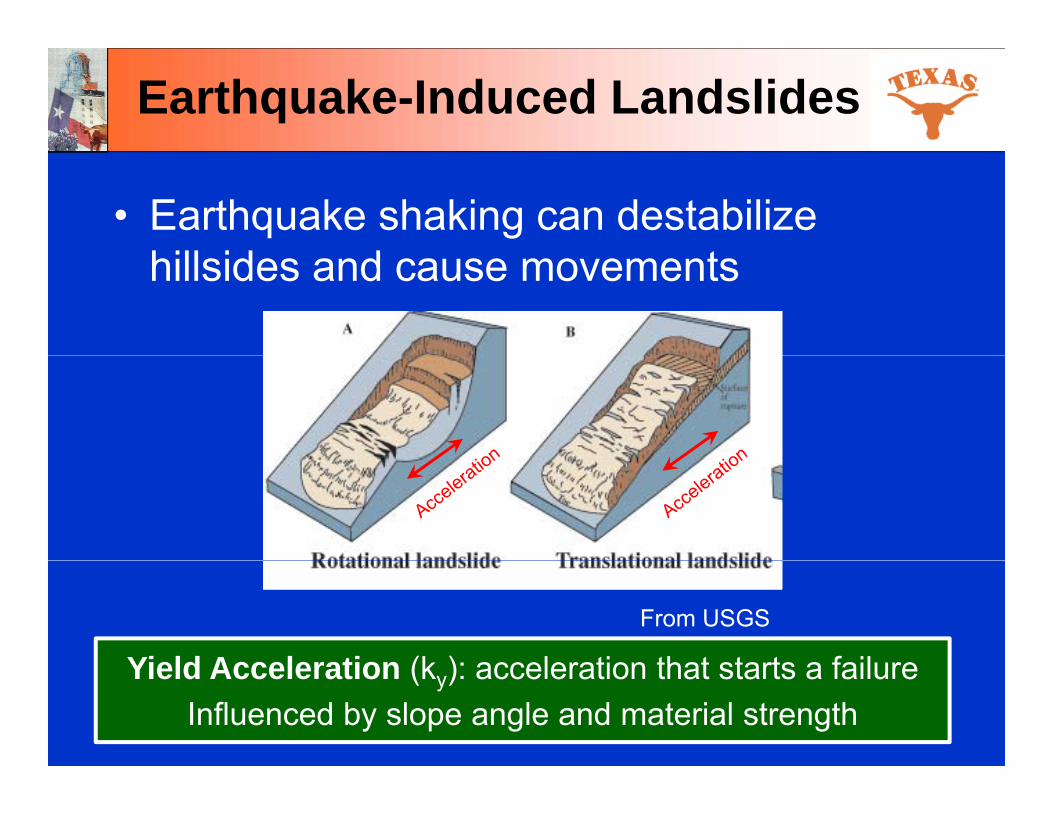
• Earthquake shaking can destabilize hill id d thillsides and cause movements
From USGS
Yield Acceleration (k ): acceleration that starts a failureYield Acceleration (ky): acceleration that starts a failureInfluenced by slope angle and material strength

Maps of ky
ky Map
DEM
Slope Angle
Shear Strength (c, )
Data from California Geological Survey (CGS) for Mint Canyon
Quadrangle
Seismic Design Framework
• Characterizing sourcesLocations of sources− Locations of sources
− Expected maximum magnitude, mechanismR (h ft )− Recurrence (how often)
• Characterizing ground shaking− Distance from source− Local site conditions
• Additional effects− Liquefactionq− Landslides