geometric universe model – earth centered · l i b r a r i e s a l e x a n d e r e l d e r l i b...
TRANSCRIPT
L I B R A R I E S
A L E X A N D E R E L D E R L I B R A R Y
Introduction:
The teachings of Dr. Alexander Elder, international bestselling author, are the basis for this rare and exceptional library. Based on his world‐renown books, “Come into my trading room” and “Trading for a living”, this library is aimed at the beginning trader as well as the seasoned veteran. It will help you master the three key aspects of trading as noted by Dr. Elder: Mind, Method and Money. (NOTE: Although this library is an interpretation of Dr. Alexander Elder's books, Dr. Elder was not involved in the creation of this library.)
Benefits:
Packed into this library are new ideas such as, Auto Adjusting Envelopes and Market Temperature. With 30 new functions and 9 new templates, this library offers a great value for Trade Navigator users of Silver, Gold and Platinum.
Included in this Library: Templates
Elder Triple Screen
Elder Thermometer
Elder Smooth ROC
Elder Safe Zones
Elder Release
Elder Ray
Elder DMI
Elder Daily Look
Elder Chandelier Stops
Highlight Bars Impulse Buy
Impulse Release Buy
Impulse Release No Trade
Impulse Release Sell
Impulse take your pick
Market temperature triple
Spike
Temperature under the average
Indicators AVG Temp
Bear Power
Bull Power
Chandelier Long
Chandelier Short
Channel Elder
Force Index 13 bar
Force Index
Impulse
Impulse 2
Impulse Histogram
LongSafeZone
MacPlot
MacPlot B
ShortSafeZone
Smoothed Rate Change
Temperature
TN ‐L IB ‐018 ‐1011 A l e x a n d e r E l d e r L i b r a r yPage 1

L I B R A R I E S
Templates
Elder Triple Screen Template
Screenshot of the Elder Triple Screen Template applied to the chart.
Indicator featured on the Elder Triple Screen Template:
Force Index 13 bar Helps identify turning points in any market by tying together three essential pieces of information —the direction of price movement, its extent, and volume.
Elder Thermometer Template
Screenshot of the Elder Thermometer Template applied to the chart
TN ‐L IB ‐018 ‐1011 A l e x a n d e r E l d e r L i b r a r yPage 2
L I B R A R I E S
Indicators and Highlight bars featured on the Elder Thermometer Template Temperature Thermometer helps differentiate between sleepy, quiet periods and hot episodes when market crowds become excited. It can help you adapt your trading to the current environment. AVG Temp The Market Thermometer is a measure of volatility. The formula is: Temperature = the greater of either (high ‐ high[1]) or (low[1] ‐ low)
1‐ Market temperature is always a positive number reflecting the absolute value of either the upward or downward extension of yesterday's range, whichever is greater.
Market temperature triple The Market Temperature Triple highlight bar shows when the temperature is greater than or equal to the Avg Temp times three. Temperature under the average This highlight bar shows when the Avg Temperature is greater than the Temperature by 5 bars or greater.
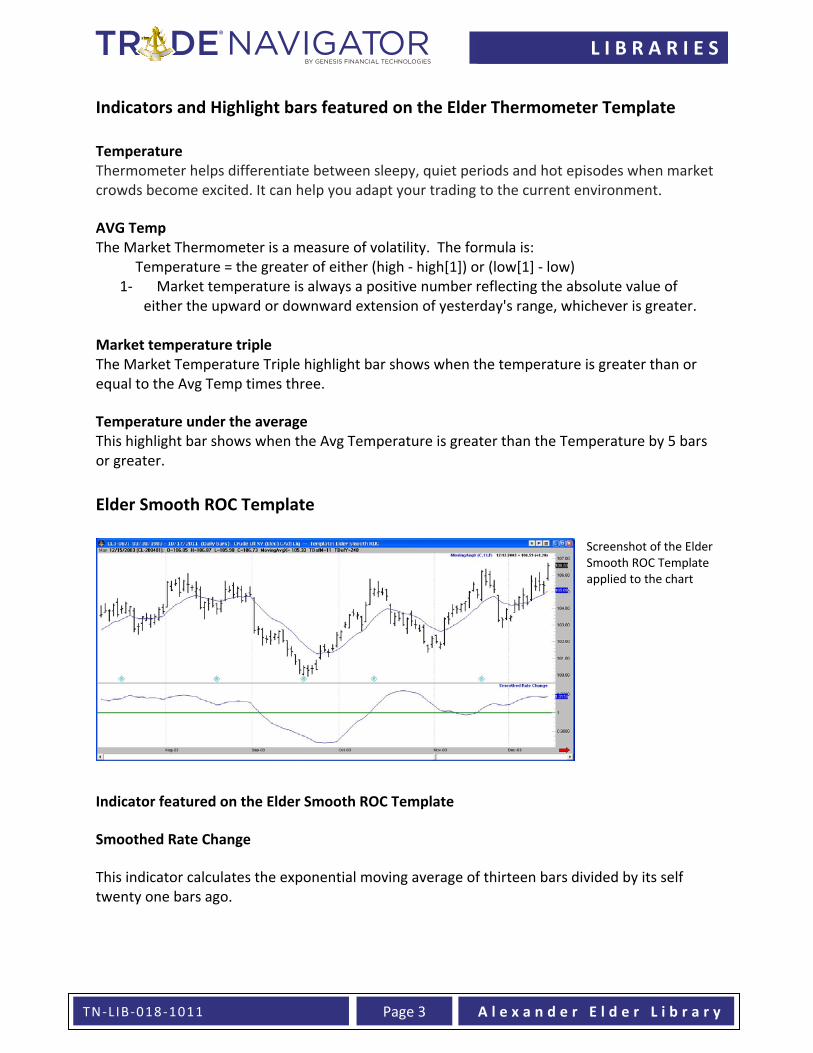
Elder Smooth ROC Template
Screenshot of the Elder Smooth ROC Template applied to the chart
Indicator featured on the Elder Smooth ROC Template Smoothed Rate Change This indicator calculates the exponential moving average of thirteen bars divided by its self twenty one bars ago.
TN ‐L IB ‐018 ‐1011 A l e x a n d e r E l d e r L i b r a r yPage 3

L I B R A R I E S
Elder Safe Zones Template
TN ‐L IB ‐018 ‐1011 Page 4 A l e x a n d e r E l d e r L i b r a r y
Screenshot of the Elder Safe Zones Template applied to the chart
Indicators featured on the Elder Safe Zones Template Long & ShortSafeZone A parabolic style indicator based on the Safe Zone Stop by Dr. Alexander Elder Elder Release Template
Screenshot of the Elder Release Template applied to the chart
Indicators and Highlight Bars featured on the Elder Release Template
Impulse Histogram This is a function that is used in the Impulse System. Impulse Release Buy Highlight bar based on the Impulse Function. Impulse Release No Trade Highlight bar based on the Impulse Function. Impulse Release Sell Highlight bar based on the Impulse Function.
L I B R A R I E S
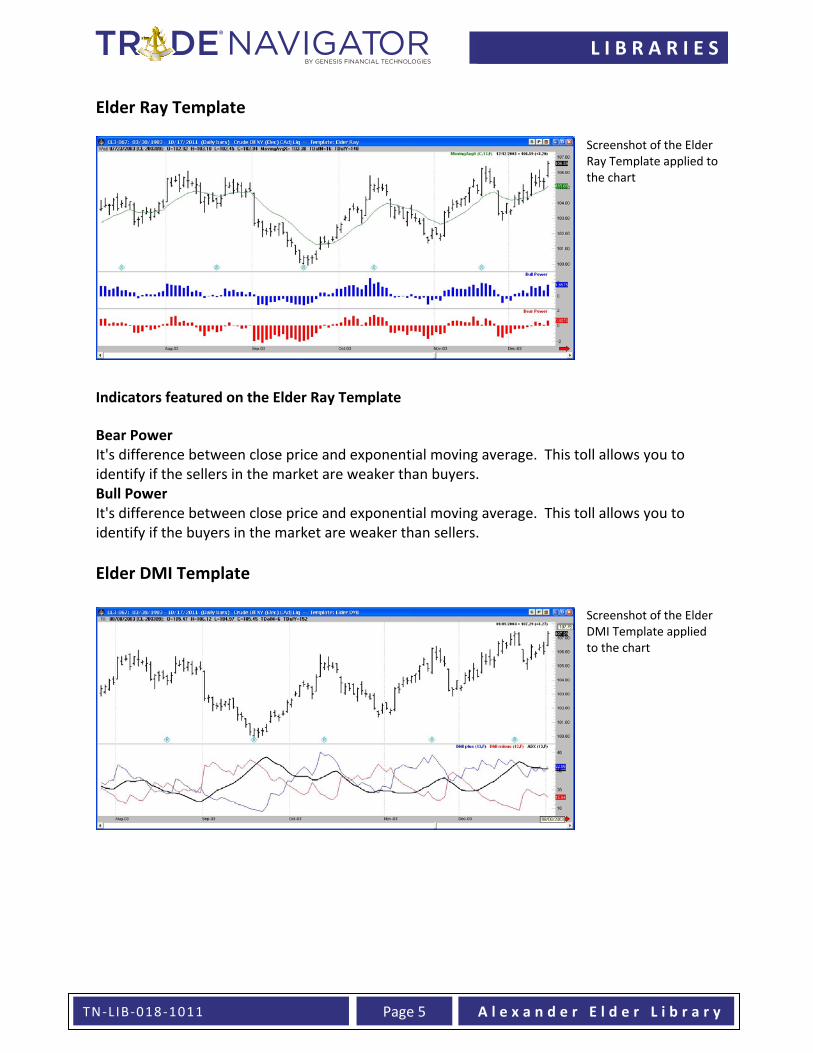
Elder Ray Template
Screenshot of the Elder Ray Template applied to the chart
Indicators featured on the Elder Ray Template Bear Power It's difference between close price and exponential moving average. This toll allows you to identify if the sellers in the market are weaker than buyers. Bull Power It's difference between close price and exponential moving average. This toll allows you to identify if the buyers in the market are weaker than sellers.
Elder DMI Template Screenshot of the Elder DMI Template applied to the chart
TN ‐L IB ‐018 ‐1011 A l e x a n d e r E l d e r L i b r a r yPage 5

L I B R A R I E S
Elder Daily Look Template
Screenshot of the Elder Daily Look Template applied to the chart
Indicators and Highlight Bars featured on the Elder Daily Look Template
AutoEnvelope Envelope channels are set parallel to the moving average (parallel to the slow MA if you use two MAs). The two channel lines must contain approximately 90‐95% of all prices for the past two or three months between them, with only the extremes protruding outside. Envelope channels provide attractive profit targets ‐ sell longs near the upper channel line and cover shorts near the lower channel line. The AutoEnvelope is a custom indicator ‐ an original tool that automatically sizes channels by calculating a standard deviation for the last 100 bars. It is designed to change value at most once a week, making it suitable even for intra‐day data. A change from Elder‐disk version 1.0 is that we now plot the EMA in addition to the AutoEnvelope. This combination allows you to change the EMA and have the envelope follow it without adjusting two separate indicators. If you do not want to see the moving average, go into the formula and delete the last line which reads "avg." AutoEnvelope Lower – Indicator AutoEnvelope Middle ‐ Indicator AutoEnvelope Upper – Indicator Force Index – Indicator Helps identify turning points in any market by tying together three essential pieces of information —the direction of price movement, its extent, and volume.
Impulse Buy and Sell Highlight bars based on the Impulse Function.
Impulse Histogram This is a function that is used in the Impulse System.
Impulse take your pick Highlight bar based on the Impulse Function.
TN ‐L IB ‐018 ‐1011 A l e x a n d e r E l d e r L i b r a r yPage 6
L I B R A R I E S
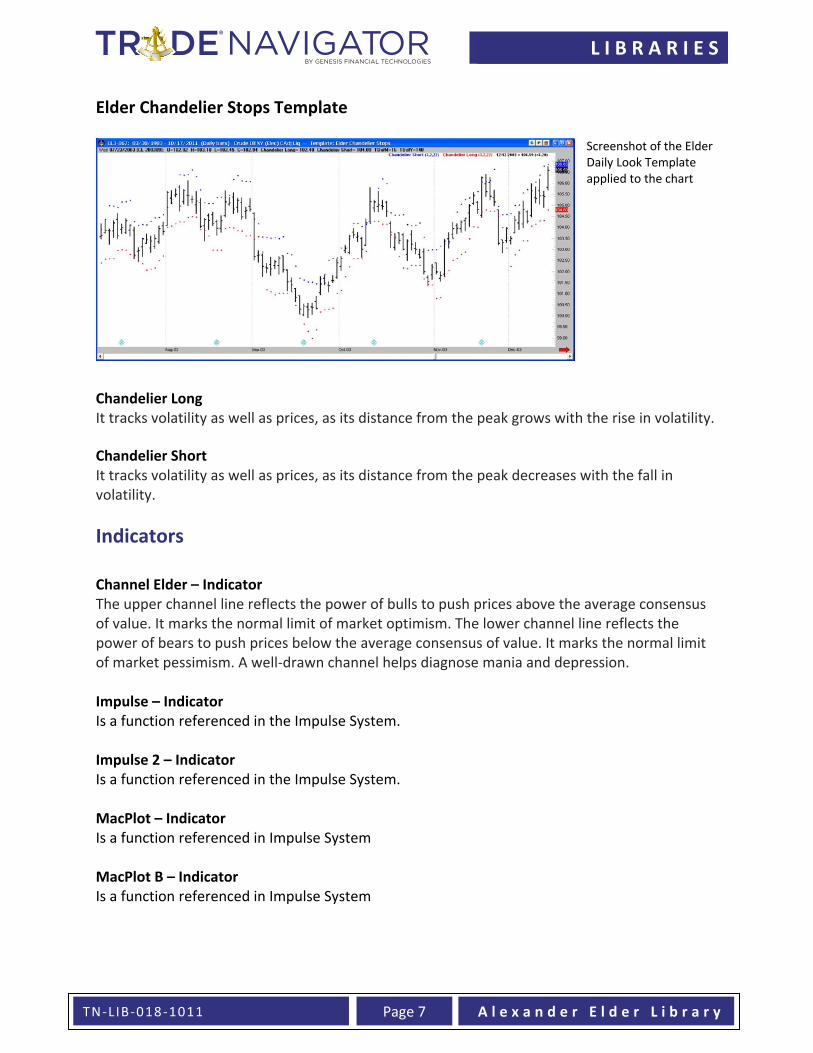
Elder Chandelier Stops Template
Screenshot of the Elder Daily Look Template applied to the chart
Chandelier Long It tracks volatility as well as prices, as its distance from the peak grows with the rise in volatility. Chandelier Short It tracks volatility as well as prices, as its distance from the peak decreases with the fall in volatility.
Indicators Channel Elder – Indicator The upper channel line reflects the power of bulls to push prices above the average consensus of value. It marks the normal limit of market optimism. The lower channel line reflects the power of bears to push prices below the average consensus of value. It marks the normal limit of market pessimism. A well‐drawn channel helps diagnose mania and depression. Impulse – Indicator Is a function referenced in the Impulse System. Impulse 2 – Indicator Is a function referenced in the Impulse System. MacPlot – Indicator Is a function referenced in Impulse System MacPlot B – Indicator Is a function referenced in Impulse System
TN ‐L IB ‐018 ‐1011 A l e x a n d e r E l d e r L i b r a r yPage 7