geographical information system based probabilistic models...
TRANSCRIPT
UNITED NATIONS E/CONF.100/IP.19 ECONOMIC AND SOCIAL COUNCIL Eighteenth United Nations Regional Cartographic Conference for Asia and the Pacific Bangkok, 26-29 October 2009 Item 7(b) of the provisional agenda Invited Papers
Geographical Information System Based Landslide Probabilistic
Model with Trivariate Approach - A case study in Sikkim Himalayas*
* Prepared by L.P Sharma, National Informatics Centre, Nilanchal Patel, Department of Remote Sensing, Birla Institute of Technology, M.K.Ghosh, Department of Computer Science, Sikkim Manipal Institute of Technology, P.Debnath, College of Agriculture Engineering & Post Harvest Technology, India
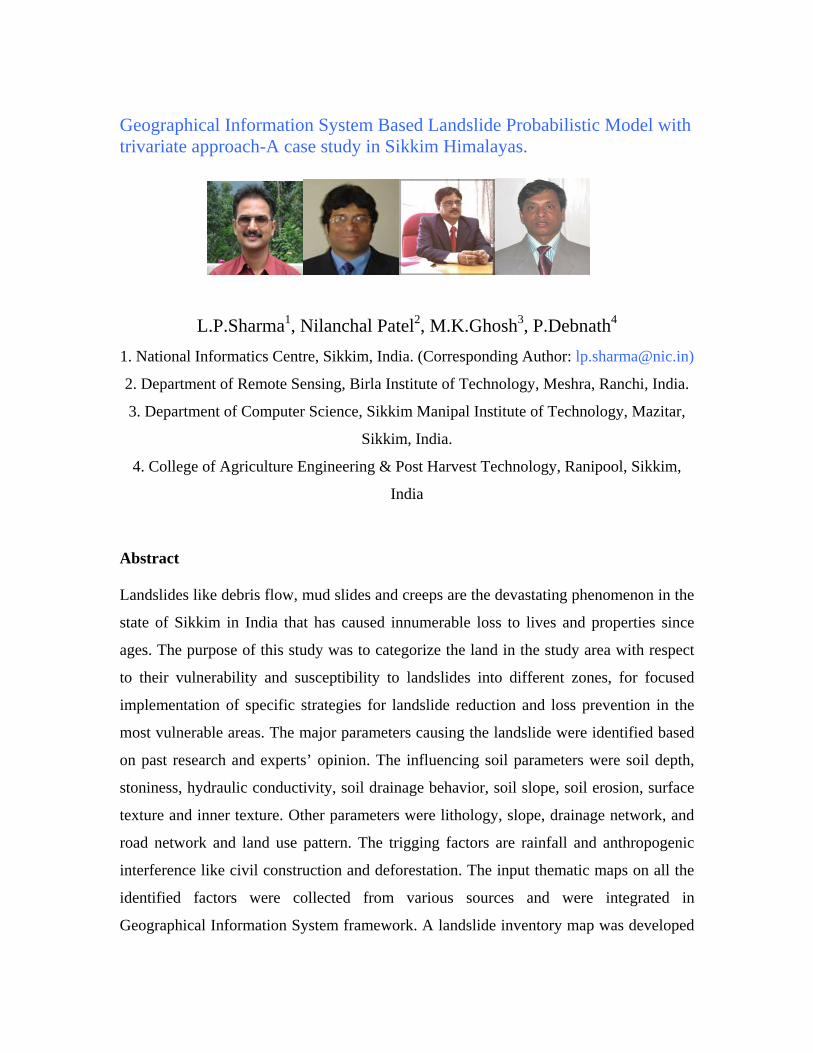
Geographical Information System Based Landslide Probabilistic Model with trivariate approach-A case study in Sikkim Himalayas.
L.P.Sharma1, Nilanchal Patel2, M.K.Ghosh3, P.Debnath4
1. National Informatics Centre, Sikkim, India. (Corresponding Author: [email protected])
2. Department of Remote Sensing, Birla Institute of Technology, Meshra, Ranchi, India.
3. Department of Computer Science, Sikkim Manipal Institute of Technology, Mazitar,
Sikkim, India.
4. College of Agriculture Engineering & Post Harvest Technology, Ranipool, Sikkim,
India
Abstract Landslides like debris flow, mud slides and creeps are the devastating phenomenon in the
state of Sikkim in India that has caused innumerable loss to lives and properties since
ages. The purpose of this study was to categorize the land in the study area with respect
to their vulnerability and susceptibility to landslides into different zones, for focused
implementation of specific strategies for landslide reduction and loss prevention in the
most vulnerable areas. The major parameters causing the landslide were identified based
on past research and experts’ opinion. The influencing soil parameters were soil depth,
stoniness, hydraulic conductivity, soil drainage behavior, soil slope, soil erosion, surface
texture and inner texture. Other parameters were lithology, slope, drainage network, and
road network and land use pattern. The trigging factors are rainfall and anthropogenic
interference like civil construction and deforestation. The input thematic maps on all the
identified factors were collected from various sources and were integrated in
Geographical Information System framework. A landslide inventory map was developed
based on the satellite data and a field survey. All the input layers were then overlaid in
GIS environment, with all required attribute parameters from the input layers keeping
intact in the final output layer. Landslide Information Value (LSIV) for a smallest
polygon with in the study area was calculated based on the knowledge driven weights of
the parameter and the data driven information (landslide density) due to each of the
parameter variables. The value of LSIV ranged from 78 to 234 and was classified into
three ranges based on histogram distribution of values that categorized the study area into
least vulnerable, moderately vulnerable and the most vulnerable zones. On verification
with the landslide inventory map we found that 11% of the landslides had occurred in the
least vulnerable zone, 32% of the landslides had occurred in the moderately vulnerable
zone and 57% of landslides had occurred in the most vulnerable zone. Highest percentage
of landslides in the most vulnerable zone gives accuracy and conformation to our
methodology.
Introduction. Landslide is a major cause of disaster in the hilly region. In the state of Sikkim 3300 lives
are recorded to have been lost causing a widespread state of terror in the mindset of the
people when a prolonged monsoon triggered landslides in October 1968. Since then
sporadic landslides in all parts of the state have disturbed and damaged lives and
properties heavily. Mud slides and debris flows are usually the two types of landslides
that have occurred due to heavy and prolonged downpour during the monsoon season.
When ever such landslides have occurred, the manmade structures and natural resources
stand no where against the fragile condition of the Himalayan ecosystem, ubiquity of
weak geology and slope instability with average monsoon rainfall of 350mm per day
risen up to 500 mm during cloud burst. There has been little effort put till date within and
around the study area to scientifically assess the vulnerability with reference to the
existing geo-technical information to predict the occurrence of such hazard that could
help and support the disaster management authority to work towards disaster reduction
strategies like early warning system, vacating of most vulnerable areas, stoppage of civil
construction in the vulnerable areas, retrofitting of the structures lying in such areas and
so on, and at the same time identifying safe zones for continuation of various sustainable
development processes like industrialization and further urbanization. This Geographical
Information System based study to delineate the study area into different categories with
respect to its vulnerability and susceptibility to landslides is an attempt towards this goal.
GIS based landslide vulnerability study have been attempted by many researchers and
scientist in the past all across the globe (Jibson et al, 2000; Luzi et al,2000; Zhou et al
2002; Carro et al 2003, Lee 2007, Burrough and McDonnel, 1998, Miles et al. 1999,
Siddle et al 1991, Lee et al 1991, Hutchinson and Chandler 1991, Hutchinson et al 1991,
Morgan et al 1992, Carrara et al 1991. Logistic Regression Model was used for landslide
mapping by Atkinson and Massari, 1998, S. Lee 2004, Ghosh et all 2006 along with
Frequency Ratio Method (Lee et all 2006) and Information Value method (Ghosh et. all
2006). Fuzzy Gama method or Fuzzy Alzebric Function was used for landslide
susceptibility modeling by Majid H. Tagestani (2007), Saro Lee (2003 & 2006),
Ercanoglu and Gokceoglu (2002), Pistocchi et all (2002). Artificial Neural Network was
used for landslide susceptibility study and modeling by Lee et all (2003, 2006), Gomez
and Kauzoglu (2004) and Melchioree et all (2006). Bayesian Network was used for
landslide probability study by Lau et all (2007) and Demoulin and Chung (2007). This
study attempts to combine the experts’ opinion or knowledge driven weights and the data
driven evidence based information as landslide density to calculate the landslide
information value on various parts of the study area.
Study Area
The study area for this investigation i.e. Sang Revenue Circle in East District of Sikkim,
India, comprises 15 (Fifteen) revenue villages namely Dung-Dung, Bhudang Thangshing,
Khamdung, Byang Khamdong, Beng Sang, Namgaythang, Sirwani, Sakyong, Chisopani,
Rabdang, Tshalumthang, Phegyong, Tirkutam, Nazitam, Martam lying from east
longitude 88o 26’ 40.17” to 88o 33’ 42.35” and North Latitude of 27o 13’48.85” to
27o17’22.24” covering an area of around 36 square kilometers. Since 1968 there is a
prominent landslide at Sirwani Revenue Village that blocks the road between Singtam and
Sirwani every year during the monsoon season. The slide has spoiled around four acre of
rich and fertile cultivable private land converting it to a muddy slide.
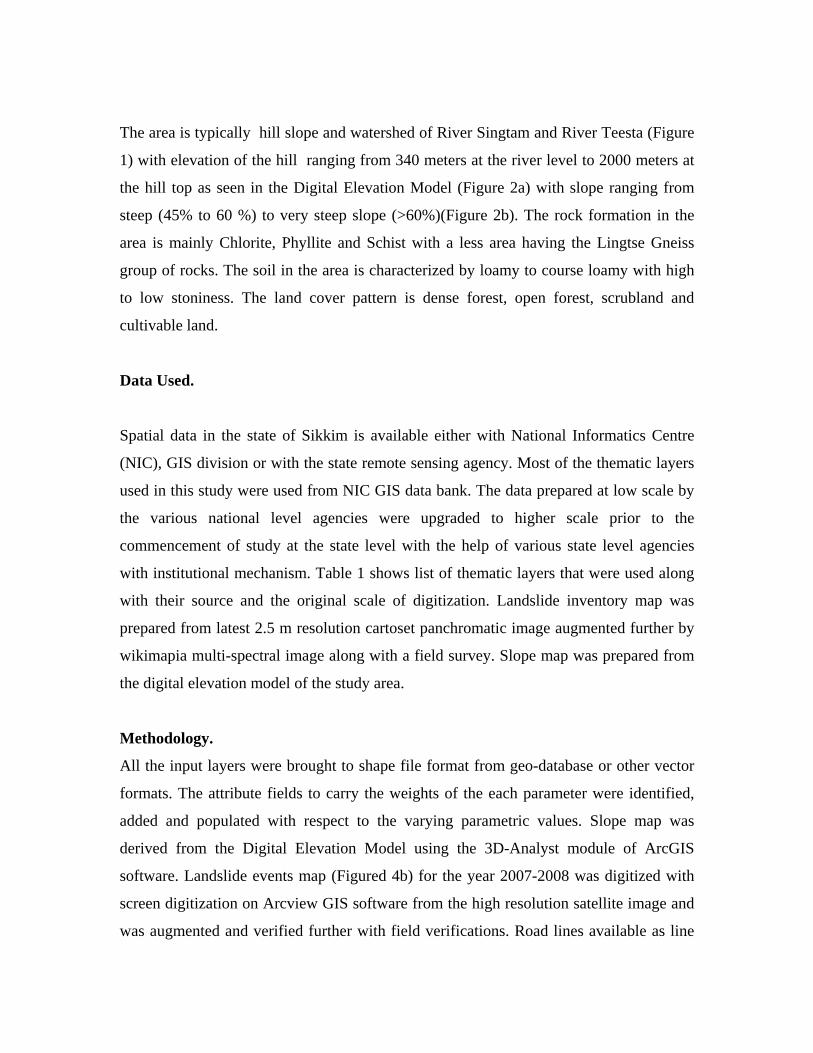
The area is typically hill slope and watershed of River Singtam and River Teesta (Figure
1) with elevation of the hill ranging from 340 meters at the river level to 2000 meters at
the hill top as seen in the Digital Elevation Model (Figure 2a) with slope ranging from
steep (45% to 60 %) to very steep slope (>60%)(Figure 2b). The rock formation in the
area is mainly Chlorite, Phyllite and Schist with a less area having the Lingtse Gneiss
group of rocks. The soil in the area is characterized by loamy to course loamy with high
to low stoniness. The land cover pattern is dense forest, open forest, scrubland and
cultivable land.
Data Used.
Spatial data in the state of Sikkim is available either with National Informatics Centre
(NIC), GIS division or with the state remote sensing agency. Most of the thematic layers
used in this study were used from NIC GIS data bank. The data prepared at low scale by
the various national level agencies were upgraded to higher scale prior to the
commencement of study at the state level with the help of various state level agencies
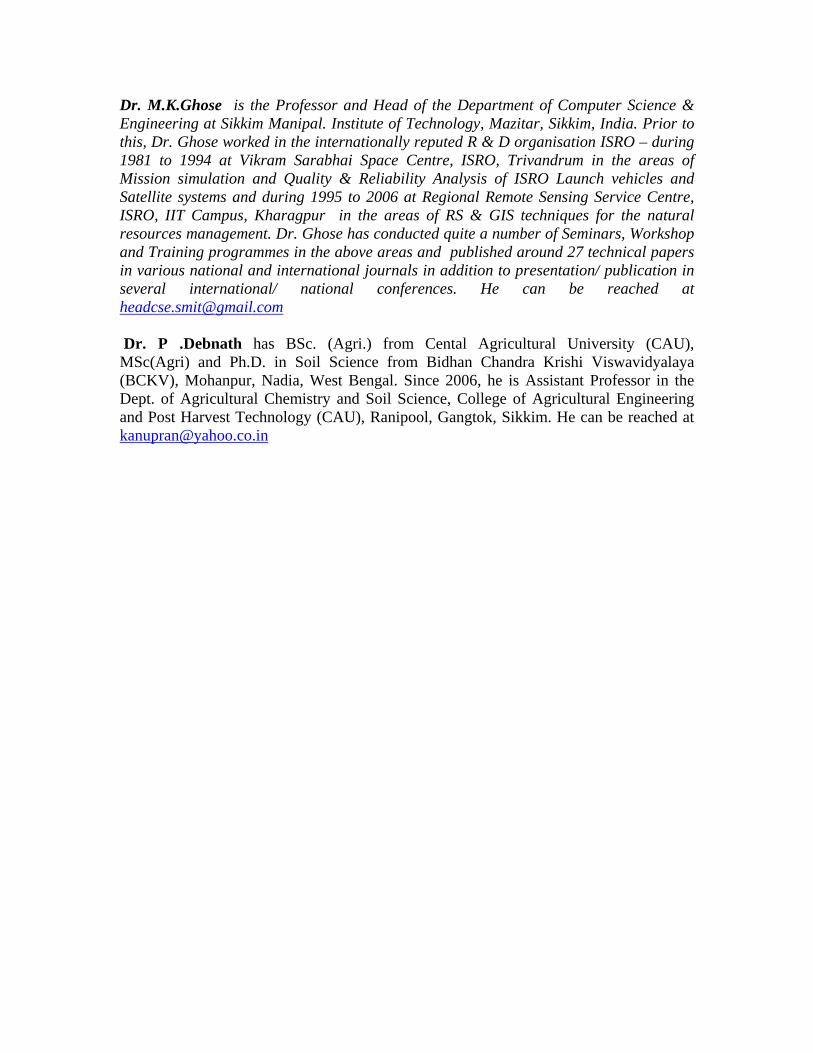
with institutional mechanism. Table 1 shows list of thematic layers that were used along
with their source and the original scale of digitization. Landslide inventory map was
prepared from latest 2.5 m resolution cartoset panchromatic image augmented further by
wikimapia multi-spectral image along with a field survey. Slope map was prepared from
the digital elevation model of the study area.
Methodology.
All the input layers were brought to shape file format from geo-database or other vector
formats. The attribute fields to carry the weights of the each parameter were identified,
added and populated with respect to the varying parametric values. Slope map was
derived from the Digital Elevation Model using the 3D-Analyst module of ArcGIS
software. Landslide events map (Figured 4b) for the year 2007-2008 was digitized with
screen digitization on Arcview GIS software from the high resolution satellite image and
was augmented and verified further with field verifications. Road lines available as line
layers were buffered at 40 meters on both sides and the drainage lines were buffered at 30
meters on both sides and converted to polygons for assessing their impacts on landslide
susceptibility. All the input thematic layers were then brought to the single spatial
reference and projection system (Figure 3). Errors that appeared due to change in
projection system of some of the layers were cleaned and rectified to ensure that all the
layers had end to end registration with the base map of the study area. The layers were
then overlaid in Geomatica 10 overlay analysis software to get a single layered output.
The output layer contained 9760 polygons with each polygon containing the weight of
the all the parameters considered. At this stage 34 numbers of other variables were
introduced and these fields named as x1 to x34 were added in the attribute table with the
ArcCatalog module of the ArcGIS. These variables were basically to indicate the
presence or absence of any particular parametric variable hence their value will be either
0 or 1. For example value of x1 will be one if deep soil is present in the polygon else its
value will be zero. Similarly value of x34 will be one if land cover type is cultivable
within in the polygon else its value will be zero. These values were then populated
accordingly in group editing mode using selection queries and the editor module of the
ArcGIS software. Landslide density was then calculated for each of these thirty four
variables as ration of number of landslides to the total area in square kilometers where
these variables prevail within the study area .Finally the Landslide Information Value
(LSIV) is calculated for each polygon as sum of product of experts’ based weights,
landslide density and the Xn value of all the causative factors. It is obvious to deduce that
higher the value of LSIV, higher the degree of landslide vulnerability. Hence based on
the value of LSIV the geographical area is classified into Least Vulnerable, Moderately
Vulnerable and Most Vulnerable Zones.
Calculation and Results.
The formula for calculation of Landslide Information Value (LSIV) for each of the
polygons was deduced by us with the following analogy and presumption:
Suppose there are N numbers of potential factors with their expert based weights
assigned as W1, W2,……to WN affecting the slope instability considered with each of
these potential factors having p numbers of variables values denoted as P(W1) to P(Wn).
Xi(w1) to Xi(Wn) with their values being either 0 or 1 denote the presence or absence of
p(W1) to p(Wn) variable value in each of the polygon. During the overlay analysis,
suppose the total geographical area is divided into M number of polygons. Each of the
polygon j (j=1,2,……..m) can be declared as stable or unstable based on their Landslide
Information Value (LSIV): higher the value of LSIV more unstable the polygon j.
The Landslide Information Value for the jth polygon was calculated as:
LSIVj= W1j ∑=
)1(
1)1()1()1(
wp
wiwLDijwXij +W2j ∑
=
)2(
1)2()1()1(
Wp
WiwLDijwXij
+…………….WNm )()()(
1)(WnLDimWnXim
Wnp
Wni∑
=
Where W1, W2,…….Wn are the expert based weights of the Nth identified parameters
Xij(Wn) is the variable value of Ith variable of the Wn parameter for Jth polygon.
LDij(Wn) is the Landslide Density due to Ith variable of Wn Parameter for the Jth
polygon
The Landslide Information Value for each of the polygons calculated with the above
formula ranged from 78 to 328. A histogram distribution diagram was then used to
classify LSIV values of polygons into three different ranges that categorized and
delineated the study area into three different zones viz. least vulnerable zone, moderately
vulnerable zone and the most vulnerable zone. The Least Vulnerable Zone with LSIV
varying from 78 to 110 contained 1309 (13%) polygons with an area of 10.91(30%) sq
km. The Moderately Vulnerable Zone with LSIV varying from 111 to 144 had
3800(39%) numbers of polygons with an area of 14.7(41%) sq km. The Most Vulnerable
Zone had a total number of 4651(48%) polygons with an area of 10.66(29%) sq km
(Table 1). A zonation map for the study area is produced on the basis of above
classification that manifests these zones in three different colors (Figure 4a). We
compared this result with the landslide event directory of the study are and found
reasonable match between the prognostic models and the real events. The Least
Vulnerable Zone witnessed a record of only 3 landslides in the last three years. The
Moderately Vulnerable Zone had a record of 9 (32%) landslides as per the landslide
inventory developed by us. The Most Vulnerable Zone recorded 16(57%) numbers of
landslide events that brings a close proximity to real events versus the prediction.
Discussion & Conclusion
We calculated the Landslide Information Value (LSIV) for each of the polygon as a sum
of the product of weight assigned for each of the causative factors, presence or absence of
the variable of that factor and the landslide density calculated from the entire area where
the said variable factor prevailed. The weights of the parameters were assigned in such a
way that the higher value of the weight denoted greater instability. Hence it was obvious
to understand that higher value of LSIV denoted a higher instability and landslide
vulnerability. Looking at the statistics in the Most Vulnerable Zone, though the zone
contained the highest numbers of polygons(4651) but the area under it is only 10.66 sq
km and it contains the highest number of landslides which verifies and authenticates the
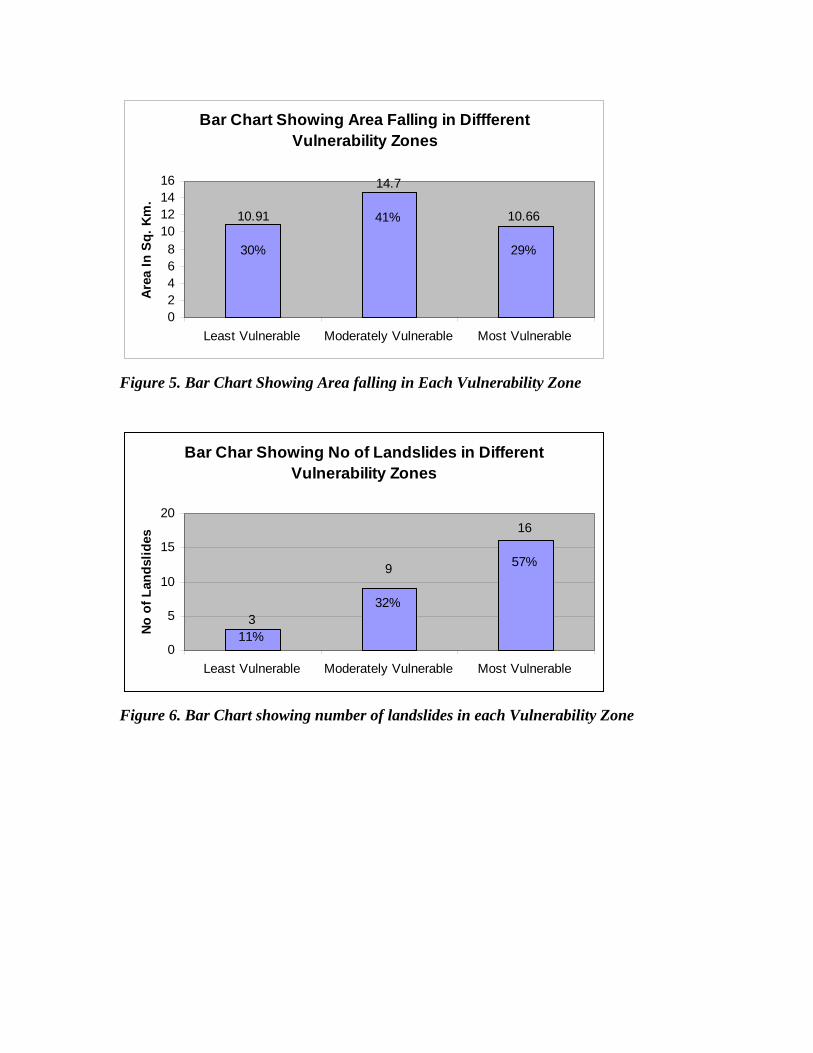
methodology adopted in the study. Bar chart showing distribution of area in different
vulnerable zones (Figure 5) depicts an almost equal distribution of area in all the zones
with only the Moderately Vulnerable Zone having little larger (41%) geographical area.
However the bar chart depicting number of landslides in each of the vulnerability zone
demonstrated a constant increase in number of landslides and consequently the landslide
density from Least Vulnerable Zone to the Most Vulnerable Zone (Figure 6). The most
vulnerable zone with only 29% of the geographical area contained 57% of landslides
giving very high accuracy to our zonation method. We found this method to be simple
and highly accurate compared to any other method for landslide hazard zonation.
We were able to complete the Geographical Information System based landslide
vulnerability study of around 37 sq. km. in hill area based on the spatial data with
minimum field visit. The study was able to delineate and verify around 10 sq km of the
study area as the most vulnerable where focused landslide reduction strategies need to be
implemented. Such GIS based initiative in delineating the vulnerable areas will go a long
way in helping the decision makers and land planners for site selection for
developmental activities and for alerting and avoiding loss of lives and properties during
landslide hazards through detailed response and mitigation plan both at pre and post
disaster scenario.
References
• Bianca CV, Nelson FF (2004) Landslide in Rio de Ianeiro: The role played by
variations in soil Hydraulic Conductivity. Hydrological Process 18(4):791-805
• Brady, N.C. and Weil, R.R. (2007) The Nature and Properties of soils. Pearson
Education, Inc. New Delhi, pp 756-761.
• Carro M, Amicis MD, Luzi L, Marzorati S (2003) The application of predictive
modeling techniques to landslides induced by earthquakes: the case study of the
26 September 1997 Umbria–Marche earthquake (Italy). Engineering Geology,
69(1-2):139-159.
• Das DK, Agarwal RP (2002) Physical Properties of Soil. Fundamental of Soil
Science, Indian Society of Soil Science, IARI, New Delhi, India, pp 75-77.
• Das DK (2007) Introductory Soil Science. Kalyani Publishers, New Delhi, India,
pp 475-483.
• Dhakal AS, Sidle RC (2002) Physically Based Landslide Hazard Model ‘U’
Method and Issues. EGS XXVII General Assembly, Nice, pp 21-26
• George YL, Long, SC, David WW (2007) Vulnerability assessment of rainfall-
induced debris flows in Department of Earth Systems and GeoInformation
Sciences, College of Science, George Mason University, Fairfax, VA 22030,
ETATS-UNIS. http://www.springerlink.com/content/uj26871v2831nx44
• Lee S (2007) Application and Verification of Fuzzy Algebraic Operators to
landslide susceptibility mapping. Environmental Geology 52:615-623.
• Michael AM, Ojha TP (1999) Principles of Agricultural Engineering. Ms Jain
Brothers, New Delhi, India, 2, pp 586-590
• Patanakanog B (2001) Landslide Hazard Potential Area in 3 Dimension by
Remote Sensing and GIS Technique. Land Development Department, Thailand.
(www.ecy.wa.gov/programs/sea/landslides/help/drainage.html)
• Pachauri AK, Pant M (1992) Landslide hazard mapping based on geological
attributes. Engineering Geology 32: 81-100
• Pachauri AK, Gupta PV, Chander R (1998) Landslide zoning in a part of the
Garhwal Himalayas. Environmental Geology 36(3-4): 325-334
• Reddy TY, Reddi HS (1999) Principles of Agronomy. Kalyani Publishers, New
Delhi, India, pp 338.
• Roth RA (1983) Factors affecting landslide susceptibility in San Mateo County,
California. Bull Assoc Eng Geol 20(4):353-372.
• Sakellariou MG, Ferentinou MD (2001) GIS-based estimation of slope stability.
Natural Hazards Review 2(1): 12-21
• Samra JS, Sharma UC (2002) Soil Erosion and Conservation. Fundamental of
Soil Science, Indian Society of Soil Science, IARI, New Delhi, India, pp 162.
• Sivakumar GL, Mukesh MD (2002) Landslide analysis in Geographic
Information Systems. Department of Civil Engineering, Indian Institute of science,
Bangalore. India.
www.gisdevelopment.net/application/natural_hazards/landslides/nhls0011pf.htm
• Uromeihy A, Mahdavifar MR (2000) Landslide hazard zonation of Khorshrostam
area, Iran. Bull Eng Geol Environ. 58:207-213.
• Van Westen CJ, Rengers N, Terlien MTJ, Soeters R (1997) Prediction of the
occurrence of slope instability phenomena through GIS-based hazard zonation.
Geol Rundsch 86: 404-414
• Varnes, DJ (1984) Landslide hazard zonation: a review of principles and practice.
UNESCO, Paris, pp 1-55.
• Wadge G (1988) The potential of GIS modeling of gravity flows and slope
instabilities. International Journal of Geographical Information Systems 2: 143-
152
• Wang Shu-Quiang , Unwin DJ (1992) Modeling landslide distribution on loess
soils in China: an investigation. International Journal of Geographical Information
Systems 6 (5): 391-405
• Wischmeier WH, Smith DD (1978) Predicting rainfall-erosion losses-A guide to
conservation planning, Agricultural Handbook No-537, US Department of
Agriculture, USA.
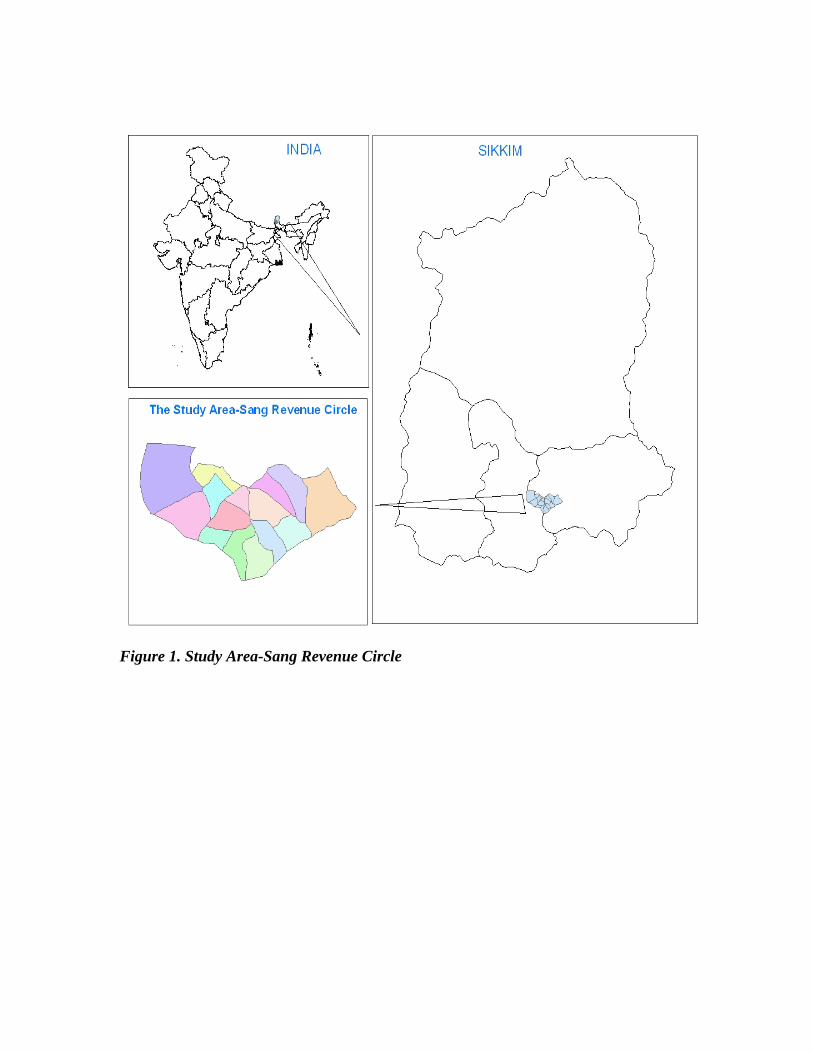
Figure 1. Study Area-Sang Revenue Circle

Figure 2. (a) Digital Elevation Model of Study Area (b) Slope Map
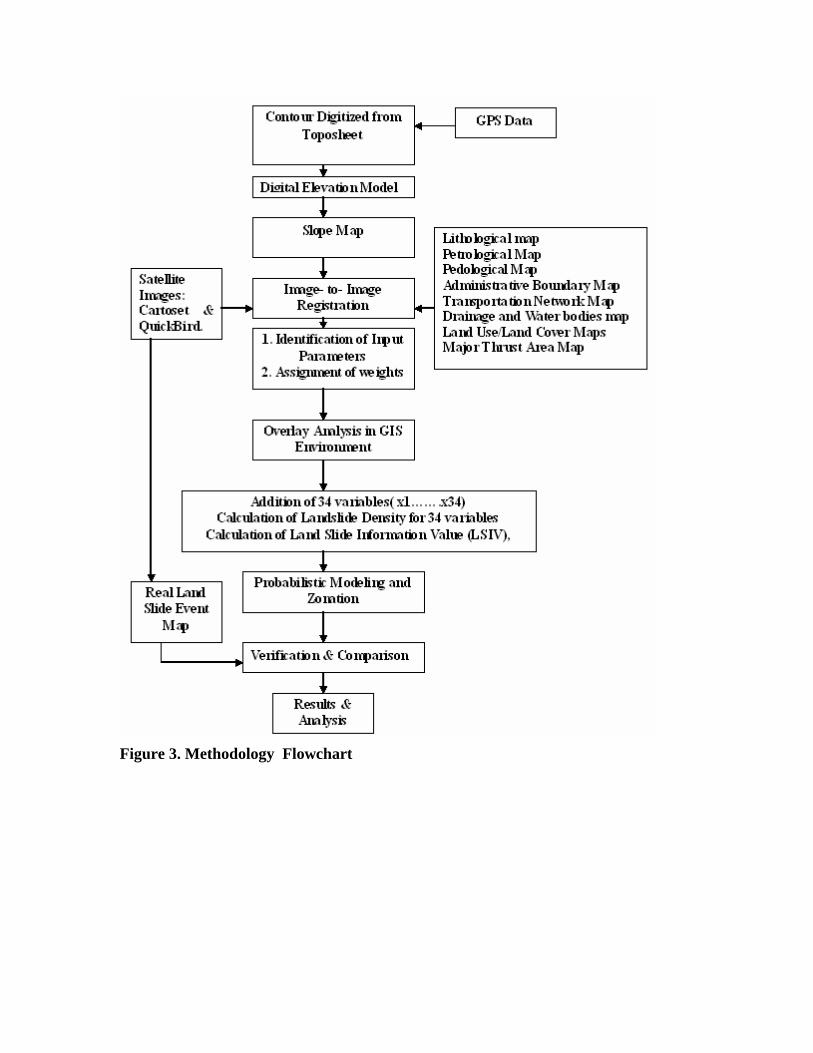
Figure 3. Methodology Flowchart
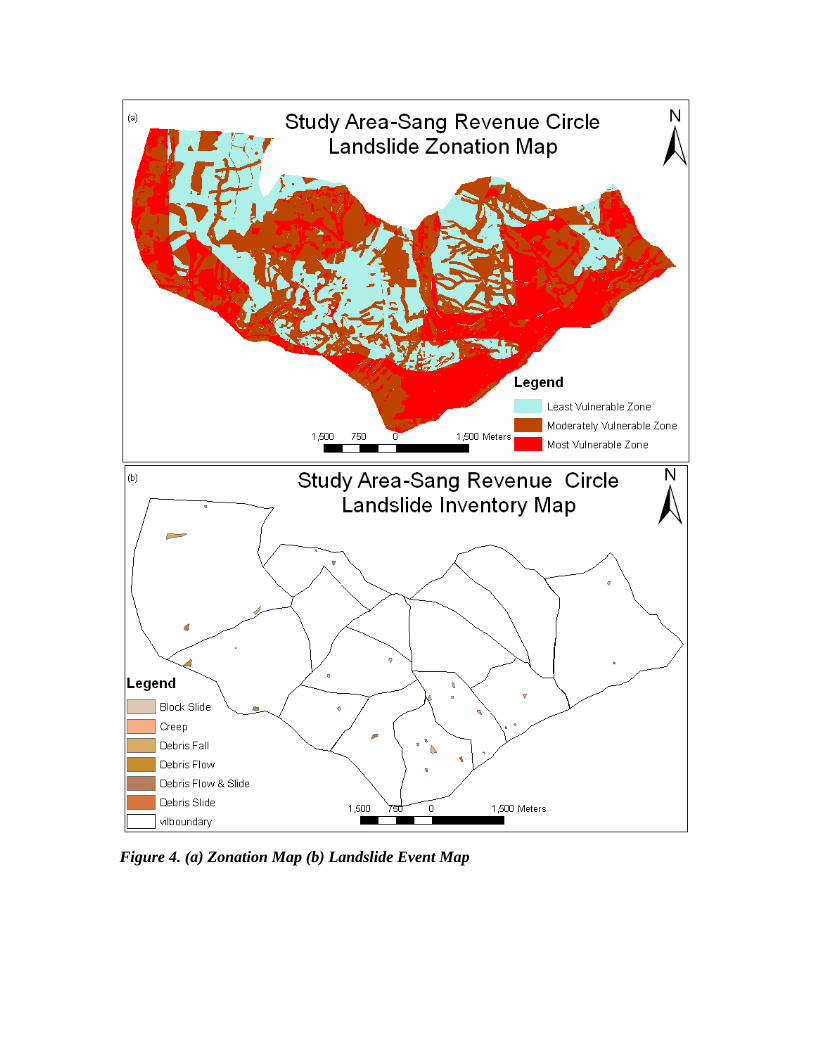
Figure 4. (a) Zonation Map (b) Landslide Event Map
Bar Chart Showing Area Falling in Diffferent Vulnerability Zones
10.66
29%
14.7
41%10.91
30%
02468
10121416
Least Vulnerable Moderately Vulnerable Most Vulnerable
Area
In S
q. K
m.
Figure 5. Bar Chart Showing Area falling in Each Vulnerability Zone
Bar Char Showing No of Landslides in Different Vulnerability Zones
16
57%9
32%3
11%0
5
10
15
20
Least Vulnerable Moderately Vulnerable Most Vulnerable
No o
f Lan
dslid
es
Figure 6. Bar Chart showing number of landslides in each Vulnerability Zone
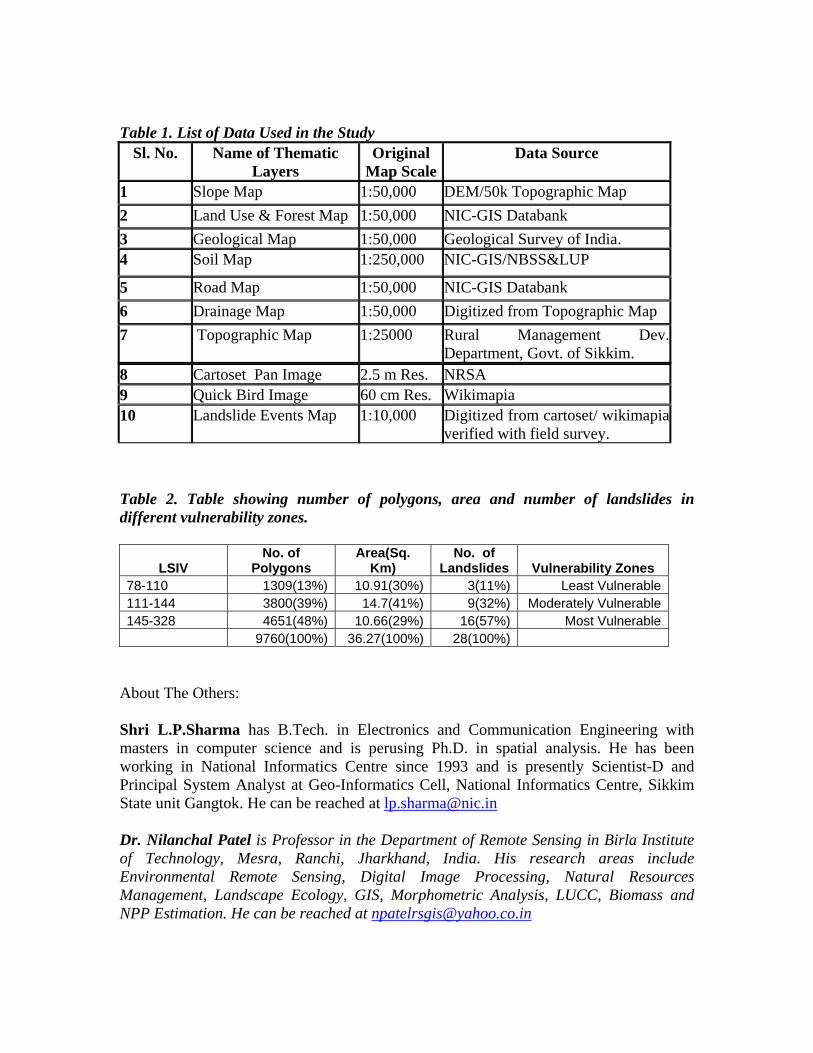
Table 1. List of Data Used in the Study Sl. No. Name of Thematic
Layers Original
Map ScaleData Source
1 Slope Map 1:50,000 DEM/50k Topographic Map 2 Land Use & Forest Map 1:50,000 NIC-GIS Databank 3 Geological Map 1:50,000 Geological Survey of India. 4 Soil Map 1:250,000 NIC-GIS/NBSS&LUP
5 Road Map 1:50,000 NIC-GIS Databank 6 Drainage Map 1:50,000 Digitized from Topographic Map 7 Topographic Map 1:25000 Rural Management Dev.
Department, Govt. of Sikkim. 8 Cartoset Pan Image 2.5 m Res. NRSA 9 Quick Bird Image 60 cm Res. Wikimapia 10 Landslide Events Map 1:10,000 Digitized from cartoset/ wikimapia
verified with field survey.
Table 2. Table showing number of polygons, area and number of landslides in different vulnerability zones.
LSIV No. of
Polygons Area(Sq.
Km) No. of
Landslides Vulnerability Zones 78-110 1309(13%) 10.91(30%) 3(11%) Least Vulnerable111-144 3800(39%) 14.7(41%) 9(32%) Moderately Vulnerable145-328 4651(48%) 10.66(29%) 16(57%) Most Vulnerable 9760(100%) 36.27(100%) 28(100%)
About The Others: Shri L.P.Sharma has B.Tech. in Electronics and Communication Engineering with masters in computer science and is perusing Ph.D. in spatial analysis. He has been working in National Informatics Centre since 1993 and is presently Scientist-D and Principal System Analyst at Geo-Informatics Cell, National Informatics Centre, Sikkim State unit Gangtok. He can be reached at [email protected] Dr. Nilanchal Patel is Professor in the Department of Remote Sensing in Birla Institute of Technology, Mesra, Ranchi, Jharkhand, India. His research areas include Environmental Remote Sensing, Digital Image Processing, Natural Resources Management, Landscape Ecology, GIS, Morphometric Analysis, LUCC, Biomass and NPP Estimation. He can be reached at [email protected]
Dr. M.K.Ghose is the Professor and Head of the Department of Computer Science & Engineering at Sikkim Manipal. Institute of Technology, Mazitar, Sikkim, India. Prior to this, Dr. Ghose worked in the internationally reputed R & D organisation ISRO – during 1981 to 1994 at Vikram Sarabhai Space Centre, ISRO, Trivandrum in the areas of Mission simulation and Quality & Reliability Analysis of ISRO Launch vehicles and Satellite systems and during 1995 to 2006 at Regional Remote Sensing Service Centre, ISRO, IIT Campus, Kharagpur in the areas of RS & GIS techniques for the natural resources management. Dr. Ghose has conducted quite a number of Seminars, Workshop and Training programmes in the above areas and published around 27 technical papers in various national and international journals in addition to presentation/ publication in several international/ national conferences. He can be reached at [email protected] Dr. P .Debnath has BSc. (Agri.) from Cental Agricultural University (CAU), MSc(Agri) and Ph.D. in Soil Science from Bidhan Chandra Krishi Viswavidyalaya (BCKV), Mohanpur, Nadia, West Bengal. Since 2006, he is Assistant Professor in the Dept. of Agricultural Chemistry and Soil Science, College of Agricultural Engineering and Post Harvest Technology (CAU), Ranipool, Gangtok, Sikkim. He can be reached at [email protected]