genomic risk prediction of coronary artery disease in ... · cad risk factors, such as lipids,...
TRANSCRIPT
1
Genomic risk prediction of coronary artery disease in nearly 500,000 adults: implications for early screening and primary prevention Michael Inouye1,2,3,#,*, Gad Abraham1,2,3,#,*, Christopher P. Nelson4, Angela M. Wood2, Michael J. Sweeting2, Frank Dudbridge2,5, Florence Y. Lai4, Stephen Kaptoge2,6, Marta Brozynska1,2,3, Tingting Wang1, Shu Ye4, Thomas R Webb4, Martin K. Rutter7,8, Ioanna Tzoulaki9,10, Riyaz S. Patel11,12, Ruth J.F. Loos13, Bernard Keavney14,15, Harry Hemingway16, John Thompson5, Hugh Watkins17,18, Panos Deloukas19, Emanuele Di Angelantonio2,6, Adam S. Butterworth2,6, John Danesh2,6,20, Nilesh J. Samani4,#,* for The UK Biobank CardioMetabolic Consortium CHD Working Group 1 Systems Genomics Lab, Baker Heart and Diabetes Institute, 75 Commercial Rd, Melbourne 3004, Victoria, Australia 2 MRC/BHF Cardiovascular Epidemiology Unit, Department of Public Health and Primary Care, University of Cambridge, Cambridge CB1 8RN, United Kingdom 3 Department of Clinical Pathology and School of BioSciences, University of Melbourne, Parkville 3010, Victoria, Australia 4 Department of Cardiovascular Sciences and NIHR Leicester Biomedical Centre, University of Leicester, United Kingdom 5 Department of Health Sciences, University of Leicester, Leicester, United Kingdom 6 National Institute for Health Research Blood and Transplant Research Unit (NIHR BTRU) in Donor Health and Genomics at the University of Cambridge, Cambridge, United Kingdom 7 Division of Diabetes, Endocrinology and Gastroenterology, School of Medical Sciences, Faculty of Biology, Medicine and Health, University of Manchester, Manchester Academic Health Science Centre, Manchester, United Kingdom 8 Manchester Diabetes Centre, Manchester University NHS Foundation Trust, Manchester Academic Health Science Centre, Manchester, United Kingdom 9 Department of Epidemiology and Biostatistics, Imperial College London, London W2 1PG, United Kingdom 10 Department of Hygiene and Epidemiology, University of Ioannina, 45110, Ioannina, Greece 11 Institute of Cardiovascular Sciences, University College London, London, United Kingdom 12 Barts Heart Centre, St Bartholomew's Hospital, London, United Kingdom 13 Charles Bronfman Institute for Personalized Medicine, Mindich Child Health and Development Institute, Icahn School of Medicine at Mount Sinai, New York, New York, USA 14 Division of Cardiovascular Sciences, School of Medical Sciences, Faculty of Biology, Medicine and Health, University of Manchester, Manchester, United Kingdom 15 Manchester University NHS Foundation Trust, Manchester Academic Health Science Centre, Manchester, United Kingdom 16 The Farr Institute of Health Informatics Research and the National Institute for Health Research, Biomedical Research Centre, University College London, London, United Kingdom 17 Division of Cardiovascular Medicine, Radcliffe Department of Medicine, University of Oxford, Oxford, OX3 9DU, United Kingdom 18 The Wellcome Trust Centre for Human Genetics, University of Oxford, Oxford, OX3 7BN, United Kingdom 19 William Harvey Research Institute, Barts and the London School of Medicine and Dentistry, Queen Mary University of London, London, EC1M 6BQ, United Kingdom 20 Wellcome Trust Sanger Institute, Wellcome Genome Campus, Hinxton, Cambridgeshire CB10 1SA, United Kingdom * These authors contributed equally # Correspondence addressed to: MI ([email protected]), GA ([email protected]) or NJS ([email protected])
.CC-BY 4.0 International licensenot peer-reviewed) is the author/funder. It is made available under aThe copyright holder for this preprint (which was. http://dx.doi.org/10.1101/250712doi: bioRxiv preprint first posted online Jan. 19, 2018;
2
Abstract Background Coronary artery disease (CAD) has substantial heritability and a polygenic
architecture; however, genomic risk scores have not yet leveraged the totality of genetic information
available nor been externally tested at population-scale to show potential utility in primary prevention.
Methods Using a meta-analytic approach to combine large-scale genome-wide and targeted genetic
association data, we developed a new genomic risk score for CAD (metaGRS), consisting of 1.7
million genetic variants. We externally tested metaGRS, individually and in combination with
available conventional risk factors, in 22,242 CAD cases and 460,387 non-cases from UK Biobank.
Findings In UK Biobank, a standard deviation increase in metaGRS had a hazard ratio (HR) of 1.71
(95% CI 1.68–1.73) for CAD, greater than any other externally tested genetic risk score. Individuals
in the top 20% of the metaGRS distribution had a HR of 4.17 (95% CI 3.97–4.38) compared with
those in the bottom 20%. The metaGRS had higher C-index (C=0.623, 95% CI 0.615–0.631) for
incident CAD than any of four conventional factors (smoking, diabetes, hypertension, and body mass
index), and addition of the metaGRS to a model of conventional risk factors increased C-index by
3.7%. In individuals on lipid-lowering or anti-hypertensive medications at recruitment, metaGRS
hazard for incident CAD was significantly but only partially attenuated with HR of 2.83 (95% CI 2.61–
3.07) between the top and bottom 20% of the metaGRS distribution.
Interpretation Recent genetic association studies have yielded enough information to meaningfully
stratify individuals using the metaGRS for CAD risk in both early and later life, thus enabling targeted
primary intervention in combination with conventional risk factors. The metaGRS effect was partially
attenuated by lipid and blood pressure-lowering medication, however other prevention strategies will
be required to fully benefit from earlier genomic risk stratification.
Funding National Health and Medical Research Council of Australia, British Heart Foundation,
Australian Heart Foundation.
.CC-BY 4.0 International licensenot peer-reviewed) is the author/funder. It is made available under aThe copyright holder for this preprint (which was. http://dx.doi.org/10.1101/250712doi: bioRxiv preprint first posted online Jan. 19, 2018;

3
Introduction Coronary artery disease (CAD) is the leading cause of morbidity and mortality worldwide, and early
identification of individuals at high risk of CAD is essential for primary prevention. While conventional
CAD risk factors, such as lipids, blood pressure, and smoking, become predictive in middle life, their
predictive ability is weaker at a younger age. The heritability of CAD has been estimated to be 40–
60% and thus genetic predisposition is a risk factor of significant potential for earlier risk prediction 1,2. Over the last 10 years, genome-wide association studies have begun elucidating the genetic
architecture of CAD and laid the foundation for developing genomic risk scores (GRSs) for estimating
an individual's underlying genomic risk3-9. However, previous GRSs for CAD have not facilitated
fundamental change in early CAD risk screening strategies as they have not reached a sufficient
level of predictive power, e.g. by outperforming conventional cardiovascular risk factors, nor have
they established general applicability via large-scale external testing in representative population-
based samples. A likely reason is that the polygenicity of CAD has not been sufficiently reflected in
the predictive genetic models, together with imprecision in the effect size estimates driven by limited
sample sizes 10-12. Previously published GRSs have utilised only genetic variants of genome-wide
significance 4,5,8 or were based on arrays that focus on pre-selected loci 3; thus, they have not fully
utilised genome-wide variation, and have not been able to accurately estimate the relative
contribution of each genetic variant to CAD risk. Furthermore, the generalisability of previous GRSs
has been limited by lack of external testing in truly large-scale cohorts that represent a diversity of
ancestries3,13, and a wide spectrum of the CAD burden, e.g. not only myocardial infarction14,15. A
more powerful and generalisable genome-wide GRS for CAD would likely have far reaching
implications for early screening at a population level, prioritisation for lifestyle and therapeutic
intervention, and targeted clinical trials.
Here, we utilise a meta-analytic strategy to construct a GRS for CAD (metaGRS) that captures the
totality of information from the largest previous genome-wide association studies, and then
investigate the external performance of this metaGRS in stratifying CAD risk in >480,000 individuals
from the UK Biobank (UKB) 16. Furthermore, we assess the effects of several conventional risk
factors (smoking, blood pressure, BMI, diabetes) on different genomic risk backgrounds, with the
aim of identifying subsets of individuals who are likely to benefit from earlier and more intensive
screening, or who may not benefit from screening until later life. Finally, to assess the potential
therapeutic implications of genomic risk scores, we test the impact of blood pressure and lipid
lowering medication on the performance of metaGRS.
.CC-BY 4.0 International licensenot peer-reviewed) is the author/funder. It is made available under aThe copyright holder for this preprint (which was. http://dx.doi.org/10.1101/250712doi: bioRxiv preprint first posted online Jan. 19, 2018;
4
Methods Study design and participants Details of the design of the UKB have been reported previously 12. Participants were members of the
UK general population aged between 40–69 years at recruitment, identified through primary care
lists, who accepted an invitation to attend one of the 22 assessment centers that were serially
established across the UK between 2006 and 2010. At recruitment, detailed information was
collected via a standardised questionnaire on socio-demographic characteristics, health status and
physician-diagnosed medical conditions, family history and lifestyle factors. Selected physical and
functional measurements were obtained including height, weight, waist-hip ratio, and systolic and
diastolic blood pressures. The UKB data were subsequently linked to Hospital Episode Statistics
(HES) data, as well as national death and cancer registries. The HES data available for the current
analysis covers all hospital admissions to NHS hospitals in England and Scotland from April 1997 to
March 2015, with the Scottish data dating back as early as 1981. HES uses International
Classification of Diseases ICD 9 and 10 to record diagnosis information, and OPCS-4 (Office of
Population, Censuses and Surveys: Classification of Interventions and Procedures, version 4) to
code operative procedures. Death registries include all deaths in the UK up to January 2016, with
both primary and contributory causes of death coded in ICD-10.
CAD was defined as fatal or non-fatal myocardial infarction (MI) cases, percutaneous transluminal
coronary angioplasty (PTCA), or coronary artery bypass graft (CABG). The age of event in prevalent
cases was determined by self-reported age and calculated age based on the earliest hospital record
for the event; if both self-reported age and calculated age were available, the smaller value was
used. For incident cases, hospital and/or death records were used to determined age of event.
Prevalent vs incident status was relative to the first UKB assessment. In UKB self-reported data,
cases were defined as having heart attack diagnosed by doctor (data field #6150) or 'non-cancer
illnesses that self-reported as heart attack' (data field #20002) or self-reported operation including
PTCA, CABG, or triple heart bypass (data field #20004). In HES hospital episodes data and death
registry data, MI was defined as hospital admission or cause of death due to ICD9 410–412, ICD10
I21–I24, or I25.2; CABG, PTCA were defined as hospital admission OPCS-4 K40–K46, K49, K50.1,
or K75.
We defined risk factors at the first assessment as follows: diabetes diagnosed by doctor (field
#2443), body mass index (BMI; field #21001), current smoking (field #20116), and hypertension. For
.CC-BY 4.0 International licensenot peer-reviewed) is the author/funder. It is made available under aThe copyright holder for this preprint (which was. http://dx.doi.org/10.1101/250712doi: bioRxiv preprint first posted online Jan. 19, 2018;
5
hypertension we used an expanded definition including self-reported high blood pressure (either on
blood pressure medication, data fields #6177, #6153; or systolic blood pressure >140 mmHg, fields
#4080, #93; or diastolic blood pressure >90 mmHg, data fields #4079, #94). For the analyses of the
number of elevated risk factors, we considered diagnosed diabetes (Y/N), hypertension at
assessment (Y/N), BMI >30 kg/m2, and smoking at assessment (Y/N).
Genotyping of UK Biobank participants was undertaken using a custom-built genome-wide array
(the UK Biobank Axiom array: http://www.ukbiobank.ac.uk/wp-content/uploads/2014/04/UK-
Biobank-Axiom-Array-Datasheet-2014.pdf) of ~826,000 markers. Genotyping was done in two
phases. 50,000 subjects were initially typed as part of the UK BiLEVE project 13. The rest of the
participants were genotyped using a slightly modified array. Imputation to ~92 million markers was
subsequently carried out using the Haplotype Reference Consortium (HRC) 17 and
UK10K/1000Genomes haplotype resource panels, however at the time of analysis, known issues
existed with the imputation using the latter panel.
Data processing and quality control Only autosomal genetic variants imputed using the HRC panel and which had MAF >0.1% were
included in our analyses, totalling 14.5 million variants. We converted the imputed dosages to
PLINK18 genotype calls with minimum probability 0.9 (otherwise the call was set to missing; we
removed variants with >1% missingness across individuals). To control for population structure, we
utilised the genetic principal components (PCs) as given by the UKB19.
Two QC schemes were used. For the GRS46K and FDR202 genetic risk scores (defined below), we
kept variants with MAF >0.1%, however filtering by HWE and imputation quality (INFO) was not
employed as this led to fewer variants mapping to these scores and thus reductions in predictive
power. For the 1000Genomes CAD score, we included variants with impute2 INFO >0.01 and HWE
P>10-12. A lenient HWE threshold was used because HWE was computed over all individuals without
regard to population structure, thus variants that deviation from HWE at a stringent threshold may
be needlessly excluded as they may not be indicative of genotyping error. A lenient INFO threshold
(e.g. relative to the INFO >0.4 used in Nikpay et al 20) was employed as the UKB has a relatively
large sample size, and an analysis of variants with INFO=0.001 in the UKB has equivalent statistical
power to an analysis of 0.001 x 500,000 = 500 individuals; thus genetic variants with low INFO score
can still offer improvements in predictive accuracy. Similarly, bias in odds ratios arising from
genotyping or imputation error has the effect only of reducing the predictive accuracy of a GRS, but
this reduction is less than would occur by omitting the marker entirely. After the above quality control
procedures were implemented, 14,516,436 autosomal markers were available for subsequent
analyses. For the 1000Genomes CAD score, we only used markers found in both the UKB data and
the 1000Genomes CAD summary statistics, resulting in 5,176,852 autosomal variants. In the UKB,
.CC-BY 4.0 International licensenot peer-reviewed) is the author/funder. It is made available under aThe copyright holder for this preprint (which was. http://dx.doi.org/10.1101/250712doi: bioRxiv preprint first posted online Jan. 19, 2018;

6
485,629 individuals had matching genetic data and CAD outcome data. We removed individuals with
(i) diagnoses in one of ICD9 414.1, ICD10 I25.0, I25.3, I25.4 or (ii) CAD event but no known age or
date of CAD. There was no evidence of differential missingness in genetic data between CAD and
non-CAD individuals. The final dataset consisted of n=485,629 individuals, including 22,242 CAD
events and 460,387 non-cases.
Construction of metaGRS To construct a meta genomic risk score (metaGRS) for CAD, we followed a meta-analysis strategy
using the largest CARDIoGRAMplusC4D genome-wide association analysis without UKB data 20
and the CARDIoGRAMplusC4D Metabochip analysis, which focused on variants and regions known
or thought to be associated with cardiometabolic phenotypes 21. The Metabochip-based GRS46K
(46,000 genetic variants, excluding ~3,000 A/T and C/G SNPs) was constructed previously 3, while
the FDR202 and '1000Genomes' CAD GRS derived from the CARDIoGRAMplusC4D genome-wide
association analysis, are described below. The three GRSs all provide an imperfect measure of an
individual’s genomic risk of developing CAD, due to incomplete and targeted coverage of the
genome, finite sample estimates of the marginal effect sizes for each genetic variant, and genotyping
or imputation uncertainty. Since it is well known that a risk factor measured with error can attenuate
the association between the risk factor and disease occurrence (regression dilution bias22), we
reasoned that a ‘meta score’, the weighted average of the three standardised genetic risk scores,
would provide a more precise estimate of an individual’s genomic risk of developing CAD.
To create the metaGRS, we used the meta-analysis summary statistics 20, consisting of dbSNP rsid,
risk allele, and effect size (log odds ratio). We used the existing GRS46K 3 and FDR202 20 scores.
For the GRS46K, we could map 45,810 variants (98%) in the UKB imputed dataset; for the FDR202,
198 variants or proxies thereof mapped (98%; for proxies, minimum r2 in 1000Genomes CEU+GBR
was 0.68, the median r2 was 1.0).
Each score s is the sum of the minor allele dosages of each variant multiplied by its marginal effect
size β (log odds ratio per dosage of minor allele):
𝑠" = 𝑥"%𝛽%
'
%()
where 𝑥"% ∈ 0, 1, 2 is the count of the minor allele for the jth variant in the ith individual.
To derive a new genomic risk score based on the CARDIoGRAMplusC4D 1000Genomes-imputed
GWAS summary statistics 20, we split the UKB data into a training set (n=3000) and a validation set
(n=482,629). For the training set, we randomly selected 1000 prevalent CAD cases and 2000 non-
CAD individuals. We then used PLINK random linkage disequilibrium (LD) pruning to create different
scores, based on SNP sets with varying levels of LD and corresponding CARDIoGRAMplusC4D
.CC-BY 4.0 International licensenot peer-reviewed) is the author/funder. It is made available under aThe copyright holder for this preprint (which was. http://dx.doi.org/10.1101/250712doi: bioRxiv preprint first posted online Jan. 19, 2018;
7
summary statistics, and evaluated their performance on the n=3000 training set, in terms of hazard
ratio (HR) per standard deviation (s.d.) of the score (age-as-time-scale Cox regression, stratified by
sex and adjusting for BiLEVE genotyping array and 10 genetic PCs). The score with the highest HR
corresponded to the r2 thinning threshold of 0.9 and consisted of ~1.7 million variants
(Supplementary Figure 1).
The correlation between the three GRSs was moderate (Pearson’s correlation r=0.11 for FDR202-
GRS46K, r=0.19 for FDR202-1000Genomes, r=0.27 for GRS46K-1000Genomes), indicating partial
but imperfect overlap of the genetic signals captured by each, likely due to shared genetic loci, LD,
and partial overlap of individuals in the cohorts used for deriving these summary statistics20,21. Such
correlation is accounted for in the weighting below.
We derived a meta score (‘metaGRS’), consisting of a weighted average of the standardised scores
GRS"3456 =𝛽)𝑍") + 𝛽9𝑍"9 + 𝛽:𝑍":
𝛽)9 + 𝛽99 + 𝛽:9 + 2𝛽)𝛽9𝜌),9 + 2𝛽)𝛽:𝜌),: + 2𝛽9𝛽:𝜌9,:
where 𝑍"), 𝑍"9, 𝑍":are the (zero-mean and unit-variance standardised) GRS46K, FDR202, and
1000Genomes CAD risk scores for the ith individual, respectively, 𝛽),𝛽9, 𝛽: are the univariate log
HRs for each score (estimated using Cox regression in the training set), and 𝜌",% is the Pearson
correlation between the ith and jth scores (in the training set). The univariate log HRs were 0.1278,
0.2359 and 0.2400 per 1-s.d. for the GRS46K, FDR202, and 1000Genomes CAD scores,
respectively. To convert this meta-score to a SNP-level score, we used the weighted sum over all m
=1,745,180 SNPs (the union of the SNPs in the three scores, and ignoring constant terms),
GRS"3456 ∝ 𝑥"%𝛽)𝜎)𝛼%) +
𝛽9𝜎9𝛼%9 +
𝛽:𝜎:𝛼%: ,
'
%()
where 𝜎), 𝜎9, 𝜎: are the empirical s.d.'s of the scores (GRS46K, FDR202, and 1000Genomes CAD)
in the training data, 𝛼%), 𝛼%9, 𝛼%: are the SNP effect sizes (log odds ratios from the published summary
statistics) for the jth SNP in each of the three scores, respectively, and 𝑥"% is the genotype for the ith
individual’s jth SNP. A SNP’s effect size 𝛼%? was considered to be zero for the kth score if the SNP
was not included in that score.
Statistical analysis All scores were standardised to zero-mean and unit-variance. All scores were evaluated using
logistic regression or age-as-time-scale Cox proportional hazards regression, with censoring at 75y,
as well as with Kaplan-Meier estimates of cumulative incidence (censored at 75y). Unless otherwise
noted, analyses using only genetic risk scores include both prevalent and incident CAD cases
(germline DNA variation being determined prior to any disease); to avoid reverse causation,
analyses that included conventional risk factors (measured at the UKB assessment) used only
.CC-BY 4.0 International licensenot peer-reviewed) is the author/funder. It is made available under aThe copyright holder for this preprint (which was. http://dx.doi.org/10.1101/250712doi: bioRxiv preprint first posted online Jan. 19, 2018;
8
incident CAD. The Cox models were stratified by sex and adjusted for genotyping array (BiLEVE vs
UKB) and 10 genetic PCs. C-indices for the Cox models were sex stratified, using age as time scale.
A competing risk analysis, using the Aalen-Johansen estimator (three states: CAD, non-CAD death,
and censored), was conducted using the R package ‘survival’23.
Results
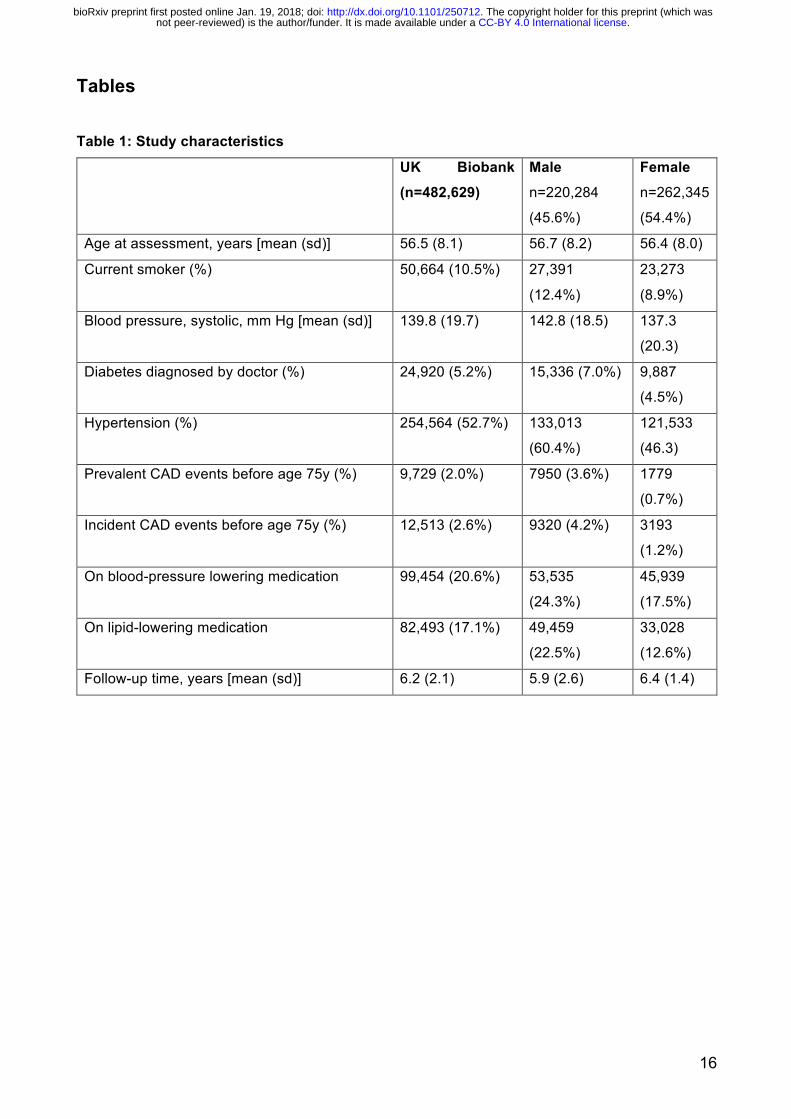
The characteristics of the UKB subjects in the external validation set (n=482,629) are shown in Table 1, comprising 22,242 CAD cases before age 75y and 460,387 non-cases in total. There were 9,729
prevalent cases of CAD at the time of recruitment and a further 12,513 incident cases of CAD during
a mean follow-up of 6.2 years, at the censoring age of 75 years in 2017. Our meta-analysis approach
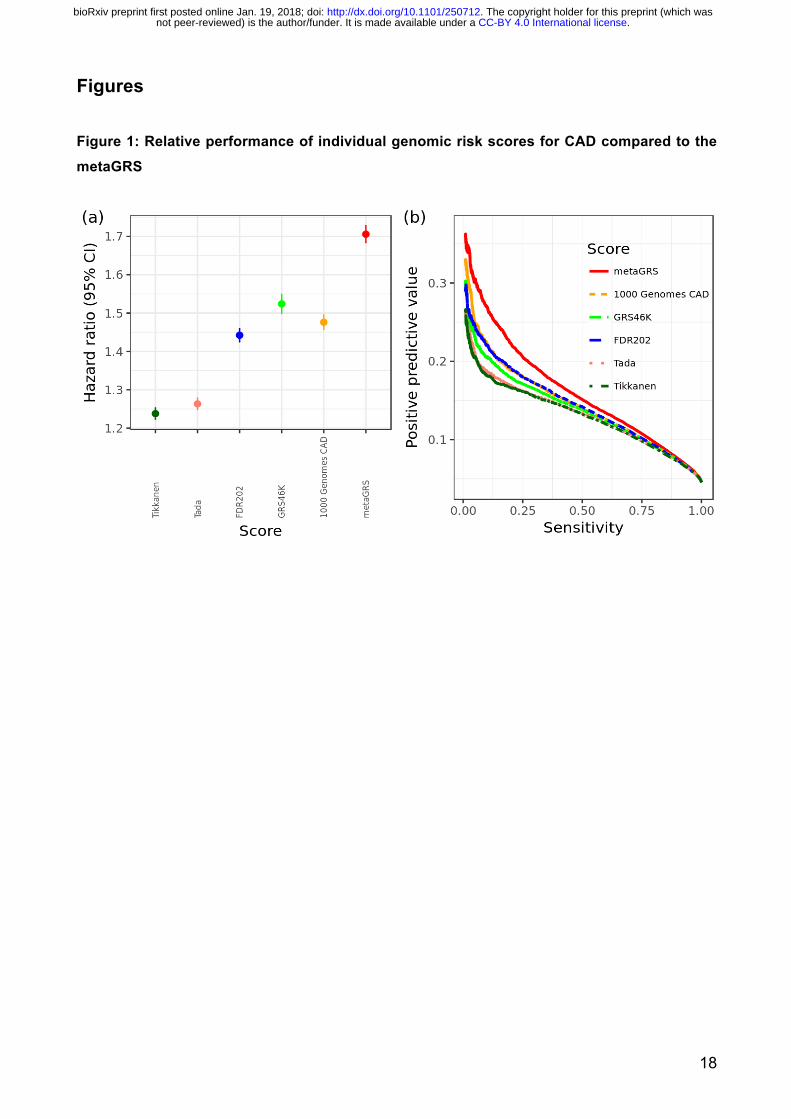
resulted in a 'metaGRS' comprising 1,745,180 genetic variants. A comparison of the metaGRS with
its individual components and previously published GRSs from Tikkanen et al 6 and Tada et al 8 is
given in Figure 1, showing the metaGRS had substantially greater association with CAD risk, in
terms of hazard ratio as well as positive predictive value (PPV) at any given sensitivity.
In the external UKB validation set, the metaGRS was accurate at classifying CAD cases vs non-
cases with an area under the ROC curve (AUC) of 0.79 (+2.8% over the reference logistic model
consisting of sex, age at assessment, genotyping array, and 10 PCs). The metaGRS offered greater
PPV at any given sensitivity and thus greater Area under the Precision-Recall Curve (APRC)
compared to the reference model (0.161 vs 0.123; Figure 2a). The distributions of the metaGRS
amongst prevalent CAD cases, incident CAD cases and non-CAD were each approximately
Gaussian and revealed a trend of increasing genomic risk (Supplementary Figure 2), with prevalent
cases more easily differentiable as they comprise individuals at higher genomic risk who have earlier
CAD events.
In sex-stratified Cox regression models for CAD, the metaGRS had an HR of 1.71 (95% CI 1.68–
1.73) per s.d. of metaGRS (P<0.0001) (Figure 1). The metaGRS was significantly but weakly
associated with body mass index (BMI) at assessment (0.0044 log(kg/m2) per s.d., 95% CI 0.0039–
0.0049, P<0.0001), diagnosed diabetes (OR=1.14 per s.d., 95% CI 1.13–1.16, P<0.0001),
hypertension at assessment (OR=1.19 per s.d., 95% CI 1.18–1.20, P<0.0001), and current smoking
at assessment (OR=1.06 per s.d., 95% CI 1.04–1.07, P<0.0001). No evidence for competing risk
effects was observed (Supplementary Figure 3). In Cox regression of incident CAD (Figure 2b),
models based on the metaGRS had higher C-index (C=0.623, 95% CI 0.615–0.630) than any of the
individual conventional risk factors, with the second-best factor being hypertension at baseline
.CC-BY 4.0 International licensenot peer-reviewed) is the author/funder. It is made available under aThe copyright holder for this preprint (which was. http://dx.doi.org/10.1101/250712doi: bioRxiv preprint first posted online Jan. 19, 2018;
9
(C=0.590, 95% CI 0.583–0.598). A model combining the four conventional risk factors had only
slightly better performance (C=0.639, 95% CI 0.632–0.647) than the metaGRS individually.
Combining the metaGRS with all four conventional risk factors led to a model with C-index of 0.676
(95% CI 0.669–0.684), an increase of 3.7% over the model consisting of the four conventional risk
factors.
To investigate the potential role of the metaGRS in earlier life genetic screening, we compared the
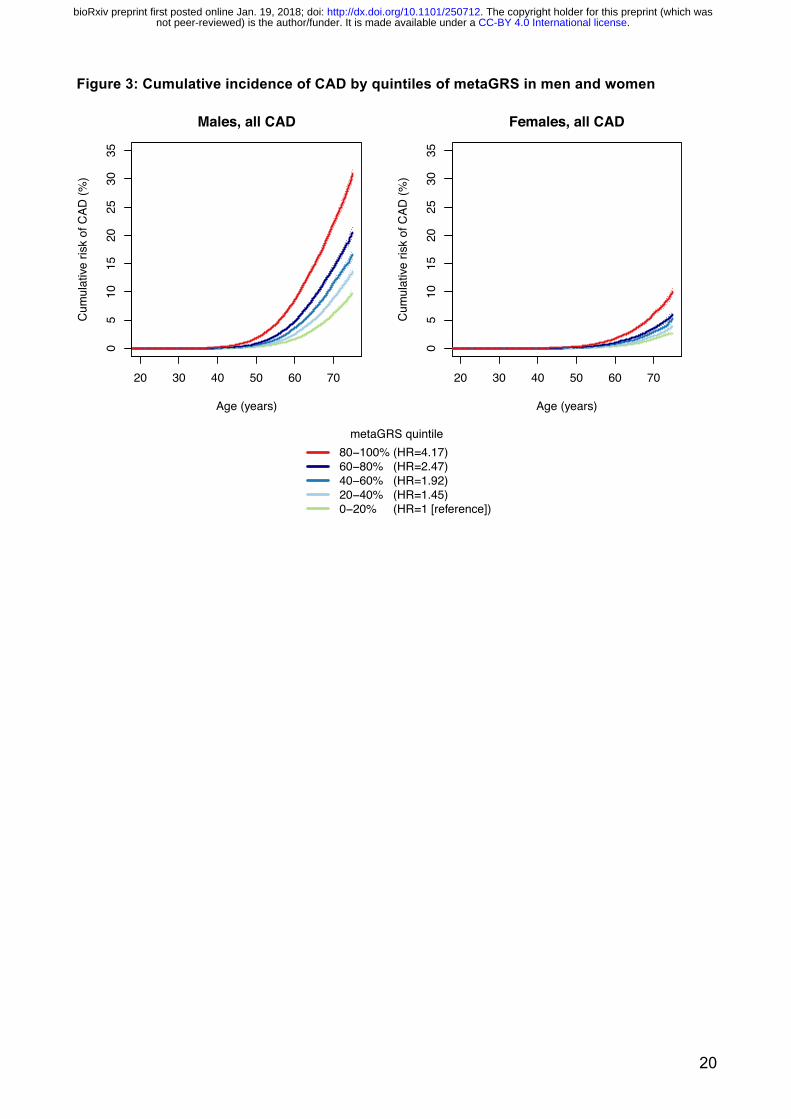
sex-stratified cumulative incidence of CAD across quintiles of the metaGRS (Figure 3). In UKB men,
we observed that CAD risk in the highest metaGRS quintile began exponentially increasing shortly
after age 40, reaching a threshold of 10% cumulative risk by 61 years of age (Figure 3). By
comparison, CAD risk for men in the lowest metaGRS quintile did not begin increasing until age 50
and on average did not reach 10% by the censoring age of 75. In UKB women, the metaGRS results
were similar but delayed given the lower absolute CAD risk overall compared to men. For women in
the highest metaGRS quintile, CAD risk began increasing at age 49 and reached 10% at age 75;
while women in the lowest metaGRS quintile were at extremely low levels of risk, reaching 2.5%
CAD risk by the censoring age of 75. There was no evidence for a statistical interaction of the
metaGRS with sex. Overall, on average UKB individuals in the top metaGRS quintile were at 4.17-
fold (95% CI 3.97–4.38) higher hazard of CAD than those in the bottom metaGRS quintile (Figure 3).
We next assessed the differences in incident CAD risk across metaGRS quintiles when combined
with conventional risk factors (current smoking, diabetes, high blood pressure, and high BMI)
individually (Supplementary Figures 4–7) or as an unweighted score, the number (0–4) of
conventional risk factors per individual (Figure 4). Broadly, the patterns were similar across all the
analyses. Genomic risk and lifestyle/clinical factors combined to increase risk in both men and
women; however, in most instances this was additive rather than interactive. In Cox regression
models of incident CAD, adjusting for current smoking, diagnosed diabetes, hypertension, log BMI,
genotyping array, and 10 genetic PCs, there was no strong evidence of statistical interactions
between the metaGRS and either diabetes (P=0.051 for interaction), smoking (P=0.086 for
interaction), or hypertension (P=0.85 for interaction), but there was some evidence for interaction
with log BMI (HR=0.85, 95% CI 0.76–0.5, P=0.0037). From a clinical perspective, it was notable that
men in the highest metaGRS quintile who had no conventional risk factors still reached 10%
cumulative incidence of CAD by age 69, with a similar cumulative incidence as men in the lowest
metaGRS quintile who had 2 or more conventional risk factors (Figure 4). Men in the highest
metaGRS quintile and with 3 or more conventional risk factors were at extremely high levels of CAD
risk, reaching the 10% threshold by age 48. Approximately 82% of women did not reach 10% CAD
risk before age 75, even if they had 2 conventional risk factors, due to compensation by low or
.CC-BY 4.0 International licensenot peer-reviewed) is the author/funder. It is made available under aThe copyright holder for this preprint (which was. http://dx.doi.org/10.1101/250712doi: bioRxiv preprint first posted online Jan. 19, 2018;
10
moderate metaGRS risk. Even amongst women in the highest metaGRS quintile, only those with 2
or more conventional risk factors achieved 10% risk before age 75 (Figure 4).
To assess the impact of use of treatments (lipid lowering and anti-hypertensive medication) that have
been proven to lower CAD risk on the performance of the metaGRS, we analysed the predictive
capacity of the metaGRS for incident CAD in those taking one or both of these classes of drugs at
baseline. The hazards ratios for each s.d. in GRS were reduced but not negated by these therapies,
with HRs of 1.44 (95% CI 1.40–1.48), 1.46 (95% CI 1.42–1.50) and 1.42 (95% CI 1.37–1.47) for
those individuals on lipid lowering, anti-hypertensives treatments or both treatments, respectively.
Accordingly, the HRs between those in the top versus bottom metaGRS quintiles were also reduced
but remained substantial with HRs of 2.71 (95% CI 2.47–2.98), 2.81 (95% CI 2.56–3.09), and 2.55
(95% CI 2.28–2.86), for those individuals on lipid lowering, anti-hypertensives treatments or both
treatments, respectively (Figure 5).
Discussion Using data from almost half a million people across the UK, we demonstrate that a combined
genomic risk score (metaGRS) built from summary statistics of the largest previous genome-wide
association studies of CAD performs better than any other individual GRS based on selected SNPs
and provides substantial stratification for individual risk of developing CAD. The metaGRS is largely
independent of established risk factors for CAD and improves risk prediction using established
factors alone or in combination. Importantly, the metaGRS can identify both individuals who are at
high risk of premature CAD as well as those who are unlikely to ever reach a life-long risk level
requiring intervention. The findings indicate that treatment of modifiable risk factors in those at high
risk can partially offset genomic risk, while also highlighting the need to develop additional
approaches to address the residual risk. The metaGRS provides valuable additional predictive
information at any age, however its unique property of being able to distinguish markedly different
lifelong trajectories of individual risk at an early age, before atherosclerosis is initiated, provides the
possibility of true primary prevention in those at increased genomic risk, and a potential paradigm
shift in how we evaluate risk of and prevent CAD.
Our construction of the metaGRS leveraged the strengths of previous genetic association studies to
provide greater predictive power and generalisability than any previous genetic risk score. The
metaGRS was stronger than any conventional risk factor available for CAD, largely independent of
.CC-BY 4.0 International licensenot peer-reviewed) is the author/funder. It is made available under aThe copyright holder for this preprint (which was. http://dx.doi.org/10.1101/250712doi: bioRxiv preprint first posted online Jan. 19, 2018;
11
these risk factors, and substantially increased the predictive power of models combining
conventional risk factors. If substantiated once a full set of conventional risk factors has been
examined, the metaGRS will have major ramifications for CAD screening, including both
identification of individuals at high CAD risk who may benefit from earlier intervention(s) and/or more
intensive screening with traditional clinical risk factors, and identification of those individuals at
exceptionally low CAD risk who may not reach a clinically relevant level of risk before age 75. Our
findings suggest that men in the highest metaGRS quintile, regardless of the number of traditional
clinical risk factors, would likely benefit from more intensive interventions; indeed, those with one or
more conventional risk factors would likely benefit from statin prescription at an early age. Similar
suggestions have been made for Caucasian individuals at high polygenic risk where, using a GRS
optimised on a large subset of the UKB, they appeared to have levels of coronary disease risk on
par with the risk conferred by familial hypercholesterolemia 13. For risk stratification it was notable
that approximately 80% of women (i.e. those not in the top metaGRS quintile) could effectively
receive minimal screening for traditional risk factors before age 75. Under this scenario, health
systems may benefit from more efficient deployment of resources away from individuals at low
genomic CAD risk.
The finding that increased genetic risk can at least partly be attenuated by lipid lowering and/or anti-
hypertensive medication suggests a potential immediate clinical value to identifying individuals at
high metaGRS risk. Those individuals at high genetic risk may gain maximally from early initiation of
these therapies and provide more cost-effective primary prevention 16. However, the finding that
even for individuals on these medications at baseline, the metaGRS can still stratify those at
increased risk of CAD, emphasises the need to develop further therapies to realise the full potential
of early genetic risk stratification.
The clinical implementation of the metaGRS is straightforward. Each individual's DNA can be run on
one of many common genome-wide genotyping arrays which, together with quality control and
genotype imputation, can be combined with a list of genetic variants and their corresponding weights;
a simple algorithm then calculates a metaGRS score for that individual. When compared to a large
reference group from a similar population, such as the UK Biobank, the individual's genomic risk of
CAD can be determined. Importantly, the genotyping has a one-time cost (approximately US$50 at
current prices) and can be used to calculate updated genetic risk scores for CAD as further more
powerful association data emerges or, indeed, risk scores for other diseases. To facilitate future
development and translation, we have made the metaGRS freely available 24.
There are several limitations to our study. Importantly, the UKB does not yet have lipid and other
biochemical data available, thus the relationship between the metaGRS and lipids or traditional
clinical risk scores (e.g. Framingham Risk Score, QRISK, etc) could not be assessed. However,
.CC-BY 4.0 International licensenot peer-reviewed) is the author/funder. It is made available under aThe copyright holder for this preprint (which was. http://dx.doi.org/10.1101/250712doi: bioRxiv preprint first posted online Jan. 19, 2018;

12
previous studies have investigated the correlation and added value of genetic risk to clinical risk
scores, finding significant improvements in C-index, hazard ratios, and reclassification indices 3,8.
Another limitation is that the cumulative genomic risk of CAD is likely an underestimate of the
population-level lifetime risk due to the likelihood that more individuals at higher genetic risk are
more likely to have died from CAD prior to enrolment. Similarly, to avoid reverse causation, incident
CAD analyses necessitated the exclusion of individuals with prevalent CAD; however, this also
preferentially removed those with early CAD onset and high genomic risk. On the other hand it should
be noted that UKB participants are healthier than the general UK population 25,26 which could affect
the generalisability of the findings. Reverse causation concerns also limited our ability to assess the
effect of medication versus non-medication in individuals at high metaGRS risk, since, without blind
randomisation, those on medication are already at higher CAD risk. While the UKB captures much
of the ethnic diversity of Western Europe, the proportion of non-Caucasian individuals is small (<
5%). We did not exclude these individuals from our analysis, however larger sample sizes and other
cohorts will be necessary to undertake meaningful ethnicity-specific analyses. Therefore, the
performance and utility of metaGRS in other ethnic populations remains to be determined. Finally,
the UKB currently has limited follow-up (median of 6.2 years), therefore both the assessment of
clinical risk scores and public health modelling of the metaGRS are important areas for future
studies.
In conclusion, our results show that an individual's genomic risk of CAD, which together with sex is
set before birth in germline DNA, is a stable risk factor which can provide the most advanced warning
of disease. While genetics is not destiny for CAD, advances in genomic prediction have brought the
long history of CAD risk screening to a critical juncture, where we may now be able to predict, plan
for, and possibly avoid a disease with substantial morbidity and mortality.
Acknowledgements We are grateful to UK Biobank for access to data to undertake our study. This study was supported
by funding from National Health and Medical Research Council (NHMRC) grant APP1062227.
Supported in part by the Victorian Government’s OIS Program. M.I. was supported by an NHMRC
and Australian Heart Foundation Career Development Fellowship (no. 1061435). G.A. was
supported by an NHMRC Early Career Fellowship (no. 1090462). N.J.S., C.P.N. and B.K. are
supported by the British Heart Foundation and N.J.S. is a NIHR Senior Investigator. R.S.P. is
supported by the British Heart Foundation (FS/14/76/30933). The MRC/BHF Cardiovascular
Epidemiology Unit is supported by the UK Medical Research Council [MR/L003120/1], British Heart
.CC-BY 4.0 International licensenot peer-reviewed) is the author/funder. It is made available under aThe copyright holder for this preprint (which was. http://dx.doi.org/10.1101/250712doi: bioRxiv preprint first posted online Jan. 19, 2018;

13
Foundation [RG/13/13/30194], and UK National Institute for Health Research Cambridge Biomedical
Research Centre. J.D. is a British Heart Foundation Professor and NIHR Senior Investigator.
Disclosures MKR reports receiving honoraria and consulting fees from Novo Nordisk, Ascensia, Cell Catapult
and Roche Diabetes Care.
.CC-BY 4.0 International licensenot peer-reviewed) is the author/funder. It is made available under aThe copyright holder for this preprint (which was. http://dx.doi.org/10.1101/250712doi: bioRxiv preprint first posted online Jan. 19, 2018;
14
References 1. Khera AV, Kathiresan S. Genetics of coronary artery disease: discovery, biology and clinical translation. Nat Rev Genet 2017; 18(6): 331-44. 2. Watkins H, Farrall M. Genetic susceptibility to coronary artery disease: from promise to progress. Nat Rev Genet 2006; 7(3): 163-73. 3. Abraham G, Havulinna AS, Bhalala OG, et al. Genomic prediction of coronary heart disease. Eur Heart J 2016; 37(43): 3267-78. 4. Khera AV, Emdin CA, Drake I, et al. Genetic Risk, Adherence to a Healthy Lifestyle, and Coronary Disease. N Engl J Med 2016; 375(24): 2349-58. 5. Ripatti S, Tikkanen E, Orho-Melander M, et al. A multilocus genetic risk score for coronary heart disease: case-control and prospective cohort analyses. Lancet 2010; 376(9750): 1393-400. 6. Tikkanen E, Havulinna AS, Palotie A, Salomaa V, Ripatti S. Genetic risk prediction and a 2-stage risk screening strategy for coronary heart disease. Arterioscler Thromb Vasc Biol 2013; 33(9): 2261-6. 7. Mega JL, Stitziel NO, Smith JG, et al. Genetic risk, coronary heart disease events, and the clinical benefit of statin therapy: an analysis of primary and secondary prevention trials. Lancet 2015; 385(9984): 2264-71. 8. Tada H, Melander O, Louie JZ, et al. Risk prediction by genetic risk scores for coronary heart disease is independent of self-reported family history. Eur Heart J 2016; 37(6): 561-7. 9. Natarajan P, Young R, Stitziel NO, et al. Polygenic Risk Score Identifies Subgroup With Higher Burden of Atherosclerosis and Greater Relative Benefit From Statin Therapy in the Primary Prevention Setting. Circulation 2017; 135(22): 2091-101. 10. Dudbridge F. Power and predictive accuracy of polygenic risk scores. PLoS Genet 2013; 9(3): e1003348. 11. Chatterjee N, Shi J, Garcia-Closas M. Developing and evaluating polygenic risk prediction models for stratified disease prevention. Nat Rev Genet 2016; 17(7): 392-406. 12. Abraham G, Inouye M. Genomic risk prediction of complex human disease and its clinical application. Curr Opin Genet Dev 2015; 33: 10-6. 13. Khera AV, Chaffin M, Aragam K, et al. Genome-wide polygenic score to identify a monogenic risk-equivalent for coronary disease. bioRxiv 2017. 14. Krarup NT, Borglykke A, Allin KH, et al. A genetic risk score of 45 coronary artery disease risk variants associates with increased risk of myocardial infarction in 6041 Danish individuals. Atherosclerosis 2015; 240(2): 305-10. 15. Qi L, Ma J, Qi Q, Hartiala J, Allayee H, Campos H. Genetic risk score and risk of myocardial infarction in Hispanics. Circulation 2011; 123(4): 374-80. 16. Sudlow C, Gallacher J, Allen N, et al. UK biobank: an open access resource for identifying the causes of a wide range of complex diseases of middle and old age. PLoS Med 2015; 12(3): e1001779. 17. McCarthy S, Das S, Kretzschmar W, et al. A reference panel of 64,976 haplotypes for genotype imputation. Nat Genet 2016; 48(10): 1279-83. 18. Chang CC, Chow CC, Tellier LC, Vattikuti S, Purcell SM, Lee JJ. Second-generation PLINK: rising to the challenge of larger and richer datasets. Gigascience 2015; 4: 7. 19. Bycroft C, Freeman C, Petkova D, et al. Genome-wide genetic data on~ 500,000 UK Biobank participants. bioRxiv 2017: 166298. 20. Nikpay M, Goel A, Won HH, et al. A comprehensive 1,000 Genomes-based genome-wide association meta-analysis of coronary artery disease. Nat Genet 2015; 47(10): 1121-30. 21. CARDIoGRAMplusC4D Consortium, Deloukas P, Kanoni S, et al. Large-scale association analysis identifies new risk loci for coronary artery disease. Nat Genet 2013; 45(1): 25-33.
.CC-BY 4.0 International licensenot peer-reviewed) is the author/funder. It is made available under aThe copyright holder for this preprint (which was. http://dx.doi.org/10.1101/250712doi: bioRxiv preprint first posted online Jan. 19, 2018;

15
22. MacMahon S, Peto R, Cutler J, et al. Blood pressure, stroke, and coronary heart disease. Part 1, Prolonged differences in blood pressure: prospective observational studies corrected for the regression dilution bias. Lancet 1990; 335(8692): 765-74. 23. Therneau T. A Package for Survival Analysis in S. R package version 2.41-3.; 2017. 24. . https://figshare.com/articles/Coronary_Artery_Disease_CAD_MetaGRS/5748096. 25. Fry A, Littlejohns TJ, Sudlow C, et al. Comparison of Sociodemographic and Health-Related Characteristics of UK Biobank Participants With Those of the General Population. American Journal of Epidemiology 2017; 186(9): 1026-34. 26. Ganna A, Ingelsson E. 5 year mortality predictors in 498,103 UK Biobank participants: a prospective population-based study. Lancet 2015; 386(9993): 533-40.
.CC-BY 4.0 International licensenot peer-reviewed) is the author/funder. It is made available under aThe copyright holder for this preprint (which was. http://dx.doi.org/10.1101/250712doi: bioRxiv preprint first posted online Jan. 19, 2018;
16
Tables Table 1: Study characteristics
UK Biobank (n=482,629)
Male n=220,284
(45.6%)
Female n=262,345
(54.4%)
Age at assessment, years [mean (sd)] 56.5 (8.1) 56.7 (8.2) 56.4 (8.0)
Current smoker (%) 50,664 (10.5%) 27,391
(12.4%)
23,273
(8.9%)
Blood pressure, systolic, mm Hg [mean (sd)] 139.8 (19.7) 142.8 (18.5) 137.3
(20.3)
Diabetes diagnosed by doctor (%) 24,920 (5.2%) 15,336 (7.0%) 9,887
(4.5%)
Hypertension (%) 254,564 (52.7%) 133,013
(60.4%)
121,533
(46.3)
Prevalent CAD events before age 75y (%) 9,729 (2.0%) 7950 (3.6%) 1779
(0.7%)
Incident CAD events before age 75y (%) 12,513 (2.6%) 9320 (4.2%) 3193
(1.2%)
On blood-pressure lowering medication 99,454 (20.6%) 53,535
(24.3%)
45,939
(17.5%)
On lipid-lowering medication 82,493 (17.1%) 49,459
(22.5%)
33,028
(12.6%)
Follow-up time, years [mean (sd)] 6.2 (2.1) 5.9 (2.6) 6.4 (1.4)
.CC-BY 4.0 International licensenot peer-reviewed) is the author/funder. It is made available under aThe copyright holder for this preprint (which was. http://dx.doi.org/10.1101/250712doi: bioRxiv preprint first posted online Jan. 19, 2018;

17
Figure Legends Figure 1: Relative performance of individual genomic risk scores for CAD compared to the metaGRS In the UKB testing set (n=482,629), (a) hazard ratios per s.d. of each score for all CAD (n=22,242),
censored at 75y, from Cox regression stratified by sex and adjusted for genotyping array
(BiLEVE/UKB) and 10 genetic PCs; (b) Positive predictive value vs sensitivity for a logistic regression
for each GRS, adjusted for sex, age, genotyping array (BiLEVE/UKB) and 10 genetic PCs. Figure 2: Predictive measures of CAD using the metaGRS and conventional risk factors (a) Positive predictive values vs sensitivity for the reference model (sex + age + array + 10 genetic
PCs) and when adding the metaGRS to the model for all CAD in the UKB testing set. APRC is Area
under the Precision-Recall Curve. (b) C-index for sex-stratified age-as-time-scale Cox regression of
incident CAD for conventional risk factors individually and in combination with the metaGRS,
including genotyping array and 10 genetic PCs as covariates.
Figure 3: Cumulative incidence of CAD by quintiles of metaGRS in men and women Figure 4: Cumulative incidence of CAD for increasing numbers of conventional risk factors stratified by metaGRS quintile Figure 5: Cumulative incidence of incident CAD within individuals on lipid-lowering or BP-lowering medication at assessment.
.CC-BY 4.0 International licensenot peer-reviewed) is the author/funder. It is made available under aThe copyright holder for this preprint (which was. http://dx.doi.org/10.1101/250712doi: bioRxiv preprint first posted online Jan. 19, 2018;
18
Figures Figure 1: Relative performance of individual genomic risk scores for CAD compared to the metaGRS
.CC-BY 4.0 International licensenot peer-reviewed) is the author/funder. It is made available under aThe copyright holder for this preprint (which was. http://dx.doi.org/10.1101/250712doi: bioRxiv preprint first posted online Jan. 19, 2018;

19
Figure 2: Predictive measures of CAD using the metaGRS and conventional risk factors
.CC-BY 4.0 International licensenot peer-reviewed) is the author/funder. It is made available under aThe copyright holder for this preprint (which was. http://dx.doi.org/10.1101/250712doi: bioRxiv preprint first posted online Jan. 19, 2018;
20
Figure 3: Cumulative incidence of CAD by quintiles of metaGRS in men and women
05
1015
2025
3035
Males, all CAD
Age (years)
Cum
ulat
ive ri
sk o
f CAD
(%)
20 30 40 50 60 70
05
1015
2025
3035
Females, all CAD
Age (years)C
umul
ative
risk
of C
AD (%
)
20 30 40 50 60 70
metaGRS quintile80−100% (HR=4.17)60−80% (HR=2.47)40−60% (HR=1.92)20−40% (HR=1.45)0−20% (HR=1 [reference])
.CC-BY 4.0 International licensenot peer-reviewed) is the author/funder. It is made available under aThe copyright holder for this preprint (which was. http://dx.doi.org/10.1101/250712doi: bioRxiv preprint first posted online Jan. 19, 2018;

21
Figure 4: Cumulative incidence of CAD for increasing numbers of conventional risk factors stratified by metaGRS quintile
40 45 50 55 60 65 70 75
010
2030
4050
60
Male, low GRS (0−20%)
Age (years)
Cum
ulat
ive ri
sk o
f CAD
(%)
Number of elevated risk factors>2210
40 45 50 55 60 65 70 750
1020
3040
5060
Male, medium GRS (40−60%)
Age (years)
Cum
ulat
ive ri
sk o
f CAD
(%)
40 45 50 55 60 65 70 75
010
2030
4050
60
Male, high GRS (80−100%)
Age (years)
Cum
ulat
ive ri
sk o
f CAD
(%)
40 45 50 55 60 65 70 75
010
2030
4050
60
Female, low GRS (0−20%)
Age (years)
Cum
ulat
ive ri
sk o
f CAD
(%)
40 45 50 55 60 65 70 75
010
2030
4050
60
Female, medium GRS (40−60%)
Age (years)
Cum
ulat
ive ri
sk o
f CAD
(%)
40 45 50 55 60 65 70 750
1020
3040
5060
Female, high GRS (80−100%)
Age (years)
Cum
ulat
ive ri
sk o
f CAD
(%)
.CC-BY 4.0 International licensenot peer-reviewed) is the author/funder. It is made available under aThe copyright holder for this preprint (which was. http://dx.doi.org/10.1101/250712doi: bioRxiv preprint first posted online Jan. 19, 2018;

22
Figure 5: Cumulative incidence of incident CAD within individuals on lipid-lowering or BP-lowering medication at assessment, stratified by quintiles of the metaGRS
40 45 50 55 60 65 70 75
010
2030
4050
60Males, on lipid−loweringor on BP−lowering meds
Age (years)
Cum
ulat
ive ri
sk o
f CAD
(%)
metaGRS quintilesHigh (80−100%)Medium (40−60%)Low (0−20%)
40 45 50 55 60 65 70 75
010
2030
4050
60
Females ,on lipid−loweringor on BP−lowering meds
Age (years)
Cum
ulat
ive ri
sk o
f CAD
(%)
.CC-BY 4.0 International licensenot peer-reviewed) is the author/funder. It is made available under aThe copyright holder for this preprint (which was. http://dx.doi.org/10.1101/250712doi: bioRxiv preprint first posted online Jan. 19, 2018;