genome wide association study for binomially distributed ... · pdf filelogistic regression...
TRANSCRIPT

GenomeWideAssociationStudyforBinomiallyDistributedTraits:
ACaseStudyforStalkLodginginMaize
EsperanzaShenstoneandAlexanderE.LipkaDepartmentofCropSciences
UniversityofIllinoisatUrbana-Champaign
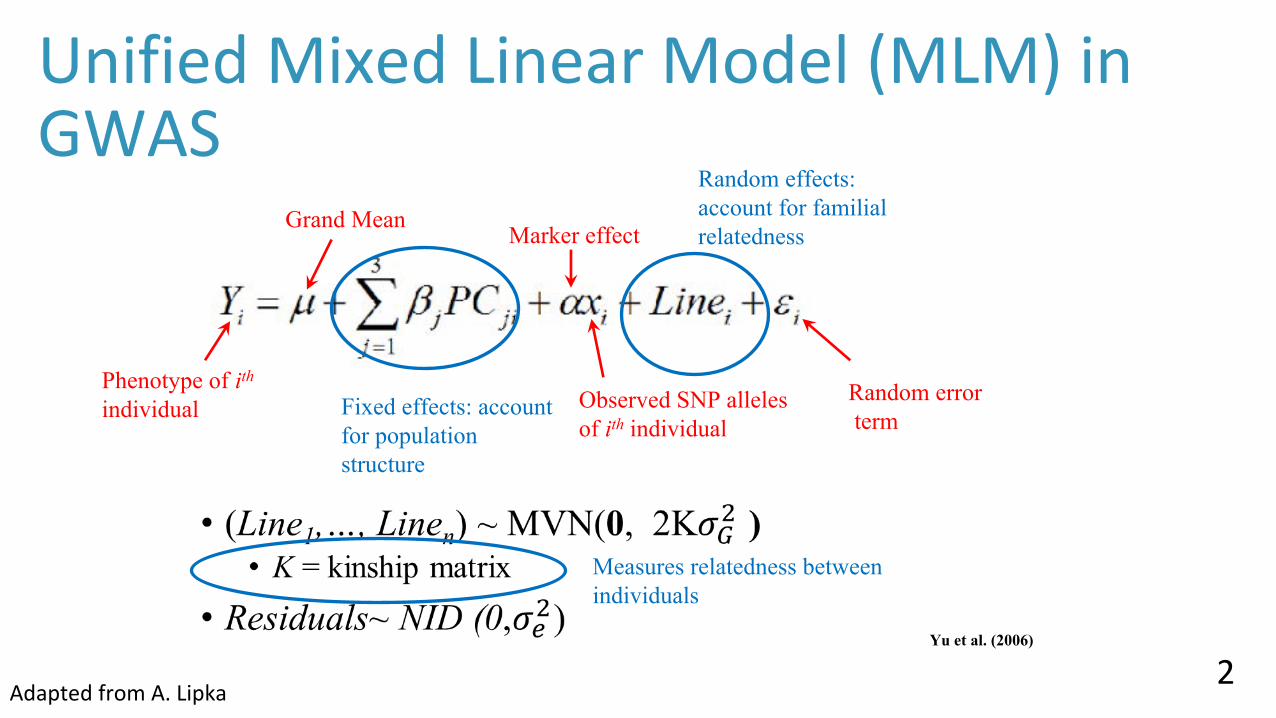
UnifiedMixedLinearModel(MLM)inGWAS
2Yu et al. (2006)
AdaptedfromA.Lipka
Phenotype of ithindividual
Grand Mean
Fixed effects: account for population structure
Marker effect
Observed SNP alleles of ith individual
Random effects: account for familial relatedness
Random errorterm
Measures relatedness between individuals

AssumptionsoftheUnifiedMLM
Whatdowedoiftheseassumptionscannotbemet?(Example:Binomiallydistributeddata)
3Yu et al. (2006)
AdaptedfromA.Lipka

BinomialDistribution:#SuccessesinnIndependentSuccess/FailureTrials
MixedLogisticRegressiondoesnotrequirenormalityorequalvariancesConductGWASbyfittingalogisticregressionmodelateachSNP
LogitLinkfunction:Thenaturallog-oddsofasuccess
Thegrandmean
Problem:Fittingthismodelisextremelycomputationallyintensive!!!

Purpose
Developamulti-modelGWASapproachthatwillallowmixedmodelGWAStobeconductedonbinomially
distributedtraits
5

StalkLodgingInMaize
6
StalkStrength
Disease/Pests
EnvironmentalFactors
5-20%yieldlossesworldwide
Flint-Garciaetal.,2003

DataCollection- 2016
7
TwoRepsoftheGoodman-Bucklerdiversitypanelwereplantedusingincompleteblockdesign
TheentireexperimentwasinoculatedwithGoss’swilt
Inthisexperimenttherewasnocorrelationbetweendiseaseandlodging
TheJamannLabatUIUC

LodgingPhenotyping
8
Standcount NumberofPlantsLodged
NumberofplantsNotlodged
LodgingScore(PercentLodged)
23 6 17 26%BeginningofGrowingSeasonEndofgrowingseason
Above:Diagramdepictingoneplot(rep)ofonetaxainthefield

TreatLodgingDataasaBinomialSetupofBinomial Whywethinkbinomialisan
appropriateapproximationforlodging
Theexperimentconsistsofnrepeatedtrials
Withineachplot,eachplantisatrial
Eachtrialhastwooutcomes:successorfailure
Success: planthaslodgedFailure: Planthasnotlodged
Theprobabilityofsuccess, π,isthesameoneverytrial
Theprobabilityofaplantlodging,π,isthesamewithinaplot
Thetrialsareindependent Oneplantlodgingwillnotchangethelikelihoodofanotherplantlodging
9

Multi-ModelApproach
10
Model1FitLogisticRegressionModel
Controlsforpopulation
structureonlyIdentifypeak
SNPs
Model2FitaMixedLinearModelControlsforpopulation
structureandrelatednessIdentifypeak
SNPs
Model3FitMixedLogistic
RegressionModel
UsingPeakSNPsfromModel1andModel2

LogisticRegressionIdentified~50%ofMarkerstobeSignificant
11
Thetop2,796SNPsfromthismodelweresubset
RStudioChromosome
PeakSNPPossibleSNPsofinterest
Motivation:mixedlogisticregressionmodelcanfit2,796modelsin<1day

UnifiedMLMIdentifiedNoSignificantSignals
12GAPITLipkaetal.,2012
Chromosome

MixedLogisticRegressionIdentifies68%ofSNPsIdentifiedinLogisticRegression
toBeSignificant
13
SAS9.4PROCGLIMMIX
Accountingforfamilialrelatednesshelpedrefinelocationofputativegenomicregions
SignalscoincidewiththosepreviouslyidentifiedfortraitsrelatedtolodgingChromosome

14
SimulationStudyinGoodman-BucklerDiversitypanel:
Determinewhichparametersofthebinomialdistributioncontributethemosttoidentificationofgenomic
signals

15
Assign SNP from 4K Set to be QTN
Simulate binomial distributed trait
QTN Effect size Stand count per plot Grand mean
Simulate Data~100 “Traits”
Fit logistic regression model at each of 55K SNPs
ProposedMethodologyforSimulationStudy
Foreachtraitineachsetting:Assessedgenomicpositionsof“top100”markerswithstrongestassociations

HowdoesthetotalnumberofplantsinaplotaffectQTNdetection?
StandCount:10
Proportionoftimesdetected:1.0
Model1
Top100SNPsfromeachtraitusedtocreatethisfigure

HowdoesthetotalnumberofplantsinaplotaffectQTNdetection?
StandCount:15
Proportionoftimesdetected:1.0
Model1
Top100SNPsfromeachtraitusedtocreatethisfigure

HowdoesthetotalnumberofplantsinaplotaffectQTNdetection?
StandCount:20
Proportionoftimesdetected:1.0
Model1
Top100SNPsfromeachtraitusedtocreatethisfigure

HowdoesthetotalnumberofplantsinaplotaffectQTNdetection?
StandCount:25
Proportionoftimesdetected:1.0
Model1
Top100SNPsfromeachtraitusedtocreatethisfigure
StandcountdoesnotappeartoaffectourabilitytodetectQTN

HowdoesgrandmeanaffectQTNdetection?
GrandMean=0;P{Success}=0.5Proportionoftimesdetected:1.0
Model1
Top100SNPsfromeachtraitusedtocreatethisfigure

HowdoesgrandmeanaffectQTNdetection?
GrandMean=1;P{Success}=0.73Proportionoftimesdetected:1.0
Model1
Top100SNPsfromeachtraitusedtocreatethisfigure

HowdoesgrandmeanaffectQTNdetection?
GrandMean=3;P{Success}=0.95Proportionoftimesdetected:0.82
Model1
Top100SNPsfromeachtraitusedtocreatethisfigure

HowdoesgrandmeanaffectQTNdetection?
GrandMean=5;P{Success}=0.99
Proportionoftimesdetected:0.10
Model1
Top100SNPsfromeachtraitusedtocreatethisfigure
GrandmeanvaluesaffectsourabilitytodetectQTN

FutureDirectionsAnyphenotypethatmeasures#successesinaplotofn plantscouldtheoreticallyusetheseapproaches- Trytodesignexperimentsthatresultinabaselineprobabilityofsuccessof0.5
HowcanwefitmixedlinearmodelsinacomputationallyefficientmanneronaWindows/Maccomputer?- Temporarysolution:multi-modelapproachisreasonable- Trytostrivefor:writesoftwarethatusesthescoretest
24

Acknowledgements
25
CommitteeMembersDr.AlexanderE.LipkaDr.TiffanyJamannDr.MartinBohnDr.PatBrown
TheJamannLabJulianCooper
TheLipkaLabBrianRiceAngelaChen
GraduateStudentsAmandaOwings
DepartmentofCropSciencesatUIUC

Model1vs.Model2Comparison

VaryingAdditiveEffectSizes(SameAssignedQTN)
Additiveeffectsize0.5onchromosome8
Proportiontimedetected:0.93
Additiveeffectsize0.1onchromosome8
Proportionoftimesdetected:0.07

SummaryofResultsAbletoidentifytwosignificantSNPsintheBPregionofMaizeStalkStrengthQTL
Lietal.,2014,Flint-Garciaetal.,2003,Huetal.,2012PeakSNPsonChromosome7wereinthesamelocationasthemostrobustmarkerassociationwithRPR
Piefferetal.,2013AsignificantSNPonChromosome1wasinthesameregionasacandidategeneforMediterraneanCornBorerstalkdestructionsusceptibility
Samayoaetal.,2015
28

29
HighLDDecayObservedAroundPeakSNPonChromosomeSeven

LimitingFactorsofThisStudyStalklodgingisaputativelylowheritabilitytraitNorepeatabilityacrossreplications
OnlyoneyearofdataincludedinthisanalysisOnlyoneenvironment
MissingdataVariousfactorscontributed
30

SummaryofProjectLogisticRegressioniscomputationallyintensiveApproximately30secondstorun1SNPinSAS~17.36daystorun50,000SNPs
Model1andModel2areusedtoidentifywhichSNPsarefitusingthecompletelogisticregressionmodel(Model3)ThenumberofSNPstoincludeisdependentoncomputationalpoweravailable
StalkLodgingdatawasusedtotestthisapproachSomePeakSNPsidentifiedareinthesameregionasQTLassociatedwithstalkstrength,andacandidategeneforMCBStalkDamage
31
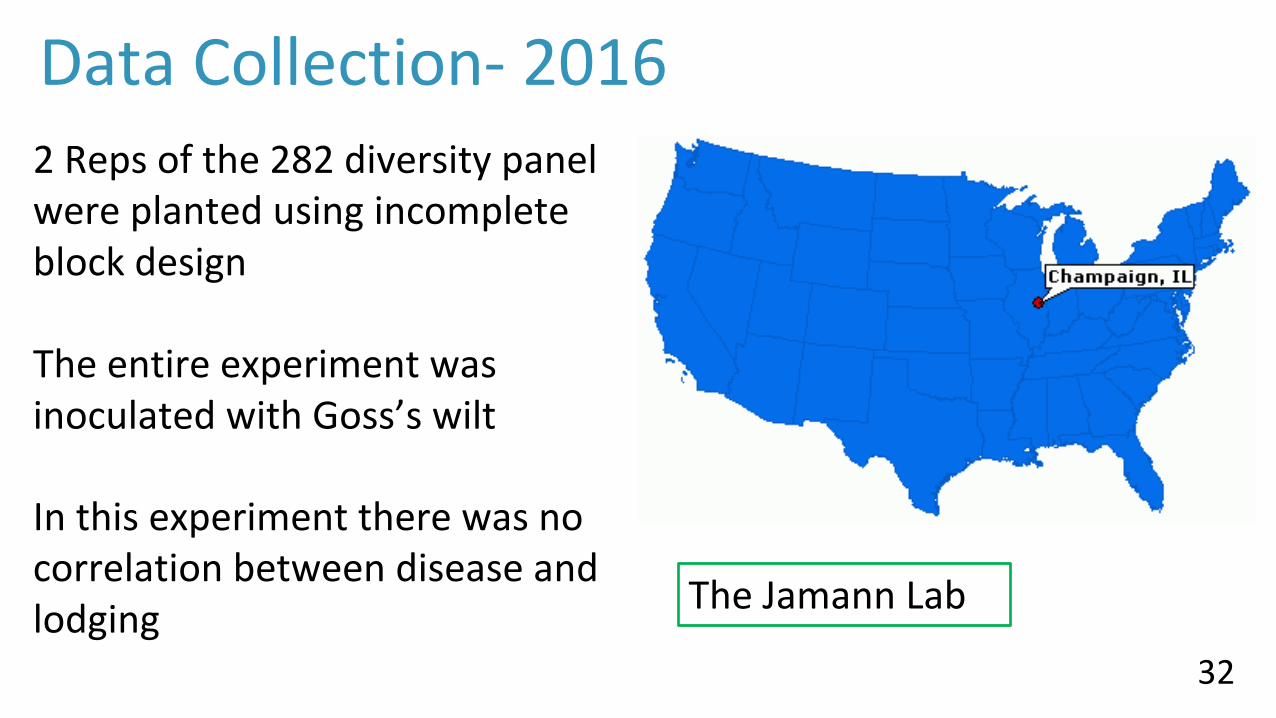
DataCollection- 2016
32
2Repsofthe282diversitypanelwereplantedusingincompleteblockdesign
TheentireexperimentwasinoculatedwithGoss’swilt
Inthisexperimenttherewasnocorrelationbetweendiseaseandlodging TheJamannLab

ObservedLodgingintheField
33
Taxaclassifiedasnonstiffstalkwerelodgedmoreoften
Taxaclassifiedasstiffstalkwerelodgedthelessoften
Allplotsrepresentedinthisgraphhadatleast10plantslodged

LodgingScoreResidualsFollowaNon-NormalDistribution
34
The Box-Cox procedure was implemented, and λ=-0.6 was the suggested transformation
Transformation was unsuccessful
352 plots had no lodging
DistributionofLodgingScores
LodgingScoreFreq
uency

Genome-WideAssociationStudy(GWAS)
SearchthegenomeforgeneticmarkerssignificantlyassociatedwithyourtraitofinterestAllowsfortheidentificationofQTLsregionofthegenomeassociatedwiththetrait
35SingleNucleotidePolymorphism(SNP):Atypeofgeneticmarker
http://knowgenetics.org/snps/

36
282DiversityPanel
~75%ofallallelicdiversityinMaize
AdaptedfromFlint-Garciaetal.,2005Romayetal.,2013

OutlineIntroduction
Genome-WideAssociationonStalkLodginginMaize
SimulationStudy
Conclusions
37

UnifiedMixedLinearModelControlsforFalsePositives
38Yuetal.,2006
Simple
Simple
FloweringtimeofMaize(Highpopulationstructure)
EarDiameterofMaize(LowPopulationStructure)

StalkLodginginMaizePredictinglodgingischallenging
Mostmethodsaredestructiveand/oruseothertraitsasproxies
Canphenotypinglodgingstillyieldinterestingresults?
39
StangerandLauer,2006

BinomialDataAllowsforLogisticRegression
40

Methods
OneSNPsfrom4K markersetwasassignedtobeQTN
Taxafromthe282diversitypanelweresimulatedtoexperiencelodging
The55Kmarkersetwasusedtogenotypethetaxausedinthesimulation
41

ObjectivesEvaluatetheefficacyofthethreemodelapproachtomixedlogisticregression
EvaluatetheuseofthediversitypanelforuseinlogisticregressionGWAS
ExaminehowvariableswithinthedataseteffecttheabilitytodetectaQTN
42

SimulationStudySettings
43
Setting GrandMean
StandCount
Additiveeffectsize
1 0 10 0.92 1 10 0.93 3 10 0.94 5 10 0.95 0 15 0.96 0 20 0.97 0 25 0.9

Model1identifiesPeakSNPsWhileAccountingforPopulationStructure
44

45

Whatdoeschangingtheinterceptdotoourdata?
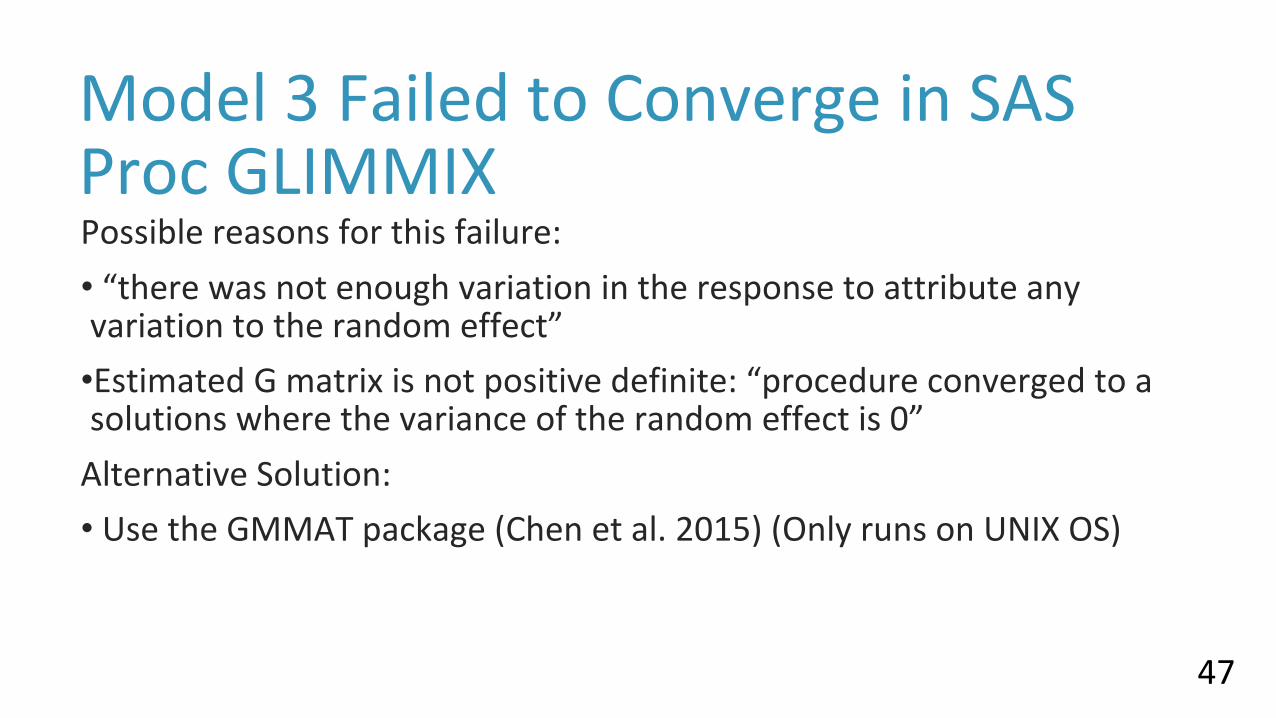
Model3FailedtoConvergeinSASProcGLIMMIXPossiblereasonsforthisfailure:• “therewasnotenoughvariationintheresponsetoattributeanyvariationtotherandomeffect”•EstimatedGmatrixisnotpositivedefinite:“procedureconvergedtoasolutionswherethevarianceoftherandomeffectis0”AlternativeSolution:• UsetheGMMATpackage(Chenetal.2015)(OnlyrunsonUNIXOS)
47
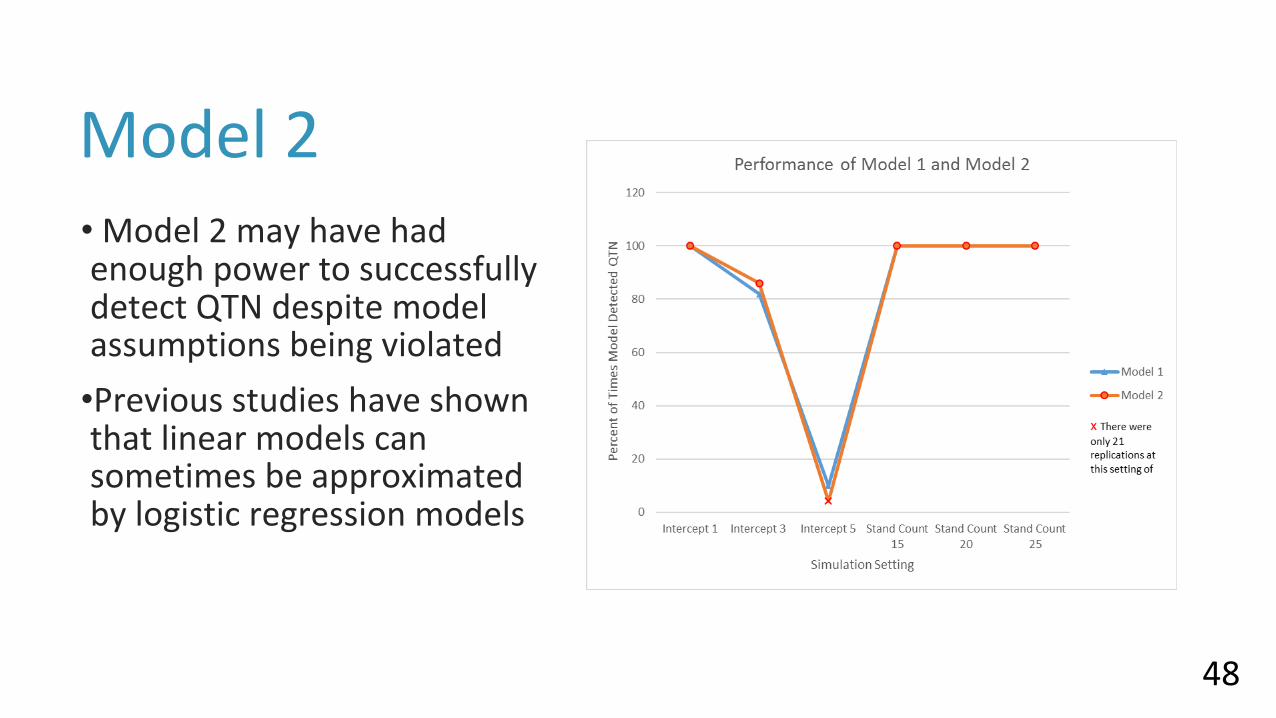
Model2
48
• Model2mayhavehadenoughpowertosuccessfullydetectQTNdespitemodelassumptionsbeingviolated•Previousstudieshaveshownthatlinearmodelscansometimesbeapproximatedbylogisticregressionmodels

Conclusion➢TraditionalGWASrequiresnormaldata
➢Logisticregressionhasthepotentialtoanalyzenon-normallydistributedtraits
➢Thebiggestlimitationofusinglogisticregressionisthecomputationalpower
required
➢ SimulationStudyshowtheneedforincreasedvariabilityofphenotypicdata- this
isespeciallyhardtoachieveinabinarytrait
49

Model1identifiesPeakSNPsWhileAccountingforPopulationStructure
50
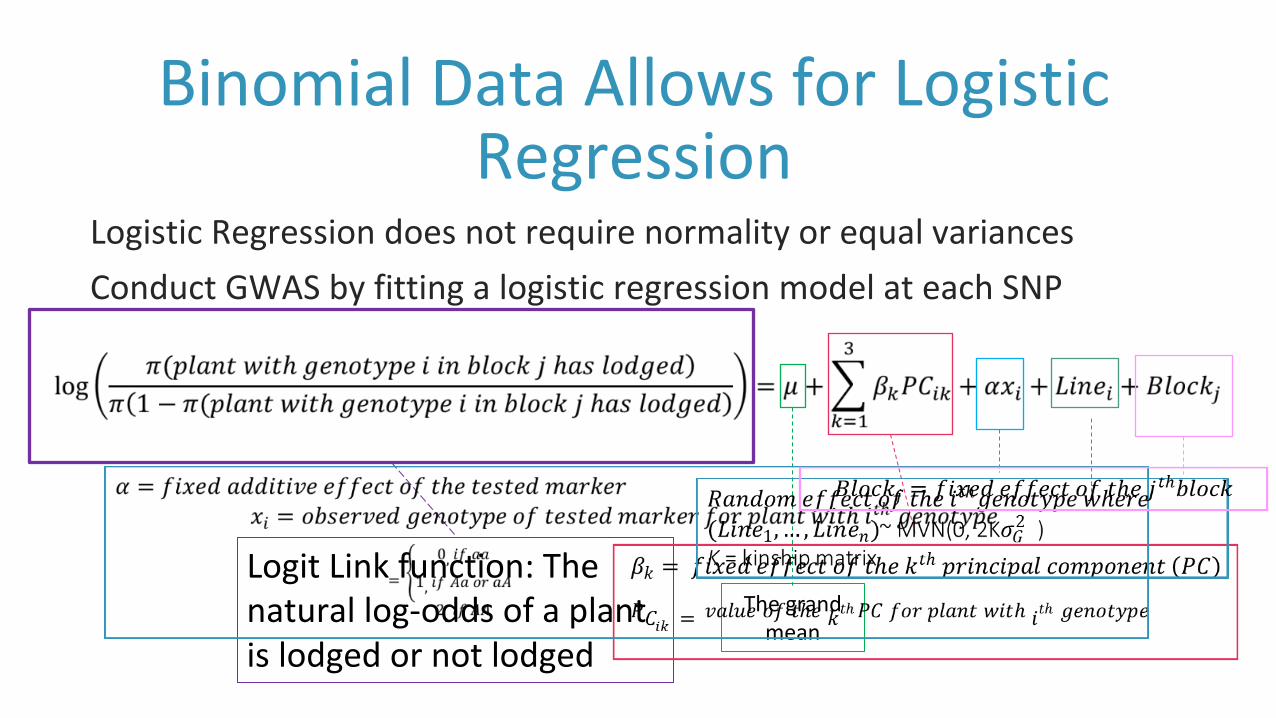
BinomialDataAllowsforLogisticRegression
LogisticRegressiondoesnotrequirenormalityorequalvariancesConductGWASbyfittingalogisticregressionmodelateachSNP
LogitLinkfunction:Thenaturallog-oddsofaplantislodgedornotlodged
Thegrandmean

Model2IdentifiesPeakSNPsWhileControllingforPopulationStructureandRelatedness
52
Phenotype of ithindividual
Grand Mean
Fixed effects: account for population structure
Marker effect
Observed SNP alleles of ith individual
Random effects: account for familial relatedness
Random errorterm
Yu et al. (2006)
Measures relatedness between individuals
AdaptedfromA.Lipka

Model3isFitUsingSubsetofPeakSNPs
53
SAS9.4PROCGLIMMIX
Model3isfitusingtopSNPsfromModel1
Recommendation:NumberofSNPsthatcanberuninapproximately24hours

ResultsofSimulationStudyinContextofStalkLodgingData
• Itispossiblethatourmodel’sabilitytoaccuratelydetectQTLwascompromisedbecauseofanobservedlowrateoflodging• Canwecontrol•Ifthisbaselineprobabilityoccurs,thentheinabilityofourmodeltodetectQTLmayhavebeenexacerbatedbyaninterceptvaluethatisfarremoved0.
54

55
PeakSNPsthatCoincidewithSignalsAssociatedwithRelatedTraits
TypeofRegionidentified
Chr LocationinLiterature LocationinModel3 Notes
Marker 7 159.4Mb 161.9Mb155.8Mb164.9Mb
ThreemostsignificantSNPsonChr7
qRPR2QTL 2 236.4-237.0Mb 236.8Mb 14th mostsignificantSNPonChr2
qRPR3-1QTL 3 181.1Mb-184.7 181.7Mb182.0Mb 92nd and98th mostsignificantSNPOnChr3